Optimization Methods - Mechanical Engineering at IIT …mech.iitm.ac.in/nspch52.pdf · Optimization...
62
1 Optimization Methods
Transcript of Optimization Methods - Mechanical Engineering at IIT …mech.iitm.ac.in/nspch52.pdf · Optimization...

1
Optimization Methods

2
1.0. Introduction:In optimization of a design, the design objective could be simply tominimize the cost of production or to maximize the efficiency ofproduction. An optimization algorithm is a procedure which isexecuted iteratively by comparing various solutions till an optimumor a satisfactory solution is found.
With the advent of computers, optimization has become a part ofcomputer-aided design activities. There are two distinct types ofoptimization algorithms widely used today.
(a) Deterministic Algorithms.They use specific rules for moving one solution to other. Thesealgorithms are in use to suite some times and have beensuccessfully applied for many engineering design problems.

3
(b) Stochastic Algorithms.The stochastic algorithms are in nature with probabilistic
translation rules. These are gaining popularity due to certainproperties which deterministic algorithms do not have.
2.0 Optimal problem formulation:A naive optimal design is achieved by comparing a few
(limited up to ten or so) alternative solutions created by using apriori problem knowledge. In this method feasibility of each designsolution is first investigated. Thereafter an estimate of underlyingobjective (cost, profit, etc., ) of each solution is compared and bestsolution is adopted.
It is impossible to apply single formulation procedure for allengineering design problems, since the objective in a designproblem and associated therefore, design parameters vary productto product different techniques are used in

4
different problems. Purpose of formulation is to create amathematical model of the optimal design problem, which thencan be solved using an optimization algorithm. Figure 1 shows anoutline of the steps usually involved in an optimal designformulation.

5
Design variables:The formulation of an optimization problem begins with
identifying the underlying design variables, which are primarilyvaried during the optimization process. A design problem usuallyinvolves many design parameters, of which some are highlysensitive to the proper working of the design. These parametersare called design variables in the parlance of optimizationprocedures. Other (not so important) design parameters usuallyremain fixed or vary in relation to the design variables.
The first thumb rule of the formulation of an optimization problemis to choose as few design variables as possible. The outcome ofthat optimization procedure may indicate whether to include moredesign variables in a revised formulation or to replace somepreviously considered design variables with new design variables.

6
Constraints:The constraints represent some functional relationships among
the design variables and other design parameters satisfying certainphysical phenomenon and certain resource limitations. The natureand number of constraints to be included in the formulation dependon the user. Constraints may have exact mathematical expressionsor not.
For example, maximum stress is a constraint of a structure. If astructure has regular shape they have an exact mathematicalrelation of maximum stress with dimensions. But incase irregularshape, finite element simulation software may be necessary tocompute the maximum stress.
The following two types of constraints emerge from mostconsiderations:
1. Inequality type constraints.2. Equality type constraints.

7
Inequality constraints state that the functional relationshipsamong variables are either greater than, smaller than or equal to,a resource value.
Example:
The stress σ(x) developed anywhere in a component mustbe smaller than or equal to the allowable strength (Sallowable) ofthe material.
σ(x) ≤ Sallowable
Some constraints may be of greater-than / equal-to type. Forexample, the natural frequency (f(x)) of a system to be greaterthan 2 Hz or by notation f(x) ≥ 2.

8
Equality constraints state that functional relationships shouldexactly match a resource value.
Example:The deflection δ(x) of a point in the component must be exactlyequal to 5 mm. Then δ(x) = 5.
It is very difficult to handle the equality constraints in thealgorithms. In such cases, equality constraint is relaxed byincluding two inequality constraints as given below.
Example:Previously δ(x) = 5
Now it is changed to inequality constraints as given below:
δ(x) ≥ 4,
δ(x) ≤ 6.

9
Objective functions:The next task in the formulation procedure is to find the
objective function in terms of the design variables and otherproblem parameters. The common engineering objectives involveminimization of overall cost of manufacturing or minimization ofoverall weight of a component or maximization of total life of aproduct or others.
Although most of the objectives can be quantified (expressedin mathematical form), there are some objectives (such asaesthetic aspect of a design, ride characteristics of a carsuspension design and reliability of a design) that may not bepossible to formulate mathematically. In such a case anapproximating mathematical expression is used.

10
In real world optimization, there could be more than oneobjective that the designer may want to optimize simultaneously.The multiple objective optimization algorithms are complex andcomputationally expensive. Therefore the most important objectiveis chosen as the objective function and the other objectives areincluded as constraints by restricting their values within a certainrange.
For example, consider optimal truss structure design problem.The designer may be interested in minimizing the overall weight ofthe structure and simultaneously be concerned in minimizing thedeflection of a specific point in the truss. In the optimal problemformulation, the designer may like to use the weight of the truss(as a function of the cross sections of the members) as theobjective function and have a constraint with the deflection of theconcerned point to be less than a specific limit.

11
The objective function can be of two types. Either it is to bemaximized or it has to be minimized. Usually the optimizationalgorithms were written for minimization problems ormaximization problems. Although in some algorithms, someminor structural changes would enable to perform eitherminimization (or) maximization; this requires extensiveknowledge of the algorithm.
The duality principle helps by allowing the same algorithm tobe used for minimization or maximization with a minor change inthe objective function instead of a change in the entire algorithm.If the algorithm is for solving a minimization problem, it can beeasily changed to a maximization problem by multiplying theobjective function by − 1 and vice versa.

12
Variable bounds:The final task of the formulation procedure is to set the
minimum and the maximum bounds on each design variable.Certain optimization algorithms do not require this information. Inthese problems, the constraints completely surround the feasibleregion. Other problems require the search algorithm with in thesebounds.
In general, all N design variables are restricted to lie within theminimum and the maximum bounds as follows.
for i = 1, 2, 3, … N. (1)
In any given problem, the determination of the variablesbounds and may be difficult. One way to remedy this situationis to make a guess about the optimal solution and set the minimumand maximum bounds so that the optimal solution lies within thesetwo bounds
( ) ( )L Ui i ix x x≤ ≤
( )Lix ( )U
ix

13
If any design variable corresponding to the optimal solution isfound to lie on or near the minimum or maximum bound, thechosen bound may be adjusted and optimization algorithm may besimulated again.After the above four tasks are completed, the optimization problemcan be mathematically written in a special format, known asnonlinear programming (NLP) format.General format:
Denoting the design variables as a column vector x = (x1, x2…xN)T
-, the objective function as a scalar quantity f(x), J inequalityconstraints as gj(x) ≥ 0 and K equality constraints as hk(x) = 0, wewrite the NLP problem:
Minimize f(x) Subject to,gj(x) ≥ 0 j = 1, 2, 3, …….J;hk(x) = 0 k = 1, 2, 3, …….K;
i = 1, 2, 3, … N.( ) ( )L Ui i ix x x≤ ≤
14
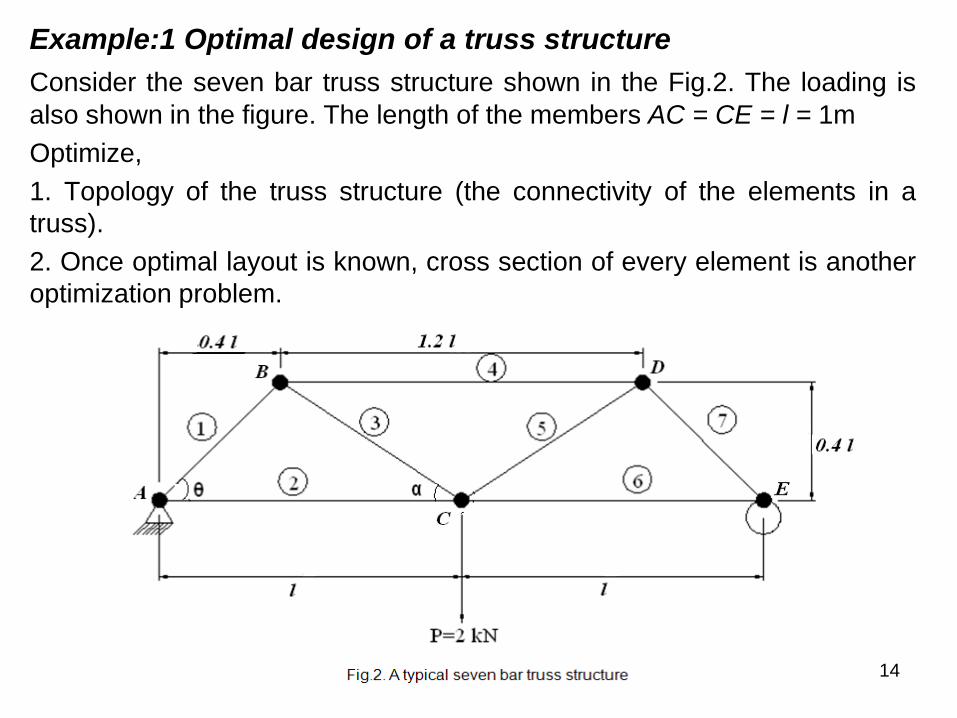
Example:1 Optimal design of a truss structureConsider the seven bar truss structure shown in the Fig.2. The loading isalso shown in the figure. The length of the members AC = CE = l = 1mOptimize,1. Topology of the truss structure (the connectivity of the elements in atruss).2. Once optimal layout is known, cross section of every element is anotheroptimization problem.

15
Since connectivity of truss is given, the cross-sectional area andmaterial properties of the members are the design parameters.We choose cross sectional area of the members as the designvariables. Using the symmetry of the truss,
A7 = A1; A6 = A2; A3 = A5
Thus, there are practically four design variables (A1 to A4).
Formulation of the constraints:The truss carry the given load P = 2 kN , the tensile and
compressive stress generated in each member must not be morethan the corresponding allowable strength Syt and Syc of thematerial.
Let us assume, Syt = Syc = 500 MPa and modulus of elasticityE = 200 GPa. Axial forces in each members of the truss are

16
Member AB – 0.5 Pcsc θ; Member BC + 0.5 Pcsc α;Member AC + 0.5 Pcot θ; Member BD – 0.5 P(cot θ + cot α);
Now, the axial stress can be calculated by dividing the axialload by the cross-sectional area of that member. Thus, the first setof constraints can be written as
1
csc ,2 yc
P SAθ≤
2
cot ,2 yt
P SAθ≤
3
csc ,2 yt
P SAα≤
4
(cot cot ) .2 ycP SA
θ α+ ≤
⇒
⇒ ⇒
⇒
17
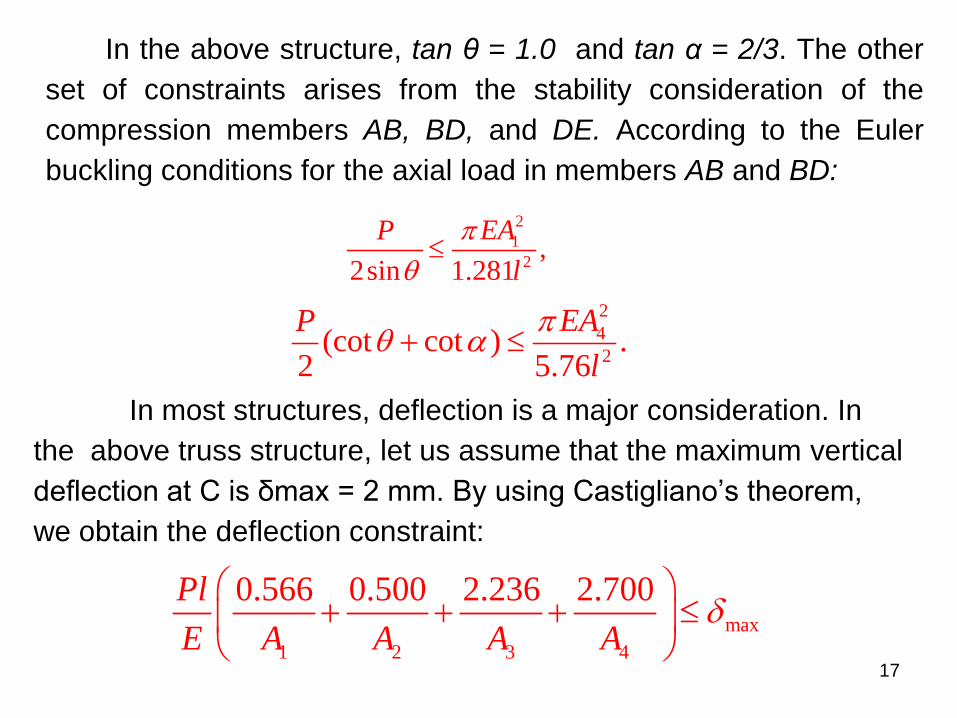
In most structures, deflection is a major consideration. In the above truss structure, let us assume that the maximum vertical deflection at C is δmax = 2 mm. By using Castigliano’s theorem, we obtain the deflection constraint:
In the above structure, tan θ = 1.0 and tan α = 2/3. The otherset of constraints arises from the stability consideration of thecompression members AB, BD, and DE. According to the Eulerbuckling conditions for the axial load in members AB and BD:
21
2 ,2sin 1.281
EAPl
πθ≤
242(cot cot ) .
2 5.76EAP
lπθ α+ ≤
max1 2 3 4
0.566 0.500 2.236 2.700PlE A A A A
δ
+ + + ≤

18
In this problem, we are interested in minimizing the weight ofthe truss structure. Since we assumed the same material for allmembers, the minimization of the total volume of material will yieldthe same optimal solution as the minimization of the total weight.Thus, we write the objective function as
The next task is to set lower and upper bounds for the four crosssectional areas. We may choose to make all four areas lie between10 and 500 mm2. Thus the variable bounds are as
In the following, we present the above truss structure problem inNLP format.
1 2 3 41.132 2 1.789 1.2Minimize A l A l A l A l+ + +

19
Subject to
1 2 3 41.132 2 1.789 1.2Minimize A l A l A l A l+ + +
4
(cot cot ) 0,2ycPSA
θ α− + ≥
,0sin2 1
≥−θA
PS yc
,0cot2 2
≥−θA
PS yt
,0sin2 3
≥−αA
PS yt

20
21
2 0,1.281 2sin
EA Pl
πθ
− ≥
242 (cot cot ) 0,
5.76 2EA P
lπ θ α− + ≥
max1 2 3 4
0.566 0.500 2.236 2.700 0,PlE A A A A
δ
− + + + ≥

21
Example: 2 Optimal design of a car suspension
Fig.4. A two-dimensional model of a car suspension system
The comfort in riding a car largely depends on the suspensioncharacteristics. The car body is usually supported by asuspension coil spring and a damper at each wheel (Figure 4). Inorder to formulate the optimal design problem, the first task is toidentify the important design variables.

22
Sprung mass ms, Front coil stiffness kfs,Front unsprung mass mfu, Rear coil stiffness krs,Rear unsprung mass mru, Front tyre stiffness kft,Rear damper coefficient αr Rear tyre stiffness krt,Front damper coefficient Axle-to-axle distance l,Polar moment of inertia of the car J,
As long time is taken for the convergence of the optimizationwith all parameters as design variables, only four importantparameters-front coil stiffness kfs, rear coil stiffness krs, frontdamper coefficient , and rear damper coefficient αr areconsidered as design variables. Other design parameters are keptconstant:ms = 1000 kg l = 3.2 mmfu = 70 kg l1 = 1.6 mmru = 150 kg l2 = 1.6 mkft = 20 kg/mm J = 550 kg-m2
krt = 20 kg/mm
fα
fα

23
Using these parameters, differential equations governing thevertical motion of the unsprung mass at the front axle (q1), thesprung mass (q2), and the unsprung mass at the rear axle (q4), andthe angular motion of the sprung mass (q3) are written (Fig. 5):
Fig.5. The dynamic model of the car suspension system. The above model has four degrees-of-freedom (q1 to q4)

24
(9)
(10)
(11)
(12)
Where the forces F1 to F6 are calculated as follows:
(13)
The parameters d1, d2, d3, and d4 are the relative deformations inthe front tyre, the front spring, the rear tyre, and the rear springrespectively. Figure 5 shows all the four degrees of freedom of theabove system (q1 to q4). The relative deformations in springs andtyres can be written as follows:
21 1 2 2 3
44 4 5 6 3
, , ,
, , .
ft fs f
rs r rt
F k d F k d F d
F k d F d F k d
α
α
= = =
= = =

25
(14)
The time varying functions f1(t) and f2(t) are road irregularitiesas functions of time. Any function can be used for f1(t). Forexample, a bump can be modeled as f1(t) = A sin , where A isthe amplitude of the bump and T is the time required to cross thebump. When a car is moving forward, the front wheel experiencesthe bump first, while the rear wheel experiences the same bump alittle later, depending upon the speed of the car. Thus, the functionf2(t) can be written as f2(t) = f1( t − l/v), where l is the axle-to-axledistance and ν is the speed of the car. For the above bump, f2(t) =A sin( (t−l/v)/T).
1 1 1
2 2 1 3 1
3 4 2
4 2 2 3 4
( ),,
( ),.
d q f td q l q qd q f td q l q q
= −= + −= −= − −
/t Tπ
π

26
The coupled differential equations specified in equations (9) to (12)can be solved using a numerical integration technique (for example,a fourth-order Runge-Kutta method can be used) to obtain thepitching and bouncing dynamics of the sprung mass ms. Equationscan be integrated for a time range from zero to tmax.
After the design variables are chosen, the next task is toformulate the constraints associated with the above car suspensionproblem. In order to simplify the problem, we consider only oneconstraint. The jerk (the rate of change of the vertical accelerationof the sprung mass) is a major factor concerning the comfort of theriding passengers. The guideline used in car industries suggeststhat the maximum jerk experienced by the passengers should notbe more than about 18 m/s3. Mathematically,
'''2max q (t) 18≤

27
When the four coupled differential equations (9) to (12) are solved,the above constraint can be computed by numerically differentiatingthe vertical movement of the sprung mass (q2) thrice with respect totime.
The next task is to formulate the objective function. In this problem,the primary objective is to minimize the transmissibility factor whichis calculated as the ratio of the bouncing amplitude q2(t) of thesprung mass to the road excitation amplitude A. Thus, we write theobjective function as
The above objective function can be calculated from the solution ofthe four differential equations mentioned earlier. A minimum value ofthe transmissibility factor suggests the minimum transmission of roadvibration to the passengers. This factor is also directly related to theride characteristics as specified by the ISO standard.
2max abs q (t)MinimizeA

28
Thus, the optimized design of the above car suspension systemwould provide the minimum transmissibility of the road vibration tothe passengers with a limited level of jerk.Finally, a minimum and maximum limit for each design variable canbe set. This may require some previous experience with a carsuspension design, but the following limits for the above car mayinclude the optimal solution:
Thus, the above optimal car suspension design problem can bewritten in NLP form as follows:
Subject to
0 , 2 / ,
0 , 300 /( / ).fs rs
f r
k k kg mmkg m sα α
≤ ≤
≤ ≤
2max abs q (t)MinimizeA
0,0 , 2,
0 , 300.
'''2
fs rs
f r
18 - max q (t)k kα α
≥≤ ≤
≤ ≤

29
Example: 3 Optimal design of a transit schedule
Fig. 2
Figure 2 shows a typical transit system network. The solid linesrepresent different routes, the points on the lines represent thestops and the circled intersections of the routes represent thetransfer stations. The problem is to determine schedules for theroutes such that the transit system provides the best Level ofService (LOS) to its passengers, within the resources available.
30
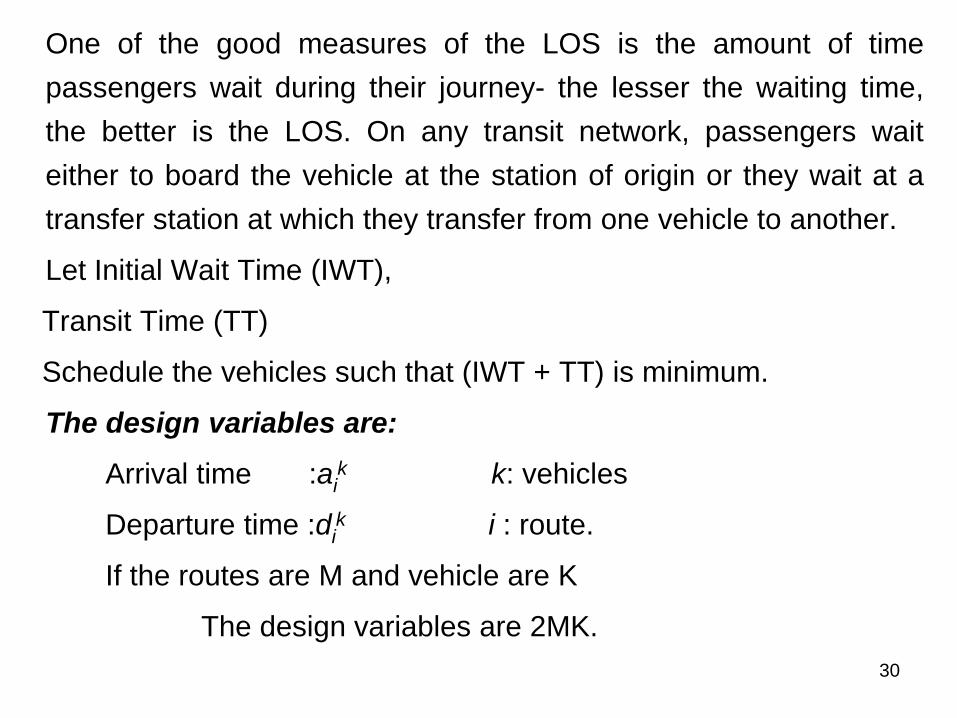
One of the good measures of the LOS is the amount of timepassengers wait during their journey- the lesser the waiting time,the better is the LOS. On any transit network, passengers waiteither to board the vehicle at the station of origin or they wait at atransfer station at which they transfer from one vehicle to another.
Let Initial Wait Time (IWT),
Transit Time (TT)
Schedule the vehicles such that (IWT + TT) is minimum.
The design variables are:
Arrival time :aik k: vehicles
Departure time :dik i : route.
If the routes are M and vehicle are K
The design variables are 2MK.

31
Minimum stopping time:(di
k − aik) ≥ smin for all i and k (1)
Maximum stopping time:(di
k − aik) ≤ smax for all i and k (2)
Maximum allowable transfer time:No passenger on the transit network should have to wait more
than a certain period of time T at any transfer station. This can beenforced by checking all possible differences between departureand arrival times and limiting those values to T. This constraint canbe formulated by introducing a new set of variables betweenthe k-th vehicle of the i-th route and the l-th vehicle of the j-throute.
These variables can take either a zero or one. A value of zeromeans that the transfer of passengers between those two vehiclesis not feasible. A value of one means otherwise.
,,k li jδ
32
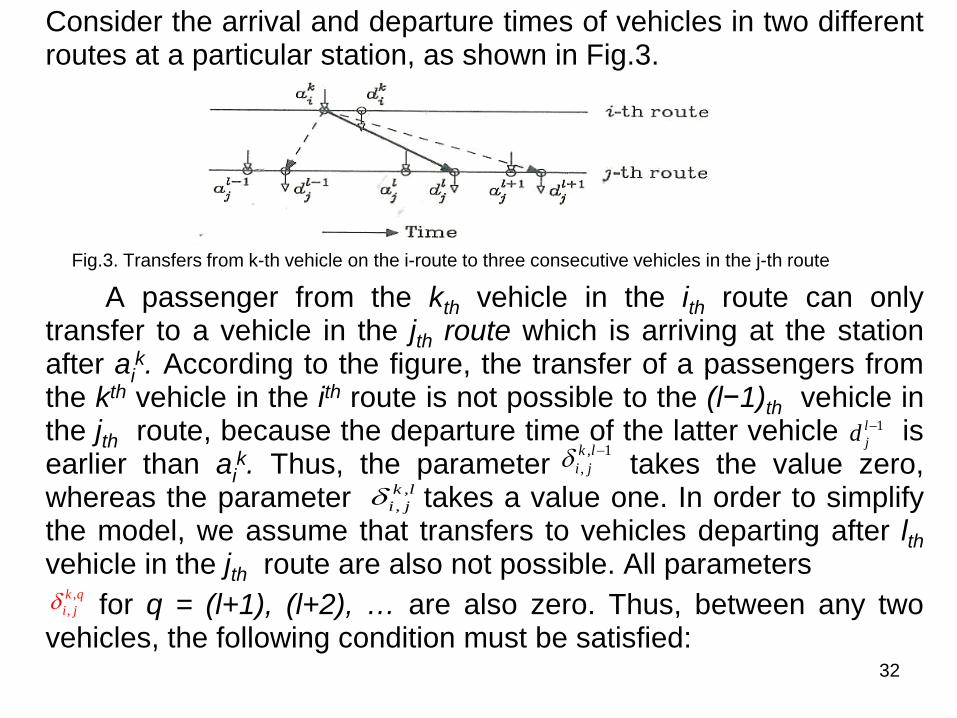
Consider the arrival and departure times of vehicles in two differentroutes at a particular station, as shown in Fig.3.
Fig.3. Transfers from k-th vehicle on the i-route to three consecutive vehicles in the j-th route
A passenger from the kth vehicle in the ith route can onlytransfer to a vehicle in the jth route which is arriving at the stationafter ai
k. According to the figure, the transfer of a passengers fromthe kth vehicle in the ith route is not possible to the (l−1)th vehicle inthe jth route, because the departure time of the latter vehicle isearlier than ai
k. Thus, the parameter takes the value zero,whereas the parameter takes a value one. In order to simplifythe model, we assume that transfers to vehicles departing after lthvehicle in the jth route are also not possible. All parameters
for q = (l+1), (l+2), … are also zero. Thus, between any twovehicles, the following condition must be satisfied:
,,k qi jδ
1ljd −
, 1,k li jδ −
,,k li jδ

33
for all i, j, k and l. (3) The left side expression of the above condition is zero for thosetransfers that are not feasible. Since transfers only to the nextavailable vehicle are assumed, only one for (l = 1, 2, …) is oneand the rest all are zeros for fixed values of i, j, and k.Mathematically,
for all i, j and k. (4)
The introduction of the artificial variables makes the formulationeasier, but causes a difficulty. Many optimization algorithms cannothandle discrete design variables efficiently. Since the artificialdesign variables can only take a zero or one, another set ofconstraints is added to enforce the binary values:
for all i, j, k and l. (5)
,,( )l k k l
j i i jd a Tδ− ≤
,, 1k l
i jlδ =∑
,,( ) (1 ) 0l k k l
j i i jd a M δ− + − ≥
,,k li jδ
,,k li jδ
,,k li jδ

34
Where M is a large positive number. The above constraint ensuresthat the variable always takes a value one whenever a transferis possible and the value zero whenever transfer is not possible.
Maximum headway:
The headway between two consecutive vehicles should beless than or equal to the policy headway, hi, or
for all i, and k.
The objective function consists of two terms: the first termrepresents the total transfer time (TT) over all the passengers andthe second term represents the initial waiting time (IWT) for all thepassengers. The objective is to minimize the following function:
(6)
,,k li jδ
1( )k ki i ia a h+ − ≤
1. 1
, , ,0( ) ( )[( ) ]
k ki ia ak l l k k k k
i j j i i j i k i ii j k l i l
d a w v t a a t dtδ−− −− + − −∑∑∑∑ ∑∑∫

35
The parameter is the number of passengers transferring from thek-th vehicle of the i-th route to the j-th route. The first term isobtained by summing the individual transfer time over allpassengers for all the vehicles for every pair of routes.Theparameter vi,k(t) is the number of passengers arriving at the stop forthe k-th vehicle in the i-th route at a given time t.Since the arrivaltimefor passengers can be anywhere between (theheadway), the initial waiting time also differs from one passenger toanother.
For example, a passenger arriving at the stop just after the previousvehicle has left has to wait for the full headway timebefore the next vehicle arrives. On the other hand, a passengerarriving at the stop later has to wait for a shorter time. Thecalculation of the second term assumes that passengers arrive atthe stop during the time interval
,ki jw
( )l kj id a−
10 ( )k ki it to t a a −= = −
1( )k ki ia a −−
1k ki ia to a−

36
according to the known time-varying function vi,k(t), where t ismeasured from .Then the quantity
(7)
gives the sum of the initial waiting times for all passengers whoboard the k-th vehicle of the i-th route. We then sum it over all theroutes and vehicles to estimate the network total of the IWT. Thus,the complete NLP problem can be written as follows:
Minimize
(8)
1kia −
11
,0( )[( ) ]
k ki ia a k k
i k i iv t a a t dt−− −− −∫
1. 1
, , ,0( ) ( )[( ) ]
k ki ia ak l l k k k k
i j j i i j i k i ii j k l i l
d a w v t a a t dtδ−− −− + − −∑∑∑∑ ∑∑∫
37
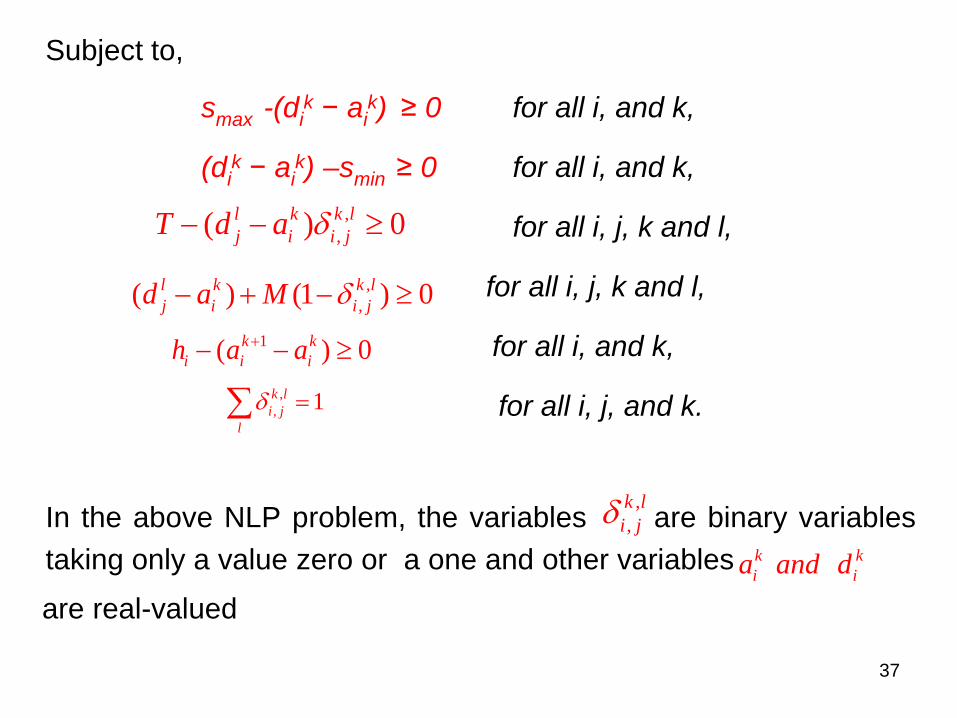
Subject to,
smax -(dik − ai
k) ≥ 0 for all i, and k,
(dik − ai
k) –smin ≥ 0 for all i, and k,
for all i, j, k and l,
for all i, j, k and l,
for all i, and k,
for all i, j, and k.
In the above NLP problem, the variables are binary variablestaking only a value zero or a one and other variables
are real-valued
,,( ) 0l k k l
j i i jT d a δ− − ≥
,,( ) (1 ) 0l k k l
j i i jd a M δ− + − ≥1( ) 0k k
i i ih a a+− − ≥,
, 1k li j
lδ =∑
,,k li jδ
k ki ia and d

38
3. Optimization AlgorithmsThe formulation of engineering design problems differ from problem
to problem. They are(i) Linear terms for constraints and objective function(ii) Non linear terms for constraints and objective function.
The terms are not explicit functions of the design variables. Nosingle optimization algorithm which will work in all optimizationproblems equals efficiently.
For the sake of clarity, the optimization algorithms areclassified into a number of groups, which are now brieflydiscussed.
(a) Single-variable optimization algorithms.These algorithms are classified into two categories
i. Direct methodsii. Gradient based methods
39
Direct methods do not use any derivative information of theobjective function; only objective function values are used to guidethe search process. However, gradient-based methods usederivative information (first and/ or second order) to guide thesearch process.
Although engineering optimization problems usually containmore than one variable, single-variable optimization algorithms aremainly used as unidirectional search methods in multivariableoptimization algorithms.
(b) Multi- variable optimization algorithms.These algorithms demonstrate how the search for the optimumpoint progresses in multiple dimensions. Depending on whetherthe gradient information is used or not used, these algorithms arealso classified into direct and gradient-based techniques.

40
(c) Constrained optimization algorithms.These algorithms use the single variable and multivariableoptimization algorithms repeatedly and simultaneously maintain thesearch effort inside the feasible search region. These algorithms aremostly used in engineering optimization problems.(d) Specialized optimization algorithms.Two of these algorithms - integer programming and geometricprogramming - are often used in engineering design problems.Integer programming methods can solve optimization problems withinteger design variables. Geometric programming methods solveoptimization problems with objective functions and constraintswritten in a special form.(e) Non-traditional optimization algorithms.There are two algorithms which are nontraditional, these are:
a) Genetic algorithmsb) Simulated annealing.

41
4.0 Single-variable optimization algorithmsThe algorithms described in this section can be used to solveminimization problems of the following type:
Minimize f(x)Where f(x) is the objective function and x is a real variable. The
purpose of an optimization algorithm is to find a solution x, for whichthe function f(x) is minimum.4.1 Optimality criteriaThere are three different types of optimal points are:(i) Local Optimal point:A point or solution x* is said to be a local optimal point, if no point inthe neighbourhood has a function value smaller than f(x*).(ii) Global Optimal point:A point or solution x** is said to be a global optimal point, if no point inthe entire search space has a function value smaller than f(x**).

42
(iii) Inflection point:x* is an inflection point iff(x*) increases locally as x* increases & decreases locally as
x* reducesor f(x*) decreases locally as x* increases and increases
locally as x* decreasesLet the objective function f(x) is the chosen search space
f '(x) and f ''(x) are first and second derivativesA point x is a minimum if f'(x) = 0 & f''(x) > 0.
If f ‘(x) = 0, the point is either a minimum, a maximum or aninflection point
Suppose at point x*, the first derivative is zero and the firstnon-zero higher order derivative is denoted by n, then
• If n is odd, x* is an inflection point• If n is even, x* is a local optimum
(i) If the derivative is +ve, x* is a local minimum(ii) If the derivative is –ve, x* is a local maximum

43
Example: 4Consider f (x) = x3, optimal point x = 0 as shown in Fig.6.
Fig.6. The function f(x) = x3
From the figure, we can see that point x = 0 is an inflection point asf(x) increases for x ≥ 0
decreases for x ≤ 0Using the sufficient conditions
Third derivative, n =3 is odd, hence x = 0 is an inflection point.
20
0
0
'( 0) 3 0
''( 0) 6 0
'''( 0) 6 6( )
x
x
x
f x x
f x x
f x Nonzero value
=
=
=
= = =
= = =
= = =

44
Example : 5Consider f(x) = x4, optimal point x = 0 as shown in Fig.6a.
Fig.6a. The function f(x) = x4
From the figure, we can see that the point x = 0 is a minimal point.Using sufficient conditions

45
30
20
0
0
'( 0) 4 0
''( 0) 12 0
'''( 0) 24 0
''''( 0) 24 24( )
x
x
x
x
f x x
f x x
f x x
f x Nonzero value
=
=
=
=
= = =
= = =
= = =
= = =
Fourth order derivative is positive, n = 4 is even, hence x = 0 is a local minimum point.

46
4.2 Bracketing Methods:The minimum of a function is found in two phases. Initially an
approximate method is used to find a lower and an upper bound ofthe minimum. Next, a sophisticated technique is used to searchwithin these two limits to find the optimal solution.
(a) Exhaustive search methodIt is the simplest of all search methods. The optimum of a
function is bracketed by calculating the function values at anumber of equally spaced points(Fig.7).
Fig.7 The exhaustive search method that uses equally spaced points

47
Usually the search begin from a lower bound on the variable andthree consecutive function values are compared at a time based onthe assumption of unimodality of the function. Based on theoutcome of comparison, the search is either terminated orcontinued by replacing one of the three points with a new point.Algorithm:Step 1.Set
(n is number of intermediate points)
Step 2If the minimum point lies between
Hence, terminate.Else
1 , ( ) /x a x b a n= ∆ = −
2 1 3 2, x x x x x x= + ∆ = + ∆
1 2 3( ) ( ) ( ),f x f x f x≥ ≤ 1 3( , ).x x
1 2 2 3 3 2, , x x x x x x x= = = + ∆

48
Step 3Is If yes, goto Step 2.Else no minimum exists in (a,b) or a boundary point (a or b) is the
minimum point.Example:6Minimize f(x) = x2 + 54/x in the interval (0,5)A plot of function is shown in Fig.8
Fig.8 The unimodal, single-variable function used in the exercise problems.
3 ?x b≤

49
The plot shows that the minimum lies at x =3
According to sufficiency conditions, x =3 is a local minimum.Now consider n = 10 for exhaustive search.Step 1According to the parameter chosen,
'
''
(3) 27(3) 0(3) 6
fff
=
=
=
1
2
3
0 5
(5 0) /10 0.5
0 0.5 0.5
0.5 0.5 1.0
x a and b
x
x
x
= = =
∴∆ = − =
= + =
= + =
We set
and

50
Step 2 Computing function values at various points, we have
Thus, the minimum does not lie between (0,1)
and minimum does not lie between (0.5,1.5) Repeat the process till
Solution lies between (2.5, 3.5).The accuracy solutionIf more accurate solution is required, divide into more number of parts by
increasing n.
1 2 3
(0) . (0.5) 108.25 (1.0) 55.00( ) ( ) ( )
f f ff x f x f x
= ∞ = => >
1 2 30.5 , 1.0, 1.5Set x x x∴ = = =
(1.5) 38.25f =
1 2 3( ) ( ) ( )f x f x f x> >
(2.5) 27.85(3.0) 27.00(3.5) 27.68
fff
===
1 2 3( ) ( ) ( )f x f x f x> <
2( ) / 2(5 0) /10 1.0a b n− = − =

51
(b) Bounding phase methodStep 1
Choose an initial guess and an increment Set k =0
Step 2
If then
then
Else goto Step 1
Step 3
Set
Step 4
If set k = k+1 and goto Step 3
Else, the minimum lies in the interval and terminateIf is large, accuracy is poor.
(0)x .∆
0 0 0( ) ( ) ( ),f x x f x f x x− ∆ ≥ ≥ + ∆ is ve∆ +
0 0 0( ) ( ) ( ),f x x f x f x x− ∆ ≤ ≤ + ∆ is ve∆ −
( 1) ( ) 2 .k k kx x+ = + ∆
( 1) ( )( ) ( ),k kf x f x+ <
( 1) ( 1)( , )k kx x− +
∆

52
Example 7Find minimum of using bounding phase method
1. Choose an initial guess and increment set k = 0.
2. Calculate three function values
We observe that
3. Next guess:
4. ... set k = 1 and goto Step 3
2 54( )f x xx
= +
(0) 0.6x = 0.5∆ =
(0)
(0)
(0)
( ) (0.6 0.5) 540.010
( ) (0.6) 90.360
( ) (0.6 0.5) 50.301
(0.1) (0.6) (1.1) 0.5
f x f
f x f
f x f
f f f set
− ∆ = − =
= =
+ ∆ = + =
> > ∴ ∆ = +
(1) (0) 02 1.1x x= + ∆ =
(1) (0)( ) 50.301 ( )f x f x= <

53
3. Next guess:4. ... set k = 2 and goto Step 3
3. Next guess:4. ... set k = 3 and goto Step3.
3. Next guess:4. Thus terminate with interval (2.1, 8.1)
with the obtained bracketing is poor. Functions evaluatedare 7.
the obtained interval is (1.623, 4.695). Functionsevaluated are 15.
(2) (1) 12 1.1 2(0.5) 2.1x x= + ∆ = + =(2) 1( ) 30.124 ( )f x f x= <
(3) (2)( ) 29.981 ( )f x f x= <
(3) (2) 22 2.1 4(0.5) 4.1x x= + ∆ = + =
(4) (3)( ) 72.277 ( ).f x f x= >
0.5,∆ =
0.001,∆ =

54
4.3. Region elimination methods:Once the minimum point is bracketed, a more sophisticated algorithm is used toimprove the accuracy of the solution. Region elimination methods are used forthis purpose. The fundamental rule for region elimination method is as follows:
Fig.9. A typical single-variable unimodal function with function values at two distinct points
Consider a unimodal function drawn in Fig.9. The two points x1 and x2 lie in theinterval (a,b) and satisfy x1 < x2. For minimization, the following conditions apply
• If then the minimum does not lie in (a, x1)
• If then the minimum does not lie in (x2, b)
• If then the minimum does not lie in (a, x1) and (x2, b)
1 2( ) ( )f x f x>
1 2( ) ( )f x f x<
1 2( ) ( )f x f x=

55
(a) Interval halving method:
Fig.10 Three points x1, xm, and x2 used in the interval halving
Fig.10 shows a region in the interval (a, b). Three points divide thesearch space into four regions. The fundamental rule for regionelimination is used to eliminate a portion of search space based onfunction values at three chosen points.x1, xm, x2 are three search points. Two of the function values arecompared at a time and some region is eliminated. The threepossibilities are
(i) If minimum cannot lie beyond xm and reduce theinterval from (a, b) to (a, xm) search space is reduced by 50percent.
1( ) ( )mf x f x<

56
(ii) If , minimum cannot lie in the interval (a, x1).Thepoint x1 is ¼ in search space, hence reduction is 25 percent.Then compare and to eliminate further 25 percent of searchspace. Continue the process till small enough interval is found.Algorithm:
1. Choose lower bound a and upper bound b and a small valuefor desired accuracy. Compute
2. Set Compute and3. If set Goto Step 5, else goto Step 44. If set Goto Step 5, else goto
Step 55. Calculate L = . If terminate. Else goto step 2.
1( ) ( )mf x f x>
∈ 0( ) / 2, .mx a b L L b a= + = = − ( )mf x
1 2, .4 4L Lx a x b= + = − 1( )f x 2( )f x
1( ) ( ),mf x f x<1, .m mb x x x= =
2( ) ( ),mf x f x<2, .m ma x x x= =
1 2, ;a x b x= =
b a− ,L <∈

57
(a) Fibonacci search method:The search interval is reduced according to Fibonacci numbers.
where n=2,3,4,….. and
Fig.11. Fibonacci search points(x1 and x2)
Algorithm:1. Choose a lower bound a and an upper bound b. Set L = b-a.
Assume the desired number of function evaluations to be n. Setk=2
2. Compute Set and
1 2n n nF F F− −= + 0 1 1F F= =
1 1* ( )n k nL F F Lk − + += 1
*x a L k= + 2*x b L k= −

58
3. Compute one of which was not evaluated earlier.Use the fundamental region elimination rule to eliminate a region.Set new a and b.4. Is k = n? If no, set k = k+1 and goto Step 2. Else terminate.( c ) Golden section search methodDifficulties with Fibonacci search method:
(i) Fibonacci numbers have to be calculated and stored.(ii) At every iteration the proportion of the eliminated region is not
the same.In golden section search method, the search space (a,
b) is first linearly mapped to a unit interval search space (0,1).Two points at from either end of search space are chosen sothat at every iteration the eliminated region is to that in theprevious iteration (Fig.12). This can be achieved by equating
This yields the golden number
1 2( ) ( ) ,f x o r f x
τ(1 )τ−
0.618τ =

59
Fig.12. The points (x1 and x2) used in the golden section
Algorithm:1. Choose a lower bound a and an upper bound b. Choose a small
value .Normalize the variable x by using the equation Thus , Set k=1.
2. Set and Compute depending on whichever of the two was not evaluated earlier. Use the fundamental region elimination rule to eliminate a region. Set new
3. Is If no, set k=k+1, go to Step 2. Else terminate.
∈ ( ) .( )x aw b a−= −
0, 1, 1.w w wa b and L= = =
1 (0.618)w ww a L= + 2 (0.618) .w ww b L= − 1 2( ) ( ) ,f w o r f w
and w wa b?wL <∈

60
4.4 Gradient based methods Despite the difficulty of finding the derivatives, they are popular because of their effectiveness.
(a) Newton- Raphson method
Considering Taylor series expansion
Algorithm:
1. Choose initial guess and small value Set k = 1.Compute
2. Compute
3. Calculate Compute
4. If Terminate. Else k = k+1 and go to Step 2.
Convergence will depend on initial guess value and nature of the objective function.
( )( 1) ( )
( )
'( )''( )
nn n
n
f xx xf x
+ = −
(1)x .∈(1)'( ).f x
( )''( ).kf x( )
( 1) ( )( )
'( )''( )
kk k
k
f xx xf x
+ = −
( 1)'( ).kf x +
( 1)'( ) ,kf x + <∈

61
Example 8Minimize using Newton-Raphson method.1. Choose initial guess and
is parameter, usually taken a small value (0.001).
2 54( )f x xx
= +(1) 1.x = 310 , 1k−∈= =
( ) ( ) ( ) ( )( )
( )
( ) ( ) ( ) ( ) ( )( )
( ) 2
( ) ( )'( )2
( ) 2 ( ) ( )''( )( )
n n n nn
n
n n n n nn
n
f x x f x xf xx
f x x f x f x xf xx
+ ∆ − −∆=
∆+ ∆ − + −∆
=∆
( )nx∆( )'( ) 52.005nf x = −
( )''( ) 110.011nf x =

62
2.
The iterative values of x, for various k’s are tabulated below.
f ' is small enough to terminate.
(1)
(1)
'( )(2) (1)''( )
52.0051 1.473110.011
f xx xf x
= −
− = − =
( )kx ( )'( )kf x( )''( )kf xk
1 1 -52.005 110.011
2 1.473 -21.944 35.796
3 2.086 -8.239 13.899
42.679 -2.167
-
7 3.0001 -4(10)-8