Optimization and Evaluation of the In Vitro Permeation ...
18
pharmaceutics Article Optimization and Evaluation of the In Vitro Permeation Parameters of Topical Products with Non-Steroidal Anti-Inflammatory Drugs through Strat-M ® Membrane Bartlomiej Milanowski 1,2, * , Hanna Wosicka-Fr ˛ ackowiak 1,2 , Eliza Glówka 1,2,† , Malgorzata Sosnowska 2 , Stanislaw Wo´ zny 2 , Filip Stachowiak 2 , Angelika Suchenek 3 and Dariusz Wilkowski 3 Citation: Milanowski, B.; Wosicka-Fr ˛ ackowiak, H.; Glówka, E.; Sosnowska, M.; Wo´ zny, S.; Stachowiak, F.; Suchenek, A.; Wilkowski, D. Optimization and Evaluation of the In Vitro Permeation Parameters of Topical Products with Non-Steroidal Anti-Inflammatory Drugs through Strat-M ® Membrane. Pharmaceutics 2021, 13, 1305. https://doi.org/ 10.3390/pharmaceutics13081305 Academic Editors: Jaehwi Lee and Heather Benson Received: 30 June 2021 Accepted: 17 August 2021 Published: 20 August 2021 Publisher’s Note: MDPI stays neutral with regard to jurisdictional claims in published maps and institutional affil- iations. Copyright: © 2021 by the authors. Licensee MDPI, Basel, Switzerland. This article is an open access article distributed under the terms and conditions of the Creative Commons Attribution (CC BY) license (https:// creativecommons.org/licenses/by/ 4.0/). 1 Chair and Department of Pharmaceutical Technology, Poznan University of Medical Sciences, ul. Grunwaldzka 6, 60-780 Pozna ´ n, Poland; [email protected] 2 GENERICA Pharmaceutical Lab, Regionalne Centrum Zdrowia Sp. z o. o., ul. Na K˛ epie 3, 64-360 Zb ˛ aszy ´ n, Poland; [email protected] (M.S.); [email protected] (S.W.); [email protected] (F.S.) 3 MYLAN Healthcare Sp. z o. o., ul. Post˛ epu 21B, 02-676 Warszawa, Poland; [email protected] (A.S.); [email protected] (D.W.) * Correspondence: [email protected] or [email protected]; Tel.: +48-061-854-66-59 † Dr. Glówka passed away on 17 December 2020. Abstract: Pharmaceutical products containing non-steroidal anti-inflammatory drugs (NSAIDs) are among the most prescribed topical formulations used for analgesic and antirheumatic properties. These drugs must overcome the skin barrier to cause a therapeutic effect. Human skin has been widely used as a model to study in vitro drug diffusion and permeation, however, it suffers from many limitations. Therefore, to perform in vitro permeation test (IVPT), we used a Strat-M ® membrane with diffusion characteristics well-correlated to human skin. This study’s objective was to optimize the IVPT conditions using Plackett–Burman experimental design for bio-predictive evaluation of the in vitro permeation rates of five non-steroidal anti-inflammatory drugs (diclofenac, etofenamate, ibuprofen, ketoprofen, naproxen) across Strat-M ® membrane from commercial topical formulations. The Plackett–Burman factorial design was used to screen the effect of seven factors in eight runs with one additional center point. This tool allowed us to set the sensitive and discriminative IVPT final conditions that can appropriately characterize the NSAIDs formulations. The permeation rate of etofenamate (ETF) across the Strat-M ® membrane was 1.7–14.8 times faster than other NSAIDs from selected semisolids but 1.6 times slower than the ETF spray formulation. Keywords: Strat-M ® membrane; in vitro permeation test; Plackett–Burman design; etofenamate; diclofenac; ibuprofen; ketoprofen; naproxen 1. Introduction Non-steroidal anti-inflammatory drugs (NSAIDs), such as diclofenac diethylamine (DEA) or sodium (DNa), etofenamate (ETF), ibuprofen (IBP), ketoprofen (KTP), and naproxen (NPX), are the most popular drugs used in topical formulations for their anal- gesic, antirheumatic, and anti-inflammatory properties. NSAIDs are recommended in international and national guidelines as an early treatment option for symptomatic man- agement of knee and hand osteoarthritis. They may be used ahead of oral NSAIDs due to their superior safety profile [1]. Topical pharmaceutical formulations, designed to permeate the skin, require in vitro release-rate testing (IVRT) to produce reliable and consistent results. The release of active pharmaceutical ingredient (API) from all batches of the produced preparation should proceed at the same rate, and deviations from the norm will indicate manufacturing errors. Therefore, according to the Food and Drug Administration (FDA) [2] and the United States Pharmacopeia (USP) [3] guidelines, it is necessary to compare the release rates of API Pharmaceutics 2021, 13, 1305. https://doi.org/10.3390/pharmaceutics13081305 https://www.mdpi.com/journal/pharmaceutics
Transcript of Optimization and Evaluation of the In Vitro Permeation ...

pharmaceutics
Article
Optimization and Evaluation of the In Vitro PermeationParameters of Topical Products with Non-SteroidalAnti-Inflammatory Drugs through Strat-M® Membrane
Bartłomiej Milanowski 1,2,* , Hanna Wosicka-Frackowiak 1,2, Eliza Główka 1,2,† , Małgorzata Sosnowska 2,Stanisław Wozny 2, Filip Stachowiak 2, Angelika Suchenek 3 and Dariusz Wilkowski 3
�����������������
Citation: Milanowski, B.;
Wosicka-Frackowiak, H.; Główka, E.;
Sosnowska, M.; Wozny, S.; Stachowiak,
F.; Suchenek, A.; Wilkowski, D.
Optimization and Evaluation of the
In Vitro Permeation Parameters of
Topical Products with Non-Steroidal
Anti-Inflammatory Drugs through
Strat-M® Membrane. Pharmaceutics
2021, 13, 1305. https://doi.org/
10.3390/pharmaceutics13081305
Academic Editors: Jaehwi Lee and
Heather Benson
Received: 30 June 2021
Accepted: 17 August 2021
Published: 20 August 2021
Publisher’s Note: MDPI stays neutral
with regard to jurisdictional claims in
published maps and institutional affil-
iations.
Copyright: © 2021 by the authors.
Licensee MDPI, Basel, Switzerland.
This article is an open access article
distributed under the terms and
conditions of the Creative Commons
Attribution (CC BY) license (https://
creativecommons.org/licenses/by/
4.0/).
1 Chair and Department of Pharmaceutical Technology, Poznan University of Medical Sciences,ul. Grunwaldzka 6, 60-780 Poznan, Poland; [email protected]
2 GENERICA Pharmaceutical Lab, Regionalne Centrum Zdrowia Sp. z o. o., ul. Na Kepie 3,64-360 Zbaszyn, Poland; [email protected] (M.S.); [email protected] (S.W.);[email protected] (F.S.)
3 MYLAN Healthcare Sp. z o. o., ul. Postepu 21B, 02-676 Warszawa, Poland;[email protected] (A.S.); [email protected] (D.W.)
* Correspondence: [email protected] or [email protected]; Tel.: +48-061-854-66-59† Dr. Główka passed away on 17 December 2020.
Abstract: Pharmaceutical products containing non-steroidal anti-inflammatory drugs (NSAIDs) areamong the most prescribed topical formulations used for analgesic and antirheumatic properties.These drugs must overcome the skin barrier to cause a therapeutic effect. Human skin has been widelyused as a model to study in vitro drug diffusion and permeation, however, it suffers from manylimitations. Therefore, to perform in vitro permeation test (IVPT), we used a Strat-M® membranewith diffusion characteristics well-correlated to human skin. This study’s objective was to optimizethe IVPT conditions using Plackett–Burman experimental design for bio-predictive evaluation ofthe in vitro permeation rates of five non-steroidal anti-inflammatory drugs (diclofenac, etofenamate,ibuprofen, ketoprofen, naproxen) across Strat-M® membrane from commercial topical formulations.The Plackett–Burman factorial design was used to screen the effect of seven factors in eight runs withone additional center point. This tool allowed us to set the sensitive and discriminative IVPT finalconditions that can appropriately characterize the NSAIDs formulations. The permeation rate ofetofenamate (ETF) across the Strat-M® membrane was 1.7–14.8 times faster than other NSAIDs fromselected semisolids but 1.6 times slower than the ETF spray formulation.
Keywords: Strat-M® membrane; in vitro permeation test; Plackett–Burman design; etofenamate;diclofenac; ibuprofen; ketoprofen; naproxen
1. Introduction
Non-steroidal anti-inflammatory drugs (NSAIDs), such as diclofenac diethylamine(DEA) or sodium (DNa), etofenamate (ETF), ibuprofen (IBP), ketoprofen (KTP), andnaproxen (NPX), are the most popular drugs used in topical formulations for their anal-gesic, antirheumatic, and anti-inflammatory properties. NSAIDs are recommended ininternational and national guidelines as an early treatment option for symptomatic man-agement of knee and hand osteoarthritis. They may be used ahead of oral NSAIDs due totheir superior safety profile [1].
Topical pharmaceutical formulations, designed to permeate the skin, require in vitrorelease-rate testing (IVRT) to produce reliable and consistent results. The release of activepharmaceutical ingredient (API) from all batches of the produced preparation shouldproceed at the same rate, and deviations from the norm will indicate manufacturing errors.Therefore, according to the Food and Drug Administration (FDA) [2] and the United StatesPharmacopeia (USP) [3] guidelines, it is necessary to compare the release rates of API
Pharmaceutics 2021, 13, 1305. https://doi.org/10.3390/pharmaceutics13081305 https://www.mdpi.com/journal/pharmaceutics
Pharmaceutics 2021, 13, 1305 2 of 18
from semisolid forms to confirm the identical quality of two batches of the product afterintroducing changes in the composition or manufacturing process.
On the other hand, in vitro permeation test (IVPT) can help to explain and optimizethe drug’s dermal absorption process during the development phase of a semisolid phar-maceutical product. Human skin has been widely used as a model for studying ex vivodiffusion of transdermal and topical formulations [4,5]. However, human skin suffersfrom high biological variabilities such as thickness, hair follicles density, lipid content,and composition [4,6,7]. Its usage is also limited by its availability, high cost, and specialstorage requirements [6–8]. What is more, excised skin may be prone to artifacts broughton by storage conditions, as some studies clearly show that skin freezing (especially below−20 ◦C) results in increased permeation of tested APIs [9].
Strat-M® membrane (Merck Millipore, Burlington, MA, USA) was introduced as asynthetic membrane for in vitro diffusion studies as a substitute for human skin [10,11],however it cannot replace it. Strat-M® membrane is composed of tight top layer (resemblingstratum corneum), two layers of polyethersulfone (resembling dermis), lying atop one layerof polyolefin, which is more open and diffusive (playing the role of subcutaneous tissue).These multiple layers of the membrane create a general structure similar to that of humanskin. In addition, this membrane is characterized by its low batch-to-batch variability,safety, and lack of storage limitations, thus providing more consistent data. Besides, it hasbeen shown that the diffusion data of Strat-M® membrane correlate well with those ofhuman skin [7,10–12]. These findings suggest that Strat-M® membrane can be used as analternative to animal or human skin during in vitro permeation/diffusion studies, being ascreening tool for evaluating topical/transdermal formulations [13–15].
The IVPT optimization and validation approach had not been meaningfully advanceduntil the Ng et al. work [16]. The parameters investigated included Franz cell’s dimensions,stirring conditions, membrane type, membrane treatment, temperature regulation, andsampling frequency. It was determined that validation of the optimized method dramat-ically reduced data variability as the coefficient of variation for steady-state ibuprofenpermeation from a gel formulation was reduced from 25.7% to 5.3% (n = 6).
To the best of the authors’ knowledge, no systematic development of the IVPT ofNSAIDs through Strat-M® membrane using the Design of Experiments (DoE) approachhas been published so far. One type of experimental design used for the optimization of theanalytical method is the Plackett–Burman design [17–20]. This efficient two-level fractionfactorial screening design identifies the statistically significant independent variables(factors) influencing response with very few experimental runs, which results in savingof chemicals, time, and human resources. The most important aspect of this design iscombining different independent variables with a variable level (i.e., −1 and +1). ThroughPlackett–Burman design, a maximum of N-1 independent variables can be examined in Nruns, where N is a multiple of 4. In this way, seven factors can be tested within eight runs,so the number of trials may be reduced to an absolute minimum. The Plackett–Burmandesign analyses the input data and presents a rank order of the variables with a magnitudeof an effect and designates signs to the effects to indicate whether an increase in factorvalues is advantageous or not. Thus, the objective of this work was to:
1. Develop and validate a single Ultra High Performance Liquid Chromatography(UHPLC) assay applicable to quantify all five NSAIDs (DNa/DEA, ETF, IBU, KTP,NPX) used in the study since we have no found such a method during an extensiveliterature search;
2. Optimize the IVPT parameters using an automatic set of vertical Franz diffusion cellsand Plackett–Burman factorial design to obtain bio-predictive IVPT based on ETF andDEA permeation across Strat-M® membrane;
3. Evaluate NSAIDs’ in vitro permeation parameters (i.a. fluxes) from selected topicalproducts obtained under optimized IVPT conditions.

Pharmaceutics 2021, 13, 1305 3 of 18
2. Materials and Methods2.1. Materials
Nine different commercially available formulations of NSAIDs for topical administra-tion were purchased from a local pharmacy and used in this study: Dolgit® cream 5% (man-ufacturer: DOLORGIET GmbH & Co. KG, Bonn, Germany), Ketonal® gel 2.5% (manufac-turer: Salutas Pharma GmbH, Sülzetal, Germany), Ketospray® 10% (manufacturer: PharbilWaltrop GmbH, Waltrop, Germany), Naproxen EMO gel 10% (manufacturer: EMO-FARMSp. z o.o., Ksawerów, Poland), Olfen® gel 1% (manufacturer: Merckle GmbH, Blaubeuren,Germany), Traumon® aerosol 10%, Traumon® gel 10% (both manufactured by MEDAManufacturing GmbH, Cologne, Germany), Voltaren® Max 2%, Voltaren® Emulgel® 1%(both manufactured by GSK Consumer Healthcare GmbH & Co. KG, Munich, Germany).
Strat-M® membranes, 25% ammonia solution, acetonitrile isocratic grade, 2-propanol,phosphate-buffered saline pH 7.4, were from Merck (Darmstadt, Germany). Chloroaceticacid, secondary pharmaceutical standards of Diclofenac Sodium, Etofenamate, Ibuprofen,Ketoprofen, and Naproxen were purchased from Sigma-Aldrich (Darmstadt, Germany).Water was purified with a Milli-Q IQ plus system (Merck Millipore, Burlington, MA, USA).
2.2. PH, Conductivity, and Viscosity Measurements
The pH and conductivity measurements of all the studied products were performedusing a SevenCompact Duo S213 pH-meter coupled with InLab Viscous Pro-ISM (forsemisolids) or InLab Expert Pro-ISM (for solutions) and InLab 731-ISM electrodes (allfrom Mettler-Toledo GmbH, Greifensee, Switzerland), respectively. The electrodes werecalibrated on certified buffer solutions pH 4.0, 7.0, and 9.0 and conductivity standards 147,1413, and 12,880 µS/cm (all from Reagecon Diagnostics Ltd., Clare, Ireland). In addition,the viscosity of semi-solids was measured by an IKA Rotavisc Me-Vi viscometer (IKA-Werke GmbH & Co. KG, Staufen, Germany) coupled to spindle #SP-11 at 10 and 75 rpm.All measurements were conducted in quadruplicate at room temperature, and the resultsare shown in Table 1.
Table 1. Characteristics of commercial topical products with NSAIDs.
Commercial Nameand Batch Number
(Type of Formulation)
Drug and ItsConcentration
(mg/g)
Excipients (fromManufacturer’s Label)
pHMean ± SD
(n = 4)
Conductivity(mS/m)
Mean ± SD(n = 4)
Viscosity (mPa·s)Mean ± SD (n = 4)
10 rpm 75 rpm
Dolgit®,Lot: 811007,
(cream)Ibuprofen (IBU), 50
Methyl 4-hydroxybenzoate sodium,medium-chain triglycerides, glycerol
monostearate, polyoxyethylene 30stearate, polyoxyethylene 100 stearate,
propylene glycol, xanthan gum,lavender oil, orange oil, purified water
5.99 ± 0.05 15.57 ± 0.18 32,567 ± 1097 7397 ± 55
Ketonal®,Lot: JE4531, (gel) Ketoprofen (KTP), 25
Carbomer, triethanolamine, lavenderessential oil, ethanol 96%,
purified water6.31 ± 0.08 210.45 ± 2.90 54,367 ± 1801 11,311 ± 328
Naproxen EMO,Lot: 81671, (gel) Naproxen (NPX), 100
Chloralhydrate, levomenthol, ethanol96%, ethyl p-hydroxybenzoate, sodium
hydroxide, carbomer, purified water7.48 ± 0.08 1049.50 ± 4.95 62,233 ± 1290 12,851 ± 311
Olfen®,Lot: T26318A, (gel)
Diclofenac sodium(DNa), 10
Isopropyl adipinate, lactic acid,isopropyl alcohol, sodium
pyrosulphite, hydroxypropylcellulose,hydroxyethylcellulose, purified water
6.13 ± 0.02 63.28 ± 0.62 26,733 ± 2003 6933 ± 127
Traumon®,Lot: 3832641, (gel) Etofenamate (ETF), 100
Carbomer, fattyalcohol-polyglycol-ether, sodium
hydroxide, isopropyl alcohol,macrogol 400, propylene glycol,
purified water
5.15 ± 0.05 10.90 ± 0.02 62,567 ± 1060 13,005 ± 100
Voltaren® Emulgel®,Lot: 2G3R,
(emulsion gel)
Diclofenac diethylamine(DEA), 11.6 (equivalent
to 10 mg/gdiclofenac sodium)
Carbomer, cocoyl caprylocaprate,diethylamine, isopropyl alcohol, liquid
paraffin, macrogol cetostearyl ether,perfume, propylene glycol,
purified water
7.41 ± 0.04 140.10 ± 0.57 30,633 ± 513 7623 ± 110

Pharmaceutics 2021, 13, 1305 4 of 18
Table 1. Cont.
Commercial Nameand Batch Number
(Type of Formulation)
Drug and ItsConcentration
(mg/g)
Excipients (fromManufacturer’s Label)
pHMean ± SD
(n = 4)
Conductivity(mS/m)
Mean ± SD(n = 4)
Viscosity (mPa·s)Mean ± SD (n = 4)
10 rpm 75 rpm
Voltaren® Max,Lot: 876D,
(emulsion gel)
Diclofenac diethylamine(DEA), 23.2 (equivalent
to 20 mg/gdiclofenac sodium)
Butylhydroxytoluene, carbomer,cocoyl caprylocaprate, diethylamine,
isopropyl alcohol, liquid paraffin,macrogol cetostearyl ether, oleyl
alcohol, perfume, propylene glycol,purified water
7.45 ± 0.02 195.40 ± 1.56 30,167 ± 153 6670 ± 437
Ketospray® forte,Lot: 216554-21,
(topicalspray, solution)
Ketoprofen (KTP), 100
Propylene glycol, isopropyl alcohol,soya lecithin, ethanol, sodium
dihydrogen phosphate dihydrate,disodium phosphate dodecahydrate,sodium hydroxide, peppermint oil,
purified water
7.22 ± 0.02 806.15 ± 1.77 n/a n/a
Traumon® aerosol,Lot: 3823121,
(topicalspray, solution)
Etofenamate (ETF), 100
Diisopropyl adipate, fattyalcohol-polyglycol-ether, macrogol 400,
isopropyl alcohol, propylene glycol,purified water
6.45 ± 0.13 1.66 ± 0.01 n/a n/a
2.3. In Vitro Permeation Test (IVPT)
Twelve-hour in vitro permeation tests were performed using Strat-M® membranesand Vision® MicroetteTM vertical diffusion cell (VDC, 7.0 mL, 1.767 cm2) automated testsystem (Hanson Research, Inc., Chatsworth, CA, USA). Phosphate-buffered saline pH 7.4,6.6, or 5.8 was used as the receptor medium. About 0.55 mL of each semisolid formulationwas applied to the Strat-M® membrane in the donor compartment (Hanson VDC dosagewafer), and each cell was occluded with a glass disc to avoid evaporation. Precisely 300 µLof each liquid (aerosol) preparation was dosed to the Strat-M® membrane in the threadedcell top for 7 mL VDC and closed with a screw cap. Samples were automatically collectedfrom the receptor compartments at predefined time intervals (2, 4, 6, 9, 12 h) and replacedwith the same amount of the fresh receptor medium.
There were two sets of IVPTs conditions used in this study. The first one was used tooptimize IVPT conditions. DEA and ETF were studied in this part as model drugs withthe same molecular mass (Table S1) but different physicochemical properties (logP, pKa,formulation pH and viscosity). The second one was based on the optimized conditions tocompare NSAIDs diffusion from all tested products.
IVPTs conditions were optimized based on Plackett–Burman experimental design [17]to screen the effect of seven factors in an eight-run statistical model on the permeationrate (flux) of DEA and ETF from reference formulations (i.e., Voltaren® Emulgel® 1% andTraumon® gel 10%, respectively). First, the following factors were evaluated: 2-propanolconcentration in the receptor medium (10% vs. 40%) in order to verify if it can maintain thesink conditions, receptor medium temperature (32 ◦C vs. 37 ◦C), rotation speed (600 rpmvs. 1000 rpm), PBS pH (5.8 vs. 7.4) to evaluate the influence of medium pH on ETF andDEA fluxes, medium degassing (not degassed vs. degassed), stirring while sampling(unstirred vs. stirred), replacement medium volume (1 mL vs. 2 mL). One additional centerpoint, where numeric factors were set midway between their low and high levels, wasincluded in Plackett–Burman design to detect curvature in the response (i.e., the existenceof second-order effects). All experiments were performed in triplicate at this stage. Next,the ratios of each Traumon® gel sample’s slope to that of each Voltaren® Emulgel® sample’sslope (ETF/DEA flux ratios) were calculated and used for further statistical evaluations toestablish the most discriminative and bio-predictive test parameters (based on etofenamateand diclofenac bioavailability data presented by Rannou et al. [1] we had expected theETF/DEA ratio at least > 3). Thus, the obtained data were subjected to statistical analysisusing Minitab® 18.1 software (Minitab, Inc., State College, PA, USA) to analyze screeningdesign. Then the optimized IVPT conditions were used to evaluate the NSAIDs diffusionfrom all the tested products. At this stage, all formulations were tested in six replicates.
Pharmaceutics 2021, 13, 1305 5 of 18
To provide documented evidence that the functions of the VDCs comply with theUSP specifications, the cell dimension evaluations, operational qualification (OQ), andperformance qualification (PQ) were performed before and after the API permeation study.In addition, the temperature of the receptor medium, stirring speed, replacement/samplingprocedure were continuously checked and recorded during every run.
The obtained permeation profiles were described employing linear regression equa-tions according to Equation (1):
AQ/S = a√
t + b, (1)
where AQ—the accumulated quantity of the drug in receptor medium [mg]; S—the surfaceof Strat-M® membrane [cm2]; t—time [h]. The slope of the regression line (a) representedthe rate of permeation of the drug (i.e., flux) from the product through Strat-M® mem-brane per unit surface area (mg/cm2) versus square root of time (h−2). The permeabilitycoefficient (Kp) was calculated from Equation (2):
Kp = Jss/Cd, (2)
where Cd is the initial concentration of the drug in the formulation applied on the mem-brane surface (mg/cm3), and Jss is the steady-state flux (mg/cm2 h) (it comes from thepermeation rate calculated from the Equation (1)).
2.4. UHPLC Analysis
The NSAIDs concentrations in the samples were analyzed immediately after IVPTsby a UHPLC method using Nexera-i LC- 2040C 3D Plus chromatograph coupled with aphotodiode array detector, both operated by LabSolutions software v.6.82 (all from Shi-madzu Co., Kyoto, Japan). Luna Omega Polar® 1.6 µm C18 100 Å column 50 × 2.1 mm withSecurityGuardTM Ultra Cartridge Fully Porous Polar C18 2.1 mm ID (all from Phenomenex®,Torrance, CA, USA) were used. The mobile phase was a mixture of 4 g/L chloroacetic acidpH 3.0 with acetonitrile (50:50, (v/v)) at a flow rate of 0.4 mL/min (isocratic conditions).The mobile phase was pre-filtered under vacuum through OlimPeakTM 0.2 µm hydrophilicPTFE filter (Teknokroma, Barcelona, Spain) and degassed using an ultrasonic degasser(Sonorex Digiplus, Bandelin, Berlin, Germany) for 0.5 h. The autosampler, column oven,and detector temperatures were 4, 25, and 40 ◦C, respectively. The injection volumes, UVdetection wavelengths, and retention times of NSAIDs are shown in Table S2.
This method was optimized first and then validated according to The InternationalCouncil for Harmonization (ICH) guidelines [21], including specificity, linearity, range,accuracy, precision (repeatability and intermediate precision), the limit of detection (LOD),the limit of quantification (LOQ), robustness and stability of each API used in the study.Moreover, to ensure the quality of UHPLC determinations of API concentrations in thereceptor media operational qualification (OQ), performance qualification (PQ), and perfor-mance verification (PV) tests of the analytical instrument were performed before and afterthe API permeation study.
2.5. Statistical Analysis
Exploratory data analyses were performed using MS Excel and DDSolver [22]. Minitab®
18.1 software (Minitab, Inc., State College, PA, USA) was used to develop Plackett–Burmanexperimental design to screen independent variables. The statistical evaluation consistedof identifying statistically significant effects (p < 0.05) according to ANOVA and Paretocharts, evaluating the model’s fitting (R2 value and lack of fit test), and confirming the ho-moscedasticity and normal distribution residuals. In addition, to elucidate the relationshipbetween the variables, response surface maps (RSM) were constructed. All results, unlessstated otherwise, are expressed as mean ± standard deviation.
Pharmaceutics 2021, 13, 1305 6 of 18
3. Results and Discussion
The physicochemical properties (molecular weight, log P, pKa, water solubility) and bi-ological properties (IC50 (drug concentration that inhibits 50% of the enzyme activity) valuefor COX1 and COX2) of diclofenac (including diclofenac sodium and diethylamine), keto-profen, naproxen (including sodium), ibuprofen and etofenamate are shown in Table S1.
3.1. Characterisation of NSAIDs Formulations
Table 1 presents the compositions and physicochemical characteristics of commercialtopical products with NSAIDs.
Apart from one preparation (Dolgit® cream), the rest of the studied semisolids are gelswith carbomer as the gelling agent, except for one (Olfen®) gelled by cellulose derivatives.Both Voltaren® formulations are emulsion type gels (emulgels), meaning oily dropletsdispersed in an aqueous phase [23]. The optimum viscosity of carbomer gel is achieved ata pH of 5.0–7.0 [24]. The studied carbomer gels’ pH falls in the range of 5.15–7.48, being thehighest for both Voltaren® emulgels (7.41 and 7.45) and Naproxen EMO gel (7.48). Apartfrom the viscosity aspect, the pH of a topical preparation should be as close as possible tothat of human skin, not to cause irritation or drying. From all of the studied semisolids,Traumon® gel (5.15) and Dolgit® cream (5.99) have the pH closest to physiological. Bothaerosol formulations have pH close to neutral. Looking at the conductivity data of all thestudied formulations, Naproxen EMO gel and Ketospray® stand out, presenting muchgreater conductivity values than the rest of the preparations. It may result from highsodium hydroxide content in both products (pH values above 7).
Viscosity is an important physical property of topical formulations that may affect therate of drug release and influences skin application (spreadability and skin feel). When theviscosity of a gel is too low, after applying to the skin, the gel has to be spread very fastas it quickly runs off. However, as far as the drug release is concerned, the literature dataare discrepant if the increased viscosity improves or impedes the process [25]. From allthe studied commercial formulations, Olfen® gel was characterized by the lowest viscosity(at 10 rpm), typical for cellulose gels. The most outstanding viscosity was observed forboth Traumon® and Naproxen EMO gels. For all the semisolids, the viscosity was lower asthe rotational speed of the viscometer increased. When the speed increases, the normallydisarranged molecules of the vehicle are caused to align their long axes in the flow direction.Such orientation reduces the internal resistance of the material and hence decreases theviscosity making skin application easier [26]. We did not notice any correlation betweenthe viscosities of semisolids and their permeation rates. Binder et al. concluded that theviscosity of hydrogel formulations seems to play a subordinate role in the skin penetrationof an incorporated model drug [25].
3.2. Quantification of NSAIDs
A successful permeation test needs a reliable and precise analytical method to quantifythe permeated drug in a receptor fluid. Ideally, the same method should enable quantifyingall tested APIs under the same conditions. The UHPLC method is considered a quick andprecise quantitative method for active substances in pharmaceutical products. It allowsfor the isolation of an analyzed substance from other product components. The use of aphotodiode array (PDA) detector makes it possible to collect spectra for light-absorbingcompounds in the 200–800 nm range with acceptable sensitivity and selectivity. After anextensive literature search, we have not found a single HPLC method applicable to quantifyall five NSAIDs (DNa/DEA, ETF, IBU, KTP, NPX). Based on the literature review presentedin Tables S3–S7, the chosen NSAIDs can be divided into two groups due to the mobilephase composition used in HPLC analysis. ETF and DEA/DNa can be determined using amobile phase of acetonitrile, methanol, water, and a phosphate buffer at an appropriatepH with a defined ingredient ratio. For the determination of ETF, phosphate buffer (pH-adjusted to 6.0 with orthophosphoric acid) and methanol in the ratio of 20:80 % (v/v) wereused as the mobile phase [27] (Table S6). For DNa and DEA determination (Table S3), the

Pharmaceutics 2021, 13, 1305 7 of 18
most straightforward mobile phase was a mixture of acetonitrile and methanol 70:30 %(v/v) [28] or methanol in water 30:70 % (v/v) [29], respectively. NPX, KTP, and IBU are thesecond group of APIs determined on the C18 HPLC column. However, except acetonitrileor methanol and water, acidifiers are present in the mobile phase: orthophosphoric acid,chloroacetic acid, sodium acetate, or a small amount of acetic acid (Tables S4–S6).
Thus we have decided to develop and validate a new method. The structure and sizeof selected API molecules gave the possibility of using the same or similar chromatographicconditions and, above all, the same column—C18 type.
The validation parameters of the analytical method used for the assay of APIs byUHPLC-UV were evaluated based on the analytical performance parameters such asspecificity, linearity, precision, and accuracy. The results are shown in Table S8. Thespecificity of the method was ensured since none of the excipients used in the commercialformulations and receptor media interfered with particular API quantification. The linearregression analysis values revealed that the calibration curves fit the linear model withcorrelation coefficients ≥ 0.995. Besides, the low values of the standard errors of theslopes and intercepts were obtained. The methodology adopted to determine the NSAIDsconcentrations had a high repeatability level and accuracy, as demonstrated by coefficientsof variation below 2.5% and recovery levels between 98.7–100.8%. Those results are similarto the literature data concerning HPLC methods for NSAIDs quantification in IVPTs (citedin Supplementary Material Tables S3–S7). However, the values of LOD and LOQ seem tobe higher as they were calculated using the calibration function to estimate the standarddeviation (ICH approach) and the concentration ranges were adjusted to the needs of ourpermeation studies. It is worth noting that this assay has a short run time (retention timesof all APIs are below 3 min) and reduced mobile phase solvent usage (due to the low flowrate 0.4 mL/min).
Thus an efficient, precise and fast chromatographic method was developed. It enabledto quantify all the APIs using the same column and mobile phase with different detectionwavelengths only.
3.3. Optimization of IVPT Conditions
We performed optimization and validation of IVPT conditions using a Hanson’s verticaldiffusion cell setup. Thus, the first stage of the study was focused on exploiting Plackett–Burman experimental design [17] to screen the effect of seven factors in eight runs with oneadditional center point (Table 2) on the permeation rate (flux) of DEA or ETF from commer-cial formulations for cutaneous application (Voltaren® Emulgel® 10 mg/g or Traumon® gel100 mg/g, respectively). We examined the influence of different test parameters (receptor-media composition, temperature and pH, media degassing and stirring speed (stirrer effi-ciency) as well as sampling volume and frequency on sink conditions) on the in vitro drugpermeation profiles from semisolid preparations with model NSAIDs—DEA and ETF.
Table 2. Experimental plan of Plackett–Burman seven-factor eight-run screening design with a center point (C) and theobserved response values (DEA and ETF fluxes and their ratio).
Exp. No.
Factors with Levels ResponsesMean ± SD (n = 3)
FluxesComparison
IsopropanolConc. (%) Temp. (◦C)
StirringSpeed(rpm)
MediumpH
MediumDegassing
StirringWhile
Sampling
ReplacementMedium
Volume (mL)
ETF Flux(µg/cm2h)
DEA Flux(µg/cm2h)
ETF/DEAFlux Ratio
Value
1 10 32 600 7.4 yes yes 1 30 ± 5 416 ± 40 0.07 ± 0.012 10 32 1000 7.4 no no 2 53 ± 7 518 ± 43 0.10 ± 0.013 10 37 600 5.8 yes no 2 50 ± 4 436 ± 72 0.12 ± 0.024 10 37 1000 5.8 no yes 1 59 ± 3 518 ± 12 0.11 ± 0.01
5 (C) 25 34.5 800 6.6 no/yes a no/yes b 1.5 1014 ± 164 528 ± 32 1.92 ± 0.296 40 32 600 5.8 no yes 2 3976 ± 256 690 ± 76 5.82 ± 0.647 40 32 1000 5.8 yes no 1 1614 ± 56 674 ± 63 2.41 ± 0.218 40 37 600 7.4 no no 1 3015 ± 688 414 ± 42 7.32 ± 1.589 40 37 1000 7.4 yes yes 2 2824 ± 630 623 ± 18 4.54 ± 0.88
a half of the volume of receptor medium degassed, b for the time of sampling, the stirrer was turned off and then restarted again when halfof the sample volume was collected.

Pharmaceutics 2021, 13, 1305 8 of 18
The statistical evaluation consisted of identifying statistically significant effects (p < 0.05)according to ANOVA (Table 3) and Pareto charts (Figure 1), evaluating the model’sfitting (R2 value and lack of fit test) and confirming the homoscedasticity and normaldistribution residuals.
Table 3. Summary of analysis of variance (ANOVA) of Plackett–Burman screening design batches for ETF/DEA flux ratios.
Source DF Adj. SS Adj. MS F-Value p-ValueProb > F
Model 8 555.532 69.441 163.44 <0.001Linear 7 552.311 78.902 185.70 <0.001
Isopropanol Conc. (%) 1 435.510 435.510 1025.01 <0.001Temperature (◦C) 1 15.368 15.368 36.17 <0.001Stirring Speed (rpm) 1 42.711 42.711 100.52 <0.001Medium pH 1 14.470 14.470 34.06 <0.001Medium Degassing 1 43.394 43.394 102.13 <0.001Stirring While Sampling 1 0.384 0.384 0.90 0.345Replacement Medium Volume (mL) 1 0.474 0.474 1.12 0.294
Curvature 1 0.031 0.031 0.07 0.788Error 72 30.592 0.425Total 80 586.123
DF—Total Degrees of Freedom; Adj. SS—Adjusted Sum of Squares; Adj. MS—Adjusted Mean Squares; The F-value is the test statistic usedto determine whether the term is associated with the response; The p-value is a probability that measures the evidence against the nullhypothesis. Lower probabilities provide stronger evidence against the null hypothesis. 95% significant values are given in bold.
Pharmaceutics 2021, 13, x FOR PEER REVIEW 9 of 18
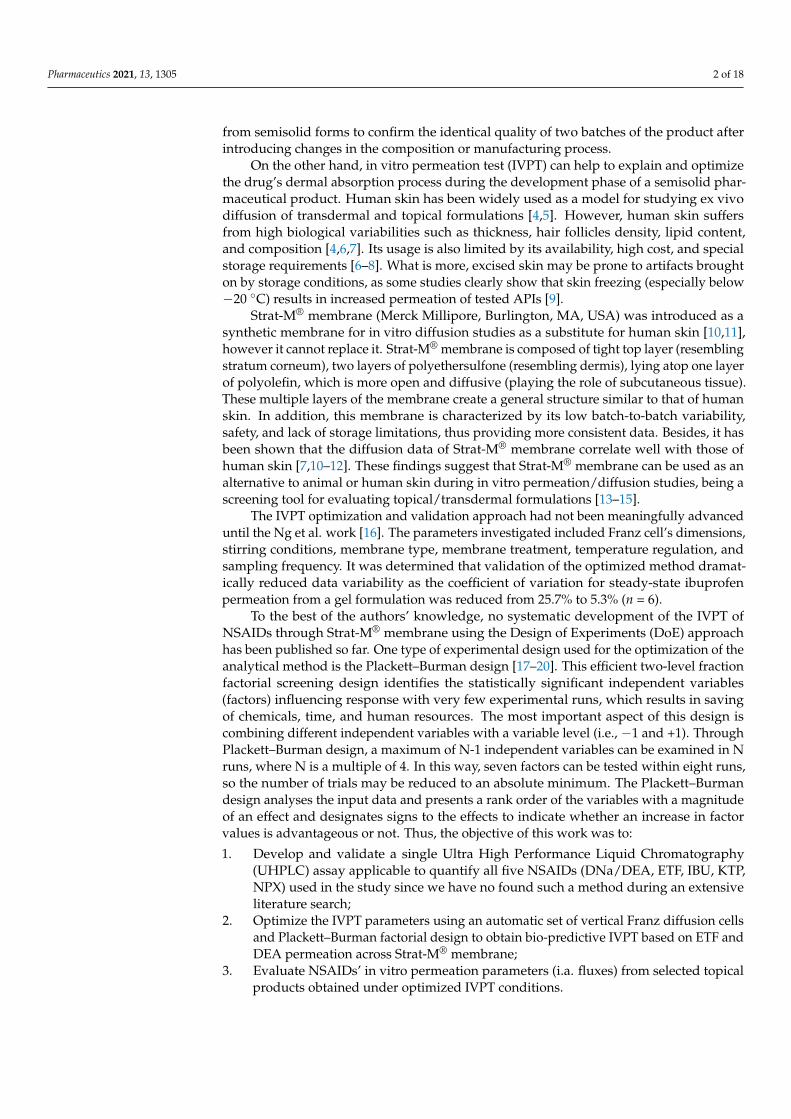
Figure 1. Pareto chart of the standardized effects of independent variables on ETF/DEA flux ratio values (α = 0.05). The red dotted line represents the lowest significant value of standardized effect at α = 0.05.
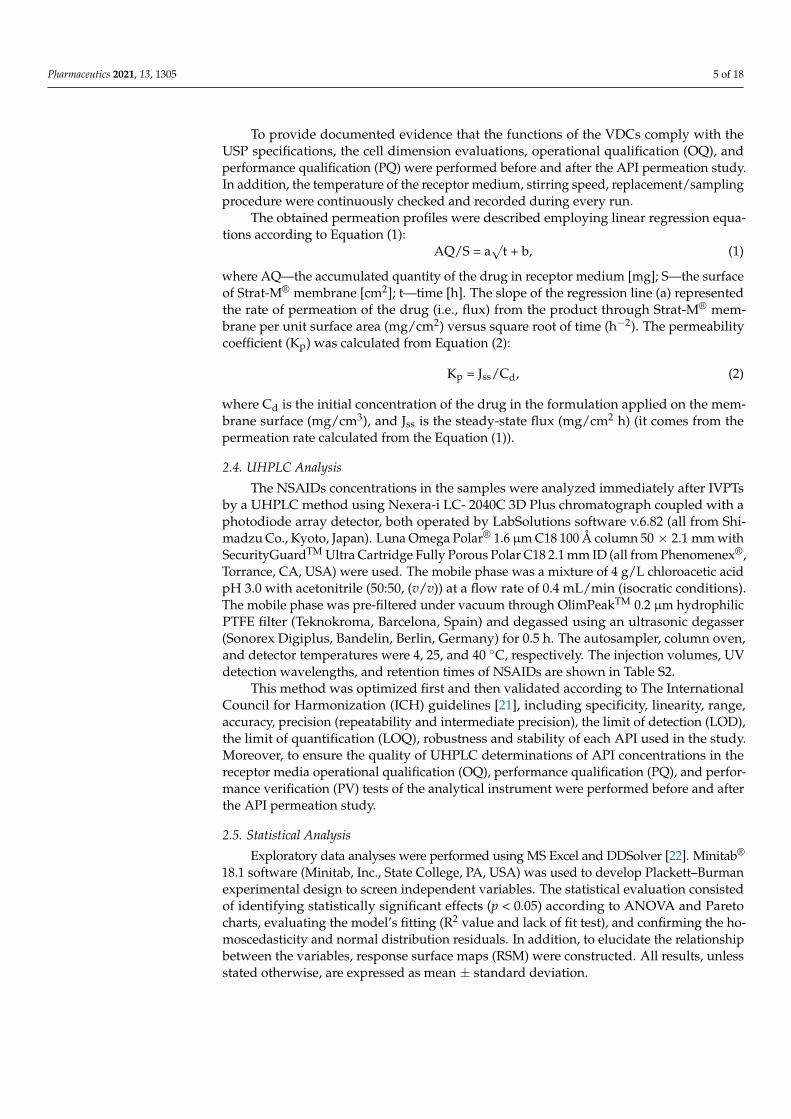
To elucidate the relationship between the most important variables, response surface maps (RSM) were constructed (Figure 2).
Figure 2. Response surface (3-D) plot illustrating the effect of isopropanol concentration and medium degassing on ETF/DEA flux ratio values.
Figure 1. Pareto chart of the standardized effects of independent variables on ETF/DEA flux ratio values (α = 0.05). The reddotted line represents the lowest significant value of standardized effect at α = 0.05.
To elucidate the relationship between the most important variables, response surfacemaps (RSM) were constructed (Figure 2).

Pharmaceutics 2021, 13, 1305 9 of 18
Pharmaceutics 2021, 13, x FOR PEER REVIEW 9 of 18
Figure 1. Pareto chart of the standardized effects of independent variables on ETF/DEA flux ratio values (α = 0.05). The red dotted line represents the lowest significant value of standardized effect at α = 0.05.
To elucidate the relationship between the most important variables, response surface maps (RSM) were constructed (Figure 2).
Figure 2. Response surface (3-D) plot illustrating the effect of isopropanol concentration and medium degassing on ETF/DEA flux ratio values.
Figure 2. Response surface (3-D) plot illustrating the effect of isopropanol concentration and medium degassing onETF/DEA flux ratio values.
The Plackett–Burman design recognizes the independent factors affecting the responsevariables and identifies the most significant factors. It revealed that isopropanol concentra-tion, medium degassing, stirring speed, temperature and medium pH had a significanteffect (p < 0.001, α = 0.05) on the ETF/DEA flux ratios (Tables 2 and 3, Figure 1). Thefollowing mathematical model (R2 = 0.9478, R2adj. = 0.9420) was established for ETF/DEAflux ratio value:
ETF/DEA flux ratio value = −8.07 + 0.16396 Isopropanol Conc. [%] +0.1848 Temp. [◦C] − 0.003851 Stirring Speed [rpm] + 0.5604 Medium pH −
1.553 Medium Degassing + 0.146 Stirring While Sampling +0.162 Replacement Medium Volume + 0.069 Center Point
(3)
Our results indicate that, from the seven factors studied, the major contributor to theNSAIDs’ permeation across Strat-M® membrane is the composition of the receptor fluid,which is in good agreement with other studies [30,31]. Medium degassing and its stirringspeed also have a significant impact on the process. An increase in alcohol concentrationincreased the rate and extent of ETF permeation (Table 2) due to the high solubilizationpower of the receptor fluid. Our additional research proved that diffusional sink conditionsare maintained for DEA in each tested medium but for ETF only in the medium with40% (v/v) of 2-propanol (data not shown), allowing sufficient drug permeation over asubstantial time period. The sink conditions are an essential presupposition so that thedrug concentration in the receptor medium does not limit the permeation rate. Preciselythe increase of isopropanol concentration from 10% to 40% increased ETF permeationflux even up to 132 fold, while DEA flux up to 1.6 fold and the ETF/DEA flux ratiovalue up to 105 fold (Table 2). It also improved the discriminating power of the IVPT

Pharmaceutics 2021, 13, 1305 10 of 18
in accordance with in vivo studies of DEA and ETF absorption and bioavailability fromtopical formulations [1,32].
On the other hand, high concentration of isopropanol in the receptor medium mayraise completely different concerns like the dissolution of lipids from the Strat-M® mem-brane. Therefore, it can be presumed that the over-proportional increase in the ETF flux isnot only due to the increase in its solubility, but it may be the sign of the dissolution of themembrane’s lipids. However, it is known that synthetic lipids in the Strat-M® membraneare located mainly in the top layer [33], which is in contact with the tested formulation,and they are absent in the third layer, which is in contact with the receptor fluid [7,34].Thus, the disruption of the barrier integrity is likely to be limited to the lipid-based toplayer of the artificial membrane, as suggested by Arce et al. [33]. In our opinion, the extrac-tion/dissolution of lipids from the Strat-M® membrane depends mainly on the composition(presence of organic solvents) of the tested formulations. Traumon® gel contains largeamount of 2-propanol (confidential data) as a co-solvent, thanks to which ETF is dissolvedin this product. Isopropanol could dissolve/extract the lipids in the apical side of themembrane, thus making ETF penetration easier [35,36] especially under sink conditions.
Medium outgassing decreases ETF/DEA flux ratios, probably due to isopropanolcontent reduction during ultrasounds and vacuum filtration treatment [37]. Similarly, anincrease in stirring speed decreases the discriminative power of the test. However, toavoid hindered diffusion by the low liquid mixing speed in the receptor compartment,we had chosen the typical range of steering speed in Hanson’s vertical diffusion cell (i.e.,600–1000 rpm) when designing the IVPT [37,38]. Increasing the medium temperatureresulted in higher values of ETF/DEA flux ratios, as it is suggested that the temperatureincreases the solvent power of the receptor fluid. Thomas et al. [39] demonstrated that heatapplication in conjunction with topically applied formulations could increase flux values.
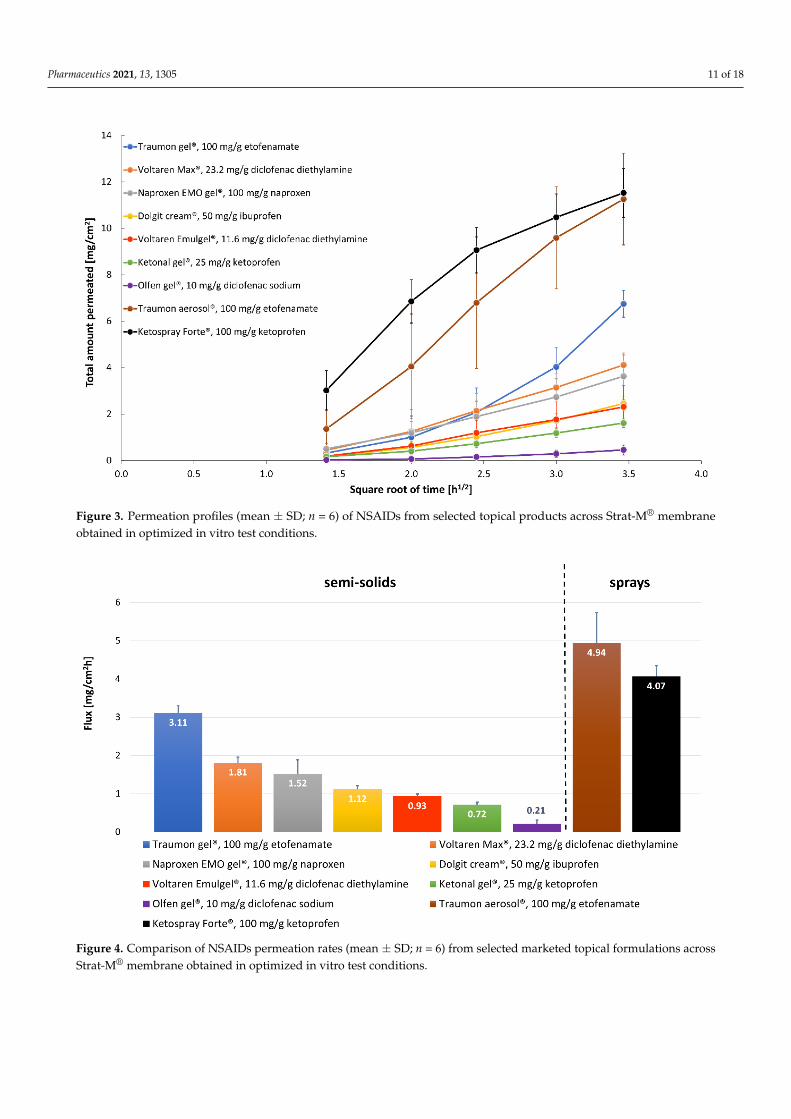
Our study proved that the Plackett–Burman design was an efficient tool to optimizekey study parameters during IVPT method development, to identify conditions for asensitive and discriminating IVPT study that can appropriately characterize the NSAIDsformulations. The following test parameters were regarded as being applicable for obtain-ing discriminative in vitro permeation profiles through Strat-M® membrane from topicalETF and DEA reference formulations: the composition of the receptor fluid (40% (v/v)isopropanol and 60% (v/v) PBS pH 7.4) as the parameter of the most significant influence,not degassed receptor fluid with the temperature of 37 ◦C, a magnetic stirring bar withhelix stirrer driven at 600 rpm. Thus, these optimized IVPT conditions were applied toevaluate NSAIDs’ in vitro permeation profiles (Figure 3) and parameters (Figure 4 andTable 4) from selected, marketed formulations.
Table 4. NSAID permeation parameters from selected commercial formulations through Strat-M® membrane in optimizedin vitro test conditions.
CommercialFormulation (API)
Drug Flux (Jss)(mg/cm2h)
DeterminationCoefficient (R2)
PermeabilityCoefficient (KP)
(cm/h)
Total AmountPermeated
at 12 h (AQ12 h)(mg/cm2)
Dolgit® cream 5% (IBU) 1.12 ± 0.09 0.9735 ± 0.0095 (2.24± 0.18) × 10−2 2.45 ± 0.31Ketonal® gel 2.5% (KTP) 0.72 ± 0.06 0.9767 ± 0.0093 (2.88 ± 0.25) × 10−2 1.61 ± 0.18
Naproxen EMO gel 10% (NPX) 1.52 ± 0.36 0.9878 ± 0.0070 (1.52 ± 0.36) × 10−2 3.63 ± 0.85Olfen® gel 1% (DNa) 0.21 ± 0.10 0.9272 ± 0.0309 (2.11 ± 0.98) × 10−2 0.45 ± 0.22
Traumon® gel 10% (ETF) 3.11 ± 0.19 0.9110 ± 0.0532 (3.11 ± 0.19) × 10−2 6.75 ± 0.58Voltaren® Emulgel® 1.16% (DEA) 0.93 ± 0.06 0.9887 ± 0.0053 (9.32 ± 0.61) × 10−2 2.31 ± 0.91
Voltaren® Max 2.32% (DEA) 1.81 ± 0.15 0.9921 ± 0.0079 (9.05 ± 0.75) × 10−2 4.12 ± 0.43Ketospray ® 10% (KTP) 4.07 ± 0.28 0.9378 ± 0.0343 (4.07 ± 0.28) × 10−2 11.53 ± 1.05
Traumon® aerosol 10% (ETF) 4.94 ± 0.80 0.9463 ± 0.0428 (4.94 ± 0.80) × 10−2 11.26 ± 1.97
Pharmaceutics 2021, 13, 1305 11 of 18
Pharmaceutics 2021, 13, x FOR PEER REVIEW 11 of 18
sensitive and discriminating IVPT study that can appropriately characterize the NSAIDs formulations. The following test parameters were regarded as being applicable for obtaining discriminative in vitro permeation profiles through Strat-M® membrane from topical ETF and DEA reference formulations: the composition of the receptor fluid (40% (v/v) isopropanol and 60% (v/v) PBS pH 7.4) as the parameter of the most significant influence, not degassed receptor fluid with the temperature of 37 °C, a magnetic stirring bar with helix stirrer driven at 600 rpm. Thus, these optimized IVPT conditions were applied to evaluate NSAIDs’ in vitro permeation profiles (Figure 3) and parameters (Figure 4 and Table 4) from selected, marketed formulations.
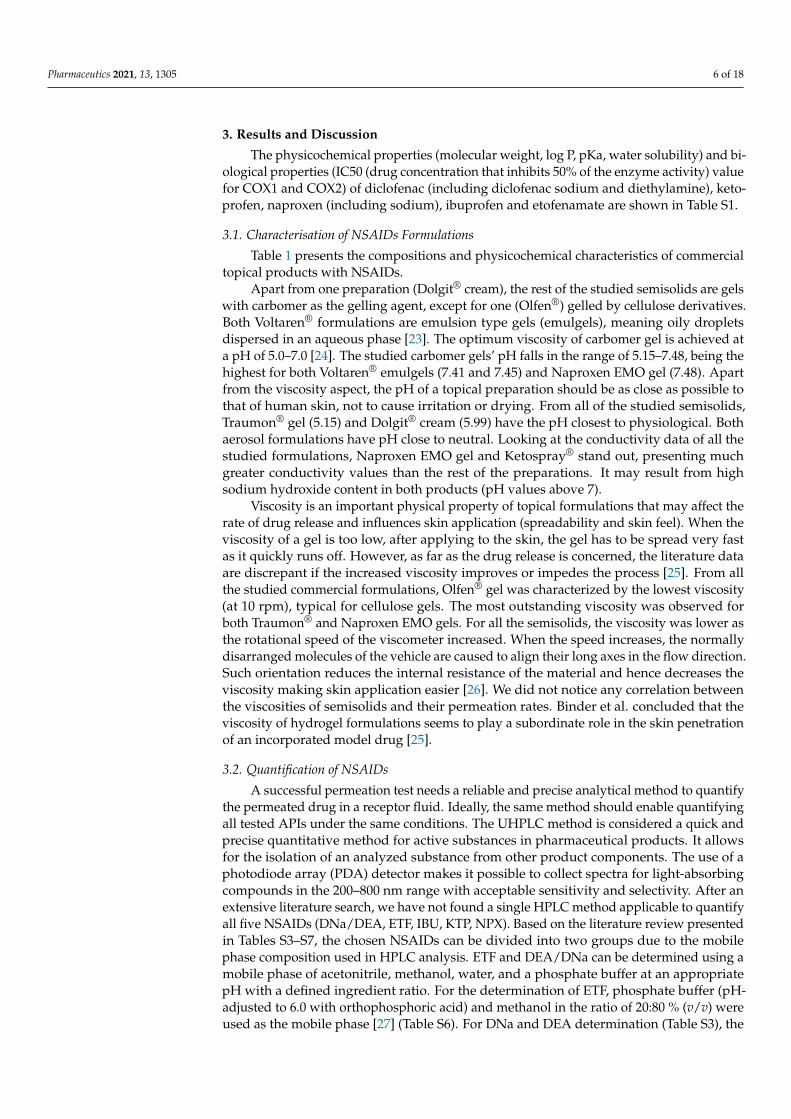
Figure 3. Permeation profiles (mean ± SD; n = 6) of NSAIDs from selected topical products across Strat-M® membrane obtained in optimized in vitro test conditions.
Figure 4. Comparison of NSAIDs permeation rates (mean ± SD; n = 6) from selected marketed topical formulations across Strat-M® membrane obtained in optimized in vitro test conditions.
Figure 3. Permeation profiles (mean ± SD; n = 6) of NSAIDs from selected topical products across Strat-M® membraneobtained in optimized in vitro test conditions.
Pharmaceutics 2021, 13, x FOR PEER REVIEW 11 of 18
sensitive and discriminating IVPT study that can appropriately characterize the NSAIDs formulations. The following test parameters were regarded as being applicable for obtaining discriminative in vitro permeation profiles through Strat-M® membrane from topical ETF and DEA reference formulations: the composition of the receptor fluid (40% (v/v) isopropanol and 60% (v/v) PBS pH 7.4) as the parameter of the most significant influence, not degassed receptor fluid with the temperature of 37 °C, a magnetic stirring bar with helix stirrer driven at 600 rpm. Thus, these optimized IVPT conditions were applied to evaluate NSAIDs’ in vitro permeation profiles (Figure 3) and parameters (Figure 4 and Table 4) from selected, marketed formulations.
Figure 3. Permeation profiles (mean ± SD; n = 6) of NSAIDs from selected topical products across Strat-M® membrane obtained in optimized in vitro test conditions.
Figure 4. Comparison of NSAIDs permeation rates (mean ± SD; n = 6) from selected marketed topical formulations across Strat-M® membrane obtained in optimized in vitro test conditions.
Figure 4. Comparison of NSAIDs permeation rates (mean ± SD; n = 6) from selected marketed topical formulations acrossStrat-M® membrane obtained in optimized in vitro test conditions.

Pharmaceutics 2021, 13, 1305 12 of 18
3.4. Comparative Analysis of NSAIDs Permeation under Optimized In Vitro Conditions
There is little evidence in the literature showing that topical NSAIDs preparations candeliver therapeutic concentrations of drugs to underlying tissues. Undoubtedly the rate-limiting step of this transport is the drug partitioning into the stratum corneum, which is inpart influenced by the relative solubility of the drug in the formulation and in the stratumcorneum [40]. It is also clear that the absolute amount of the drug permeating the skin isstrongly dependent upon the type of the vehicle (formulation) in which the API is applied—monophasic vs. multiphasic, vehicle viscosity, pH, presence of permeation-enhancingexcipients [41]. Apart from the formulation properties, other critical factors influencingthe flux across the healthy human skin include the drug’s concentration and physical statein the vehicle (solubilized vs. suspended), the drug’s molecular weight, salt vs. free acidor base form, etc. A proportional increase in the flux can be achieved by increasing theconcentration of the dissolved drug. According to Fick’s law of diffusion, the excess drugin the formulation acts as a reservoir at a higher concentration above the solubility. It helpsin maintaining constant flux for a prolonged period and thus increases the permeation.It is also known that greater flux is achieved when the drug is in solubilized rather thansuspended form [42,43]. One cannot forget about the state of the skin that also playsan important role, as different skin diseases or topically applied drugs can significantlyaffect the permeation rate. The scope of our study did not include these parameters asthey deserve a separate study. However, some general considerations according to theformulations’ ingredients have to be made.
Olfen® gel (DNa) presents the slowest permeation rate, having at the same timethe lowest NSAID concentration (along with Voltaren® Emulgel®) from all the studiedformulations (10 mg/g). Voltaren® Emulgel® (DEA) and Olfen® (DNa) contain the samedrug (but different salt form) in the same concentration. The first gel presents 4.4 timesfaster permeation rate and 4.4 times higher value of permeation coefficient (Figure 4,Table 4). Minghetti et al. [44] concluded that diclofenac salts had proved effective inpromoting the drug’s permeation in vitro, provided that the salt-forming base is organic. Asalt of this type offers a better partition coefficient and a higher activity coefficient, especiallyin water. The nature of the gelling agent and, even more importantly, the presence ofpenetration enhancers in the formulation may also influence the differences in permeation.Olfen® (DNa) contains only isopropyl alcohol, while Voltaren® Emulgel® (DEA) includesisopropyl alcohol and propylene glycol as permeation enhancers. These componentsin vivo can diffuse to the skin surface and increase the permeation of drugs, either bydisrupting the lipid structure of the stratum corneum or by increasing the solubility ofthe drug in the skin (i.e., increasing the partition coefficient of the drug between the skinand the vehicle) [45]. The study of Haltner-Ukomadu et al. [40] revealed opposite resultsto ours. They studied in vitro permeation of Olfen® (DNa), Voltaren® Emulgel® (DEA),and Voltaren® Max (DEA) gels to PBS pH = 7.4, achieving the greatest cumulative amountof diclofenac in the receptor fluid after 48 h for Olfen® (DNa) gel (360.9 µg/cm2), whilethe lowest amount for Voltaren® Emulgel® (DEA) (122.6 µg/cm2). However it has to beemphasized that the authors used human ex vivo skin as the permeation membrane. Tryingto explain the results they stated that “diclofenac in the hydrogel is immediately availablefor diffusion into the skin compared with the emulsion gel in which diclofenac must firstrelease from the lipid phase to be available for penetration of the skin”. InterestinglyPradal et al. [23] published even more contrary results. They compared the permeationrates of two diclofenac salts to PBS with 5% BSA, revealing that diclofenac diethylamine1.16% emulsion gel presented statistically significant higher permeation through humanskin than diclofenac sodium 5% gel. It proves that higher concentration may not alwayslead to greater absorption through the skin. The authors claimed that the presence ofemollients such as cocoyl caprylocaprate and paraffin in Voltaren® Emulgel® (DEA) couldimprove the level of skin hydration by occlusion, which favors drug absorption.
Voltaren® Max (DEA) is a very similar preparation to Voltaren® Emulgel® (DEA) withdiclofenac diethylamine in doubled concentration (2.32%). Its flux across the Strat-M®

Pharmaceutics 2021, 13, 1305 13 of 18
membrane is almost twice as high as the flux of Voltaren® Emulgel®, while the permeabilitycoefficients are almost equal for those gels (Table 4). Considering the compositions of bothVoltaren® preparations, it can be noticed that Voltaren® Max has the addition of a thirdpenetration enhancer—oleyl alcohol. Long-chain fatty alcohols are effective penetrationenhancers for a variety of drugs [46–48].
The fluxes of Naproxen EMO, Dolgit®, and Ketonal® present decreasing order ac-cording to NSAIDs’ concentrations: 10% NPX, 5% IBU, 2.5% KTP; that seems to be thedetermining parameter here. However, after normalizing the permeation flux to the initialconcentration of the drug in the donor compartment (Kp values at Table 4 calculated ac-cording to Equation (2)) we obtain the reverse order to the drug dose. Although the drugsin those three gels are different, they are present in acidic form and have similar molecularmasses, logP and pKa values (Table S1). Based on the literature review, we can concludethat NPX [49] and IBU [41,50] are suspended in their product vehicles, whereas KTP isfully dissolved [51]. They are weak acids, so at pH 7.4 (receptor fluid), they undergo anionization process providing them good solubility. However, Chantasart et al. [52] revealedthat the donor solution pH was a significant factor influencing skin permeation (they usedhuman epidermal membrane) for the NSAIDs when the receiver’s pH was maintained at7.4. They concluded that the NSAIDs’ apparent permeability coefficients increased whenthe donor solution’s pH decreased, consistent with the increase in the fraction of unionizedNSAIDs in the donor solution at lower pH and the unionized free acids of NSAIDs as themain contributors to skin permeation.
The flux of ETF is definitely the highest from all the studied semisolids. Traumon®
(ETF) gel contains two penetration enhancers (isopropyl alcohol and propylene glycol),similarly to the two other formulations (Voltaren® Max, Voltaren® Emulgel®). So it isnot the composition of the preparation that seems to have a profound impact on thepermeation here, but the drug itself. Enhanced permeation of ETF could be attributed toits high concentration (the value of its Kp is three times lower than that of DEA, Table 4).Pure ETF is a yellowish, highly viscous oil at room temperature. It has the highest logPvalue from all the studied NSAIDs (Table S1). ETF owes its physicochemical propertiesto its specific alcohol–ether–ester structure, and this structure gives this molecule its highlipophilicity [32]. Somewhat contrary results were obtained by Kopecná et al. [48]. Theauthors compared the permeation rates and skin retention of Voltaren® Max (DEA) andfour ETF gels (two 5% and two 10%; including Traumon®). Diclofenac emulgel deliveredcomparable amounts of API to Traumon® gel. However, both the membrane used (humanex vivo skin) and the receptor fluid (phosphate-buffered saline at pH 7.4 with 5% bovineserum albumin) were different in that study comparing to ours. PBS with 5% BSA asthe receptor phase is generally considered to imitate human serum and is recommendedfor in vitro tests of transdermal preparations where the APIs have a systemic effect [53].Topical NSAIDs are not intended to be transdermals, but they are designed to penetratethe skin and accumulate in adjacent tissues in which they exert a local effect. Due to theextremely poor water solubility of ETF (Table S1), the choice of receptor fluid providingproper sink conditions for IVPT is crucial. The Plackett–Burman experimental designused in our optimization studies identified the amount of isopropanol in the receptorphase as the most significant factor influencing ETF permeation rates. That is why weused 40% isopropanol in PBS as the receptor phase. Marto et al. [24] used 40% of ethanolwith PBS (pH = 7.4) as the receptor fluid to compare the permeation rates of ETF fromhydroalcoholic gels.
From the two topical spray formulations tested (KTP and ETF in the same concen-tration) again, ETF has a higher flux. However, the cumulative amounts permeated at12 h are almost equal for the two formulations. Both preparations have a few permeationenhancers: Ketospray® forte (KTP) contains four (propylene glycol, isopropyl alcohol, soyalecithin, and ethanol) and Traumon® aerosol (ETF) contains three (propylene glycol, iso-propyl alcohol, and diisopropyl adipate). Fatty acid–alcohol esters like diisopropyl adipatehave been shown to possess good solubilizing properties for NSAIDs and to enhance skin

Pharmaceutics 2021, 13, 1305 14 of 18
permeation of those drugs. However, they are more effective for enhancing the permeationof hydrophilic than lipophilic drugs. The enhancement effects of those diesters may be dueto their causing lipid extraction in the skin [54]. A greater permeation rate for ETF maybe explained by its higher lipophilicity, enabling the drug to easier cross the membrane.What is more, the pH effect may favor ETF here, as the difference between the pH of theformulation and the pKa of the drug is more significant for ketoprofen, suggesting itsincreased ionization that may impair membrane penetration.
Another aspect of the results that needs to be emphasized is the greater permeationrate of NSAIDs from aerosols than semisolids. We can hypothesize that it is a much lowerviscosity in favor of those liquid formulations and a significant percentage of volatilesolvents acting as permeation enhancers in aerosols. However, those results may not reflectin vivo effect. During our IVPTs of sprays, each cell was closed with a screw cap, so therewas no possibility of evaporation of volatile excipients. However, it does happen post-application in real life conditions and can alter the composition and performance of thesetopically applied liquid formulations. It has been shown that evaporation and permeationof solvents can result in a saturated drug solution followed by its precipitation. The initialevaporation and saturation of solution accelerate drug delivery, but this advantage is lostonce the drug precipitates [39].
The total permeated amounts (Q12h) for all the studied formulations are in accordancewith their fluxes and range from 0.45 to 11.53 mg/cm2 (Table 4). Comparing to the literaturedata [26,40,43,44], those amounts appear to be relatively high. However, the receptor fluidchosen in our experiment (40% (v/v) isopropanol and 60% (v/v) PBS pH 7.4) and its temper-ature (37 ◦C) offer excellent solubilizing properties, and it may be responsible for those highvalues. Pradal [47] compared the permeation of IBU and diclofenac from different topicalformulations using human skin. Cumulative absorption to PBS with 5% BSA as a receptorfluid ranged from 119 to 25282 ng/cm2 after 24 h. Applying the drugs at single finite doses,the author wanted to mimic ‘in-use’ conditions and that is why a maximum flux was notreached in all formulations within the 24 h testing window. Ibuprofen permeated to agreater extent than diclofenac. However, its higher concentrations (5% and 10%) comparedto diclofenac (1% and 2%) in the tested formulations must also contribute to the result [47].Sanna et al. [26] achieved the cumulative amount of diclofenac permeated at 1.5 h fromVoltaren® Emulgel® to PBS (pH = 7.4) in the range 244.3–258.5 µg/cm2 depending on themembrane used. Sacha et al. [43] used PBS (pH 7.4)/methanol (60:40 % (v/v)) at 32 ◦C asthe receptor phase to compare the in vitro release rates of three diclofenac gels achievingrates 691–825 µg/cm2 after 3 h.
The analgesic and anti-inflammatory actions of NSAIDs are, to a considerable extent,dose-dependent. Therefore, within the dose limits that can be delivered topically, thegreater the percentage of skin permeation, the better the clinical response [41]. TopicalNSAIDs produce high drug concentrations in the dermis, muscle, synovium, and jointcartilage, while plasma drug concentrations are less than 10% of those obtained after oraladministration [55].
Etofenamate levels were reported 10- to even 1000-fold higher in fasciae, muscles andthe periosteum than in plasma after cutaneous application [42]. The bioavailability of 5%ETF following topical application is high (>20%) compared with 1% diclofenac—around6%, and 1–7% for other topical NSAIDs [1]. The results are in accordance with ours sincethe flux for ETF is around 3.3 times higher than Voltaren® Emulgel® (DEA). This maybe explained by the high lipophilicity of ETF (logP value around 5) [56]. The drug wasspecifically designed to meet topical anti-inflammatory treatment requirements, such asadequate anti-inflammatory and analgesic efficacy, good local and systemic tolerability,and good transcutaneous penetrating ability [32]. It is rapidly metabolized to flufenamicacid in vivo, which has similar properties as the parent drug [57].

Pharmaceutics 2021, 13, 1305 15 of 18
4. Conclusions
An efficient and fast UHPLC method was developed, optimized, and validated forsimultaneous determination of all the studied NSAIDs. It may come in handy for otherresearchers dealing with NSAIDs.
During IVPT method development, we employed Plackett–Burman’s design as apowerful tool to optimize discriminating parameters that could appropriately characterizethe NSAIDs formulations. As a result, the following test parameters were regarded as beingapplicable for obtaining discriminative in vitro permeation profiles through STRAT-M®
membrane from semisolid ETF and DEA reference topical formulations: the composition ofthe receptor fluid (40% (v/v) isopropanol and 60% (v/v) PBS pH 7.4) as the parameter of thegreatest influence, not degassed receptor fluid with the temperature of 37 ◦C, a magneticstirring bar with helix stirrer driven at 600 rpm. Those parameters may be applicable forsimilar studies, possibly with other NSAIDs.
Due to the optimized IVPT method we managed to compare in equal conditionsdifferent drugs from the same group (NSAID) present in different topical preparationsformulated with different excipients. What is more, the utilization of Strat-M® membranemakes the study reproducible and provides the possibility of repeating the same conditionsby other laboratory.
ETF permeation rate from Traumon® gel across STRAT-M® membrane was 1.7–14.8 timesfaster than other NSAIDs from the rest of the tested semisolids but 1.6 times slower thanthe ETF from liquid formulation (Traumon® aerosol).
We can hypothesize that the results may partially reflect the degree of APIs in vivoabsorption to the site of inflammation and indicate its effectiveness. What is more excipi-ents comparison along with the permeation results may be the useful source of practicalinformation when formulating topical NSAIDs preparations.
Some literature data comparing Strat-M® membrane with human skin ex vivo havebeen available so far [7,12,13]. However such a comparison with different NSAIDs wouldbe highly useful and may be regarded as a future work that needs to be done to extend ourknowledge about the correlation of permeation results between artificial membranes andhuman ex vivo skin.
Supplementary Materials: The following are available online at https://www.mdpi.com/article/10.3390/pharmaceutics13081305/s1, Table S1: The selected physicochemical and biological proper-ties of selected NSAIDs. Table S2: UHPLC method parameters: sample injection volumes, retentiontimes, and NSAIDs analytical wavelengths. Table S3: The permeation test results of topical diclofenacmedications and HPLC methods for its quantification in receptor fluids. Table S4: The permeationtest results of topical ketoprofen medications and HPLC methods for its quantification in receptorfluids. Table S5: The permeation test results of topical naproxen medications and HPLC methodsfor its quantification in receptor fluids. Table S6: The permeation test results of topical ibuprofenmedications and HPLC methods for its quantification in receptor fluids. Table S7: The permeationtest results of topical etofenamate medications and HPLC methods for its quantification in receptorfluids. Table S8: The validation parameters for the assays of NSAIDs by the UHPLC-UV method.
Author Contributions: Conceptualization, methodology, and software, B.M.; Validation, B.M. andM.S.; Formal analysis, B.M., H.W.-F., E.G. and D.W.; Investigation, M.S., B.M., E.G., S.W. and F.S.;Resources, B.M., H.W.-F., E.G. and A.S.; Data curation, B.M., H.W.-F., E.G., M.S., S.W. and F.S.;Writing—original draft preparation, B.M., H.W.-F., E.G. and A.S.; Writing—review and editing, B.M.,H.W.-F., A.S. and D.W.; Visualization, B.M.; Supervision, B.M., A.S. and D.W.; Project administration,B.M., A.S. and D.W.; Funding acquisition, B.M., A.S. and D.W. All authors, except E.G. (she passedaway on 17 December 2020), have read and agreed to the published version of the manuscript.
Funding: This research received external funding from MYLAN Healthcare Sp. z o.o., Warsaw, Poland.
Institutional Review Board Statement: Not applicable.
Informed Consent Statement: Not applicable.
Pharmaceutics 2021, 13, 1305 16 of 18
Data Availability Statement: The data presented in this study are available through whole manuscriptand supplementary material.
Acknowledgments: The authors gratefully acknowledge Aleksander Zieba, MPharm (previouslyMYLAN Healthcare Sp. z o. o., Warsaw, Poland) for administrative support as well as AnnaFroelich and Tomasz Osmałek (both from Poznan University of Medical Sciences, Poznan, Poland)for literature review of NSAIDs physicochemical characteristics, HPLC conditions and permeationtest results. Moreover, we would like to thank Anna Stanko (previously GENERICA Pharmaceu-tical Lab, Zbaszyn, Poland) for technical assistance during in vitro permeation tests and JaninaLulek (Poznan University of Medical Sciences, Poznan, Poland) for constructive discussion of themanuscript content.
Conflicts of Interest: The study has been financially supported by MYLAN Healthcare Sp. z o. o.The sponsor had a role in the study’s design, analyses and interpretation of data, the writing of themanuscript, and in the decision to publish the results. The part of this work was presented at AAPSPharmSci360 Conference 2019 in San Antonio, Texas (Abstract ID: 7332206, poster no. T1030-03-19).
References1. Rannou, F.; Pelletier, J.P.; Martel-Pelletier, J. Efficacy and safety of topical NSAIDs in the management of osteoarthritis: Evidence
from real-life setting trials and surveys. Semin. Arthritis Rheum. 2016, 45, S18–S21. [CrossRef]2. FDA. Guidance for Industry: Nonsterile Semisolid Dosage Forms, Scale-Up and Postapproval Changes: Chemistry, Manufacturing, and
Controls; In Vitro Release Testing and In Vivo Bioequivalence Documentation; U.S. Department of Health and Human Services Foodand Drug Administration, Center for Drug Evaluation and Research (CDER), Office of Training and Communications Division ofCommunications Management, The Drug Information Branch: Rockville, MD, USA, 1997; pp. 1–37.
3. USP43–NF38. General Chapter <1724>: Semisolid Drug Products—Performance Tests; United States Pharmacopoeial Convention, Inc.:Rockville, MD, USA, 2020.
4. Schmook, F.P.; Meingassner, J.G.; Billich, A. Comparison of human skin or epidermis models with human and animal skin inin-vitro percutaneous absorption. Int. J. Pharm. 2001, 215, 51–56. [CrossRef]
5. Trauer, S.; Richter, H.; Kuntsche, J.; Buttemeyer, R.; Liebsch, M.; Linscheid, M.; Fahr, A.; Schafer-Korting, M.; Lademann, J.; Patzelt,A. Influence of massage and occlusion on the ex vivo skin penetration of rigid liposomes and invasomes. Eur. J. Pharm. Biopharm.2014, 86, 301–306. [CrossRef]
6. Barbero, A.M.; Frasch, H.F. Pig and guinea pig skin as surrogates for human in vitro penetration studies: A quantitative review.Toxicol. In Vitro 2009, 23, 1–13. [CrossRef]
7. Uchida, T.; Kadhum, W.R.; Kanai, S.; Todo, H.; Oshizaka, T.; Sugibayashi, K. Prediction of skin permeation by chemicalcompounds using the artificial membrane, Strat-M. Eur. J. Pharm. Sci. 2015, 67, 113–118. [CrossRef]
8. Sterne, G.D.; Titley, O.G.; Christie, J.L. A qualitative histological assessment of various storage conditions on short termpreservation of human split skin grafts. Br. J. Plast. Surg. 2000, 53, 331–336. [CrossRef]
9. Dancik, Y.; Kichou, H.; Eklouh-Molinier, C.; Soucé, M.; Munnier, E.; Chourpa, I.; Bonnier, F. Freezing Weakens the Barrier Functionof Reconstructed Human Epidermis as Evidenced by Raman Spectroscopy and Percutaneous Permeation. Pharmaceutics 2020, 12,1041. [CrossRef] [PubMed]
10. Joshi, V.; Brewster, D.; Colonero, P. In vitro diffusion studies in transdermal research: A synthetic membrane model in place ofhuman skin. Drug Dev. Deliv. 2012, 12, 40–42.
11. Neupane, R.; Boddu, S.H.S.; Renukuntla, J.; Babu, R.J.; Tiwari, A.K. Alternatives to Biological Skin in Permeation Studies: CurrentTrends and Possibilities. Pharmaceutics 2020, 12, 152. [CrossRef] [PubMed]
12. Haq, A.; Goodyear, B.; Ameen, D.; Joshi, V.; Michniak-Kohn, B. Strat-M(R) synthetic membrane: Permeability comparison tohuman cadaver skin. Int. J. Pharm. 2018, 547, 432–437. [CrossRef]
13. Haq, A.; Dorrani, M.; Goodyear, B.; Joshi, V.; Michniak-Kohn, B. Membrane properties for permeability testing: Skin versussynthetic membranes. Int. J. Pharm. 2018, 539, 58–64. [CrossRef]
14. Kaur, L.; Singh, K.; Paul, S.; Singh, S.; Singh, S.; Jain, S.K. A Mechanistic Study to Determine the Structural SimilaritiesBetween Artificial Membrane Strat-M™ and Biological Membranes and Its Application to Carry Out Skin Permeation Study ofAmphotericin B Nanoformulations. AAPS PharmSciTech 2018, 19, 1606–1624. [CrossRef] [PubMed]
15. Mohamed, L.A.; Kamal, N.; Elfakhri, K.H.; Ibrahim, S.; Ashraf, M.; Zidan, A.S. Application of synthetic membranes in establishingbio-predictive IVPT for testosterone transdermal gel. Int. J. Pharm. 2020, 586, 119572. [CrossRef] [PubMed]
16. Ng, S.F.; Rouse, J.J.; Sanderson, F.D.; Meidan, V.; Eccleston, G.M. Validation of a static Franz diffusion cell system for in vitropermeation studies. AAPS PharmSciTech 2010, 11, 1432–1441. [CrossRef] [PubMed]
17. Plackett, R.L.; Burman, J.P. The design of optimum multifactorial experiments. Biometrika 1946, 33, 305–325. [CrossRef]18. Ebrahimi-Najafabadi, H.; Leardi, R.; Jalali-Heravi, M. Experimental design in analytical chemistry—Part I: Theory. J. Aoac. Int.
2014, 97, 3–11. [CrossRef]19. Hibbert, D.B. Experimental design in chromatography: A tutorial review. J. Chromatogr. B Anal. Technol. Biomed. Life Sci. 2012,
910, 2–13. [CrossRef]

Pharmaceutics 2021, 13, 1305 17 of 18
20. Sahu, P.K.; Ramisetti, N.R.; Cecchi, T.; Swain, S.; Patro, C.S.; Panda, J. An overview of experimental designs in HPLC methoddevelopment and validation. J. Pharmaceut. Biomed. 2018, 147, 590–611. [CrossRef]
21. ICH Harmonised Tripartite Guideline. Validation of Analytical Procedures: Text and Methodology Q2(R1). In Proceedings ofthe International Conference on Harmonisation of Technical Requirements for Registration of Pharmaceuticals for Human Use,Geneva, Switzerland, 2 June 2014; pp. 1–13.
22. Zhang, Y.; Huo, M.; Zhou, J.; Zou, A.; Li, W.; Yao, C.; Xie, S. DDSolver: An add-in program for modeling and comparison of drugdissolution profiles. AAPS J. 2010, 12, 263–271. [CrossRef]
23. Pradal, J.; Vallet, C.M.; Frappin, G.; Bariguian, F.; Lombardi, M.S. Importance of the formulation in the skin delivery of topicaldiclofenac: Not all topical diclofenac formulations are the same. J. Pain Res. 2019, 12, 1149–1154. [CrossRef]
24. Marto, J.; Baltazar, D.; Duarte, A.; Fernandes, A.; Gouveia, L.; Militao, M.; Salgado, A.; Simoes, S.; Oliveira, E.; Ribeiro, H.M.Topical gels of etofenamate: In vitro and in vivo evaluation. Pharm. Dev. Technol. 2015, 20, 710–715. [CrossRef] [PubMed]
25. Binder, L.; Mazál, J.; Petz, R.; Klang, V.; Valenta, C. The role of viscosity on skin penetration from cellulose ether-based hydrogels.Skin Res. Technol. 2019, 25, 725–734. [CrossRef]
26. Sanna, V.; Peana, A.T.; Moretti, M.D. Effect of vehicle on diclofenac sodium permeation from new topical formulations: In vitroand in vivo studies. Curr. Drug Deliv. 2009, 6, 93–100. [CrossRef] [PubMed]
27. Peraman, R.; Nayakanti, D.; Dugga, H.H.; Kodikonda, S. Development and Validation of a Stability-Indicating Assay ofEtofenamate by RP-HPLC and Characterization of Degradation Products. Sci. Pharm. 2013, 81, 1017–1028. [CrossRef] [PubMed]
28. Bhattacharya, S.S.; Banerjee, S.; Ghosh, A.K.; Chattopadhyay, P.; Verma, A.; Ghosh, A. A RP-HPLC method for quantification ofdiclofenac sodium released from biological macromolecules. Int. J. Biol. Macromol. 2013, 58, 354–359. [CrossRef]
29. Hamed, R.; Basil, M.; AlBaraghthi, T.; Sunoqrot, S.; Tarawneh, O. Nanoemulsion-based gel formulation of diclofenac diethylamine:Design, optimization, rheological behavior and in vitro diffusion studies. Pharm. Dev. Technol. 2016, 21, 980–989. [CrossRef]
30. Naik, P.; Shah, S.; Heaney, J.; Hanson, R.; Nagarsenker, M. Influence of Test Parameters on Release Rate of Hydrocortisone fromCream: Study Using Vertical Diffusion Cell. Dissolut. Technol. 2016, 23, 14–20. [CrossRef]
31. Sheshala, R.; Anuar, N.K.; Abu Samah, N.H.; Wong, T.W. In Vitro Drug Dissolution/Permeation Testing of Nanocarriers for SkinApplication: A Comprehensive Review. AAPS PharmSciTech 2019, 20, 164. [CrossRef]
32. Marinho, O.D.S.; Pereira, A. Clinical Efficacy and Safety Profile of Topical Etofenamate in the Treatment of Patients withMusculoskeletal Disorders: A Systematic Review. Pain Ther. 2020, 9, 393–410. [CrossRef] [PubMed]
33. Arce, F.J.; Asano, N.; See, G.L.; Itakura, S.; Todo, H.; Sugibayashi, K. Usefulness of Artificial Membrane, Strat-M®, in theAssessment of Drug Permeation from Complex Vehicles in Finite Dose Conditions. Pharmaceutics 2020, 12, 173. [CrossRef]
34. Karadzovska, D.; Riviere, J.E. Assessing vehicle effects on skin absorption using artificial membrane assays. Eur. J. Pharm. Sci.2013, 50, 569–576. [CrossRef]
35. Walker, R.B.; Smith, E.W. The role of percutaneous penetration enhancers. Adv. Drug Deliv. Rev. 1996, 18, 295–301. [CrossRef]36. Hadgraft, J. Skin, the final frontier. Int. J. Pharm. 2001, 224, 1–18. [CrossRef]37. Klein, R.; Heckart, J.; Thakker, K. In Vitro Release Testing Methodology and Variability with the Vertical Diffusion Cell (VDC).
Dissolut. Technol. 2018, 25, 52–61. [CrossRef]38. Klein, S. Influence of different test parameters on in vitro drug release from topical diclofenac formulations in a vertical diffusion
cell setup. Pharmazie 2013, 68, 565–571.39. Thomas, S.; Shin, S.H.; Hammell, D.C.; Hassan, H.E.; Stinchcomb, A.L. Effect of Controlled Heat Application on Topical
Diclofenac Formulations Evaluated by In Vitro Permeation Tests (IVPT) Using Porcine and Human Skin. Pharm. Res. 2020, 37, 49.[CrossRef] [PubMed]
40. Haltner-Ukomadu, E.; Sacha, M.; Richter, A.; Hussein, K. Hydrogel increases diclofenac skin permeation and absorption. Biopharm.Drug Dispos. 2019, 40, 217–224. [CrossRef]
41. Hadgraft, J.; Whitefield, M.; Rosher, P.H. Skin penetration of topical formulations of ibuprofen 5%: An in vitro comparative study.Skin Pharmacol. Appl. Skin Physiol. 2003, 16, 137–142. [CrossRef]
42. Bolla, P.K.; Clark, B.A.; Juluri, A.; Cheruvu, H.S.; Renukuntla, J. Evaluation of Formulation Parameters on Permeation of Ibuprofenfrom Topical Formulations Using Strat-M® Membrane. Pharmaceutics 2020, 12, 151. [CrossRef]
43. Sacha, M.; Faucon, L.; Hamon, E.; Ly, I.; Haltner-Ukomadu, E. Ex vivo transdermal absorption of a liposome formulation ofdiclofenac. Biomed. Pharmacother. 2019, 111, 785–790. [CrossRef] [PubMed]
44. Minghetti, P.; Cilurzo, F.; Casiraghi, A.; Montanari, L.; Fini, A. Ex Vivo Study of Transdermal Permeation of Four Diclofenac Saltsfrom Different Vehicles. J. Pharm. Sci. 2007, 96, 814–823. [CrossRef] [PubMed]
45. Benbow, T.; Campbell, J. Microemulsions as transdermal drug delivery systems for nonsteroidal anti-inflammatory drugs(NSAIDs): A literature review. Drug Dev. Ind. Pharm. 2019, 45, 1849–1855. [CrossRef]
46. Andega, S.; Kanikkannan, N.; Singh, M. Comparison of the effect of fatty alcohols on the permeation of melatonin betweenporcine and human skin. J. Control. Release 2001, 77, 17–25. [CrossRef]
47. Pradal, J. Comparison of Skin Permeation and Putative Anti-Inflammatory Activity of Commercially Available Topical ProductsContaining Ibuprofen and Diclofenac. J. Pain Res. 2020, 13, 2805–2814. [CrossRef] [PubMed]
48. Kopecná, M.; Kovácik, A.; Novák, P.; Boncheva Bettex, M.; Vávrová, K. Transdermal Permeation and Skin Retention ofDiclofenac and Etofenamate/Flufenamic Acid From Over-the-Counter Pain Relief Products. J. Pharm. Sci. 2021, 110, 2517–2523.[CrossRef] [PubMed]
Pharmaceutics 2021, 13, 1305 18 of 18
49. Osmalek, T.; Milanowski, B.; Froelich, A.; Gorska, S.; Bialas, W.; Szybowicz, M.; Kapela, M. Novel organogels for topicaldelivery of naproxen: Design, physicochemical characteristics and in vitro drug permeation. Pharm. Dev. Technol. 2017, 22,521–536. [CrossRef]
50. Brain, K.R.; Green, D.M.; Dykes, P.J.; Marks, R.; Bola, T.S. The role of menthol in skin penetration from topical formulations ofibuprofen 5% in vivo. Skin Pharmacol. Physiol. 2006, 19, 17–21. [CrossRef]
51. Salamanca, C.H.; Barrera-Ocampo, A.; Lasso, J.C.; Camacho, N.; Yarce, C.J. Franz Diffusion Cell Approach for Pre-FormulationCharacterisation of Ketoprofen Semi-Solid Dosage Forms. Pharmaceutics 2018, 10, 148. [CrossRef]
52. Chantasart, D.; Chootanasoontorn, S.; Suksiriworapong, J.; Kevin Li, S. Investigation of pH Influence on Skin Permeation Behaviorof Weak Acids Using Nonsteroidal Anti-Inflammatory Drugs. J. Pharm. Sci. 2015, 104, 3459–3470. [CrossRef]
53. Baert, B.; Annavarapu, S.; Burvenich, C.; De Spiegeleer, B. Analytical, biopharmaceutical and regulatory evaluation of topicaltestosterone preparations. Eur. J. Pharm. Biopharm. 2009, 72, 275–281. [CrossRef]
54. Takahashi, K.; Sakano, H.; Numata, N.; Kuroda, S.; Mizuno, N. Effect of Fatty Acid Diesters on Permeation of Anti-InflammatoryDrugs Through Rat Skin. Drug Dev. Ind. Pharm. 2002, 28, 1285–1294. [CrossRef] [PubMed]
55. Haroutiunian, S.; Drennan, D.A.; Lipman, A.G. Topical NSAID Therapy for Musculoskeletal Pain. Pain Med. 2010, 11, 535–549.[CrossRef] [PubMed]
56. Graham, G.G. Fenamates. In Compendium of Inflammatory Diseases; Parnham, M.J., Ed.; Springer: Basel, Switzerland, 2016;pp. 477–482. [CrossRef]
57. Drago, S.; Imboden, R.; Schlatter, P.; Buylaert, M.; Krahenbuhl, S.; Drewe, J. Pharmacokinetics of Transdermal Etofenamate andDiclofenac in Healthy Volunteers. Basic Clin. Pharmacol. Toxicol. 2017, 121, 423–429. [CrossRef] [PubMed]