INTRODUCTION TO PAM HSIANG Taipei, Taiwan Pam Hsiang Since 1980 .

Optimising 3D Mesh Unfoldingswith Additional Gluetags using
Simulated Annealing
BACHELORARBEIT
zur Erlangung des akademischen Grades
Bachelor of Science
im Rahmen des Studiums
Medieninformatik und Visual Computing
eingereicht von
Thorsten KorpitschMatrikelnummer 01529243
an der Fakultät für Informatik
der Technischen Universität Wien
Betreuung: Ph.D. Hsiang-Yun Wu
Wien, 1. März 2019Thorsten Korpitsch Hsiang-Yun Wu
Technische Universität WienA-1040 Wien Karlsplatz 13 Tel. +43-1-58801-0 www.tuwien.ac.at


Optimising 3D Mesh Unfoldingswith Additional Gluetags using
Simulated Annealing
BACHELOR’S THESIS
submitted in partial fulfillment of the requirements for the degree of
Bachelor of Science
in
Media Informatics and Visual Computing
by
Thorsten KorpitschRegistration Number 01529243
to the Faculty of Informatics
at the TU Wien
Advisor: Ph.D. Hsiang-Yun Wu
Vienna, 1st March, 2019Thorsten Korpitsch Hsiang-Yun Wu
Technische Universität WienA-1040 Wien Karlsplatz 13 Tel. +43-1-58801-0 www.tuwien.ac.at

Erklärung zur Verfassung derArbeit
Thorsten Korpitsch
Hiermit erkläre ich, dass ich diese Arbeit selbständig verfasst habe, dass ich die verwen-deten Quellen und Hilfsmittel vollständig angegeben habe und dass ich die Stellen derArbeit – einschließlich Tabellen, Karten und Abbildungen –, die anderen Werken oderdem Internet im Wortlaut oder dem Sinn nach entnommen sind, auf jeden Fall unterAngabe der Quelle als Entlehnung kenntlich gemacht habe.
Wien, 1. März 2019Thorsten Korpitsch
v


Danksagung
Ich möchte mich bei meiner Beraterin Ph.D. Hsiang-Yun Wu bedanken, dass sie mich indas Thema 3D-Mesh Unfolding eingeführt hat und mir unermüdlich mit Rat, Tat undAnleitung zur Seite stand. Insbesondere möchte ich ihr auch dafür danken, dass sie mir3D-Modelle zur Verfügung gestellt hat, um meinen in dieser Arbeit beschriebenen Ansatzzu evaluieren.
Außerdem möchte ich mich bei meinen Eltern, Ingrid und Horst Korpitsch, sowie beimeiner Großmutter Erna Kaiper und meiner besseren Hälfte Valentina Bone bedanken,dass sie mich auch in schwierigen Zeiten immer unterstützt und ermutigt haben. Ohne ihreewige Geduld, Unterstützung und Motivation wäre diese Arbeit nicht möglich gewesen.
Ich möchte auch Nils Voß MSc für das Korrekturlesen dieser Arbeit danken.
vii


Acknowledgements
I want to thank my advisor, Ph.D. Hsiang-Yun Wu for introducing me to the topic of3D-Mesh Unfolding and tirelessly providing me with advice, action and guidance. Iespecially also want to thank her for providing me with prepared 3D-Models to evaluatemy approach described in this thesis.
Furthermore, I want to thank my parents, Ingrid and Horst Korpitsch, as well as mygrandmother Erna Kaiper and my better half Valentina Bone for always supporting andencouraging me even in hard times. Without their everlasting patience, support andmotivation, this thesis would not have been possible.
I also want to thank Nils Voß MSc for proofreading this thesis.
ix


Kurzfassung
3D mesh unfolding ist der Prozess der Transformation eines 3D Netze in ein 2D Netze.Diese Technik kann verwendet werden, um Papercraft-Modelle zu erstellen, dabei wer-den 3D-Objekte mit einem Papier oder papierähnlichem Material rekonstruiert. Da dieRekonstruktion von Modellen schwer sein kann, benötigen Anwender Indikatoren, welcheFlächen miteinander verklebt werden sollen. In dieser Arbeit werden sogenannte Gluetagsvorgestellt, die Anwendern Platz geben, um Klebstoff aufzutragen, um die Rekonstruktionzu erleichtern. Das Hinzufügen dieser Gluetags erhöht die Schwierigkeit überlappungsfreieEntfaltungen zu finden, die aus einem einzigen Stück Papier ausgeschnitten werden kön-nen. Dabei erhöht sich die Anzahl der möglichen Entfaltungen, während der Lösungsraumschrumpft. Ein Minimum Spanning Tree Ansatz wird verwendet, um mögliche Entfaltun-gen zu berechnen, während simuliertes Glühen verwendet wird, um die Entfaltung zuoptimieren und eine Lösung ohne Überlappungen zu finden. Quantitative Experimentedeuten darauf hin, dass der vorgeschlagene Ansatz schnelle Ergebnisse für kleinere Netze.Für größere Netze werden Ergebnisse innerhalb eines größeren Zeitrahmens geliefert, beidiesen zeigen aber auch eindeutige zeitliche Beschränkungen auf.
xi


Abstract
3D Mesh Unfolding is the process of transforming a 3D mesh into a 2D planar patch. Thistechnique can be used to create papercraft models, where 3D objects get reconstructedfrom planar paper or paper-like material. As the reconstruction of unfolded modelscan be very hard, users need indicators of which faces have to be glued together. Inthis thesis, Gluetags are introduced to give users extra space to apply glue to easethe reconstruction. The addition of these Gluetags increases the difficulty of findingoverlap-free unfoldings that can be cut out of a single piece of paper to reconstruct themodel. The amount of possible unfoldings increases while the solution space shrinks whenGluetags are added. A minimum spanning tree approach is used to compute possibleunfoldings, whereas simulated annealing is used to find an unfolding with no overlaps.Quantitative experiments suggest that the proposed method can yield fast results forsmaller meshes. Results for larger meshes are achievable within an increased timeframe,but they also show time limitations for this approach.
xiii


Contents
Kurzfassung xi
Abstract xiii
Contents xv
1 Introduction 11.1 Background . . . . . . . . . . . . . . . . . . . . . . . . . . . . . . . . . . 11.2 Motivation . . . . . . . . . . . . . . . . . . . . . . . . . . . . . . . . . 21.3 Goal . . . . . . . . . . . . . . . . . . . . . . . . . . . . . . . . . . . . . 21.4 Results . . . . . . . . . . . . . . . . . . . . . . . . . . . . . . . . . . . . 21.5 Structure . . . . . . . . . . . . . . . . . . . . . . . . . . . . . . . . . . 3
2 Related Work 52.1 Optimised Unfolding of 3D Meshes . . . . . . . . . . . . . . . . . . . . 52.2 Optimisation Techniques . . . . . . . . . . . . . . . . . . . . . . . . . . 6
3 Definition of Data andKey Concepts 93.1 Data Representation of the 3D Mesh Model . . . . . . . . . . . . . . . 93.2 Dual Graph . . . . . . . . . . . . . . . . . . . . . . . . . . . . . . . . . 103.3 Cut- and Bend Edges . . . . . . . . . . . . . . . . . . . . . . . . . . . 103.4 Minimum Spanning Tree . . . . . . . . . . . . . . . . . . . . . . . . . . 103.5 Gluetag . . . . . . . . . . . . . . . . . . . . . . . . . . . . . . . . . . . 123.6 Unfolding . . . . . . . . . . . . . . . . . . . . . . . . . . . . . . . . . . 12
4 Methodology 154.1 Calculating the Dualgraph . . . . . . . . . . . . . . . . . . . . . . . . . 164.2 Calculating the Gluetags . . . . . . . . . . . . . . . . . . . . . . . . . . 164.3 Calculating a Minimum Spanning Tree . . . . . . . . . . . . . . . . . . 164.4 Unfolding the 3D Mesh using the Minimum Spanning Tree of its Dual
Graph . . . . . . . . . . . . . . . . . . . . . . . . . . . . . . . . . . . . 174.5 Detecting Overlaps . . . . . . . . . . . . . . . . . . . . . . . . . . . . . 18
xv

5 Implementation 235.1 Specifications . . . . . . . . . . . . . . . . . . . . . . . . . . . . . . . . 235.2 Simulated Annealing . . . . . . . . . . . . . . . . . . . . . . . . . . . . 235.3 Parameterisation of the System . . . . . . . . . . . . . . . . . . . . . . 26
6 Results and Evaluation of the System 276.1 Results . . . . . . . . . . . . . . . . . . . . . . . . . . . . . . . . . . . . 276.2 Performance . . . . . . . . . . . . . . . . . . . . . . . . . . . . . . . . . 346.3 Limitations . . . . . . . . . . . . . . . . . . . . . . . . . . . . . . . . . 35
7 Conclusion 377.1 Summary . . . . . . . . . . . . . . . . . . . . . . . . . . . . . . . . . . 377.2 Future Work . . . . . . . . . . . . . . . . . . . . . . . . . . . . . . . . 37
List of Figures 39
List of Tables 41
List of Algorithms 43
Bibliography 45
CHAPTER 1Introduction
This chapter gives a brief overview of what papercraft is, and insights into the backgroundof this work. Furthermore, it explains the motivation and goals of this thesis. Lastly, itdiscusses shortly the results and describes how the remainder of this thesis structured.
1.1 Background
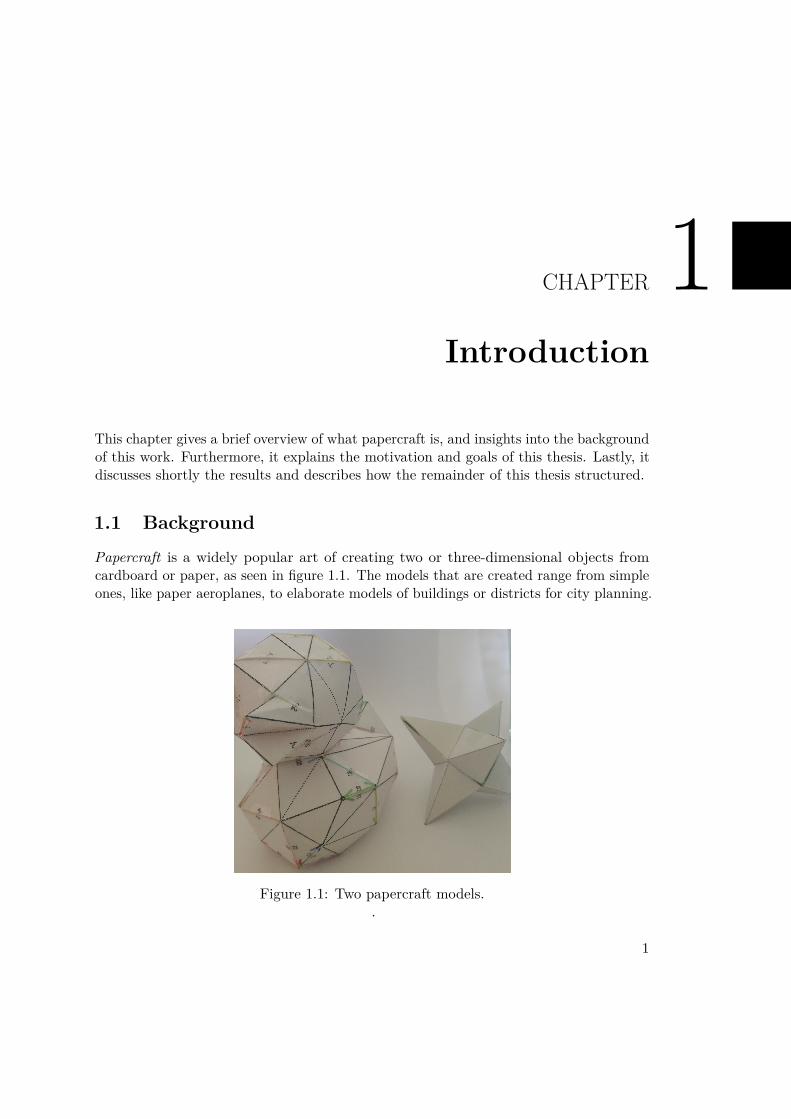
Papercraft is a widely popular art of creating two or three-dimensional objects fromcardboard or paper, as seen in figure 1.1. The models that are created range from simpleones, like paper aeroplanes, to elaborate models of buildings or districts for city planning.
Figure 1.1: Two papercraft models..
1

1. Introduction
Further, it can be used in combination with self-folding materials to form structures afterprinting the planar patch. In order to build papercraft models a 3D mesh representing theobject needs to be unfolded into a single 2D patch or multiple 2D patches. Takahashi etal. [TWS+11] found that unfolding into a single 2D patch avoids the problem of seekingthe correspondences between the boundary edges of different patches when merging them.The resulting mesh can, for example, be printed onto paper and then reconstructed intothe 3D model. Due to two main problems occurring during the process of unfolding thistask is highly complex. Distortion of the model, as well as faces overlapping each other,are problems that occur when unfolding a 3D mesh whereas both should be avoided toallow authentic reconstruction.
1.2 Motivation
The reconstruction of a model can be very hard, even with indicators that show whichfaces should be glued together, like the solution presented by Takahashi et al. [TWS+11].Glueing the faces together if they are tiny is still a hard task, because there is almostno space to apply glue to. This thesis introduces Gluetags to make the reconstructionof models easier. These Gluetags add small faces on edges that are cut and give usersspace to apply glue. Adding Gluetags, which can improve the reconstruction experience,has not been well explored as most of the previous work focused on finding ways to gethighly qualitative unfoldings. The inclusion of Gluetags makes the problem more difficultas the solution space for an unfolding without overlaps shrinks, whereas the search spaceof possible unfoldings and possible Gluetag positions increases.
1.3 Goal
The goal of this thesis is to explore the addition of Gluetags to cut edges. This thesisproposes the addition of Gluetags in advance to the 3D-Model before the unfoldingprocess starts. During the unfolding Gluetags are treated as part of the original mesh.Hence the same unfolding algorithms can be used without further changes. Steps of theprocess are visualised and allow users to interact with both the 3D-Model and the finalplanar patch.
1.4 Results
The suggested approach generates results in a limited amount of time. Experimentsstrongly suggest that the time frame for finding unfoldings increases as meshes increasein size. Additionally the layout of faces influences the time to find unfoldings. Mesheswith less than 200 triangles are unfolded consistently without any overlaps remaining,whereas meshes with up to 400 triangles can be unfolded within an increased timeframe.Meshes over 700 faces cannot be consistently resolved. Another factor impacting thetime to solution and quality of the result is the size of Gluetags. An increased Gluetag
2
1.5. Structure
size makes finding overlap free unfolding less likely. The size of Gluetags can be adjustedto counteract the increase in time needed for unfolding meshes with a higher face count.
1.5 StructureThe remainder of this thesis is structured as follows. In chapter 2, we provide anoverview of previous findings related to 3D Mesh Unfolding and highlights differences tothe proposed approach in this thesis. It also discusses the theoretical background andrelated work for simulated annealing, that optimises the search for unfoldings. Chapter 3describes the concepts of dual graphs and minimum spanning trees, and further describesthe data structure for the suggested approach. The next chapter, 4, gives an overviewof the processing pipeline, that computes an unfolding and describes necessary steps indetail. Chapter 5 brings insight into the implementation of the previously explainedapproach and focuses on the simulated annealing process. Chapter 6 shows the resultsof the implemented approach and evaluates its performance and limitations. Finally,chapter 7 summarises the findings and provides an outlook on future work.
3


CHAPTER 2Related Work
This chapter focuses on previous work done on the topic of optimising the unfolding of3D Meshes but also points out the key differences to the approach proposed in this thesis.Furthermore, it presents the optimisation technique of simulated annealing.
2.1 Optimised Unfolding of 3D MeshesMesh Unfolding has different applications, like creating papercraft models [TWS+11,SP11] and the creation of models from self-folding materials [FTS+13, Tib14]. Manydifferent unfolding techniques have been explored. Theoretical approaches for unfoldingmeshes have been intensively explored [She75], while other authors focus on differentkind of meshes, for example, orthogonal polyhedra [XKKL16, DFO07, DDF14].
Takahashi et al. [TWS+11] use a genetic-based algorithm to find unfoldings. They unfold3D Meshes based on polyhedron models into a single patch, which is still a well-knownopen problem. Their heuristic approach tries to find distortion-free unfoldings. The keyconcept is to use topological surgery to construct models by stitching together boundaryedges of the unfolded mesh.
This thesis, on the other hand, uses the meta-heuristic simulated annealing approachto find unfoldings. Furthermore, the key concept of the proposed approach is to findunfoldings based on minimum spanning trees that can be calculated from the dual graphof the mesh.
Straub et al. [SP11] explored the unfolding and adding Gluetags to an unfolded mesh.They also explore the removal of overlaps by introducing new subdivisions to the mesh.As in the previously mentioned paper, a heuristic approach is used to calculate possibleunfoldings. They use a greedy algorithm to optimise the cutout and to resolve overlaps.Gluetags that have been added to an unfolding are optimised, i.e. changed in size to fitand non-overlap, after an unfolding is found.
5

2. Related Work
In this thesis, the proposed algorithm computes all possible Gluetags beforehand andunfolds them together with the original mesh. Only necessary Gluetags are consideredfor each unfolding. Furthermore, the Gluetags are not treated special, but as part of themesh and they are therefore not post-processed and changed.
Mitani and Suzuki [MS04] propose a different approach. In their paper, they describe theproduction of unfoldings by using strip-based approximation. They propose to segmentmeshes into parts of easily reconstructible segments. This is achieved using featureextraction. They add internal cut lines whenever a feature, like a dent in the mesh, isdetected on a triangle strip, to make it reconstructible. Due to this simplification, theyproduce a rather large error compared to other simplification methods. Their solutionmostly focuses on large mesh models where they merge regions between 60 and 250triangles.
In this thesis, we suggest an authentic reconstruction of the original model. Therefore nomesh simplification methods are used and the reconstructed model is authentical to theoriginal model.
In contrary to Chang et al. [CY17], where the introduction of additional cuts into thepolyhedra is proposed, the suggested approach in this thesis only cuts along edges that arelater glued together again, therefore the original model is not changed during unfolding.
2.2 Optimisation Techniques
As the unfolding of 3D Meshes is considered an NP-complete problem[HE12] optimisationtechniques are necessary to minimise the time needed to find a solution. Many optimisationtechniques are well explored, like greedy algorithms[DT96] or heuristic optimisationtechniques[LES08]. This thesis proposes to use simulated annealing as the optimisationtechnique for the problem of finding optimal unfoldings. Compared to hill climbers,simulated annealing is less likely to get stuck in local optimums, which often appearin problems akin to 3D Mesh Unfolding. Furthermore, simulated annealing is easy toimplement and very configurable, as later explained in this section.
Simulated annealing is a well-known optimisation process [KGJV83] that is widelyapplicable in problems found in computer science [GFR94] [DA91] [BM95] and otherscientific fields [PBARCC90] [SDJ95]. This process tries to emulate the annealing ofmetal that is being processed.
The main goal is to find an minimum value of a function, which is called the cost function,which has many independent variables. A typical example that simulated annealingis used is the travelling salesman problem [MGPO89], where the most effective routebetween different cities has to be found.
Simulated annealing is an iterative process that starts with a system and its configurationP . For this configuration, the cost function calculates a value, which is called theenergy of the configuration E. In each iteration, the configuration P is rearranged to
6
2.2. Optimisation Techniques
a configuration P ′, for which the cost function calculates the value E′. Let E′ ≤ E betrue, then the new configuration P ′ replaces P as the base configuration, from whichnew configurations are arranged. This iteration repeats until a temperature T reaches adefined minimum temperature Tmin, as T cools down in each iteration. When T reachesTmin the value E of configuration P is assumed to be minimal.
The process has to be extended by another step to counteract the problem of deadlocking,which happens when a configuration P reaches a local minimum, instead of the globalone. To avoid such situations, let ∆E = E − E′ be the difference between the energyof the old configuration and the energy of the new configuration. If ∆E ≤ 0 holds truethe new configuration is accepted, otherwise if ∆E > 0 the new configuration is treatedprobabilistic, where the chance of accepting it is (∆E) = exp(−∆E/kBT ), where kB isthe Boltzmann constant. If R < P (∆E) then the new configuration is accepted, whereR is a uniformly distributed random number within the range of [0, 1]. Otherwise, itdiscards the new configuration. As T decreases over time, it gets less likely to acceptworse configurations and the algorithm execution comes to an end.
To summarise, simulated annealing consists of four essential components. First, a concisedescription of the configuration of a system is required. Second, a generator, whichgenerates random moves, that changes the configuration of a system is needed. Aquantitative function that evaluates the trade-offs for each iteration needs to be defined.Last but not least, the system can only evolve with an annealing schedule of temperaturesand length of time. This includes a cooling-rate used to stop the process, which tries toemulate the cooling down of metal which it can only be formed while it is hot.
7


CHAPTER 3Definition of Data and
Key Concepts
This chapter describes the properties of the data that is processed in the proposedimplementation. It also provides definitions for the key concepts used in this thesis.
3.1 Data Representation of the 3D Mesh ModelThe original mesh data has to meet the following requirements to be applicable for thesuggested approach.
• Mesh data is in the Object File Format (.off)
• Mesh data is triangulated
• No duplicated vertices, edges or zero-area faces
• Mesh has no holes
• All faces are connected
The data is read from a file and saved into the CGAL [The19] data structure Polyhedron_3.A Polyhedron_3 object consists of vertices, edges and facets and an incidence relation onthem, as shown in Figure 3.1. An halfedge and an opposite halfedge, that points into theopposite direction, represent each edge of the mesh. These halfedges consist of vertexpairs that can be accessed. The opposite halfedge links each face to its neighbouring face,also the halfedges are linked together, therefore enabling iterating through all halfedgesof a face. With this data structure, all information is available enabling the applicationof the approach suggested in this thesis.
9

3. Definition of Data andKey Concepts
opposite halfedge
halfedge
next halfedgeprev.
halfedgeincident vertex
incident facet
Figure 3.1: CGAL Polyhedron_3 datastructure visualised. Adapted from the CGALuser manual [The19].
3.2 Dual GraphLet GM be the graph representation of a mesh, which is defined by its vertices V andundirected edges E between the vertices. GMd
= (Vd, Ed) is called the dual graph ofa graph GMd
= (V, E), which can be obtained by calculating a dual vertex Vd in eachenclosed facet and an dual-edge Ed for every two facets separated by an edge in E [GY04],as seen in Figure 3.2.
The dual graph can then be used to find an unfolding, as a dual-edge connects eachneighbouring facets. These dual-edges can either represent an edge that is cut or an edgethat is used for bending, which means the dual graph contains all edges, whether theyare cut or bent, of the mesh model. A graph has only one dual graph, and the calculationof it can be done very efficiently, which makes it a very compelling data structure to usefor 3D mesh unfolding.
3.3 Cut- and Bend EdgesIn this thesis, each edge of the dual graph can represent a cut edge or a bend edge. A cutedge is an edge that is cut to be able to unfold the mesh and can be glued back togetherlater. Contrary to that, a bend edge is not cut but bent in the process of reconstruction.
3.4 Minimum Spanning TreeLet G = (V, E) be a connected undirected graph with |V | = n vertices and |E| = m edges.Given a value c(v, w) for each edge (v, w) ∈ E, a spanning tree T = (V, E′), E′ ⊆ E suchthat
∑{v,w}∈E′ c(v, w) is minimal [CT76]. An option to compute a minimum spanning
tree is to first sort the edges by their weight and then one edge after another is addedto the minimum spanning tree. If an edge makes the graph cyclic, this edge is removedagain. After this process, the minimum spanning tree is defined by the edges that are
10

3.4. Minimum Spanning Tree
Figure 3.2: (black) Shows a graph with undirected edges. (green solid and dotted) Showsthe graphs complete dual graph. (green solid) Shows a minimum spanning tree of thedual graph.
not discarded. Many simple algorithms for computing minimum spanning trees areavailable [Kru56, AMOT90]. A minimum spanning tree is therefore acyclic by definitionand can be used to find an unfolding, as an unfolding must not contain cycles as well.
If the minimum spanning tree is calculated from the dual graph, the edges that arepart of the minimum spanning tree are bend edges. All other edges, which are not inthe minimum spanning tree, are cut edges. Therefore, due to its simple calculation, aminimum spanning tree in combination with the dual graph is a good tool to calculatepossible unfoldings.
A weighted graph, where no edges have the same weight, has exactly one minimumspanning tree. This is a problem since the dual graph does not inherently have weightsassigned to edges. Weights need to be assigned to each edge of the dual graph. However,the weights cannot be constant values, as it is done for the travelling salesman problem,because not all minimum spanning trees will yield an unfolding without any overlaps. Asinitial weights, this thesis proposed to random values between (0, 1).
11

3. Definition of Data andKey Concepts
destinationedge
source
edge
gluetag
Figure 3.3: Exemplary trapezoid Gluetag (green) attached to its source triangle edge(blue) and the triangle it will be glued to (red).
3.5 Gluetag
A Gluetag is a space that users can use to apply glue. It can have different forms, forexample, the shape of a trapezoid, as shown in figure 3.3. As seen in figure 3.3, foreach Gluetag exists one source and one destination edge. As a result there exist twovalid positions for each that can be swapped to point into the other direction, thereforeswitching the source and target edge. In this thesis, we propose trapezoid-shaped Gluetagswhich are put on one side of a cut edge at most. Another advantage of the trapezoidshape is that the Gluetags are treated the same way as the triangles of the original mesh,since each trapezoid consists of two triangles.
3.6 Unfolding
An unfolding is defined as the 2D representation of the 3D Model, after unfolding. It iscreated by unfolding faces after each other, according to the minimum spanning tree. Theexact order of which face is unfolded first can be neglected as the minimum spanning treedefines exactly one unfolding. The quality of an unfolding is defined by the overlappingarea in this thesis, since distortion cannot appear due to the used algorithm. In thisthesis, an optimal or correct unfolding is therefore defined as an unfolding withoutdistortion of faces and no overlapping areas. The approach suggested in this thesis avoidsdistorting faces to make an accurate reconstruction possible. Additionally it is necessary
12

3.6. Unfolding
to guarantee that areas do not overlap to enable the creation of a cut-out using a singlepiece of paper.
13

CHAPTER 4Methodology
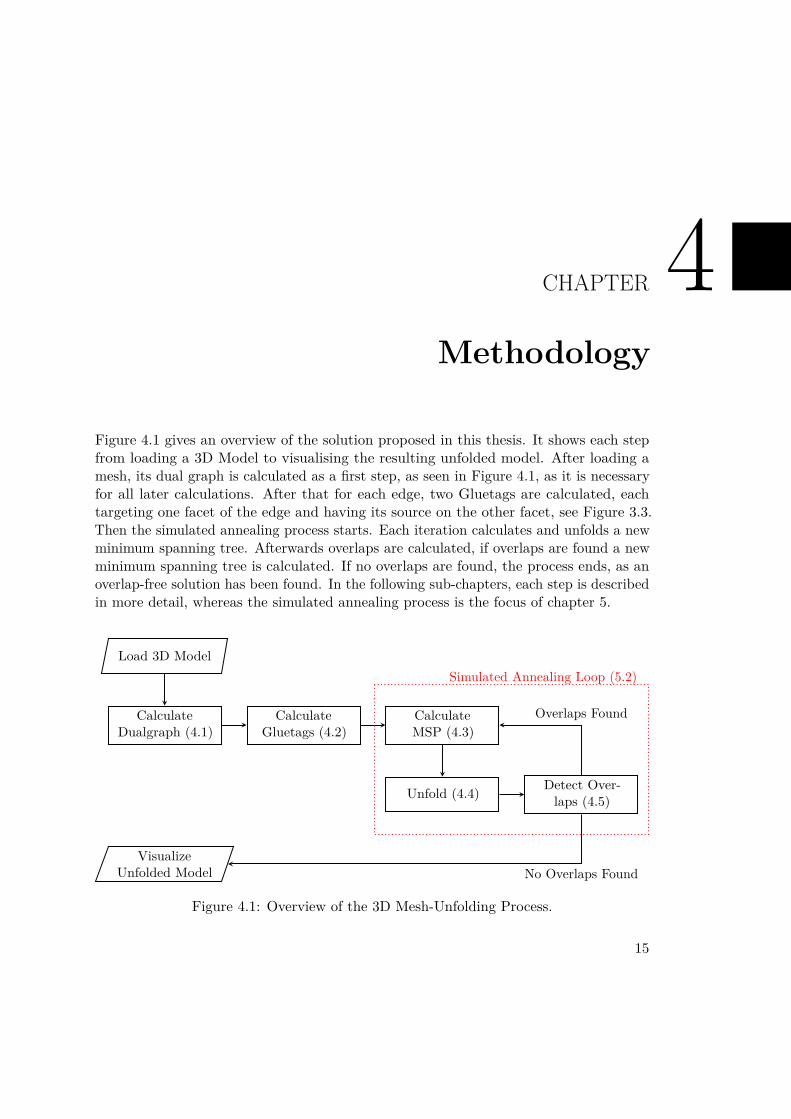
Figure 4.1 gives an overview of the solution proposed in this thesis. It shows each stepfrom loading a 3D Model to visualising the resulting unfolded model. After loading amesh, its dual graph is calculated as a first step, as seen in Figure 4.1, as it is necessaryfor all later calculations. After that for each edge, two Gluetags are calculated, eachtargeting one facet of the edge and having its source on the other facet, see Figure 3.3.Then the simulated annealing process starts. Each iteration calculates and unfolds a newminimum spanning tree. Afterwards overlaps are calculated, if overlaps are found a newminimum spanning tree is calculated. If no overlaps are found, the process ends, as anoverlap-free solution has been found. In the following sub-chapters, each step is describedin more detail, whereas the simulated annealing process is the focus of chapter 5.
Load 3D Model
CalculateDualgraph (4.1)
CalculateGluetags (4.2)
CalculateMSP (4.3)
Unfold (4.4) Detect Over-laps (4.5)
VisualizeUnfolded Model No Overlaps Found
Overlaps Found
Simulated Annealing Loop (5.2)
Figure 4.1: Overview of the 3D Mesh-Unfolding Process.
15

4. Methodology
4.1 Calculating the DualgraphAs the dual graph, described in chapter 3, is calculated from the original mesh, whichdoes not change during the unfolding process, the dual graph is calculated only once inthe beginning, as shown in Figure 4.1. The neighbourhood relation of the facets can bederived from the half edges connecting the mesh vertices.
The dual graph is calculated by iterating through all facets of the mesh. For each facet, weneed to iterate through the half edges, where the opposite half-edges are used to identifythe neighbouring face. These two facets are saved as an edge and can be initialised witha weight. In this thesis, the weight is initialised and changed throughout the algorithmusing a random number to be able to utilise the random walk approach of simulatedannealing.
4.2 Calculating the GluetagsThe second step in the pipeline shown in Figure 4.1 is to calculate Gluetags. For eachedge of the dual graph, a Gluetag is calculated for both facets connected by this edge.The endpoints of an edge are the base of a Gluetag. As Gluetags, an example shown inFigure 3.3, can vary in shape and size, this thesis proposes Gluetags in the shape of atrapezoid as it brings a few advantages.
Two triangles define a trapezoid. Therefore algorithms that are applied to triangles of themesh can be applied to the Gluetags without altering them. As the top of the trapezoidis smaller than the base, Gluetags that are placed next to each other are less likely tooverlap compared to rectangular Gluetags. The algorithm calculates the height of theGluetag depending on the targeted facet so that it takes up a maximum of 20 percent ofthe targeted facets space. The height of the Gluetag is an experimental value, as well asthe shape, to provide users enough extra space, while not shrinking the solution spacefurther than necessary.
Gluetags are calculated once after the dual graph was calculated, as the edges they arelinked to do not change. The algorithm chooses the Gluetags based on the calculatedminimum spanning tree.
4.3 Calculating a Minimum Spanning TreeIn the first step, as shown in Figure 4.1, the algorithm calculates a minimum spanningtree from the dual graph. This is done using Kruskal’s Algorithm [Kru56] to find theshortest spanning subtree.
For this, the edges are sorted by their weight in ascending order. Then the algorithmiterates through all edges and adds each edge to an adjacency list. This list is used tocheck if the recently added edge causes the graph to be cyclic. If this is the case, theedge last added is removed and inserted into a list containing the cut edges. Otherwise,
16

4.4. Unfolding the 3D Mesh using the Minimum Spanning Tree of its Dual Graph
x
y
zA
B / A
C / B
C
(a) 3D Mesh of a box.
x
y
a b / a
c / b c1c2
(b) Unfolding of the first two triangles.
Figure 4.2: 3D model of a box and the unfolding of the first two triangles.
the edge is added to a list containing the bend edges. Furthermore, for each iteration,we save the information which face is discovered, so we can assure that the graph is aconnected graph besides being acyclic, which is necessary. As a result, the adjacency listdefines a minimum spanning tree.
To be able to calculate different minimum spanning trees, the weights of an edge ischanged on each iteration, which is part of the simulated annealing process. Fur furtherdetails see chapter 5.
4.4 Unfolding the 3D Mesh using the Minimum SpanningTree of its Dual Graph
Following the calculation of the minimum spanning tree, as shown in Figure 4.1, anunfolding of the mesh is calculated. The adjacency list of the last step can be used todetermine the order of the faces for unfolding.
Let T = (A, B, C) be a triangle defined by three vertices A(xA, yA, zA), B(xB, yB, zB)and C(xC , yC , zC), where xN , yN and zN , with N ∈ {A, B, C}, are the coordinates ofeach vertex. Let Tp = (a, b, c) be the planar representation of the given triangle, definedby a(xa, ya), b(xb, yb) and c(xc, yc), where again xn, yn, with n ∈ {a, b, c}, are the definingcoordinates of each vertex.
The first face, which is on index zero of the adjacency list, the green triangle (A, B, C) infigure 4.2, that is unfolded is treated as a particular case, as the later triangles depend onthe position of the vertices of the first triangle. Let A be the vertices of the first triangle,and it is set to (0, 0) disregarding the position of A as it is not relevant. The algorithmcalculates b by calculating the distance AB as it is equal to ab, which can be calculatedas AB = ab =
√(xA − xB)2 + (yA − yB)2 + (zA − zB)2.
17

4. Methodology
Now b can be set to (AB, 0), with y being set to 0 as the original orientation of thetriangle does not need to be retained. The last vertices c is again a particular case. Twosolutions are possible for c, as it can be placed on either side of the edge (a− b).
s = ‖(B −A)× (C −A)‖(AB)2
d = (B −A) · (C −A)(AB)2
cx = ax + d(bx − ax)− s(by − ay)cy = ay + d(by − ay) + s(bx − ax)
(4.1)
The first candidate solution for c1 = (cx, cy) is defined by the formulas 4.1. The secondcandidate solution for c2 can be calculated by the formulas 4.2.
cx = ax + d(bx − ax) + s(by − ay)cy = ay + d(by − ay)− s(bx − ax)
(4.2)
For the first triangle, either c1 or c2 can be chosen, as it only changes in which directionthe other vertices are unfolded. For all other triangles a check needs to be performed, sothat c is not on the same side as it is for the previous triangle.
Now let cprev = (axprev , ayprev ) be the vertex of the previous triangle that it does notshare with the current triangle, as seen in figure 4.2. To calculate the side on which thevertex c has to be put can be determined by the formula 4.3.
f = (cx − ax) ∗ (by − ay)− (cy − ay) ∗ (bx − ax) (4.3)
In theory these formulas can yield three different results f < 0 for one side, f > 0 for theother side and f = 0 if it is on the line. But as we do not have any degenerate triangles inour mesh there are two cases. f needs to be calculated for cprev and for the two solutionsof the previous formula c1 and c2. Now we are left with two possibilities, if fprev < 0and fc1 > 0 or if fprev > 0 and fc1 < 0 then we set c = c1, otherwise c = c2. In case offigure 4.2 the previous vertices that is not shared is left of the shared edge, therefore thevertices c is set on the right side.
The unfolding of Gluetags works in the same way, as the Gluetag consists of two triangles.
4.5 Detecting OverlapsThe last step of the simulated annealing loop, as shown in figure 4.1, is to determinethe quality of the unfolding. As a measurement for the quality, merely the sum of the
18

4.5. Detecting Overlaps
P
R
Q
A
B
C
PQ
AB
(a) Two triangles T = (A, B, C) andS = (P, Q, R) overlapping each other.
PQ
A
B
(b) AB and PQ intersecting each other.
Figure 4.3: Overlaps of triangles resulting in different overlapping areas.
(a) Two triangles overlap each other,resulting in a triangle describing thered overlap area.
(b) Two triangles overlap each other,resulting in a polygon describing thered overlap area.
Figure 4.4: Overlaps of triangles resulting in different overlapping areas.
overlapping areas is used. Overlaps, as seen in Figure 4.4, can happen between triangles,triangles and Gluetags or between Gluetags.
The detection is a two-step process. First, only the triangles are checked if they overlapeach other. In the second step, if no triangles overlap each other, the Gluetags arechecked if they overlap each other or a triangle. The algorithm checks if any of their linesintersect with each other to find out if triangles overlap.
Let T = (A, B, C) and S = (P, Q, R) be two triangles in figure 4.3 that might beoverlapping each other, defined by their points A, B, C, P , Q, R. Therefore we checkthe lines AB and PQ, as seen in figure 4.3b, if they intersect with each other. For twoline segments, we define a general case for overlaps and a special case. In general thelines intersect only if the points (A, B, P ) (dotted green line) and (A, B, Q) (solid greenline) have different orientations as well as (P, Q, A) (dotted red line) and (P, Q, B) (solidred line) have different orientations. In figure 4.3, it can be seen that the green lines have
19

4. Methodology
P
R
Q
A
B
C
(a) Two triangles T = (A, B, C) andS = (P, Q, R) not overlapping eachother.
P
Q
A
B
(b) AB and PQ not intersecting eachother.
Figure 4.5: Overlaps of triangles resulting in different overlapping areas.
A B
C
PQ
R
(a) Two triangles T = (A, B, C) andS = (P, Q, R) overlapping each other.
A B PQ
(b) AB and PQ are colinear and inter-sect each other.
Figure 4.6: Two triangles overlapping each other, due to colinear lines.
different orientations and red lines too. Therefore the lines intersect, which means thatthe triangles overlap each other. This test is repeated for every pair of lines.
Figure 4.5 shows two triangles that do not intersect each other, as (A, B, Q) and (A, B, P )have different orientations, but (P, Q, A) and (P, Q, B) have the same orientation, there-fore the triangles do not intersect.
For the special case, the lines intersect, if all four point-triplets are co-linear and thex-projections of (A, B) and (P, Q) intersect and the y-projections of (A, B) and (P, Q)intersect as well, which can be seen in figure 4.6.
The proposed solution calculates for every pair of lines of the two triangles if they intersect.If at least one pair of lines intersect with each other, it means that the triangles intersect.The overlap detection does not need to be done with the child of another triangle as theyshare an edge and therefore cannot overlap, as the child is unfolded onto the other sideof the shared edge, as explained in section 4.4.
After detecting that an overlap occurs, the algorithm calculates the area of the polygon,
20

4.5. Detecting Overlaps
Algorithm 4.1: Sutherland-Hodgman pseudo algorithm. Adapted from [Wik19].Data: Clipping Polygon, Subject PolygonResult: List of vertices of the intersection polygon
1 List output = Subject Polygon Vertices;2 while Edge clipedge in Clipping Polygon do3 List input = output;4 clear output;5 Point S = input.last();6 while Point E in inputlist do7 if E inside clipedge then8 if S not inside clipedge then9 output.add(ComputeIntersection(S,E,clipedge));
10 end11 add E to output;12 else13 if S inside clipedge then14 output.add(ComputeIntersection(S,E,clipedge));15 end16 S = E;17 end18 end19 end20 return output;
which describes the overlap, to determine quality of the current configuration, the overlap-ping area is calculated using the Sutherland-Hodgman Clipping algorithm [SH74]. Thisalgorithm finds the vertices of the intersection polygon created by the two triangles. Theoverlap can be described as a polygon, and it can be either be defined at least as a triangle,see Figure 4.4a, or a polygon with a degree, see Figure 4.4b, depending on how the trianglesoverlap each other. Algorithm 4.1 shows the pseudo-code for the Sutherland-HodgmanClipping algorithm, where the input is two polygons, in our case, the two triangles that in-tersect. The vertices list resulting from this algorithm can be used to calculate the area us-ing the shoelace formula [ŠVV17] Area = 1
2
∣∣∣∑P−1i=0 xiyi+1 + xny1 −
∑n−1i=1 xi+1yi − x1yn
∣∣∣where xi and yi are the coordinates of the i-th point in P. It is a mathematical algorithmto calculate the area of a simple polygon, that is described by ordered points P in aplane.
21


CHAPTER 5Implementation
This chapter specifies on which computer system the proposed approach is developed aswell as the libraries that are used. Further, the implementation details of the simulatedannealing process are explained.
5.1 SpecificationsThe system is implemented on a laptop with an Intel Core i7 CPU (4 cores @ 3.3 GHz,4MB Cache) and 8GB RAM. The source code is written in C++17, and the OpenGL4.5 library is used for the visualisation of the algorithms step as well as the results.The CGAL 4.13 library is used to read in off-Files and to provide the underlying datastructure. The Graphical User Interface (GUI) is developed using the Qt Library 5.13.CMake 3.14 is used to manage the build process, and it compiles on an Ubuntu 18.04.02LTS operating system.
5.2 Simulated AnnealingThe four important components required to use a simulated annealing process explainedin section 2.2, are defined as:
• System Description The system configuration P is described as a list of edgesthat will be bent and the complementary list of edges that are cut. Furthermore,the facets attached to the edges, as well as the Gluetags attached to some of thecut edges.
• Random Move To alter the configuration P randomly to configuration P ′, arandom edge of the full edge list has its weight changed, therefore the minimumspanning tree that is calculated changes.
23

5. Implementation
• Quantitative Function To evaluate the system configuration E(P ), the sum ofthe overlapping areas is used.
• Annealing Schedule The temperature T is set to 50.000 as a standard but canbe configured, and the cooling rate is set to 1.0. Therefore the temperature equalsthe number of iterations.
After reading in the mesh into the Polyhedron_3 data structure preparations are necessaryto be able to apply simulated annealing. First as described in chapter 4, the algorithmcalculates a dual graph and Gluetags, for each edge of the dual graph, as each edgecould be a possible cut edge. Furthermore, it sets the temperature, and the cooling rateto 100.000 and 1.0 per iteration, as experimental values, defining the run-time of theannealing process.
The algorithm assigns each edge of the dual graph a random weight and then sorts the list.Then it calculates an initial spanning tree using the edge list. Glue tags are calculatedfor all edges that will be cut, which are the edges not present in the minimum spanningtree. The algorithm iterates through all pre-calculated Gluetags and chooses a Gluetag ifthey fulfil the following conditions:
• The edge the Gluetag is attached to is a cut edge
• The opposite Gluetag was not already added to this edge
• The number of cut edges, that have no Gluetag yet is higher than 1, or neither thesource face for the Gluetag nor the face the Gluetag targets has a Gluetag yet
The algorithm discards all Gluetags that do not fulfil these conditions, as they are notneeded for this unfolding. These conditions ensure that the reconstructed model will bestable when glued together without faces being loose, but they also minimise the numberof Gluetags to reduce time and effort on reconstruction.
After these steps, the algorithm starts unfolding the triangles and the Gluetags alike, asseen in figure 5.1. It calculates the area of triangle-triangle overlaps, Gluetag-triangleoverlaps, and Gluetag-Gluetag overlaps. This approach proposes to weigh triangle-triangleoverlaps with a factor of 100, so the algorithm prefers to unfold triangles without overlapsfirst and afterwards solving Gluetag related overlaps. This step is used to optimise thecalculation time as well as to influence the evolving graph. This prioritisation is appliedsince a configuration that does not have any Gluetag overlaps, but still has triangleoverlaps is less optimal than the other way around. If no triangle-triangle overlaps occurin a configuration and only Gluetags overlap are left, these have a chance to be resolvedfor example by changing which Gluetags are used or by post-processing the size of theGluetags.
The calculated area is then used as the energy of the graph, which we try to minimisein this process. This initial configuration is saved as the best configuration P , as seen
24

5.2. Simulated Annealing
Unfold PInit P and T
Calculate E(P )
Calculate E(P ′)
Unfold P ′Generate P ′ from
P ; decrease T
E(P ′) ≤ E(P ) rand(0, 1) > 1 −e−(T +E(P ′)/(Tmax)
E(P ′) ≤ 0or T ≤ 0
Set P = P ′
Finish
true
false true
false
false
true
Figure 5.1: Overview of the simulated annealing process.
25

5. Implementation
in figure 5.1. For each following iteration before these steps are repeated. A randomedge will be chosen and assigned a new random weight, which possibly changes the nextcalculated minimum spanning tree and generates the configuration P ′.
First, the algorithm unfolds the triangles and evaluates the energy of the graph basedon the sum of the overlapping area. If and only if the triangles are unfolded withoutoverlaps, it unfolds the Gluetags next. This approach saves computation time, as if thetriangles do not unfold without overlaps, no solution is found.
If the energy of the new configuration P ′ is smaller or equal to the energy of the previousconfiguration P , P will be set to P ′. If not the configuration is treated probabilistically.If a uniformly distributed random number is smaller than P (∆E) = 1− e−(T +E)/(Tmax)
the new configuration will be accepted as the best configuration. This condition shouldensure that the algorithm does not get stuck in a local minimum, which would mean thatit would not find an optimal global solution.
At the end of every iteration, if a new best configuration was found the new configurationwill be visualised using OpenGL, which means that it only changes and impacts calculationtime of each iteration if a better configuration was found.
The annealing process ends if it does not find any overlaps in configuration P ′ or ifthe temperature reaches the minimum of 0, which means that it ends without findinga solution for this problem. Advantages and disadvantages using this random walkapproach will be discussed in section 6.3.
5.3 Parameterisation of the SystemThe algorithm is adjustable by changing multiple parameters without changing theapproach itself.
Gluetag size is the most influential parameter that can be changed. Depending on thesize of the Gluetag, the solution space is widened or made smaller if the Gluetags areaincreases. The default value is for it to be one fifth of the height of the face it targets.
Probabilistic treatment of worse iterations can also be changed to either favourtaking a worse iteration more or less often. If the probability is too high to take a worseiteration, the algorithm will not find a solution and might not even get close to a solutionif the probability is too low, the chance of getting stuck in local minimums increases.
Number of iteration can be controlled by changing the cooling down rate as well asthe maximum and minimum temperature, therefore changing the time the algorithm hasto find a solution. The default number of iterations is 100.000.
By tuning these parameters, the results can be influenced to get better performance ormake finding an even unfolding possible.
26

CHAPTER 6Results and Evaluation of the
System
In this chapter experimental results are presented and their specifics are discussed. Aquantitative performance analysis is also presented, analysing the time it takes to unfoldvarious models. Furthermore, the limitations of the suggested approach are presented.
6.1 ResultsThis thesis proposes a simple spanning tree approach to find unfoldings of a mesh. Asimulated annealing process is optimising the search for an overlap free unfolding byfinding an optimal global layout.
The following figures show the resulting unfolding of the implementation. The Gluetagsare visualised in the 3D-Model and the unfolding, furthermore, the minimum spanningtree (green lines) and cut-edges (red lines) are visualised in the 3D-Model.
Figure 6.1 and 6.2 are sphere-like objects with a low count of faces, which is optimal forthe proposed algorithm, as a solution can be found fast. For figure 6.1 three differentunfoldings were generated, each having a different shape while it was reached in a differentamount of time. This is due to the non-determinism of the algorithm, as well as therandom walk when searching an unfolding.
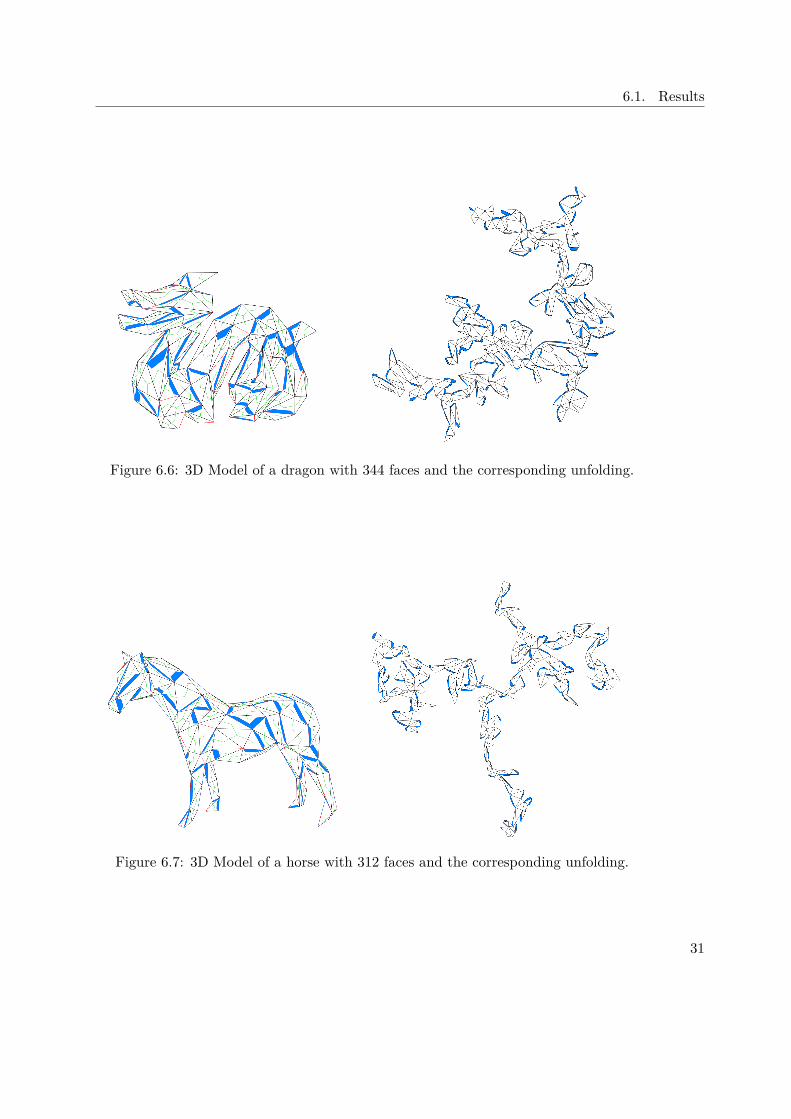
Contrary to the previous two figures figure 6.3 and 6.4 are star-like objects with 6.3having a higher amount of faces. Both of them are harder to solve as they lose theirspherical properties, which make unfolding easier. Figure 6.4 also shows the stretchingof the unfolding that happens due to the structure of the model, which can also beobserved in figure 6.7. It has very steep angles, which increases the likelihood to produceoverlapping faces when unfolded more compact. This makes it harder to compute anunfolding, as the random walk takes more time to stretch out the unfolding.
27

6. Results and Evaluation of the System
(a) 3D model of a star. (b) Unfolding of the model in 31 seconds.
(c) Unfolding of the model in 18 seconds. (d) Unfolding of the model in 77 seconds.
Figure 6.1: 3D Model with 72 faces and three possible unfoldings.
28

6.1. Results
Figure 6.2: 3D Model of a star with 96 faces and the corresponding unfolding.
Figure 6.3: 3D Model of a star with 216 faces and the corresponding unfolding.
29

6. Results and Evaluation of the System
Figure 6.4: 3D Model of a star with 96 faces and the corresponding unfolding.
Figure 6.5: 3D Model of a tiger head with 112 faces and the corresponding unfolding.
Figures 6.5 to 6.11 are organic-like meshes with an increasing face count. The averagetime to find an unfolding increases, as can be seen in table 6.1, but still results areproduced. Most of the higher face-count models produce stretched-out unfoldings, as theGluetags make compact solutions less likely due to their need for space between faces.
30
6.1. Results
Figure 6.6: 3D Model of a dragon with 344 faces and the corresponding unfolding.
Figure 6.7: 3D Model of a horse with 312 faces and the corresponding unfolding.
31

6. Results and Evaluation of the System
Figure 6.8: 3D Model of a hand with 336 faces and the corresponding unfolding.
Figure 6.9: 3D Model of an armadillo with 386 faces and the corresponding unfolding.
32

6.1. Results
Figure 6.10: 3D Model of Winnie Pooh with 392 faces and the corresponding unfolding.
Figure 6.11: 3D Model of an cat with 392 faces and the corresponding unfolding.
33

6. Results and Evaluation of the System
6.2 Performance
To evaluate the algorithm and its implementation experiments were run with a varietyof models. The results in table 6.1 were observed using a Gluetag that is defined as atrapezoid with the base being the edge of the to-glue triangles and the top being one halfof the base with a maximum height of one-fifth of the size of the triangle being targetedby the Gluetag. The default parameters have been used for these experiments.
Time to Time toModel Vertices Faces Edges Unfold (s) Bruteforce (s)Octa 6 8 12 0 0Icosa 12 20 30 0 0Star 14 24 36 8 19Star-Sqrt3 (Fig. 6.1) 38 72 108 31 >60000Star-4Split 50 96 144 435 -Star-Loop (Fig. 6.2) 50 96 144 137 -Star-Butterfly (Fig. 6.4) 50 96 144 1047 -Tiger (Fig. 6.5) 58 112 168 65 -Kitten 64 122 184 48 -Moneybox-128 64 128 190 160 -Bunny-128 66 128 192 103 -Moneybox-196 98 196 292 324 -Star-PNsplit (Fig. 6.3) 110 216 324 625 -Snail-286 145 286 429 1315 -Horse (Fig. 6.7) 152 302 452 946 -Hand (Fig. 6.8) 170 336 504 1377 -Dragon (Fig. 6.6) 172 344 514 1292 -Bunny-348 176 348 522 976 -Luigi 180 356 534 686 -Armadillo (Fig. 6.9) 195 386 579 730 -Pooh (Fig. 6.10) 198 392 588 957 -Moneybox-392 (Fig. 6.11) 196 392 586 2200 -Meister (Fig. 6.12) 200 394 592 3900 -Gear 256 508 762 - -Cat 353 702 1053 - -Fish 477 950 1425 - -Mannequin 690 1376 2064 - -
Table 6.1: Table showing the unfolding performance for different models
Performance is not only influenced by the number of faces, but also by the size of Gluetags.The bigger the Gluetags are, the more iterations are necessary to find an unfolding, oran unfolding might no longer be possible. Due to the random walk, the time to find anunfolding is not depending on the number of faces. Table 6.1 shows that not only thenumber of faces influence the time it takes to find a solution, but it also depends on how
34

6.3. Limitations
Figure 6.12: 3D Model of the Meister with 400 faces with the failed unfolding after100000 iterations. Overlapping Gluetags are coloured red.
and which edges are changed. For models marked with a - in the table 6.1 no unfoldingwas found within 100000 iterations. Using a bruteforce algorithm solutions for smallmodels is possible, but as the number of faces grows the calculation using bruteforce isnot feasible anymore.
6.3 Limitations
Multiple factors limit the suggested approach. The target of the approach is to solve theproblem only considering the global optimum, disregarding local overlaps. Therefore thelatter are hard to resolve, as they are not explicitly targeted.
Another limitation is that the Gluetags that are necessary cannot be calculated beforehand.Neither the amount nor the position of the Gluetags can be calculated, without using aheuristic approach or brute force, whereas brute force is not feasible as the performanceeven with small models is abysmal. This can be seen in the performance table 6.1, whereeven for small models the amount of time necessary for a brute force algorithm to find asolution is too high even for small models.
Another limitation that does not have only negative consequences is the random-walk
35

6. Results and Evaluation of the System
Figure 6.13: (left) Unfolding of the proposed approach. (right) Unfolding with thealgorithm proposed by Takahashi et al.[TWS+11]
approach used in the simulated annealing. A random edge is chosen and changed ineach iteration, which might not change the minimum spanning tree that is generated. Itcan happen that an edge that is causing an overlap does not change for many iterations.Figure 6.12 shows an unfolding proposed after 100,000 iterations that failed to generatean overlap-free solution. When the iteration cap was lifted, an unfolding could be found,as seen in figure 6.13, after around 130,000 iterations. The figure also shows a comparisonbetween the approach suggested in this thesis and the algorithm proposed by Takahashiet al.[TWS+11]. The unfolding of their approach can be more since no Gluetags arerestricting the space used.
36

CHAPTER 7Conclusion
In this chapter a short summary of the results is provided and future work is presented.
7.1 SummaryCalculating an unfolding using a minimum spanning tree approach is possible and canyield excellent performance for smaller meshes. As meshes have increased numbers of facesand Gluetags increase in size, the worse the algorithm is performing. The reconstructionis almost impossible without any visual cues on which edges should be folded or gluedfirst, but this factor can be disregarded as it can be added using this approach by a moresignificant setback is that the unfolding is more or less random and structures of the3D-Model might not be well conserved into the unfolding. All in all, the approach issimple to implement as no sophisticated algorithms are needed, and it yields results inan acceptable amount of time for models with less than 200 faces.
7.2 Future WorkThe quality of the unfolding could be improved, by not only measuring the unfolding qual-ity using the overlap area but also considering other factors, like maintaining structuresof the mesh together to assist users in the reconstruction of the models.
Another possible improvement would be to ensure efficient use of paper space. Thismainly requires the avoidance of stretched out unfoldings as seen in Figure 6.4. Toachieve this, the quality metric of the unfolding can be evaluated not only using theoverlapping area but also a value that describes how stretched out the unfolding is.
Performance can be improved, if Gluetags are post-processed to change their shape ifthe overlap area is rather small. With this improvement, the computation time canbe reduced significantly, without impacting other parts of the approach. To compute
37

7. Conclusion
necessary modifications to the Gluetag the intersection points of the Gluetag and thetriangle can be taken as new vertices of the Gluetag.
Once an unfolding with Gluetags for a model is found, a greedy algorithm could be usedto minimise the number of Gluetags necessary. Currently, the amount of Gluetags isdetermined by the order in which the Gluetags are added. Therefore it can result inusing more Gluetags than necessary for the particular unfolding.
To avoid manual adjustment of the maximum number of iterations required to findunfoldings for large models, the number of required iterations might be calculated usingan exponential function using the number of faces of the mesh.
38

List of Figures
1.1 Two papercraft models. . . . . . . . . . . . . . . . . . . . . . . . . . . . . . 1
3.1 CGAL Polyhedron_3 datastructure visualised. Adapted from the CGAL usermanual [The19]. . . . . . . . . . . . . . . . . . . . . . . . . . . . . . . . . 10
3.2 (black) Shows a graph with undirected edges. (green solid and dotted) Showsthe graphs complete dual graph. (green solid) Shows a minimum spanningtree of the dual graph. . . . . . . . . . . . . . . . . . . . . . . . . . . . . . . 11
3.3 Exemplary trapezoid Gluetag (green) attached to its source triangle edge(blue) and the triangle it will be glued to (red). . . . . . . . . . . . . . . . 12
4.1 Overview of the 3D Mesh-Unfolding Process. . . . . . . . . . . . . . . . . 154.2 3D model of a box and the unfolding of the first two triangles. . . . . . . 174.3 Overlaps of triangles resulting in different overlapping areas. . . . . . . . 194.4 Overlaps of triangles resulting in different overlapping areas. . . . . . . . 194.5 Overlaps of triangles resulting in different overlapping areas. . . . . . . . 204.6 Two triangles overlapping each other, due to colinear lines. . . . . . . . . 20
5.1 Overview of the simulated annealing process. . . . . . . . . . . . . . . . . 25
6.1 3D Model with 72 faces and three possible unfoldings. . . . . . . . . . . . 286.2 3D Model of a star with 96 faces and the corresponding unfolding. . . . . 296.3 3D Model of a star with 216 faces and the corresponding unfolding. . . . 296.4 3D Model of a star with 96 faces and the corresponding unfolding. . . . . 306.5 3D Model of a tiger head with 112 faces and the corresponding unfolding. 306.6 3D Model of a dragon with 344 faces and the corresponding unfolding. . . . 316.7 3D Model of a horse with 312 faces and the corresponding unfolding. . . . . 316.8 3D Model of a hand with 336 faces and the corresponding unfolding. . . . 326.9 3D Model of an armadillo with 386 faces and the corresponding unfolding. 326.10 3D Model of Winnie Pooh with 392 faces and the corresponding unfolding. 336.11 3D Model of an cat with 392 faces and the corresponding unfolding. . . . 336.12 3D Model of the Meister with 400 faces with the failed unfolding after 100000
iterations. Overlapping Gluetags are coloured red. . . . . . . . . . . . . . 356.13 (left) Unfolding of the proposed approach. (right) Unfolding with the algorithm
proposed by Takahashi et al.[TWS+11] . . . . . . . . . . . . . . . . . . . 36
39


List of Tables
6.1 Table showing the unfolding performance for different models . . . . . . . 34
41


List of Algorithms
4.1 Sutherland-Hodgman pseudo algorithm. Adapted from [Wik19]. . . . . . 21
43

Bibliography
[AMOT90] Ravindra K Ahuja, Kurt Mehlhorn, James Orlin, and Robert E Tarjan.Faster algorithms for the shortest path problem. Journal of the ACM(JACM), 37(2):213–223, 1990.
[BM95] Stephen P Brooks and Byron JT Morgan. Optimization using simu-lated annealing. Journal of the Royal Statistical Society: Series D (TheStatistician), 44(2):241–257, 1995.
[CT76] David Cheriton and Robert Endre Tarjan. Finding minimum spanningtrees. SIAM Journal on Computing, 5(4):724, 1976.
[CY17] Yi-Jun Chang and Hsu-Chun Yen. Improved algorithms for grid-unfoldingorthogonal polyhedra. International Journal of Computational Geometry& Applications, 27(01n02):33–56, 2017.
[DA91] Anton Dekkers and Emile Aarts. Global optimization and simulatedannealing. Mathematical programming, 50(1-3):367–393, 1991.
[DDF14] Mirela Damian, Erik D Demaine, and Robin Flatland. Unfolding orthogo-nal polyhedra with quadratic refinement: the delta-unfolding algorithm.Graphs and Combinatorics, 30(1):125–140, 2014.
[DFO07] Mirela Damian, Robin Flatland, and Joseph O’rourke. Epsilon-unfoldingorthogonal polyhedra. Graphs and Combinatorics, 23(1):179–194, 2007.
[DT96] Ronald A DeVore and Vladimir N Temlyakov. Some remarks on greedyalgorithms. Advances in computational Mathematics, 5(1):173–187, 1996.
[FTS+13] Samuel M Felton, Michael T Tolley, ByungHyun Shin, Cagdas D Onal,Erik D Demaine, Daniela Rus, and Robert J Wood. Self-folding withshape memory composites. Soft Matter, 9(32):7688–7694, 2013.
[GFR94] William L Goffe, Gary D Ferrier, and John Rogers. Global optimizationof statistical functions with simulated annealing. Journal of econometrics,60(1-2):65–99, 1994.
45
[GY04] Jonathan L Gross and Jay Yellen. Handbook of graph theory. CRC press,2004.
[HE12] Thomas Haenselmann and Wolfgang Effelsberg. Optimal strategies forcreating paper models from 3d objects. Multimedia systems, 18(6):519–532,2012.
[KGJV83] S Kirkpatrick, CD Gelatt Jr, and MP Vecchi. Optimization by simulatedannealing. SCIENCE, 220(4598), 1983.
[Kru56] Joseph B Kruskal. On the shortest spanning subtree of a graph and thetraveling salesman problem. Proceedings of the American Mathematicalsociety, 7(1):48–50, 1956.
[LES08] Kwang Y Lee and Mohamed A El-Sharkawi. Modern heuristic optimizationtechniques: theory and applications to power systems, volume 39. JohnWiley & Sons, 2008.
[MGPO89] Miroslaw Malek, Mohan Guruswamy, Mihir Pandya, and Howard Owens.Serial and parallel simulated annealing and tabu search algorithms for thetraveling salesman problem. Annals of Operations Research, 21(1):59–84,1989.
[MS04] Jun Mitani and Hiromasa Suzuki. Making papercraft toys from meshesusing strip-based approximate unfolding. In ACM transactions on graphics(TOG), volume 23, pages 259–263. ACM, 2004.
[PBARCC90] J Pannetier, J Bassas-Alsina, J Rodriguez-Carvajal, and V Caignaert.Prediction of crystal structures from crystal chemistry rules by simulatedannealing. Nature, 346(6282):343, 1990.
[SDJ95] Jon M Sutter, Steve L Dixon, and Peter C Jurs. Automated descriptorselection for quantitative structure-activity relationships using general-ized simulated annealing. Journal of chemical information and computersciences, 35(1):77–84, 1995.
[SH74] Ivan E Sutherland and Gary W Hodgman. Reentrant polygon clipping.Communications of the ACM, 17(1):32–42, 1974.
[She75] Geoffrey C Shephard. Convex polytopes with convex nets. In MathematicalProceedings of the Cambridge Philosophical Society, volume 78, pages 389–403. Cambridge University Press, 1975.
[SP11] R Straub and H Prautzsch. Creating optimized cut-out sheets for papermodels from meshes. 2011.
46
[ŠVV17] Martin Šlapák, Josef Vojtěch, and Radek Velc. Automated numerical cal-culation of sagnac correction for photonic paths. Optics Communications,389:230–233, 2017.
[The19] The CGAL Project. CGAL User and Reference Manual. CGAL EditorialBoard, 4.14 edition, 2019.
[Tib14] Skylar Tibbits. 4d printing: multi-material shape change. ArchitecturalDesign, 84(1):116–121, 2014.
[TWS+11] Shigeo Takahashi, Hsiang-Yun Wu, Seow Hui Saw, Chun-Cheng Lin, andHsu-Chun Yen. Optimized topological surgery for unfolding 3d meshes.In Computer graphics forum, volume 30, pages 2077–2086. Wiley OnlineLibrary, 2011.
[Wik19] Wikipedia contributors. Sutherland–hodgman algorithm, 2019. [Online;accessed 01-August-2019].
[XKKL16] Zhonghua Xi, Yun-hyeong Kim, Young J Kim, and Jyh-Ming Lien. Learn-ing to segment and unfold polyhedral mesh from failures. Computers &Graphics, 58:139–149, 2016.
47