Optimised and balanced structural of offshore wind turbines
86
Risø-R-1420(EN) Optimised and Balanced Structural and System Reliability of Offshore Wind Turbines An account Niels Jacob Tarp-Johansen, Risø National Laboratory Igor Kozine, Risø National Laboratory Luc Rademarkers, Netherlands Energy Research Foundation John Dalsgaard Sørensen, Aalborg University Knut Ronold, Det Norske Veritas Risø National Laboratory, Roskilde April 2005
-
Upload
piksi-ganesha-bandung -
Category
Business
-
view
856 -
download
2
Transcript of Optimised and balanced structural of offshore wind turbines
Risø-R-1420(EN)
Optimised and Balanced Structural and System Reliability of Offshore Wind Turbines An account Niels Jacob Tarp-Johansen, Risø National Laboratory Igor Kozine, Risø National Laboratory Luc Rademarkers, Netherlands Energy Research Foundation John Dalsgaard Sørensen, Aalborg University Knut Ronold, Det Norske Veritas
Risø National Laboratory, Roskilde April 2005

Abstract This report gives the results of the research project “Optimised and Uniform Safety and Reliability of Offshore Wind Turbines (an account)”. The main sub-ject of the project has been the account of the state-of-the art of knowledge about, and/or attempts to, harmonisation of the structural reliability of wind tur-bines, on the one hand, and the reliability of the wind turbine’s control/safety system, on the other hand. Within the project some research pointing ahead has also been conducted.
ISBN 87-550-3240-0; 87-550-3241-9 (Internet) ISSN 0106-2840
Print: Danka Services International A/S, 2005
Contents
Preface 5
Introduction 7
1 State-of-the-Art 9 1.1 Safety Philosophy of Wind Turbines System Reliability 9 1.2 Structural Reliability 11 1.2.1 Blade Design 12 1.2.2 Support Structure 13 1.3 Risk Analysis 14
2 Framework 15 2.1 General Framework 15 2.2 Refined and Feasible Framework 17 2.3 Compatibility of the Methods of System Reliability and Structural Reliability 20
3 System Reliability 23 3.1 Factors that influence the system reliability 23 3.2 Analysis of major wind turbine failures taking place in 1984-2000 in Denmark 26 3.2.1 Introduction to the analysis 26 3.2.2 Failure Data Analysis 27 3.2.3 Detailed conclusions drawn from the failure data analysis 27 3.3 Forecasting system reliabilities 30 3.4 Gaining more insight from the data analysis and developed approach 31
4 Structural Reliability 35 4.1 Structural Reliability – Aerodynamic Loads 35 4.1.1 Typical Reliability Levels 37 4.1.2 IEC Reliability levels 38 4.2 Structural Reliability – Hydrodynamic Loads 39 4.3 Cost-Optimal Structural Reliability of Offshore turbines 44 4.3.1 An example 45 4.4 Comparing the Results of Structural Reliability and System Reliability Assessments 49
5 Conclusions 50 5.1 Project contents 50 5.2 Main conclusions 50 5.3 Some detailed conclusions 51 5.4 Recommendation for future research 52
References 54
Appendix A: Failure data and their classification 56
Appendix B: Model Uncertainties for Wave Loads on Wind Turbine Foundations 78
3 Risø-R-1420(EN)

Appendix C: List of Projects 84
4 Risø-R-1420(EN)
Preface This report constitutes the main report of the project “Optimised and Uniform Safety and Reliability of Offshore Wind Turbines (an account)” under the Dan-ish Public Service Obligation (PSO) research programme financed by the Dan-ish power supply companies ELKRAFT system and ELSAM. This project has been supported by ELKRAFT system under contract no. BRO-91.058 (PSO no. FU1101). Other reports, which support the conclusions drawn herein, have been prepared during the course of the project. These are
• Background document for Partial Safety Factors for Extreme Load Ef-fects, Proposal for the 3rd Ed. of IEC 61400: Wind Turbine Generator Systems - Part 1: Safety Requirements
• Examples of application of Bayesian probabilistic networks • Reliability-based optimization of wind turbines
Out of these reports the first report has, in approximately equal shares, been co-supported by another PSO-project, namely “Offshoremøller, kombinerede las-ter” (contract no. BRO-91.007, PSO no. FU0013 (ELKRAFT system)), and by the EU project “Recommendations For Design Of Offshore Wind Turbines” project no. ENK5-CT-2000-00322.
5 Risø-R-1420(EN)

6 Risø-R-1420(EN)
Introduction The reliability of wind turbines against wind loads does not depend on the strength of the load carrying components of the turbine structure and the wind climate alone. A wind turbine is equipped with a control/safety system that, among many other things, is supposed to bring the turbine into a load-reducing mode if the wind speed rises above some predefined level, typically known as the cut-out wind speed. The control/safety system is also supposed to bring the turbine to calm in case of accidental events like over-speed. Thus the reliability of a turbine against wind loads clearly depends also on the reliability of the con-trol/safety system. In current design practise the implicit basic assumption is that the control/safety system should never fail, which is ensured through redundancy. If this holds true in reality the reliability of wind turbines against wind loads will of course not depend on the control/safety system. (That is, the reliability will not depend on the control/safety system to the extent that it has been designed to cover all possible events that would reasonably require its activation, but this has nothing to do with its reliability.) There is no reason to believe that control/safety systems, even if they are prop-erly maintained, will never fail in practise. This is completely analogous to the fact that one expects the structure of wind turbines to collapse now and then. If a certain level of reliability of wind turbines against wind loads is wanted a suit-able balance between the structural reliability and the system reliability must therefore be found. In the preceding paragraph, and in the remainder of this report, structural reli-ability is used as abbreviation for “the reliability of the wind turbine structure” and system reliability is an abbreviation for “the reliability of the control/safety system”. The authors realise this is not necessarily the same meaning of the terms as is usually used in the specific field of structural reliability methods and in the general field of reliability analysis. The abbreviations are however used for the sake of brevity and readability. In the present report there is made no distinction between the control system and the safety system. This distinction is avoided because long discussions that are not directly relevant to the conclusions of this report can arise. For instance some may argue that the shut down at the cut-out wind speed is a feature of the control system, whereas others may consider it an intervention of the safety sys-tem because it is a prevention against wind loads that may compromise the reli-ability of the turbine. In any case the bottom line is that the same computer gov-erns both the control and the safety systems, which implies that an error in the computer may affect both systems. So, independent of how one distinguishes between the control and the safety system the outcome is the same, namely: the reliability of the mechanisms of the control/safety system affects the over-all reliability of the turbine against wind loads. The project was motivated by the suspicion that there is an unfavourable unbal-ance between the structural reliability and the system reliability of wind tur-bines. To get an account of this subject with focus on offshore turbines has been
7 Risø-R-1420(EN)
the prime aim of the project. In the project it has been documented that for older onshore turbines such an unfavourable unbalance exists. The question is if this is true for newer turbines onshore or offshore as well. It is expected to be much less pronounced, however this has been hard to document, as one of the main obstacles of research in this field has turned out to be the access to both recent and unambiguous failure data for turbine structures or structural components and/or reliable failure data for sub-systems of the control/safety system. Exam-ining structural failure data the unbalance manifests itself as relatively more structural failures initiated by malfunctioning of the control/safety system than by extreme wind loads exceeding the design loads or by material strengths be-low the design strength. Because the control/safety system is considerably cheaper than the turbine structure this unbalance seems unfavourable. One would expect the opposite to be cost-optimal. From the observation of the un-balance the following question emerges:
• Is the unbalance notable? • Is the over-all reliability (i.e. the combined structural and system reli-
ability) acceptable anyways? • If yes to both the above questions, then perhaps the structural reliability
may be reduced and the system reliability slightly increased? • If a higher level of over-all reliability is wanted, would it suffice to in-
crease the system reliability? • Could an even lower level of over-all reliability be accepted?
Bearing these questions in mind, but also realising that they are hard to answer within the current project, the project partners have been looking into the possi-bilities of aiming at possibly lower, i.e. optimised, structural reliability levels for future offshore turbines and of ways to ensure proper balance between struc-tural reliability and system reliability in future wind turbines. The proper bal-ance is not necessarily obtained by uniform reliabilities as implied by the pro-ject title. The project has therefore contained the following tasks
• An account of the state-of-the-art within the areas of structural reliability analysis and system reliability analysis in wind turbine engineering,
• Data analysis on empirical failure data reported for existing wind tur-bines,
• Theoretical assessment of the structural reliability • Theoretical assessment of cost-optimal structural reliability
Though present days data in general cannot support a reliable outcome of the tasks listed the formulation of methodologies for the calibration of structural reliability (which typically leads to assessment of partial safety factors) includ-ing the system reliability is also regarded in the present report. Two cases are considered: 1) the system reliability has a fixed value and the structural reliabil-ity is adjusted so that a given over-all target reliability is reached, and 2) the system reliability and the structural reliability levels are two out of more vari-ables in an optimisation problem leading to cost-optimal over-all reliability. The structure of the report reflects the above task list and its ordering.
8 Risø-R-1420(EN)

1 State-of-the-Art As a first step in the project, it is necessary to make a historical overview of work that has been carried out up to now and to summarise the main conclu-sions in order to determine the white gaps and future R&D needs. Since the beginning of the nineties, ECN, Risø and others have been carrying out projects that aimed at implementing probabilistic design and analysis tech-niques in wind turbine engineering. A list of projects is given in Appendix C, and references [1] through [15] gives a list of documents concerning the subject.
1.1 Safety Philosophy of Wind Turbines System Reliability In case probabilistic design techniques are being used, safety is defined as:
Safety: the probability that a system will perform satisfactorily and without occurrence of accidents, when used under stated conditions.
In case of wind turbines this could be interpreted as the probability that a wind turbine will fail and loose structural parts. Worthwhile mentioning in the gen-eral definition of safety is the phrase “under stated conditions”. In case of wind turbines, the stated conditions are to be considered as the external conditions to which the turbine is designed for. The “stated conditions” correspond to a large extent to the load situations as defined for instance in the national or interna-tional safety standards (e.g. IEC 61400-1). “Stated conditions” are for instance maximum wind speed, maximum turbulence levels, annual frequency of grid loss, etc. When applying the general safety definition to wind turbines, there is a prob-ability that a wind turbine can fail in four situations. 1. if the turbine operates within its operational limits, and the external condi-
tions are within the design values; 2. if the turbine operates outside its operational limits (e.g. overspeed), and the
external conditions are within the design values; 3. if the turbine operates within its operational limits, and the external condi-
tions are more severe than the design conditions (e.g. wind speeds above 1 per 50 year storms);
4. if the turbine operates outside its operational limits (e.g. overspeed), and the external conditions are more severe than the design conditions (e.g. wind speeds above 1 per 50 year storms).
Situation 1: If the turbine fails as long as it is within its operational limits and the external conditions are within the design values, it is very likely that the failure mechanism is a structural failure, e.g.: • insufficient strength due to corrosion, “optimistic” design procedures and
underestimation of loads, unforeseen degradation of material, poor manu-facturing process;
• insufficient pre-tensioning of bolts (bad maintenance?).
9 Risø-R-1420(EN)

Structural reliability analyses (not only very advanced methods but also the use of partial safety factors), seems the best method to deal with such failures. FMECA’s (Failure Mode and Effects and Consequences Analysis, i.e. system reliability) may assist in identifying weak spots in the design and maintenance procedures. Situation 2: If the turbine fails if it is outside its operational limits and the ex-ternal conditions are within the design values, it is very likely that the failure mechanism has to do with failure of the safety system. Normally, the safety sys-tems should prevent the turbine from exceeding its operational limits (over-speed, yaw-misalignment, etc.). Traditionally, and in accordance, with most safety standards (IEC 61400-1, NEN 11400, Danish Codes, GL criteria, ???) a turbine should be equipped with two safety systems that operate independently and are activated diversely. In fact, the safety codes do not give target values for the probability of failure of both safety systems. A detailed qualitative reliability analysis of the safety and control systems could reveal which failure modes are to be considered as “within the operational lim-its” or as “outside the operational limits”. In accordance with safety codes, most single failures are to be considered as normal design situations. As soon as the single failures and the resulting load situations have been identified, one can decide on how to proceed. (1) Further evaluating the load situation and assess the structural integrity (structural reliability) or (2) modifying the design (re-dundancy) and reducing the occurrence frequency of the load situation (system reliability).
Example: A turbine is equipped with two safety systems. During the start-up procedure, the turbine is not grid con-nected. The controller makes use of the rotor speed signal. If the speed sensor fails, it generates “zero speed” and the con-troller allows the rotor to speed up until overspeed is detected by the second overspeed sensor. The turbine will stop by means of an emergency shut down. This situation only reveals from a detailed system analysis. If the reliability of the speed sensing system is high, one can decide to analyse this load situation (structural reliability) as an “ultimate load situation”. If it is expected that the situation will occur frequently, and will lead to unacceptably high fatigue loads, one can decide to improve the reliability of the speed sensing system (system re-liability).
Experiences up to now have learned that situations as given in the example, only reveal if a detailed systems analysis is performed. An event tree analysis is very helpful. Usually, designers focus on failures during normal operation but neglect (component) failures during e.g. start-up and shutdown situations. The design of safety systems of new and large turbines differs from the safety systems of smaller turbines. In the past, turbines were usually equipped with an aerodynamic brake (pitching, tip brakes) and a mechanical brake on the high-speed shaft. In the new turbines, very often three pitch motors are being used. In case of an emergency, they operate independently, however, their activation is not divers. The turbines are not equipped anymore with a second safety system; the brake on the high-speed shaft is usually designed as a parking brake. The reliability of the “old” safety systems and of the “new” safety systems has never been compared up to now in a quantitative way.
10 Risø-R-1420(EN)
Situation 3: If the turbine operates within its operational limits, and the external conditions are more severe than the design conditions (e.g. wind speeds above 1 per 50 year storms), it should be accepted that the load carrying structure of the turbine (blades, tower) would fail. The probability of failure should be derived from meteorological data in combination with the structural integrity of the tur-bine. Situation 4: The situation that the turbine operates outside its operational limits (e.g. overspeed), and the external conditions are more severe than the design conditions (e.g. wind speeds above 1 per 50 year storms) is not a realistic situa-tion. It is very likely that e.g. an overspeed situation is caused by the extreme external conditions. Failure of the turbine is accepted.
It is the conclusion that system reliability and structural reliability can be com-plementary to each other if used as follows. • A qualitative system reliability analysis is a useful to identify “rare” load
situations. Quantitative analyses should be used to determine their occur-rence frequency and to decide on how to deal with these situations: (1) as-sessing the structural integrity or (2) improving the system reliability.
• Structural reliability (in its broad sense) is the means to assess the structural integrity of the turbines under all load situations.
• There will always remain a small probability that the turbine will be de-stroyed by extreme external conditions.
From a designer point of view, system and structural reliability will probably not be combined since the disciplines are so very different. We aware from the fact that some designers use qualitative system reliability methods in there de-sign reviews. However we not know a designer that makes use of structural reli-ability methods in the daily design procedures (apart from partial safety fac-tors!).
1.2 Structural Reliability Although it appears to be a deterministic approach, a first start to introduce structural reliability methods in the design process has been made in design co-des by prescribing partial safety factors, which have been calibrated by means of structural reliability analyses. Such a calibration is by no means a trivial task and structural reliability methods form the formal and rational basis for this. The application of probabilistic methods for partial safety factor calibration is fairly new within the wind industry, but the support for this approach is grow-ing. Probabilistic techniques are used in the latest version of IEC 61400-1. To fur-ther introduce structural reliability methods in the design procedures of wind turbines, two separate, but closely related routes should be developed. Probabil-istic design methods possibly with accompanying computer programs should be made available for manufacturers of wind turbines and suppliers of wind turbine components, such as blades and support structures. At the same time design codes should be adjusted in the way that target values for reliability should be included (along with associated standard probabilistic models covering inherent, statistical and epistemic uncertainties) as well as the conventional partial safety factors for a traditional deterministic design approach. In this way a designer
11 Risø-R-1420(EN)
can consider to apply the sophisticated approach by using probabilistic methods, with the intention to manufacture his components more economically. To support this process some of the project partners have been involved in a number of projects dealing with structural reliability. Up to now the main topic of research was the design of the blades. In the Joule III project Prodeto [?,?] the fatigue loading of wind turbine blades was considered and a method for the calibration of the safety factors was developed and demonstrated. In the Joule III project Profar [?,?,?] the scatter in fatigue strength of blades was considered. As outlined below it appeared from these projects that it is very difficult to de-velop at this moment probabilistic design methods for blade manufacturers. For this reason the new initiatives that aim at the support structure of offshore wind turbines have been imitated at ECN.
1.2.1 Blade Design
In the period 1996 – 1998 ECN Wind Energy has co-ordinated and participated in the JOULE III project Prodeto that also included Risø and DNV. One of the main objectives of this project was the development of a computer code for wind turbine manufacturers and certifying bodies to be used partly as a tool for structural reliability analyses of wind turbine components and partly as safety factors calibration tool. The implementation of the computer code was mainly based on the procedures developed within Joule II project: EWTS I, subproject ‘Calibration of Safety factors’ [?]. The code can be applied to analyse the fa-tigue failure of blades only and is able to handle both measured and calculated 10-minutes time series. With this program a case study has been carried out for two Micon M1500-60/150 kW turbines, one located in The Netherlands and one located in Denmark. Both measured and calculated 10-minute time series have been considered, and a first order reliability analysis of the blade against failure in flapwise bending was carried out. It was demonstrated that the calibration of partial safety factors can be done on the basis of structural reliability methods, although the following problems were foreseen at the end of the project: • Only a suitable model for fatigue failure of rotor blades in flapwise direc-
tion was available for the Prodeto project. Models for fatigue in edgewise direction and other failure modes should be developed and verified.
• Design codes are valid for different wind turbines located at several loca-tions, so the wind climate can be different. This implies that the partial safety factors to be used in a design code should comprise a great variety of situations. So the calibration of the partial safety factors should be based on a large amount of time-series for different turbines at several locations.
• Besides uncertainty in the observed loads and the inherent scatter in the ma-terial fatigue properties, the following effects are covered by partial safety factors in existing codes and should be taken into account: - wear of materials; - variability in fabrication methods; - size effects; - uncertainty in load measurements; - uncertainty in wind climate determination/site parameters.
Nevertheless the calibration of partial safety factors by means of structural reli-ability methods is seen as an extremely suitable method to be used for the de-termination of the partial safety coefficients in design codes. However, due to the enormous amount of data, which should be evaluated for this purpose, an international co-operation is required. The results of the Prodeto project show that the calibaration of partial safety factors can be handled, and is expected to be of significant benefit for the wind
12 Risø-R-1420(EN)

turbine industry and for certifying bodies. However, the project did not succeed in developing a design tool. Based on the experience obtained in the Prodeto project it is expected that the objective to develop a probabilistic design code, which can be used by blade manufacturers in the regular design process is too ambitious at this moment, among others for the following reasons: • The loading of the blades has to be characterised by the local stresses,
which is complex due to the non-linear aero-elastic behaviour. • The various limit state functions are complex due to multi-axial stress states
and the different failure mechanisms (fatigue in the parent material, debond-ing, delamination, buckling, etc.)
• Composite materials show a very complex material behaviour; • Application of structural reliability methods requires specific knowledge,
which is not in general available in the industry. At that time no relation between coupon test data and the actual failure of the blade was available. For the case study material properties obtained from cou-pon test were used straightforward to characterise the strength of the blades. It appeared that inherent variability in the material data is the most important source of uncertainty. So the strength in the structural reliability model need more attention. Both the inherent scatter in fatigue strength and the relation with coupon data need to be considered in more detail, which has been done in the Joule III project Profar. The project has shown that the strength distribution of the parent blade material can be well described by coupon tests. Remarkable is the agreement between coupon data and blade data for the root section, as in the root section different failure mechanism were observed (fatigue of parent mate-rial, failure of the bonding line and failure of the spar). As it is not clear whether this agreement is accidental more research into failures of the root section is required. Unfortunately this could not be done within the Profar project.
1.2.2 Support Structure
Contrary to blade design it is expected that probabilistic design methods can be introduced for the support structure of offshore wind turbines more easily for two reasons. 1. The need for probabilistic design techniques is more urgent. The investment
costs of the support structure are significant, while these costs are more or less directly related to the structural design. The design has to deal with the simultaneous action of the loads induced by wind, waves and current, which all have a random nature. In a conventional deterministic design approach these loads would be treated independently and combined in a conservative way, for instance by adding the severest loads due to wind, waves and cur-rent linearly. So it is assumed that the severest loads due to wind, waves and current do occur at the same time and work in the same direction. Applying structural reliability methods take into account the correlation between the external loads, which generally will result in much lower design loads and consequently the investment costs can be reduced significantly.
2. The application of probabilistic design methods is well known in offshore engineering, and the offshore companies will also be involved in the design and manufacturing of the support structures for wind turbines. Furthermore a number of problems experienced in the probabilistic approach for the de-sign of blades are less pronounced for the support structure, such as:
• The modelling of the structural behaviour of the support structure as com-pared to the high non-linear aero-elastic models for blades, as the loads have to be characterised in terms of local stresses or strains;
13 Risø-R-1420(EN)
The strength is determined by the material behaviour and the failure modes, which are much better understood for steel than for composites. Furthermore both for steel and for concrete a lot of knowledge and information is probably available from the offshore industry.
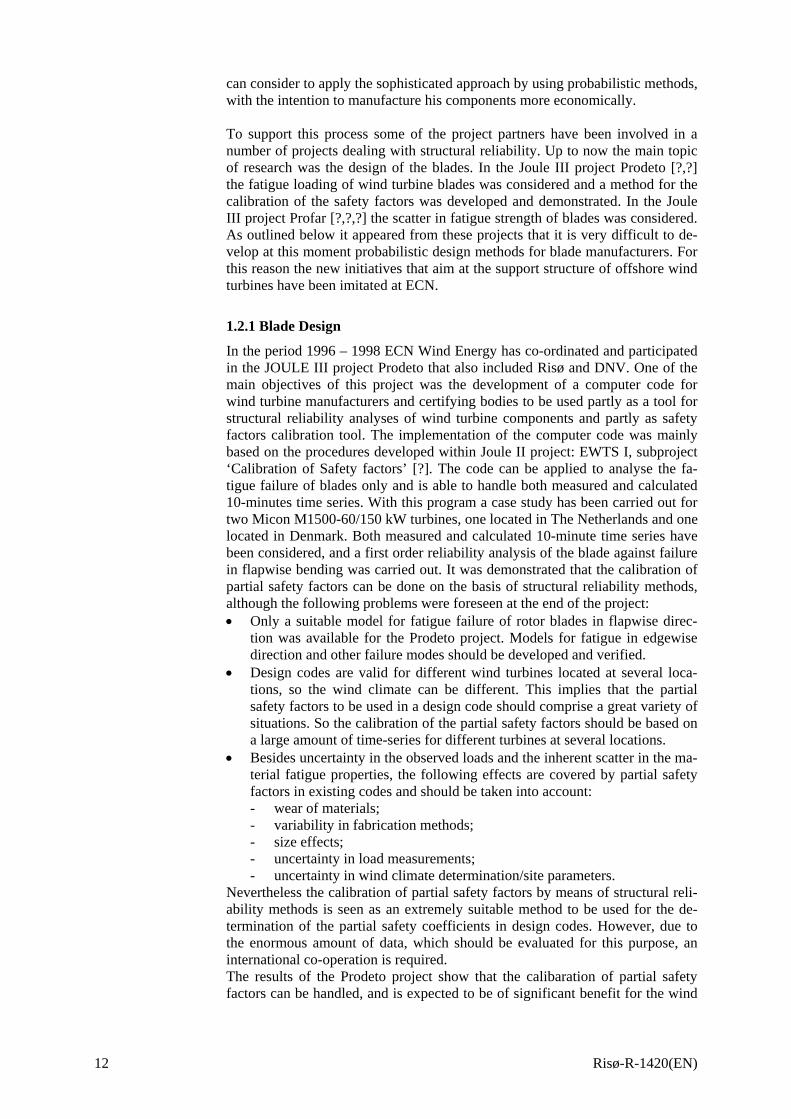
1.3 Risk Analysis Wind turbines may cause a risk for the environment in case of failure of a blade or any other loss of components. I.e. a structural failure of a component, caused by overload, insufficient strength, failure of the control system, extreme exter-nal conditions, etc. Experiences in the Netherlands have led to a commonly ac-cepted approach on how to determine the risks for the environment in case of a new wind project. A handbook [11] has been prepared in which the methods for carrying out the risk analysis is documented, together with safety criteria that have to be met. ECN has collected data of severe incidents that are relevant for safety. The data is derived from Denmark (Energi- of Miljødata), Germany (ISET WMEP database) and ECN. The data is listed in Table 1 in this report to have some ideas of the figures.
Part Failure prob-ability (Den-mark) [1/yr]
Failure prob-ability (Ger-many) [1/yr]
Recom-mended
value [1/yr]
Maximum distance
[m] Blade fracture 6,69⋅10-4 5,38⋅10-4 6,3⋅10-4 150
Rated speed 3,2⋅10-4 During mechanical braking (~1,25*rated speed)
3,2⋅10-4
Overspeed 5,0⋅10-6 Fracture of tip brake 1,25⋅10-4 - 1,3⋅10-4 500
Fracture of tower (base) 8,35⋅10-5 < 7,69⋅10-5 8,2⋅10-5Hub height + ½ diame-
ter Falling down of nacelle and/or rotor 1,51⋅10-4 3,08⋅10-4 2,0⋅10-4
Hub height + ½ diame-
ter Small parts (bolts, etc.) 1,20⋅10-3 - 1,2⋅10-3 ½ diameter
Table 1: Failure frequencies and throwing distances
14 Risø-R-1420(EN)
2 Framework This chapter sets up the framework of the analysis carried out in the project. In the succeeding chapters one finds the analysis and results.
2.1 General Framework The problem of balancing the reliability among the subsystems or components in a system is not new and is referred to as the problem of reliability allocation or reliability design. Usually this kind of problems is stated as an optimisation problem, in which the objective function is the system reliability (to be maxi-mised) subject to a set of constraints, among which monetary constraints play the major role. Another way is to minimise the cost of the system subject to providing the permissible level of the system reliability. In practice, for a more or less complex technical system it is often not feasible to solve the task mathematically due to a very high dimensionality and a large number of aspects that are difficult to formalise mathematically. To overcome this difficulty and still have a systemic approach to bringing the system reliability and safety to the desired level, simpler methodologies have been developed. For systems with a high potential risk for human beings and the environment the principle of elimi-nating weak points among the subsystems and components is employed. Reli-ability and risk analyses are used to identify weak points, and then proper meas-ures (technical and organisational) are worked out to bring the performance of subsystems/components to the level attained by the other subsys-tems/components with higher levels of performance. That is, this approach is aimed at having a uniform reliability/risk among subsystems/components given the permissible level of reliability/risk is fulfilled. Sometimes this approach is referred to as the principle of the maximum of entropy with respect to the reli-ability among the subsystems/components. This is because the maximum of entropy is attained when the reliability is uniformly distributed over subsys-tems/components in a system.
Wind turbines (WTBs) are technical systems that do not expose high risks to human beings and the environment, and therefore one may argue that their de-sign could be governed basically by economic considerations. As explained in Section 4.3 this argument is especially relevant for offshore wind turbines. This means that the harmonisation of the structural reliability and the reliability of the control and safety system may be sought taking into consideration the eco-nomic aspects of WTB’s design and operation. Furthermore, the specific inter-relation of the two kinds of reliability in the WTB introduces certain particulari-ties that make this problem atypical. This problem is considered in more detail in the following.
Let us introduce the following notation: CS stands for the control and safety system, SF denotes the event “a structural failure in the WTB”, is the event “the CS works successfully on demand”,
CSCS is the event “the CS fails on
demand”, Pr(⋅) is a probability, and Pr is a conditional probability of an event A happening given an event B has occurred.
( | )A B
15 Risø-R-1420(EN)
A particularity of the work carried out is that a structural failure of the WTB is conditional on the performance of the SS. Thus, it can be written Pr( ) Pr( | )Pr( ) Pr( | )Pr( )= +SF SF CS CS SF CS CS (1) In this formula the terms Pr( | )SF CS and Pr( | )SF CS characterise the struc-tural reliability, which is dependent on the performance the CS, and the terms
and Pr( )CS Pr( )CS characterise the reliability/unreliability of the CS. The principle of the uniform reliability allocation among the structural reliabil-ity, Pr( | )SF CS , and the reliability of the CS, , does not make much sense here due to several reasons. (1) These probabilities may differ to a great extent while providing a sufficient combined level of the structural reliability. (2) The events
Pr( )CS
|SF CS and are different in nature. Thus, we have to seek for another approach to allocating the reliabilities.
CS
An aid in search for an approach could be the existence of some accepted per-missible reliability values for WTBs. The Danish document “Rekommandation til Teknisk Grundlag” [16] (Recommendation for Technical Basis) contains such a value that could be made use of. The document states “The reliability of the safety system should be that high that the probability of failure of the safety system combined with the probability of a critical failure that requires the inter-vention of the safety system result in a probability of collapse which does not exceed a value of 0.0002 per WTB year.” To mathematically implement this recommendation, one or more events have to be introduced, i.e. the event that “a critical failure takes place.” Denoting the event by , the annual probability of which is determined with unit [yr
D-1]=[1/year] and using the notation intro-
duced, the recommendation can be formalised as follows: 1Pr( and and ) Pr( | and )Pr( | )Pr( ) 0.0002 yr−= ≤SF D CS SF CS D CS D D (2) To be fully consistent with the recommendation, the control system has to be separated from the safety system in this inequality, as the recommendation con-cerns only the safety system. Nevertheless, we will keep the inequality as it is, as some functions of the control system can be regarded as safety functions. A more refined analysis is possible if needed.
Wind turbines should be designed at minimum costs. In mathematical terms (3) min(WTB costs)
Ω
subject to a set of constraints, one of which could be (2) and in addition a re-quirement on the over-all reliability, namely Pr( ) P∗≤SF where is some predefined target value. The minimum of the objective function “WTB costs” is sought over the set of all possible design solutions, Ω, which includes possible design solutions for the structural parts of the WTB and the control and safety system. Furthermore, “WTB costs” can be thought of as including operational costs that in turn are dependent on maintenance schedule, or more generally, on the WTB’s availability. The number “0.0002 yr
P∗
-1” should not be regarded as “unshakeable” and could be subject to revision. An analysis of failure data col-lected on WTBs may suggest another permissible value for the probability of concern. The analysis described in Chapter 3 of this report will provide some
16 Risø-R-1420(EN)

evidence of the attained level of reliability. Alternatively one may even include Pr( )SF in the objective function “WTB costs” and make the values of Pr( | )SF CS and Pr( | )SF CS that comes out of the optimisation (3) become proposals for recommended values. The total “WTB construction costs” relative to Pr( )SF and – all as function of design, gives the over-all level of reliability. The relative costs of the structure and the control/safety system and maintenance will then define the proper balance. This approach is pursued in Chapter 4.
Pr( )CS
It is obvious that optimisation problem (3) can hardly be solved purely mathe-matically because of the existence of a large number of aspects to be taken into account. Nevertheless, understanding the issue of optimal design in this way will systematise the following investigation and give perspectives of getting deeper insights.
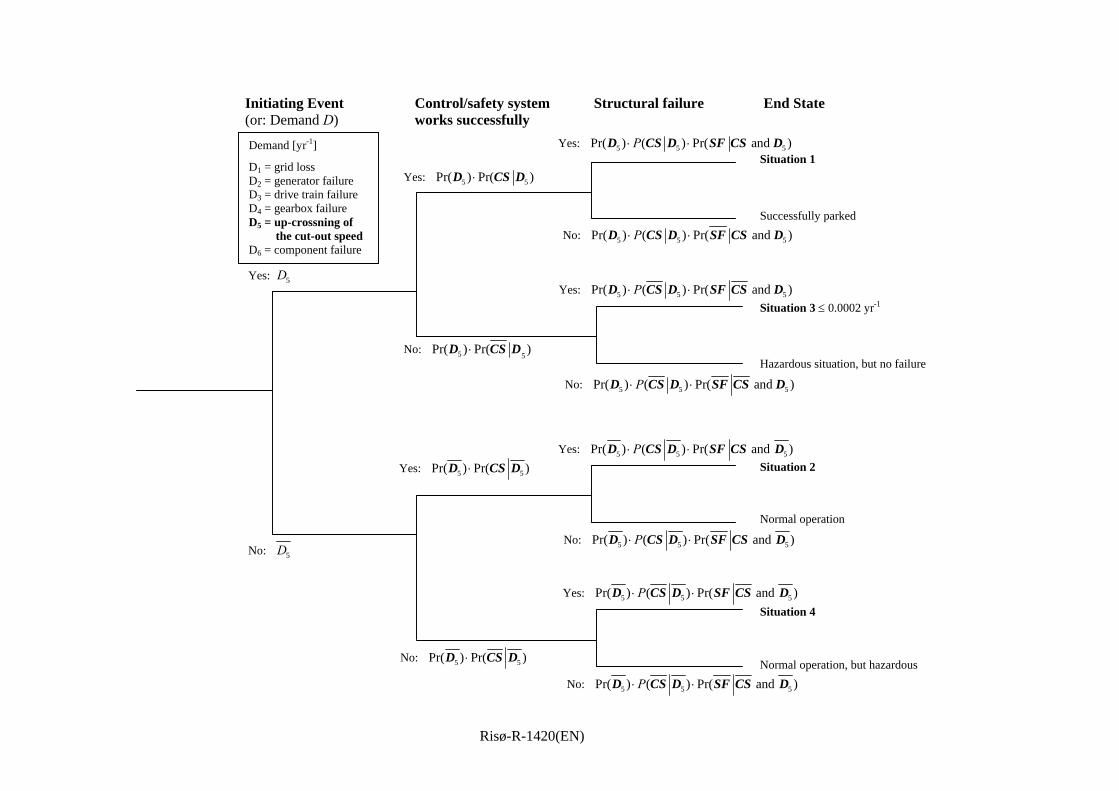
2.2 Refined and Feasible Framework Formula (1) is a starting point to formalise the general framework of the ap-proach, but it is not complete and need to be further developed. The intervention of the safety system is needed when there is a demand to trigger it. Thus, the probability of having a demand must be a constituent of formula (1). Let D=Di, i = 1,…, n, denote a set of possible demands to bring the WTB to a safe condition, the event “there is demand DiD i to bring the WTB to a safe condition“, and iD the event “there is no demand Di to bring the WTB to a safe condition.“ In general, we can consider that the set of possible demands D con-sists of 6 events [15]:
1. grid loss, 2. generator failure, 3. drive-line failure, 4. gearbox failure, 5. the mean wind speed up-crosses the cut-out speed, e.g. 25 m/s, and 6. failure of any other component monitored by the microprocessor.
The situation is shown in the event tree on page 18 where the 5th demand is con-sidered. The set of all possible conditioning events can be stated and , and , and , and Θ = D CS D CS D CS D CS The elements of the set Θ are to be interpreted as follows. “ ” means that there is a demand to stop the WTB and that the CS operates successfully, “
and D CS
and D CS ” means that there is a demand to stop the WTB and the CS fails, etc. By taking this into account formula (1) expands to formula (4). Formula (4) gives the total probability that any of the situations 1 through 4 shown in the event tree occurs for any of the initiating demands.
Pr( ) Pr( | and )Pr( | )Pr( )
Pr( | and )Pr( | )Pr( )
Pr( | and )Pr( | )Pr( )
Pr( | and )Pr( | )Pr( )
=
+
+
+
SF SF CS D CS D D
SF CS D CS D D
SF CS D CS D D
SF CS D CS D D
(4)
17 Risø-R-1420(EN)
Initiating Event Control/safety system Structural failure End State (or: Demand D) works successfully Yes: 5 5 5Pr( ) ( ) Pr( and )P⋅ ⋅D CS D SF CS D
Situation 1 Yes: 5 5Pr( ) Pr( )⋅D CS D
No: 5 5Pr( ) Pr( )⋅D CS D
Yes: 5 5 5Pr( ) ( ) Pr( and )P⋅ ⋅D CS D SF CS D
Yes: 5 5 5Pr( ) ( ) Pr( and )P⋅ ⋅D CS D SF CS D
Successfully parked No: 5 5 5Pr( ) ( ) Pr( and )P⋅ ⋅D CS D SF CS D
Situation 3 ≤ 0.0002 yr-1
Hazardous situation, but no failure
No: 5 5 5Pr( ) ( ) Pr( and )P⋅ ⋅D CS D SF CS D
5 5 5 5Pr( ) ) Pr( and )⋅D SF CS D
Situation 2
Normal operation
Yes: 5 5Pr( ) Pr( )⋅D CS D
Yes: 5D
Demand [yr-1]
D1 = grid loss D2 = generator failure D3 = drive train failure D4 = gearbox failure D5 = up-crossning of the cut-out speedD6 = component failure
DNo:
No: 5 5Pr( ) Pr( )⋅D CS D
Risø-R-14
No:
Yes: 5Pr(D
No: 5Pr(D
20(EN)
(P⋅ CS D
5 5) ( ) Pr( and )P⋅ ⋅CS D SF CS D
Normal operation, but hazardous
5 5) ( ) Pr( and )P⋅ ⋅CS D SF CS D
Situation 4
It is noted that because and ii=∪D D ii
=∩D D (the sign “ •∪ ” is the opera-
tor of conjunction or simply logical “or” and “ •∩ ” is the opposite), one can see that all WTB subsystems are explicitly included in formula (4). The formula could be further developed up to the level of having the probabilities of the de-mands separately. If we had complete statistics on the occurrences of all the demands (generator failure, drive-line failure, gear box failure, etc.) and if we could acquire statistics on failure occurrences of the CS as a response to these demands, then the probability of structural failure could be assessed with a more or less great confidence given the models for the assessment of the conditional probabilities exist. Pr( | )•SF As explained model (4) is in principle detailed enough to cover many aspects of the WTB design, there are however a few obstacles to trying to apply it in the current project. Therefore, in the following a framework feasible for the current project is developed. First, it is recognised that it is a very voluminous task to apply (4), which cannot be afforded in the current project. Second, as it will be demonstrated in the Chapter 3 on failure data analysis, failure records reported in the existing databases are not informative enough and often too ambiguous to extract the needed information. Being driven by these considerations and want-ing also to be able to compare the outcome of a failure data analysis with theo-retical estimations of structural reliabilities for extreme wind conditions, which are more penetrable than theoretical estimations of structural reliabilities under operating conditions, and further anticipating that the unbalance between system reliability and structural reliability to be more pronounced at extreme wind con-ditions, it was decided to focus primarily on the initiating event, that the 10-minute mean wind speed crosses up the cut-out wind speed level. Thus the ex-treme wind condition, in the following denoted in stead of , was taken as the only initiating event whereas all other initiating events plus the case of normal operation was grouped and denoted
stormD 5D
stormD . Consequently (4) reduces to
storm storm storm
storm storm storm
storm storm storm
Pr( ) Pr( | and )Pr( | )Pr( ) (Situation 1)
Pr( | and )Pr( | )Pr( ) (Situation 2)
Pr( | and )Pr( | )Pr( ) (Situation 3)
Pr( | a
=
+
+
+
SF SF CS D CS D D
SF CS D CS D D
SF CS D CS D D
SF CS storm storm stormnd )Pr( | )Pr( ) (Situation 4)D CS D D
(5)
It is emphasised that in this formula the event is to be interpreted as an occasion of surpassing the cut-out wind speed. The probability is the probability per year of having a storm with mean wind speeds above the cut-out wind speed, which generally differs among types of turbines but often is 25 m/s.
stormD
stormPr( )D
All the terms in formula (5) can be assessed in different ways. One way would be to use existing reliability models. To assess the structural failure probabilities
given the different conditioning events, the models described and applied in Chapter 4 can be used. Then, to assess the probabilities Pr( | )•SF
storm stormPr( | ) 1 Pr( | )= −CS D CS D and storm stormPr( | ) 1 Pr( | )= −CS D CS D one can employ the models described in [15]. The models in [15] exemplify their use for the Danish wind turbines NEG Micon 600/44, 600/48, 750/44, and 750/48, which have similar safety systems. The probability can be assessed from the weather statistics.
stormPr( )D
19 Risø-R-1420(EN)
Another way would be straightforward and direct collection of statistics on all the terms without the use of the models developed. The data needed can be re-trieved from the existing failure records. An attempt to carry out such an analy-sis is made in Chapter 3. Results from this analysis are compared to those re-ported in Chapter 4. The framework presented in the previous section and elaborated on in this sec-tion is not the only possible framework. The presented framework allows for determining balanced structural and system reliabilities. A similar framework based on Bayesian Probability Networks (BPN) could have been formulated. The advantage of BPNs is their structure that allows for easy use in decision-making. Although this advantageous feature has not been needed in the current project the application of BPNs on wind turbines is demonstrated in [20], one of the reports of the project.
2.3 Compatibility of the Methods of System Reli-ability and Structural Reliability There is a principal difference in the typical application of Structural Reliability Analysis (SRA) and Quantitative Risk Analysis (QRA). SRA is typically con-cerned with event of very low probability of occurrence like the collapse of residential property, stadiums, bridges etc. This implies collecting failure statis-tics on collapses is difficult why engineering societies often build up a consen-sus on the acceptable probability distribution models for loads and material strengths. Utilising these distribution models, the tails of which can be hard to fully verify, in combination with a mechanical model with uncertainties of its own an assessment of the reliability of a structure can be made. On the other hand QRA is often concerned with events of more frequent occurrences and with more complex physical aspects. Therefore building up a physical model and inputting to it distribution models is seldom a feasible approach. Instead it is in principle possible to collect empirical data such as MTBF (Mean Time Be-tween Failures) that are based on experiments with relevant components. QRA could be a feasible approach to investigating the system reliability of wind tur-bines because the control/safety system comes into action quite often, whereas SRA would be a typical approach to the structural reliability of wind turbines, which should only seldom be violated. In reality it turns out that QRA is not practicable for control/safety systems of wind turbines. Only qualitative ap-proaches are tractable for the time being. The only applicable approach seems to be collecting failure data for the entire control/safety system and not its compo-nents. Due to the principle difference, namely the distribution models as applied in the SRA method on the one hand, and the empirical data applied in the QRA meth-ods on the other hand, it is natural to reflect upon the compatibility of the results obtained by the different methods. In this connection it must be appreciated that the reliabilities obtained in by SRA methods are to be understood as notional. That is, the reliabilities do not reflect failure rates like those that in principle could be derived from failure statistics gathered over sufficiently long periods of time. The key point is that the uncertainty model will include so-called mod-elling (epistemic or type II) uncertainties and statistical uncertainties in addition to physical uncertainties that cover the inherent variability in climate and mate-rial strength. Because the obtained reliabilities are not directly interpretable as failure rates the reliabilities will preferably be given in terms of reliability indi-ces, denoted β, which, per definition, relates to the reliability via β = −Φ−1(pf),
20 Risø-R-1420(EN)

where pf is the probability of failure and the reliability consequently is 1–pf. (The relation is tabled in Table 7 found later in Chapter 4). Though the notional structural reliabilities cannot be given a strict frequentistic interpretation they can however still be compared as they will be in the present report. The validity of such a comparison rests on the assumption that the uncertainty models, i.e. the distribution models, are comparable – i.e. equally good (or bad). Because of the model uncertainties involved that are typically assessed by expert judgment the theoretical result can be conservative as well as non-conservative.
21 Risø-R-1420(EN)

22 Risø-R-1420(EN)
3 System Reliability The general framework presented in Chapter 2 requires, in its most general form, methods that for a given turbine design can evaluate the system reliability. As explained in Chapter 1 there is currently no solid way to quantify the system reliability from MTBF values of the individual components, as the suppliers seldom know them. As mentioned in Chapter 2, one may conduct design under the constraint that the system reliability has a certain value, that is, one can op-timise the structural reliability for a given level of system reliability aiming at a certain target level of over-all reliability. This value of the system reliability could be taken as the value that is implied by current design practise. Thus the present chapter deals with the quantitative analysis of system reliability based on reported failures, mainly in Denmark, under some specific conditions. If a trustworthy, i.e. reliable, value comes out of the analysis this value could be stated as reference value for those that may want to optimise design with respect to structural reliability, given that they, as a minimum, obey the rules of current design practise for control/safety systems. Because one may imagine many possible reasons why the system reliability is compromised the first section of this chapter is spent on a discussion of the fac-tors that may influence the system reliability
3.1 Factors that influence the system reliability This section gives an overview of the considerations that have been made dur-ing the initial phase of the project regarding the possible contributions to the system reliability and the possibilities to quantify these. The considerations re-flect that the project set out to investigate offshore turbines, but that not much experience in this field exists. Only useful reported data for older onshore tur-bines exists. Therefore the possibilities of forecasting the failure rates for off-shore turbines on the basis of the existing data were discussed. Various statements, more or less substantiated in evaluation of failure data for older turbines in Denmark, were made. Some of these are given below:
• If the safety/control system fails to work in older turbines it is due to the malfunctioning of the mechanical parts - very seldom the electronic parts.
• Lack of O&M of older turbines is one main source to malfunctioning. • Another main source to malfunctioning is too weak or unfortunate de-
sign that may require more maintenance than prescribed. • Malfunctioning of the control /safety system is by far the main reason to
collapse. • The experience is based on older turbines (because, since some years
ago, the manufactures are no longer obliged to report failures to Risø). • During the 1999 hurricane in Denmark no turbines from after 1990 col-
lapsed. • Either very little or ambiguous information about collapses exists. • Failure rates of individual components of the control/safety system are
almost unavailable.
23 Risø-R-1420(EN)
• The control/safety system in modern turbines is expected to be more re-liable than those in old machines, because of the experience gained over the years. However the effect that the offshore environment will have on degradation, and the consequences of the brake systems in modern tur-bines not being fully independent is hard to say. However an inquiry made to people involved in the operation of the Vindeby offshore farm showed that in the about twelve years of operation of Vindeby the safety systems have not yet failed on any of the turbines at any of the half-year tests.
• ECN's experiences with 8 years of system reliability show that malfunc-tioning of the control system sometimes leads to total collapse of the tur-bine. It seems that most of these situations are caused by bad mainte-nance or can be considered as prototype failures. Once such situation has occurred, the manufacturer takes a closer look at the design and proce-dures and tries to fix it in order to avoid problems in the future.
Based on these statements one may set up the hypothesis that the main cause to malfunctioning of the safety/control system is unfortunate design. It is impor-tant to distinguish between unfortunate design and careless design. By unfortu-nate design is meant design that has been made in good faith but eventually, due to lack of knowledge at the time of design, turns out to be disadvantageous causing break down or collapse. One can easily imagine that, to a large extend, the lack of O&M is linked to the same too limited knowledge that causes the unfortunate design. The reason that unfortunate design may be the main con-tributor to the unreliability of the control/safety system is the following. Like for instance the car industry, and unlike the building industry, the wind turbine industry is an industry in which new concepts and developments are often in-troduced. The introduction of new concepts implies that previous experience is not directly applicable why the rate of making unfortunate design is higher than e.g. in the traditional building industry, i.e. not extraordinary building projects like large suspension bridges. Clearly, as the wind turbine industry is getting older the rate of occurrence of unfortunate design decreases because the jumps in development of technologies become smaller. However, one may expect that there is a lower limit to the rate of unfortunate design because the development of new technologies in the field of wind turbines seems never to stop, but rather move on at a great pace, especially so with the recent advance in offshore wind turbine engineering. An advantage of considering the rate of unfortunate design is that the many questions that are raised when consulting people about the reliability of wind turbines are covered by the assessment of the rate. This is so because the es-sence of these questions has been concerned with the impact of introducing new technologies, and they have all had a touch of guessing about the unknown. In addition, in this project we are trying to deal with offshore turbines about which we don't have much information, so extrapolation of known failure rates for on-shore turbines to offshore turbines should ideally be treated. This question could be answered – at least roughly – by considering the time development of rates of unfortunate design experienced in other fields of engineering, and then try to scale it appropriately to fit with the wind turbine industry. It is, admittedly, difficult to quantify the rate of unfortunate design. An ap-proach would be to look at other industries, for instance the car and airplane industries. However, these industries are older than the wind turbine industry, and because the consequences connected to collapses are more severe than in the wind turbine industry, the rates of unfortunate design and there development
24 Risø-R-1420(EN)

in time will differ from what is the case for wind turbines. Some inquiries fol-lowing this line of thinking has been made within the project, but they have turned out to be fruitless. Another source to information about rates of unfortu-nate design could be the insurance companies that offer insurances to consulting engineers. Also investigations in this direction has been made, however it turned out that either the companies are not that willing to share their knowl-edge or they base their assessments on consultants who have access to about the same data material as the partners of this project. Therefore this possibility was given up too. Though one may expect that unfortunate design would be a main contributor to the malfunctioning of the control/safety system, also other factors contribute: lack of O&M, design errors, production errors, errors introduced at erection of the turbine, etc., and simply generally unavoidable random failures due to in-herent uncertainties. Ambiguity of the failure records available to the project makes it impossible to distinguish the different potential causes of malfunction-ing. Further the data is so limited, that the few cases, which allow a clear dis-tinction, are so few, that statistically reliable estimates of the rates of occurrence of the different contributors to malfunction are not obtainable. Therefore esti-mating the rate of unfortunate design for successive use in estimation of the fu-ture importance of the system reliability for the over-all reliability of offshore turbines has been given up. In stead it has been decided not to distinguish be-tween factors but assume that the total of all factors exhibits a development in time in line with that of unfortunate design. Such a consideration can be justi-fied by the point of view that not only does the knowledge about matters that should govern design improve over time, but likewise does the knowledge about proper production and installation procedures improve. It should be em-phasised that the kind of failure rates that are considered are by no means con-nected to the standard use of MTBFs. Since the failure rates are derived from incidents with turbines, it is very likely that they have to do with a failure on the increasing or decreasing part of the bathtub curve, which reflects that we are dealing with learning curve related incidents. Further reductions in the degree of detail of classification of the sparse data were decided. As already presented in section 2.2 in connection to formula (5), a simplification regarding initiating events is introduced where one distin-guishes only between storm events and non-storm events because it is antici-pated that the unbalance between system reliability and structural reliability to be more pronounced at extreme wind conditions. Finally it was decided to con-sider only two classes of failure, namely failure of tower and/or foundation, i.e. total collapse of the turbine, and failure of blades. As it turns out the influence of system reliability is actually of much higher importance for total collapses than for collapses of the blades. All other types of failure were skipped. It was the hope that a limited number of categories would make it possible to obtain reliable estimates of failure rates, however the data is even too limited for the considered purpose. Nevertheless an attempt is made draw some conclusions though they are not highly reliable. As already discussed in Section 2.2 in relation to formula (5) the chosen catego-ries for classification opens for the possibility of comparing collected failure data with theoretically obtained estimates of structural reliability. Thus in [21] models are developed for the probability of collapse of the entire turbine in storm events. This model is presented in Section 4.1 of this report. Furthermore the extreme storm load case is considered one of representative and central load cases in wind turbine design.
25 Risø-R-1420(EN)

3.2 Analysis of major wind turbine failures taking place in 1984-2000 in Denmark In the following section an analysis of existing failure data is carried out and possible conclusions related to the subject of interest are drawn.
3.2.1 Introduction to the analysis
The current analysis of structural failures of wind turbines (WTBs) installed in Denmark is based on failure data acquired from EMD’s (Energi- og Miljødata) database for the period 1984-2000. In fact, there were two databases, one cover-ing the period 1984-1992, and the other 1993-2000. The data were comple-mented by an internal Risø’s source, which is a collection of major WTB fail-ures not reported in EMD’s database. The databases are listed in Appendix A. The objective of the data analysis was first to classify the structural failures into the four groups corresponding to the four situations in the event tree on page 18, which in turn corresponds to the four terms in formula (5). Then, the second task of the data analysis was to assess the rates/probabilities of the four types of accidents. In assessing the failure rates stationarity of the rates were implicitly assumed. The amount of data is simply too limited to allow for a deduction time varying rates.
In addition to the four groups, each failure was sorted as taking place in the blades or the tower-foundation, i.e. it was judged whether a partial or a full col-lapse took place. A particularity of the failure data reported in the databases was that the causes, consequences and conditions of the failures were poorly described, which en-tailed ambiguity in the classification of the failures into the four groups. It was decided not to introduce any additional assumptions and make a “soft” classifi-cation of the failures in order to preserve the degree of uncertainty present in the descriptions. This is needed to make reliable decisions based on the parameters assessed. The failures ambiguously described were classified into more than one group as likely belonging to any of them. In some cases the ambiguity was be-tween two groups, while in some cases we were not certain at all which of the four groups was a better choice. In the latter case a failure could be classified according to our judgement to any of the four groups. The most probable group for the failure was also judged.
The soft classification was implemented in the tables in the following way. Black cells mean that due to the ambiguity the failure could be classified into this cell. If a cell is not marked as black and “1” is written in it, this means that the failure belongs most likely to this cell. In unambiguous cases “1” is also written in the cells indicating the crisp classification.
Such approach will bring us to interval-valued numbers of failure occasions be-longing to each of the four groups, and the most probable number of occasions. For example, the true number of wind turbine collapses for the period 1984-2000 classified into situation 1 lies in the range [0,21] (see Table 3), while the most probable number judged is 1. This will result then in the calculation of the lower and upper bounds for the average rate of having situation 1, and the cal-culation of the point (most probable) value of the rate.
26 Risø-R-1420(EN)
3.2.2 Failure Data Analysis
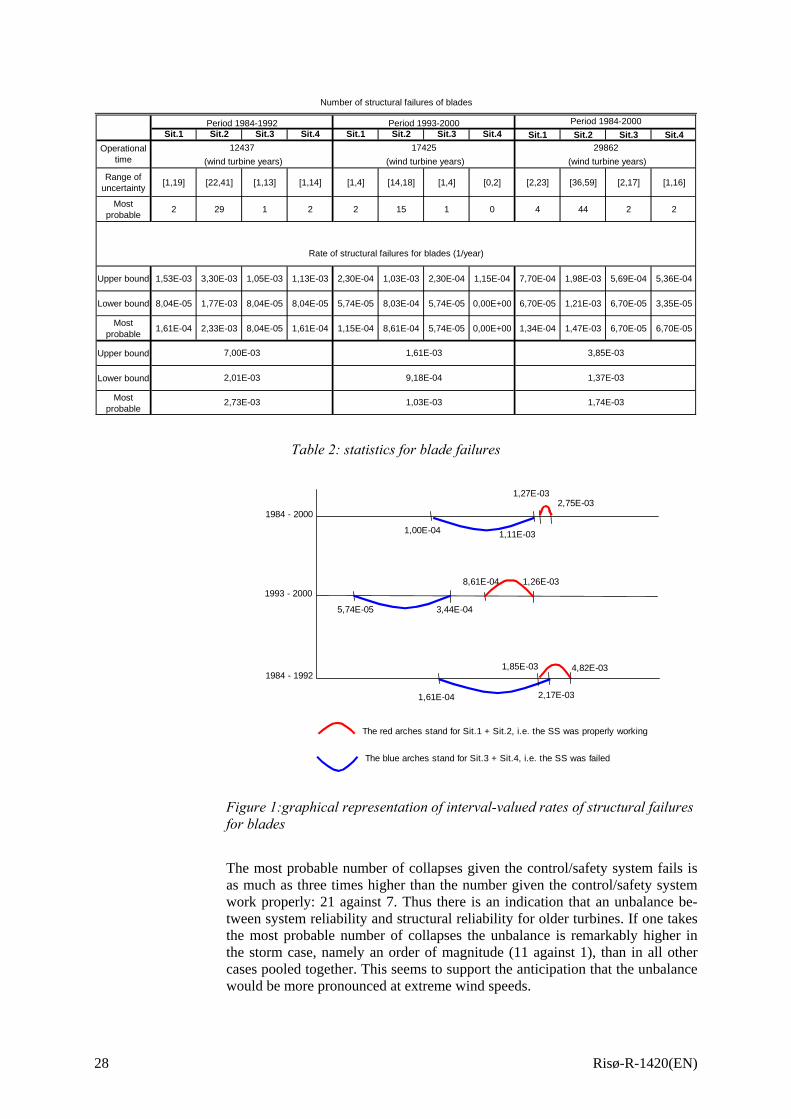
The results obtained according to the method described in the previous section are presented in Table 2 and Table 3, as intervals as well as point values that are to be interpreted as most probable values according to the expert judgement. The data on the structural failures of blades are presented in Table 2, and the data on WTB collapses are gathered in Table 3. Figures following Tables 1 and 2 visualise the results presented in these tables. Main characteristics of the analysis are
• The analysis covers the experience of 29862 WTB years. • The total number of failures screened from the databases was 258. • 44 failures were caused by lightning and were left out of the analysis. • 110 failures were classified as not applicable for the current analysis. • 36 (out of 104) failures were related (or possibly related) to structural
failures of the tower and foundation and will be referred to as collapses, and 28 out of 36 were judged as most probably related to collapses.
• 68 (out of 104) failures were related (or possibly related) to structural failures of blades, and 52 out of 68 were judged as most probably related to structural failures of blades.
3.2.3 Detailed conclusions drawn from the failure data analysis
Structural failures of blades The prevailing majority of structural failures of blades have happened under normal wind conditions: 46 failures for normal wind conditions against 6 for extreme wind conditions for most probable number of failures (Table 2, period 1984-2000). The cause is generally considered to be fatigue in the texture of the blades, which might have been enhanced relative to the design conditions by a possibly dysfunction of the control system. A possibility that is not captured by the method in Chapter 2. The prevailing majority of structural failures of blades have happened while the control/safety system was properly operating (Table 2): 48 against 4 for most probable values. This fact obviously correlates with the major identified cause of failures, which is fatigue. It should also be noted that the fact of independ-ence of the blade failures of the state of the control/safety system makes it un-justifiable to pool the structural failures of blades together with structural fail-ures of the tower-foundation, as it is clear that the rate of the latter occurrences depends heavily on the state of the control/safety system. The interval-valued rate of structural failures of blades irrespectively of the situations is [1.37E-03, 3.88E-03] (1/year), and the most probable rate is 1.74E-03 (1/year). The failure rate of blades in the period 1984-1992 was higher than in the period 1993-2000, which may indicate a higher quality of the blades put into operation starting from 1993.
Collapses of WTBs In general, uncertainty in the failure classification of WTB collapses is very high to make reliable conclusions. Therefore, the conclusions below are not to be considered highly confident, but as most likely possible.
The number of WTB collapses under extreme and normal wind conditions are approximately equal if the most probable numbers are taking into account (Table 3): 12 against 16.
27 Risø-R-1420(EN)
Sit.1 Sit.2 Sit.3 Sit.4 Sit.1 Sit.2 Sit.3 Sit.4 Sit.1 Sit.2 Sit.3 Sit.4
Range of uncertainty [1,19] [22,41] [1,13] [1,14] [1,4] [14,18] [1,4] [0,2] [2,23] [36,59] [2,17] [1,16]
Most probable 2 29 1 2 2 15 1 0 4 44 2 2
Upper bound 1,53E-03 3,30E-03 1,05E-03 1,13E-03 2,30E-04 1,03E-03 2,30E-04 1,15E-04 7,70E-04 1,98E-03 5,69E-04 5,36E-04
Lower bound 8,04E-05 1,77E-03 8,04E-05 8,04E-05 5,74E-05 8,03E-04 5,74E-05 0,00E+00 6,70E-05 1,21E-03 6,70E-05 3,35E-05
Most probable 1,61E-04 2,33E-03 8,04E-05 1,61E-04 1,15E-04 8,61E-04 5,74E-05 0,00E+00 1,34E-04 1,47E-03 6,70E-05 6,70E-05
Upper bound
Lower bound
Most probable
7,00E-03
2,01E-03
2,73E-03
1,61E-03
9,18E-04
1,03E-03
3,85E-03
Rate of structural failures for blades (1/year)
1,37E-03
1,74E-03
Period 1984-1992 Period 1993-2000
Number of structural failures of blades
Period 1984-2000
(wind turbine years) (wind turbine years) (wind turbine years)Operational
time2986212437 17425
Table 2: statistics for blade failures
1984 - 2000
1984 - 1992
1993 - 2000
1,11E-03
4,82E-031,85E-03
5,74E-05 3,44E-04
8,61E-04 1,26E-03
1,61E-04 2,17E-03
1,00E-04
The red arches stand for Sit.1 + Sit.2, i.e. the SS was properly working
The blue arches stand for Sit.3 + Sit.4, i.e. the SS was failed
1,27E-032,75E-03
Figure 1:graphical representation of interval-valued rates of structural failures for blades
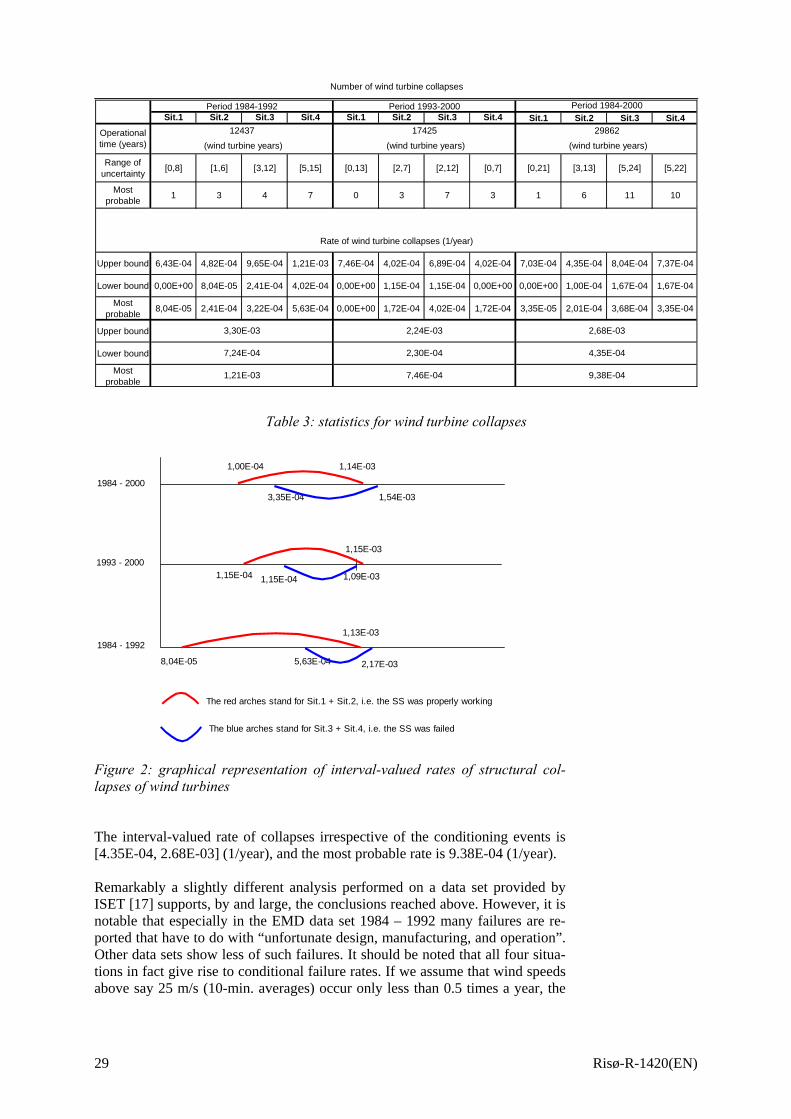
The most probable number of collapses given the control/safety system fails is as much as three times higher than the number given the control/safety system work properly: 21 against 7. Thus there is an indication that an unbalance be-tween system reliability and structural reliability for older turbines. If one takes the most probable number of collapses the unbalance is remarkably higher in the storm case, namely an order of magnitude (11 against 1), than in all other cases pooled together. This seems to support the anticipation that the unbalance would be more pronounced at extreme wind speeds.
28 Risø-R-1420(EN)
Sit.1 Sit.2 Sit.3 Sit.4 Sit.1 Sit.2 Sit.3 Sit.4 Sit.1 Sit.2 Sit.3 Sit.4
Range of uncertainty [0,8] [1,6] [3,12] [5,15] [0,13] [2,7] [2,12] [0,7] [0,21] [3,13] [5,24] [5,22]
Most probable 1 3 4 7 0 3 7 3 1 6 11 10
Upper bound 6,43E-04 4,82E-04 9,65E-04 1,21E-03 7,46E-04 4,02E-04 6,89E-04 4,02E-04 7,03E-04 4,35E-04 8,04E-04 7,37E-04
Lower bound 0,00E+00 8,04E-05 2,41E-04 4,02E-04 0,00E+00 1,15E-04 1,15E-04 0,00E+00 0,00E+00 1,00E-04 1,67E-04 1,67E-04
Most probable 8,04E-05 2,41E-04 3,22E-04 5,63E-04 0,00E+00 1,72E-04 4,02E-04 1,72E-04 3,35E-05 2,01E-04 3,68E-04 3,35E-04
Upper bound
Lower bound
Most probable
2,68E-03
4,35E-04
9,38E-04
3,30E-03
7,24E-04
1,21E-03
2,24E-03
2,30E-04
7,46E-04
Period 1984-1992 Period 1993-2000 Period 1984-2000
Number of wind turbine collapses
Rate of wind turbine collapses (1/year)
(wind turbine years)Operational time (years) (wind turbine years) (wind turbine years)
2986212437 17425
Table 3: statistics for wind turbine collapses
1,15E-04
3,35E-04
1,00E-04 1,14E-03
1,13E-03
1,15E-04
1,15E-03
1,09E-031993 - 2000
5,63E-04 2,17E-03
1984 - 1992
1984 - 2000
The red arches stand for Sit.1 + Sit.2, i.e. the SS was properly working
The blue arches stand for Sit.3 + Sit.4, i.e. the SS was failed
1,54E-03
8,04E-05
Figure 2: graphical representation of interval-valued rates of structural col-lapses of wind turbines
The interval-valued rate of collapses irrespective of the conditioning events is [4.35E-04, 2.68E-03] (1/year), and the most probable rate is 9.38E-04 (1/year). Remarkably a slightly different analysis performed on a data set provided by ISET [17] supports, by and large, the conclusions reached above. However, it is notable that especially in the EMD data set 1984 – 1992 many failures are re-ported that have to do with “unfortunate design, manufacturing, and operation”. Other data sets show less of such failures. It should be noted that all four situa-tions in fact give rise to conditional failure rates. If we assume that wind speeds above say 25 m/s (10-min. averages) occur only less than 0.5 times a year, the
29 Risø-R-1420(EN)
failure rates given the high wind speeds are higher than what we conclude here. The failure records did however not give information on climate, why the con-ditional failure rates have not been assessed. Furthermore reporting failure oc-casions to the database administrated by the EMD company is voluntary and we may expect that not all failures are recorded in the database. For example, data on failure occasions collected at Risø are complementary to EMD’s database. Thus, despite the additional source of failure data, one can truly conclude that the reliability assessments exhibited in the current report have to be considered optimistic.
3.3 Forecasting system reliabilities The analysis in the previous section was based on older onshore turbines. They indicated that an unbalance between system reliability and structural reliability is present for the older turbines. To move from the results of this analysis to an investigation of the possible existence of an unbalance between system reliabil-ity and structural reliability for offshore wind turbines is quite a delicate matter. There is no doubt that the wind turbine engineering community has learned from previous experience. On the other hand new technical challenges con-stantly emerge, especially as one moves offshore. As discussed already in section 3.2.1 it is difficult to give guidance on how to forecast the balance between system and structural reliability. The simplest way would be to estimate from the observed data, which span approximately 15 years, the failure rates in the first 7 years and the last 7 years to see if a trend may be observed. If a trend is observed then one may simply extrapolate line-arly ahead from these results to present time and then possibly correct for the expectable jump-like increase in failure rates as one moves offshore. Baring in mind the ambiguity of the data, the data is insufficient to draw solid conclusions on trends, why estimates based on observed possible trend would have to be ‘taken with a grain of salt’. Thus trying to make a correction for the jump in failure rates that one may expect as wind turbines are moved offshore does not make much sense as a quantification of this jump is itself quite difficult. Though it is strictly not meaningful to make a forecast an estimate is anyways produced in order to have some idea about the possible development. Due to the observed fact of independence of the blade failures of the state of the con-trol/safety system the forecast will be based solely on observed WTB collapses, i.e. Table 3. From this table it follows that the most probable failure rate given the control/safety system fails is 411/12437 8.8 10 yr 1− −≈ ⋅ for the period 1984-1992 and 410 /17425 5.7 10 yr 1− −≈ ⋅ for the period 1993-2000, when regarding both normal and extreme weather conditions. Thus trend in these data is
in the direction of increased system reliability. This is not a strong trend, however it leads to a forecasted failure rate given the control/safety sys-tem fails, which is in the time period 2000-2007. This forecast should be compared to the failure rate given that the con-trol/safety system works properly. Assuming that this rate should be more or less constant in time an estimate is obtained by considering the entire period 1984-2000, for which the most probable failure rate given that the control/safety system works properly is
8.8 / 5.7 1.5≈
4 1 45.7 10 yr /1.5 3.8 10 yr− − −⋅ ≈ ⋅ -1
147 / 29862 2.3 10 yr− −≈ ⋅ . If one believes in the fore-cast, it shows that an unbalance between system and structural reliability will prevail, even if one neglects the, admittedly, possibly small jump-like increase in failure rate due to the change from onshore to offshore environment. On the other hand there is among the project participants anticipation that the im-
30 Risø-R-1420(EN)
provement of the wind turbine technology has not followed a linear trend but more likely a more rapidly growing trend. Thus it is expected, but not docu-mented, that the balance will not be as pronounced as the simple forecast pre-dicts, not to say that there will not be an unbalance at all. Further control/safety system failures will probably predominantly be due to random failures rather than unfortunate design. From the investigations ECN made during the project “Handbook Determining Risk Zones for Wind Turbines” [11] in the Netherlands they concluded, as is done in this report too, that the EMD and ISET data are insufficiently detailed to draw conclusions on trends. However, the failure rate “loss of blades” deter-mined in the beginning of the nineties was approximately 2,6⋅10-3 per year. The failure rate used now (based on the EMD and ISET data until 2000) shows a 95% upper limit of 8,4⋅10-4 per year. Thus an improvement of 3,1 seems to be realised. Though “loss of blades” is “another business” than control/safety sys-tem the apparent improvement of “loss of blades” also gives an indication of the wind turbine industry’s capability of improving design.
If one accepts that there is at present days still an unbalance between system and structural reliability and if one expects that there is little to do about improving system reliability, one may turn the situation around and ask if the over-all reli-ability is acceptable? If yes, there will then be room for reductions of the struc-tural reliability without compromising the overall reliability significantly, espe-cially in the storm situation. This is a question to be answered by society and not by the authors of this report. One may say that society implicitly has ac-cepted the present level of over-all reliability as it accepts to continuous erection of wind turbines. Whether it will be feasible to reduce the structural reliability level is further discussed in Section 4.3.
3.4 Gaining more insight from the data analysis and developed approach It was in the analysis presented in the previous section realised that the biggest problem is ambiguity of the data. This section presents an example for which some of the presumptions may be debatable but none the less it is demonstrated what kind of conclusions one could arrive at if the system of failure reporting was reliable. Thus, much more insight would be possible to gain if the failures were properly and unambiguously reported. By looking into formula (5) we can conclude that varying the probabilities of failure of the CS will have different affect compared to varying the probabilities characterising the structural reliability. To make this point more clear, let us consider an example of what kind of insight one can get by analysing the prob-abilities of wind turbine collapses. The data for this example are taken from Table 3 for the period 1984-2000.
For the sake of simplicity and of being specific, let us take for this example the probabilities of the four situations happening judged as most probable values. These probabilities are found in the right lower corner of Table 3. Write them as follows
31 Risø-R-1420(EN)

5storm storm storm
4storm storm storm
4storm storm storm
Pr(Sit. 1) Pr( | and )Pr( | )Pr( ) 3.35 10
Pr(Sit. 2) Pr( | and )Pr( | )Pr( ) 2.01 10
Pr(Sit. 3) Pr( | and )Pr( | )Pr( ) 3.68 10
Pr(Sit.
−
−
−
= =
= =
= =
SF CS D CS D D
SF CS D CS D D
SF CS D CS D D
⋅
⋅
⋅4
storm storm storm4) Pr( | and )Pr( | )Pr( ) 3.35 10−= =SF CS D CS D D ⋅
(6)
For the storm situation (situations 1 and 3) it is apparent that an improvement of the reliability of the CS will have the larges impact on the over-all reliability. In order to give a quantitative example we need some assumptions. Let us assume that the probability of having a storm (wind speeds above 25 m/s) per year is approximately equal to 0.5. This figure can be interpreted in a different way as having such a storm every second year in average, which seems to our knowl-edge a realistic assumption for hub heights about 30 to 70 meters in a north European environment. Another assumption introduced is that of the WTB suf-fers a major structural failure (collapse) with surety given the CS does not prop-erly work during a storm. Formally, this means that stormPr( | and ) 1=SF CS D . Thus, applying these two assumptions to we arrive at an equality Pr(Sit. 3)
4
stormPr(Sit. 3) 1 Pr( | ) 0.5 3.68 10−= ⋅ ⋅ = ⋅CS D (7) from which we derive that 4
stormPr( | ) 7.36 10−= ⋅CS D . Using also that
storm stormPr( | ) 1 Pr( | )= −CS D CS D a value for can be derived. Thus, all together, we have for the storm situations:
stormPr( | and )SF CS D
5 5
4 4
Pr(Sit. 1) 6.70 10 0.999264 0.5 3.35 10Pr(Sit. 3) 1 7.36 10 0.5 3.68 10
− −
− −
= ⋅ ⋅ ⋅ = ⋅
= ⋅ ⋅ ⋅ = ⋅ (8)
First, let us see what would be the effect of reducing the unreliability of the CS as much as two times. That is, we are going to substitute the probability
4stormPr( | ) 7.36 10−= ⋅CS D with 4
stormPr( | ) 3.68 10−= ⋅CS D . Recalculating the probabilities of situation 1 and 3 brings us to the following result 5 4Pr(Sit. 1) Pr(Sit. 3) 3.35 10 1.84 10 2.17 10 4− −+ = ⋅ + ⋅ = ⋅ − (9) which shows an improvement a little below 2 times relative to the figure that appear in (6), as it is situation 3 that gives rise to the dominant contribution to the over-all reliability in the storm situation. Had not only the storm situation but all situations been considered, the gain would not have been as pronounced because the rates of failure in the two non-storm situations, 2 and 4, are of the same magnitude as in situation 3. Next let us see what would be the effect of reducing the probability of major structural failures of WTBs given the unreliability of the CS remains untouched, i.e., 4
stormPr( | ) 3.68 10−= ⋅CS D . This case is somewhat more complicated com-pared to the previous. We assume that the improvements of structural reliability are directed to have the WTB more durable given the CS properly works. This also means that the structural improvements are not directed to compensate the unreliability of the CS by having a more strong structure. That is, the aim is to see how the reduction of the probability would affect the stormPr( | and )SF CS D
32 Risø-R-1420(EN)
probability . Reducing this probability by two times gives the number
stormPr( and )SF D5
stormPr( | and ) 3.35 10−= ⋅SF CS D (i.e. half the first factor in the equa-tion in (8)) and consequently 5 4Pr(Sit. 1) Pr(Sit. 3) 1.68 10 3.68 10 3.85 10 4− −+ = ⋅ + ⋅ = ⋅ − (10) This result means that the improvements directed to reduce the structural unreli-ability as much as two times, provided the CS works properly, would reduce the probability of having collapse by approximately 1,05 times. That is, the effect of raising the reliability of the CS is clearly higher than that of raising structural reliability. One could now proceed to evaluate the costs of providing both a higher reliabil-ity of the CS and the structure. Based on the costs evaluated and the probabili-ties assessed it would not be a problem to make the right decision with respect to which measures are more effective and beneficial.
33 Risø-R-1420(EN)

34 Risø-R-1420(EN)
4 Structural Reliability This chapter considers the structural reliabilities of wind turbines. The main work and results obtained within this project are reported in the project reports [21], [26], and in the proceedings paper [25]. In these documents further refer-ences to relevant documents are given. This chapter mainly sums up the prereq-uisites and conclusions of the work and compares them with the results obtained in Chapter 3. This work focuses mainly on describing aerodynamic loads. In the project an effort has also been made to obtain information about hydrodynamic loads. A section below recapitulates the findings. Finally the chapter gives an illustrative example on cost-optimal structural reliability of offshore wind tur-bines. For the sake of completeness it is emphasised that strictly speaking fail-ure rates of structural collapses reported in Chapter 3 represent the tower, foun-dation and other structural components regarded as a system, whereas in the present chapter regards only component reliabilities. However, the structural system has little redundancy, i.e. it is almost of series type with few main com-ponents, implying that the system reliability is expected not deviate much from the component reliabilities computed in the present chapter. In the project an attempt to evaluate the structural reliability of current wind turbines by use theoretical means has been made for the reason of comparing with observed system reliability data. As explained in Chapter 2 this evaluation gives results, which are notional, i.e. they cannot be expected to fit with ob-served failure rates. However observing these low failure rates is actually not possible unless many, many years of data is available. Therefore it has been de-cided to make a theoretical assessment in spite of its drawbacks. It has shown to be so that there is an unfortunate balance between structural reliability and sys-tem reliability. There are two “handles to twist” to solve this problem: system reliability can be increased and structural reliability can be decreased. The rela-tive increase and decrease will of course depend on what will be the target of the over-all reliability (i.e. the combined structural and system reliability). It will also depend on what will be the costs spent and savings gained by the in-crease in system reliability and decrease in structural reliability, respectively. In order to get an idea about the possible target over-all reliability evaluation of cost-optimal structural reliabilities have been made in the project. As explained below in Section 4.3 this is especially relevant for offshore wind turbines. These cost-optimal structural reliabilities are also of notional type.
4.1 Structural Reliability – Aerodynamic Loads As decided in Chapter 3 an estimate of the structural reliability of a turbine un-der the extreme aerodynamic storm load has been regarded. This load case ap-pears in both structural design codes and in wind turbine design codes. Thus comparing with reliability levels of structural codes will be possible. The reli-ability levels are computed as the average of the reliabilities for a steel compo-nent, a FRP component and a concrete component. The results reported here are documented in [21]. However a few formulas are repeated for easy reference. Following derivations very similar to those in Sec-tion 4.3 below it is in [21] shown that the structural reliability (the complement
35 Risø-R-1420(EN)
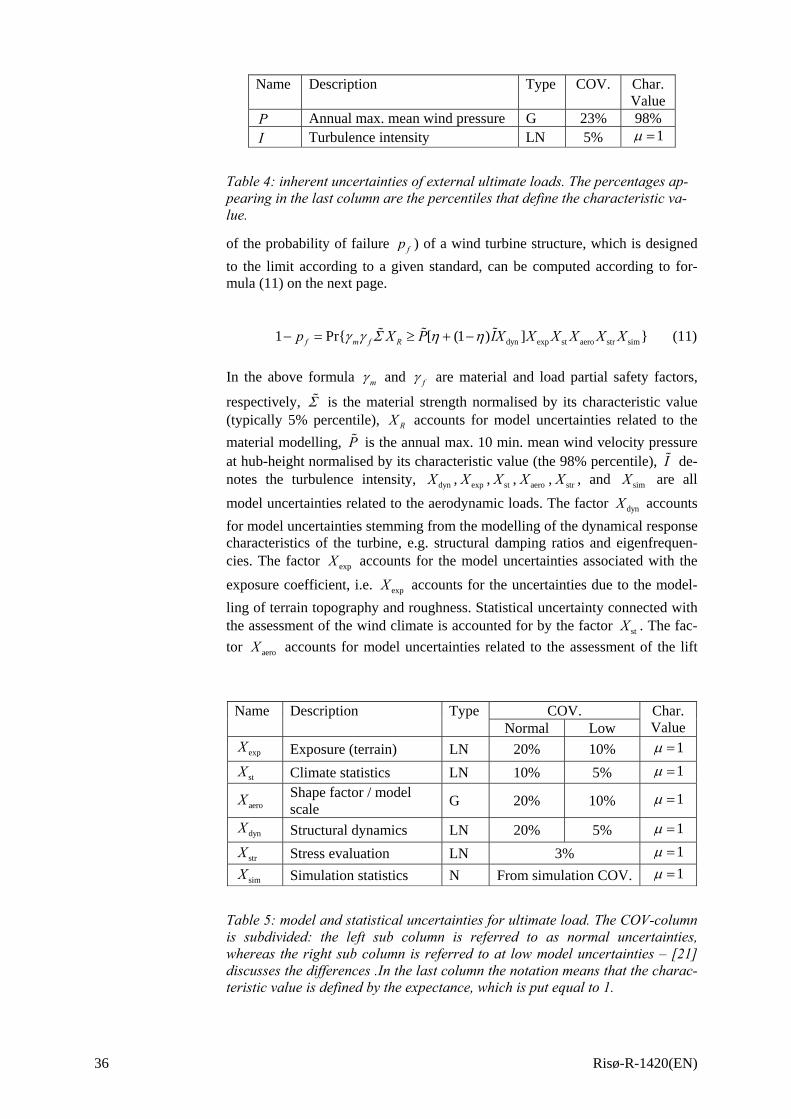
Name Description Type COV. Char. Value
P Annual max. mean wind pressure G 23% 98% I Turbulence intensity LN 5% 1µ =
Table 4: inherent uncertainties of external ultimate loads. The percentages ap-pearing in the last column are the percentiles that define the characteristic va-lue.
of the probability of failure fp ) of a wind turbine structure, which is designed to the limit according to a given standard, can be computed according to for-mula (11) on the next page. (11) dyn exp st aero str sim1 Pr [ (1 ) ]f m f Rp X P IX X X X Xγ γ Σ η η− = ≥ + − X In the above formula mγ and fγ are material and load partial safety factors,
respectively, is the material strength normalised by its characteristic value (typically 5% percentile),
ΣRX accounts for model uncertainties related to the
material modelling, is the annual max. 10 min. mean wind velocity pressure at hub-height normalised by its characteristic value (the 98% percentile), de-notes the turbulence intensity,
PI
dynX , expX , stX , aeroX , strX , and simX are all model uncertainties related to the aerodynamic loads. The factor dynX accounts for model uncertainties stemming from the modelling of the dynamical response characteristics of the turbine, e.g. structural damping ratios and eigenfrequen-cies. The factor expX accounts for the model uncertainties associated with the exposure coefficient, i.e. expX accounts for the uncertainties due to the model-ling of terrain topography and roughness. Statistical uncertainty connected with the assessment of the wind climate is accounted for by the factor stX . The fac-tor aeroX accounts for model uncertainties related to the assessment of the lift
COV. Name Description Type Normal Low
Char. Value
expX Exposure (terrain) LN 20% 10% 1µ =
stX Climate statistics LN 10% 5% 1µ =
aeroX Shape factor / model scale G 20% 10% 1µ =
dynX Structural dynamics LN 20% 5% 1µ =
strX Stress evaluation LN 3% 1µ =
simX Simulation statistics N From simulation COV. 1µ =
Table 5: model and statistical uncertainties for ultimate load. The COV-column is subdivided: the left sub column is referred to as normal uncertainties, whereas the right sub column is referred to at low model uncertainties – [21] discusses the differences .In the last column the notation means that the charac-teristic value is defined by the expectance, which is put equal to 1.
36 Risø-R-1420(EN)

Name Description Type COV. Char. Value
ssΣ Structural steel LN 5% 5%
FRPΣ Fibre Reinforced Polymer LN 10% 5%
conΣ Concrete LN 15% 5%
RX Model uncertainty LN 5%1 1µ =
Table 6: inherent ultimate material strength uncertainties and associated model uncertainty. The percentages appearing in the last column are the percentiles that define the characteristic value.
and drag coefficients, i.e. uncertainty originating from model-scale/full-scale disagreements and/or empirical-analytical estimates. The computation of the stresses from the loads, e.g. by use of FEM codes, is also affected by uncertain-ties which is modelled by the factor strX . The variable simX accounts for statis-tical uncertainties caused by the limited number of simulations conducted in order to estimate the extreme load-effect expectance. Its coefficient of variation (COV) is estimated from simulation results. Finally η is a measure of the ratio between the contribution of the mean wind response and the fluctuating re-sponse to the extreme storm response:
mean responseextreme response expectance
η = (12)
Except from mγ , fγ , and η all the variables are random variables. The distri-butions of the random variables, i.e. the uncertainty model, proposed in [21] are listed in Table 4 through Table 6. The last table lists the distributional assump-tions for the three different materials considered. Because the mean wind pres-sure is the annual max. the reliability has so-called reference period 1 year. Other reference periods could have been chosen, but one year is the typical ref-erence period in structural reliability.
P
4.1.1 Typical Reliability Levels
Before going into a discussion about the reliability of wind turbines it is worth-while to consider the reliability levels of some typical structural design codes. As an example the latest Danish structural code is considered. The target reli-ability for this newly revised structural design code was approx. 4.8, which ac-cording to Table 7, corresponds to an annual probability of failure fp of order
. It is noted that the uncertainty model for the aerodynamic load applied in that mentioned revision is different from the one used in [21]. The level of exposure model uncertainties is the same whereas there is no account of struc-tural dynamical model uncertainties (
75 10−⋅
dynX ). Furthermore the product of the un-certainties is replaced by a single uncertainty variable Q , which aero exp stPX X X
1 This value for the model uncertainty is not generally applicable. For instance model uncertain-
ties are higher for concrete dependent on the type of rupture (bending 8%, buckling 15%). For the sake of simplicity this has been disregarded in the present work, which considers the inher-ent uncertainty of material variability only.
37 Risø-R-1420(EN)
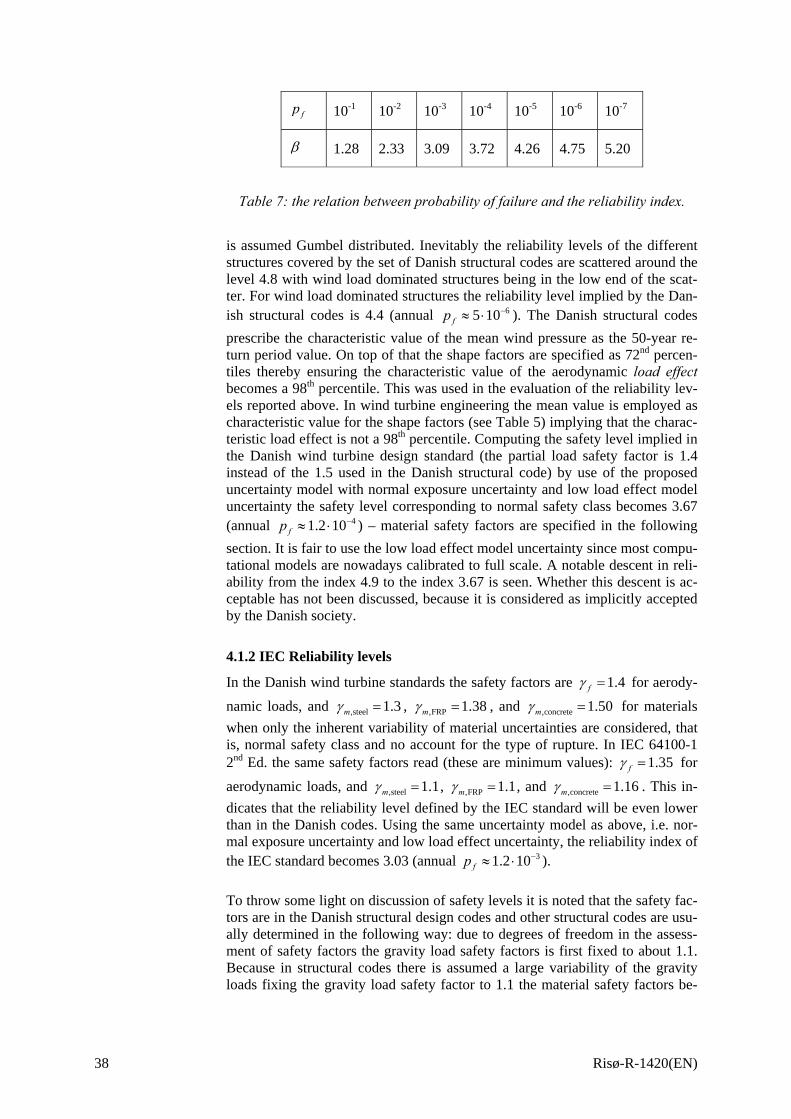
fp 10-1 10-2 10-3 10-4 10-5 10-6 10-7
β 1.28 2.33 3.09 3.72 4.26 4.75 5.20
Table 7: the relation between probability of failure and the reliability index.
is assumed Gumbel distributed. Inevitably the reliability levels of the different structures covered by the set of Danish structural codes are scattered around the level 4.8 with wind load dominated structures being in the low end of the scat-ter. For wind load dominated structures the reliability level implied by the Dan-ish structural codes is 4.4 (annual 65 10fp −≈ ⋅ ). The Danish structural codes prescribe the characteristic value of the mean wind pressure as the 50-year re-turn period value. On top of that the shape factors are specified as 72nd percen-tiles thereby ensuring the characteristic value of the aerodynamic load effect becomes a 98th percentile. This was used in the evaluation of the reliability lev-els reported above. In wind turbine engineering the mean value is employed as characteristic value for the shape factors (see Table 5) implying that the charac-teristic load effect is not a 98th percentile. Computing the safety level implied in the Danish wind turbine design standard (the partial load safety factor is 1.4 instead of the 1.5 used in the Danish structural code) by use of the proposed uncertainty model with normal exposure uncertainty and low load effect model uncertainty the safety level corresponding to normal safety class becomes 3.67 (annual 41.2 10fp −≈ ⋅ ) – material safety factors are specified in the following section. It is fair to use the low load effect model uncertainty since most compu-tational models are nowadays calibrated to full scale. A notable descent in reli-ability from the index 4.9 to the index 3.67 is seen. Whether this descent is ac-ceptable has not been discussed, because it is considered as implicitly accepted by the Danish society.
4.1.2 IEC Reliability levels
In the Danish wind turbine standards the safety factors are 1.4fγ = for aerody-namic loads, and ,steel 1.3mγ = , ,FRP 1.38mγ = , and ,concrete 1.50mγ = for materials when only the inherent variability of material uncertainties are considered, that is, normal safety class and no account for the type of rupture. In IEC 64100-1 2nd Ed. the same safety factors read (these are minimum values): 1.35fγ = for aerodynamic loads, and ,steel 1.1mγ = , ,FRP 1.1mγ = , and ,concrete 1.16mγ = . This in-dicates that the reliability level defined by the IEC standard will be even lower than in the Danish codes. Using the same uncertainty model as above, i.e. nor-mal exposure uncertainty and low load effect uncertainty, the reliability index of the IEC standard becomes 3.03 (annual 31.2 10fp −≈ ⋅ ). To throw some light on discussion of safety levels it is noted that the safety fac-tors are in the Danish structural design codes and other structural codes are usu-ally determined in the following way: due to degrees of freedom in the assess-ment of safety factors the gravity load safety factors is first fixed to about 1.1. Because in structural codes there is assumed a large variability of the gravity loads fixing the gravity load safety factor to 1.1 the material safety factors be-
38 Risø-R-1420(EN)
come larger than one should expect (e.g. the COV. of gravity loads is about 10% and the COV. for steel strength is 5%, however the respective safety fac-tors are typically 1.1 and 1.3. The opposite would appear more natural.)2 Having too large material safety factors implies that the aerodynamic load safety factor becomes relatively small compared to the gravity and material safety factors. Therefore one must be aware that adopting in the IEC standard the load factors 1.35 and 1.1 for aerodynamic and gravity loads but without having large mate-rial safety factor causes the low reliability level. Reliability levels and partial safety factors for foundations is a highly relevant issue too. Especially the relation to the choice of gravity load safety factor is important because choosing a gravity safety factor larger then 1.0 may make it impossible to obtain equilibrium in certain failure modes in the soil. However, due to its complexity it has been left out in the preliminary studies carried in the project reported on here.
4.2 Structural Reliability – Hydrodynamic Loads Within the project an effort has been made to discuss the possible sources of model uncertainties related to hydrodynamic loads on offshore wind turbine foundations. A separate quantification of these uncertainties has however not been possible within the limited sources of the project. In Appendix B a note, prepared during the course of the project, on the possible sources of uncertainty is included. It has however been possible to obtain a report on a very elaborate work on structural reliability of offshore steel platforms [22] (in that report fur-ther references are given). That work has formed the background of the North West European Annex environmental load factor to ISO Fixed Steel Offshore Structures Code 19902. It is therefore highly relevant in the context of the pro-ject. In that work quantification of all relevant uncertainties are presented. It turns out that the average unreliability of components in platforms in the North Sea is about annual 3.9β = ( 54.8 10fp −= ⋅ ) under the assumptions made in [22], which are essentially deep water waves and drag dominated hydrodynamic loads, and design being conducted according to the ISO standard which means little dynamic behaviour. Component reliability is not the same as system reliability. Wind turbine struc-tures are made out of components, which behave as if connected in series (i.e. foundation, tower, rotor) where the collapse of one component implies that the turbine becomes inoperative. Because a wind turbine has so very few main components it is expected that the system reliability does not deviate much from the component reliabilities computed in the present chapter. Therefore compo-nents were considered in section 4.1 and hence the annual 3.09β = arrived at in the previous section should be compared with the above-mentioned compo-nent reliability index 3.9 for hydrodynamic loads, rather than for system reli-abilities of offshore platforms. It seems, if the assumptions made in [22] and section 4.1 are comparable, that, roughly speaking, an offshore turbine designed according to a mix of current standards can end up being relatively more reli-able with respect to hydrodynamic loads than with respect to aerodynamic loads. Or, stated differently, an offshore turbine will be safer than onshore tur-bine.
2 Some standards introduce more load cases in order to overcome this problem – e.g. Eurocodes
for which some countries specify 1.35 for the gravity load safety factor.
39 Risø-R-1420(EN)
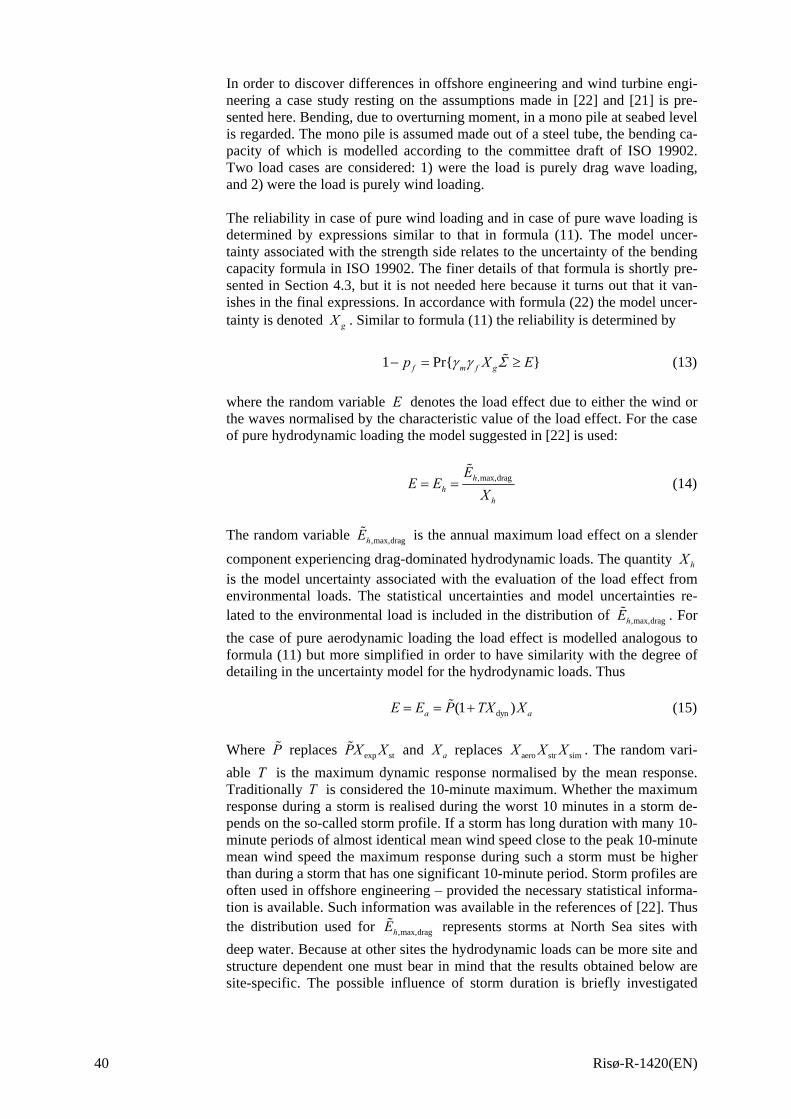
In order to discover differences in offshore engineering and wind turbine engi-neering a case study resting on the assumptions made in [22] and [21] is pre-sented here. Bending, due to overturning moment, in a mono pile at seabed level is regarded. The mono pile is assumed made out of a steel tube, the bending ca-pacity of which is modelled according to the committee draft of ISO 19902. Two load cases are considered: 1) were the load is purely drag wave loading, and 2) were the load is purely wind loading. The reliability in case of pure wind loading and in case of pure wave loading is determined by expressions similar to that in formula (11). The model uncer-tainty associated with the strength side relates to the uncertainty of the bending capacity formula in ISO 19902. The finer details of that formula is shortly pre-sented in Section 4.3, but it is not needed here because it turns out that it van-ishes in the final expressions. In accordance with formula (22) the model uncer-tainty is denoted gX . Similar to formula (11) the reliability is determined by 1 Prf m f g p X Eγ γ Σ− = ≥ (13) where the random variable E denotes the load effect due to either the wind or the waves normalised by the characteristic value of the load effect. For the case of pure hydrodynamic loading the model suggested in [22] is used:
,max,draghh
h
EE E
X= = (14)
The random variable is the annual maximum load effect on a slender
component experiencing drag-dominated hydrodynamic loads. The quantity ,max,draghE
hX is the model uncertainty associated with the evaluation of the load effect from environmental loads. The statistical uncertainties and model uncertainties re-lated to the environmental load is included in the distribution of . For the case of pure aerodynamic loading the load effect is modelled analogous to formula (11) but more simplified in order to have similarity with the degree of detailing in the uncertainty model for the hydrodynamic loads. Thus
,max,draghE
dyn(1 )a aE E P TX X= = + (15) Where replaces and P exp stPX X aX replaces aero str simX X X . The random vari-able is the maximum dynamic response normalised by the mean response. Traditionally T is considered the 10-minute maximum. Whether the maximum response during a storm is realised during the worst 10 minutes in a storm de-pends on the so-called storm profile. If a storm has long duration with many 10-minute periods of almost identical mean wind speed close to the peak 10-minute mean wind speed the maximum response during such a storm must be higher than during a storm that has one significant 10-minute period. Storm profiles are often used in offshore engineering – provided the necessary statistical informa-tion is available. Such information was available in the references of [22]. Thus the distribution used for represents storms at North Sea sites with deep water. Because at other sites the hydrodynamic loads can be more site and structure dependent one must bear in mind that the results obtained below are site-specific. The possible influence of storm duration is briefly investigated
T
,max,draghE
40 Risø-R-1420(EN)
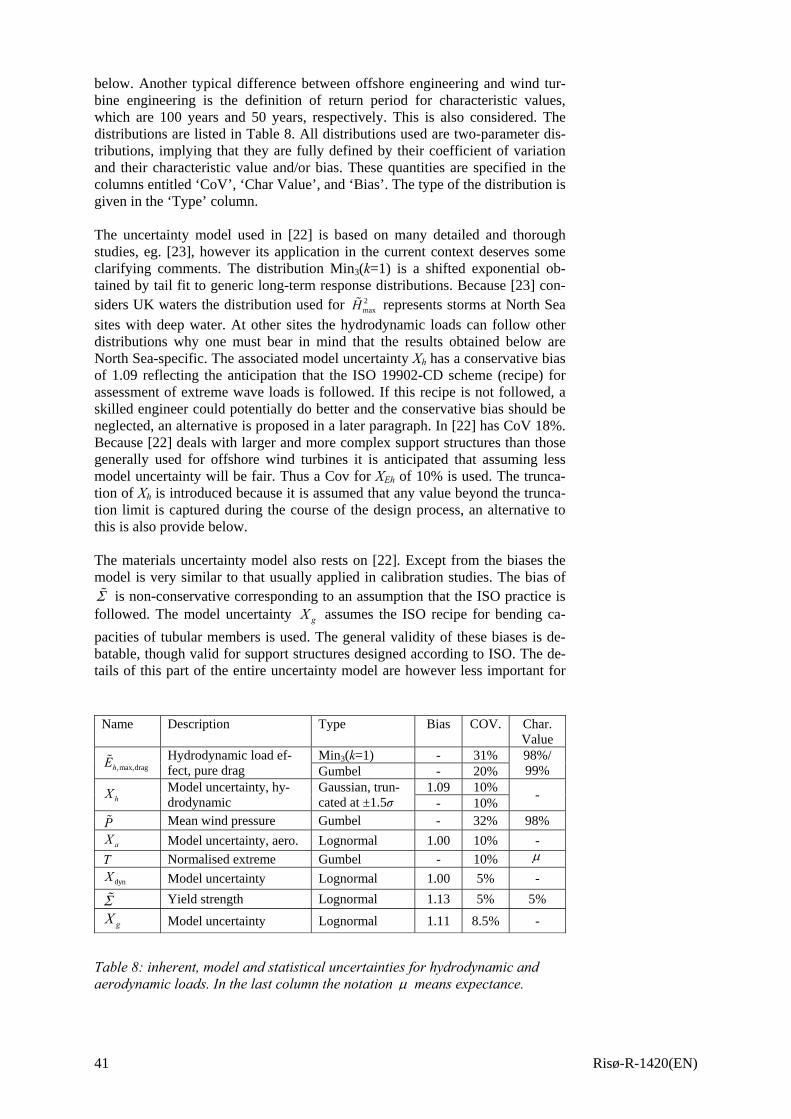
below. Another typical difference between offshore engineering and wind tur-bine engineering is the definition of return period for characteristic values, which are 100 years and 50 years, respectively. This is also considered. The distributions are listed in Table 8. All distributions used are two-parameter dis-tributions, implying that they are fully defined by their coefficient of variation and their characteristic value and/or bias. These quantities are specified in the columns entitled ‘CoV’, ‘Char Value’, and ‘Bias’. The type of the distribution is given in the ‘Type’ column. The uncertainty model used in [22] is based on many detailed and thorough studies, eg. [23], however its application in the current context deserves some clarifying comments. The distribution Min3(k=1) is a shifted exponential ob-tained by tail fit to generic long-term response distributions. Because [23] con-siders UK waters the distribution used for 2
maxH represents storms at North Sea sites with deep water. At other sites the hydrodynamic loads can follow other distributions why one must bear in mind that the results obtained below are North Sea-specific. The associated model uncertainty Xh has a conservative bias of 1.09 reflecting the anticipation that the ISO 19902-CD scheme (recipe) for assessment of extreme wave loads is followed. If this recipe is not followed, a skilled engineer could potentially do better and the conservative bias should be neglected, an alternative is proposed in a later paragraph. In [22] has CoV 18%. Because [22] deals with larger and more complex support structures than those generally used for offshore wind turbines it is anticipated that assuming less model uncertainty will be fair. Thus a Cov for XEh of 10% is used. The trunca-tion of Xh is introduced because it is assumed that any value beyond the trunca-tion limit is captured during the course of the design process, an alternative to this is also provide below. The materials uncertainty model also rests on [22]. Except from the biases the model is very similar to that usually applied in calibration studies. The bias of
is non-conservative corresponding to an assumption that the ISO practice is followed. The model uncertainty Σ
gX assumes the ISO recipe for bending ca-pacities of tubular members is used. The general validity of these biases is de-batable, though valid for support structures designed according to ISO. The de-tails of this part of the entire uncertainty model are however less important for
Name Description Type Bias COV. Char. Value
Min3(k=1) - 31% ,max,draghE Hydrodynamic load ef-
fect, pure drag Gumbel - 20% 98%/ 99%
1.09 10% hX Model uncertainty, hy-
drodynamic Gaussian, trun-cated at ±1.5σ - 10% -
P Mean wind pressure Gumbel - 32% 98%
aX Model uncertainty, aero. Lognormal 1.00 10% - T Normalised extreme Gumbel - 10% µ
dynX Model uncertainty Lognormal 1.00 5% -
Σ Yield strength Lognormal 1.13 5% 5%
gX Model uncertainty Lognormal 1.11 8.5% -
Table 8: inherent, model and statistical uncertainties for hydrodynamic and aerodynamic loads. In the last column the notation µ means expectance.
41 Risø-R-1420(EN)
the conclusions of this study, since the same materials uncertainty model is em-ployed for both wind and wave loads. Thus the absolute values of reliability levels computed herein may be discussed but the derived safety factors are not very sensitive to changes of the material uncertainty model. Though studies of the same degree of detailing as that in [22] are hard to find, alternative exists. Thus one of the partners of the project has proposed to con-sider instead the distribution of to be Gumbel with CoV=20% and an associated lognormally distributed model uncertainty of CoV=10% and no bias. This is motivated by the observation that back-calculations from wanted target reliabilities yield CoVs of this magnitude if a Gumbel distribution assumption for the environmental loads is made. The background of this alternative is fur-ther discussed in [24] which also shows that the outcome of such assumptions do deviate much from the results presented here.
,max,draghE
As mentioned the characteristic extreme wind load effect is traditionally com-puted as the expected maximum only during the 10-minute peak mean wind speed in a 50-year return period storm and not for the entire storm. This intro-duces a non-conservative model uncertainty. Similarly for the wave loads; here tradition is to consider the expected maximum in the peak 3-hour state of the 100- or 50-year return period storm event. In order to compare the reliability of purely aerodynamically loaded and purely hydrodynamically loaded structures, assuming the described traditions are followed, an assessment of the distribu-tions of the implied model uncertainties is required. In [24] the average of these model uncertainties are approximately assessed. For wind load effects it has been found that the average is about 1.05 and for drag wave loads an average of about 1.10 is found. Denoting the average the model uncertainty can be introduced in Eq. (13) as follows:
stormc
storm1 Prf m f g p X c Eγ γ Σ− = ≥ (16) In the following reliability levels of structures subject to purely hydrodynamic and aerodynamic loading under various presumptions are considered. Common for all cases is however that for the load effect a partial safety factor of 1.35 is employed. This factor is suggested both in the committee drafts of ISO 19902 (or to be exact: in the regional annex for Northern Europe) and IEC 61400-1, 3rd Ed. Also for the resistance safety factor the same value is used in all cases, namely 1.05 which is taken from the committee draft of ISO 19902. Though, as discussed in Section 2.3, the reliabilities obtained in the present chapter cannot be given a strict frequentistic interpretation they can be com-pared. The validity of such a comparison rests on the assumption that the uncer-tainty models are comparable – i.e. equally good (or bad). To the authors’ knowledge no studies have been made to establish joint uncertainty models for wind and wave load effects. Due to the similarity in detail of the models pre-sented in the present section it is judged that they will be in agreement up to differences of about 0.25 in the reliability index. The table below summarises the results:
Situation β pf
Pure wave drag load, 100-year return period, 3.78 7.8·10-5
42 Risø-R-1420(EN)
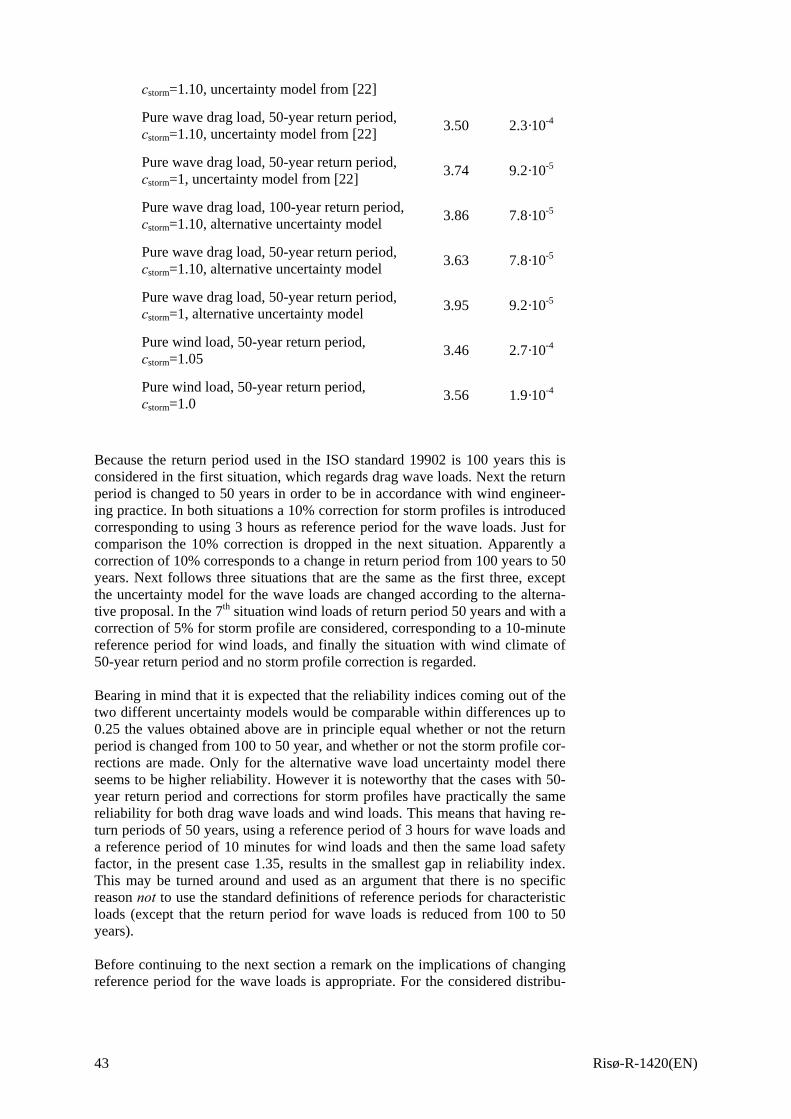
cstorm=1.10, uncertainty model from [22]
Pure wave drag load, 50-year return period, cstorm=1.10, uncertainty model from [22] 3.50 2.3·10-4
Pure wave drag load, 50-year return period, cstorm=1, uncertainty model from [22] 3.74 9.2·10-5
Pure wave drag load, 100-year return period, cstorm=1.10, alternative uncertainty model 3.86 7.8·10-5
Pure wave drag load, 50-year return period, cstorm=1.10, alternative uncertainty model 3.63 7.8·10-5
Pure wave drag load, 50-year return period, cstorm=1, alternative uncertainty model 3.95 9.2·10-5
Pure wind load, 50-year return period, cstorm=1.05 3.46 2.7·10-4
Pure wind load, 50-year return period, cstorm=1.0 3.56 1.9·10-4
Because the return period used in the ISO standard 19902 is 100 years this is considered in the first situation, which regards drag wave loads. Next the return period is changed to 50 years in order to be in accordance with wind engineer-ing practice. In both situations a 10% correction for storm profiles is introduced corresponding to using 3 hours as reference period for the wave loads. Just for comparison the 10% correction is dropped in the next situation. Apparently a correction of 10% corresponds to a change in return period from 100 years to 50 years. Next follows three situations that are the same as the first three, except the uncertainty model for the wave loads are changed according to the alterna-tive proposal. In the 7th situation wind loads of return period 50 years and with a correction of 5% for storm profile are considered, corresponding to a 10-minute reference period for wind loads, and finally the situation with wind climate of 50-year return period and no storm profile correction is regarded.
Bearing in mind that it is expected that the reliability indices coming out of the two different uncertainty models would be comparable within differences up to 0.25 the values obtained above are in principle equal whether or not the return period is changed from 100 to 50 year, and whether or not the storm profile cor-rections are made. Only for the alternative wave load uncertainty model there seems to be higher reliability. However it is noteworthy that the cases with 50-year return period and corrections for storm profiles have practically the same reliability for both drag wave loads and wind loads. This means that having re-turn periods of 50 years, using a reference period of 3 hours for wave loads and a reference period of 10 minutes for wind loads and then the same load safety factor, in the present case 1.35, results in the smallest gap in reliability index. This may be turned around and used as an argument that there is no specific reason not to use the standard definitions of reference periods for characteristic loads (except that the return period for wave loads is reduced from 100 to 50 years). Before continuing to the next section a remark on the implications of changing reference period for the wave loads is appropriate. For the considered distribu-
43 Risø-R-1420(EN)
tion of the wave load effect a change in return period from 100 years to 50 years imply a reduction in characteristic load effect by 10%. Thus keeping the safety factor 1.35 but reducing the return period to 50 years is equivalent to applying a reduced safety factor of magnitude 0.9·1.35=1.22 to the 100-year return period load effect. Considering that the safety factor 1.35 is aimed at providing suffi-cient reliability of offshore structures designed to the so-called exposure level L1 in the ISO-terminology, which means structures for which the consequences of failure are high (e.g. pollution) and/or human life safety is compromised (e.g. the platform is manned at any time including storm events), it would be accept-able to adopt a lower safety factor for offshore turbines for which the conse-quences of failure are low (e.g. no pollution) and human life safety is not com-promised (e.g. the platform is unmanned in storm events) corresponding to ex-posure level L3 in the ISO-terminology. To the authors’ knowledge there are still no guidelines from ISO on what would be a reasonable load safety factor in such a case of an unmanned non-polluting installation.
4.3 Cost-Optimal Structural Reliability of Off-shore turbines Though wind power is close to being competitive to traditional power produc-tion there is still a need for further savings. Among the many different contribu-tors to the total costs of an offshore wind turbine one finds the material costs. These are dictated by the design, which in turn is determined from the external loading and the material strengths in terms of the so-called design loads and the design strength. The design values are assessed so that certain low probability of structural failure is ensured. Consequently, provided the same geometry of design and the same material are regarded, and under the assumption that tur-bine structures are generally designed to the limit, material savings can only be obtained if the failure probability is be lowered. On the other hand the costs of any design will generally benefit from a reduction of the minimum demands for the probability of failure. As explained in Section 4.1 the concept of partial safety factors and characteris-tic values has been adopted from civil engineering. The actual values and defi-nitions of the safety factors and characteristic values have to a large extend been adopted too, implying that, by and large, the same level of structural reliability has been inherited. The current reliability level of civil engineering standards has emerged over many years of evolutionary development through which a level of reliability acceptable to the public has been reached. This level ensures that an acceptably low risk of human injury is obtained at reasonable costs. Thus the cost of avoiding human injury is implicit in current wind turbine stan-dards. For offshore turbines the probability of human injury during storm condi-tions is small. One could therefore argue that neglecting the price of preventing human injury, which is high in industrialized countries, would open a possibility for assessing a level of structural reliability of offshore turbines by cost-optimisation. Though purely wind-loaded structures have structural reliabilities in the low end of the range of reliabilities implied by the building structure standards there may still be space for further reductions. In the proceedings [25] and in one of the project reports [26] detailed examples of assessment of cost-optimisation are given. For the purpose of illustration a simple example exhibiting essentially the same features as the examples in [25] and [26] is given herein. Both for this example and for the example reported in [25] it has been decided that for these first studies the costs of the control/safety
44 Risø-R-1420(EN)
system can be neglected, as they are assumed small compared to the costs of the entire structure. However, in one of the cases in [26] the costs of improving the control/safety system is included. It turns out that the results are not dramati-cally affected by including the control/safety system costs, implying that ne-glecting them is acceptable.
4.3.1 An example
The example considers a tubular tower subjected to extreme wind loads – that is, fatigue loads are note regarded. These are included in [26]. In [25] extreme loads due to ice and wind in combination are considered. The framework applied herein for the acceptance criteria assessment is taken from [27]. The acceptance criterion follows from an optimisation problem that consists in maximizing the expected monetary gain obtained by operating an offshore wind turbine and possibly having re-erect it now and then in case of failure – that is, the turbine(s) is/are (unrealistically) expected to be operated in infinity and systematically rebuild in case of failure. The turbine is part of a park, but special joint effects are not considered. Under these assumptions the optimisation problem becomes:
( ) ( ) ( )
( )0 0 0 0
( )max
s.t. , 1,...,
fI I F
f
l ui i i
pC C CbWr C C C C r p
z z z i N
λλ
⎛ ⎞= − − +⎜ ⎟ +⎝ ⎠
≤ ≤ =
z
zz zz
z (17)
in which the symbols have the following meaning:
• ( )1,..., Nz z=z are the main design variables, e.g. diameter and thick-ness of tower and main dimensions of the foundation etc.
• is the initial (building) costs that can be written ( )IC z
( ) ( )0 1IC C C= +z z in which is a reference cost and 0C ( )1C z gives the dependence with z
• FC are the failure costs • are the benefits per year b• is the real rate of interest r• λ is rate of a Poisson process which is assumed to model the failure
events, i.e. in the present report the initiating event that the mean wind speed up-crosses the cut-out wind speed level, and ( )fp z is the prob-ability of failure.
• and are possible lower and upper bounds on the design variables. lz uz In the objective all terms have been normalized by the reference cost . The first term is the lifetime benefit discounted to the time of erection using the real rate of interest. The second term is the initial construction costs and the third term is the discounted lifetime average reconstruction costs associated with the expected number of reconstructions. Thus is the discounted eco-nomical gain over the lifetime normalized by the reference cost . It is noted that the optimisation problem has no constraints on the probability of failure. The optimal design is determined by the solution to (17). The corresponding value
( )W z 0C
( )W z
0C
*z( )*
fp z is then the optimal probability of failure, which defines the ac-
45 Risø-R-1420(EN)
ceptance criterion related to the failure events. The product may, as it will be the case here, be computed directly as the annual probability of failure.
( )fpλ z
The initial construction costs are split into
(18) ,foundation ,tower ,blades ,powertrain ,others
turbineI I I I I IC C C C C C= + + + +
in which accounts for initial costs related to external and internal grid connections. The foundation is assumed to be a mono pile and in this simple example only the diameter,
,othersIC
D , and thickness, t , of the tower and mono pile are considered as possible design parameters and they are assumed constant over the entire tower and mono pile. Therefore the initial costs, in terms of the design parameters, become (19) 2 2
foundation tower 0,blades 0,powertrain 0,others( ) ( )
turbineIC h Dt t c h Dt t c C C Cπ π= − + − + + +
where denotes the cost of steel per unit volume. The reference costs are cho-sen as the costs of a reference turbine, which is designed to the limit according to existing standards. The design parameters of this turbine are denoted and
. In [25] the relative contributions of the individual reference costs to the total reference costs are discussed. The results are adopted here:
c
0D
0t
0,tower 0,blades 0,powertrain0,foundation 0,others
0 0
1 1 1 1 1, ,6 2 3 3 3
C C CC CC C 0
13C
+ + ⎛ ⎞= = + +⎜ ⎟⎝ ⎠
= (20)
Because 2
,tower 0,tower 0 0 0( ) (IC C Dt t D t t2 )= − − , and likewise for the foundation, it now follows that
2
20 0 0 0
13 3
IC Dt tC D t t
− 2= +
− (21)
In accordance with [25] the relative benefits per year (reduced by O&M ex-penses) and the relative failure costs are set to 1/8 and 1/36, re-spectively. Finally one needs to decide on the interest rate. If a public view an-gle is considered a typical choice of interest rate would be rather low, say 3%. Now, offshore wind farms are typically established by power supply companies who have work on a short time horizon than governmental authorities do. Their time horizon is however still longer than smaller private companies which would probably consider real rates of 10%-15%. Therefore the real rate of inter-est is set to 6% to 10% in this work.
0/b C 0/FC C
In addition to the cost model in (21) a procedure for the computation of annual probability of failure ( )fpλ z is required. It is assumed that the cross-sectional force (in the present case the bending moment) in any point of the tower and foundation is proportional to the mean wind pressure at hub-height. Further, due to local buckling, the strength of the tower/foundation is less than the yielding moment. If denotes the annual maximum mean wind pressure at hub-height, Pα denotes the proportionality factor (i.e. the influence number) between mean
46 Risø-R-1420(EN)
wind pressure and cross-sectional bending moment, yσ denotes the yield stress, and ( , )g D t denotes the strength reduction factor accounting for local-buckling, then the annual probability of failure, as function of the design parameters, is given by ( ), Pr ( , )f g yp D t g D t X Pλ σ α= ≤ (22) where a model uncertainty factor gX associated with the strength reduction factor has been introduced. Because the influence number α is independent of the cross-section geometry, it can be expressed in terms of the design of the ref-erence turbine, which – because it is designed to the limit – fulfils the so-called design equation:
,c0 0 c( , ) y
fm
g D t Pσ
α γγ
∗∗ = (23)
where mγ ∗ and fγ ∗ are material and load safety factors, respectively, index ‘c’ denotes characteristic values. Substituting (23) into (22) one has the final ex-pression
( )0 0 ,c c
( , ), Pr( , )
yf f m g
y
g D t Pp D t Xg D t P
σλ γ γ
σ∗ ∗= ≤ (24)
The asterisks in fγ ∗ and mγ ∗ emphasise that these safety factors are reference values taken from current standards. Safety factors corresponding to the opti-mised reliability levels are, according to (23), related to the reference factors through
,c
c 0 0
( , )( , )( , )
yf m
g D tg D tP g D t f m
σγ γ
αγ γ∗ ∗= = (25)
It is noted that safety factors are not required in order to solve Eq. (17). They are merely used here to signify the obtained reliability level in terms of a set of quantities that most designers are familiar with. Thus the ratio /f m f mγ γ γ γ∗ ∗ will for most designers give a clear idea about the possible savings resulting from the cost-optimal reliability level. The reduction factor ( , )g D t is taken from the current committee draft of the ISO standard for offshore steel platforms:
3 31( , ) [ ( 2 ) ]6
1 0.0517
1.13 2.85 0.0517 0.1034
0.94 0.76 0.1034 120
y
y y
y y
g D t D D t
DE t
D DE t E t
D D y
E t E t
σ
σ σ
Eσ σ σ
= − − ×
⎧≤⎪
⎪⎪
− <⎨⎪⎪
− <⎪⎩
≤
≤
(26)
47 Risø-R-1420(EN)

The distribution of and P σ are Gumbel and log-normal with COV (Coeffi-cient Of Variation) 40% and 5%, respectively. The large COV of accounts for model uncertainties. Both distributions are normalised by their characteristic values implying that their 98% percentiles and 5% percentiles, respectively, equal 1. The distribution of the model uncertainty factor
P
gX is log-normal with mean 1.11 and COV 8.5%. The choice of distributions is discussed in detail in [25] and [21]. For the reference turbine, i.e. the turbine, which is designed to the limit accord-ing to current standards, the annual probability of failure is 4
,0 3.4 10fpλ −= ⋅ ,
and the discounted normalised gain is 0 1.08W = if the rate of interest is 6%, and (these values are taken from the aforementioned committee draft of the ISO standard). The normalised direct costs of the refer-ence turbine are (per definition) 1. Assuming that
1.35 1.05 1.42f mγ γ∗ ∗ = ⋅ =
0 4 mD = and for the reference turbine the cost-optimal turbine has
0 0.05 mt =7.29 mD = and ,
, 0.019 mt =
412 10fpλ −= ⋅ 1.25f mγ γ = , 1.17W = , and normalised direct costs . The diameter and thickness are unrealistic and actually outside
the domain of validity of (26). In order to avoid unfortunate coincidence of 10/ 0.8IC C = 9
st tower frequency and 1P one could introduce a stiffness demand requiring that the section modulus of the optimal turbine tower must equal that of the refer-ence turbine. In that case the optimal turbine has 4.63 mD = and ,
, 0.032 mt =
428 10fpλ −= ⋅ 1.12f mγ γ = , 1.13W = , and 0/ 0.9IC C 1= . It is seen that the optimised gain is only about 5% to 10% larger than the non-optimised gain, however the relative savings on initial costs are about 10%. Though there is an increase in probability of failure with a factor from about 4 to about 8 there is a comparatively small improvement in gain. This is due to the fact that the optimum is rather flat – a general feature of structural optimisa-tion problems, even if limited lifetimes or no systematic rebuilding are consid-ered and if structurally more reliable structures are considered. The benefit of cost-optimisation of structural reliability lies in the savings on initial costs, that is, costs are effectively postponed until future reconstruction, however this does not change the over-all picture that, at the expense of large reliability reduc-tions, gains in the long-run, which are decisive for the costs of offshore wind power, are minimal. Considering that the uncertainty models are generally un-certain themselves it is ambiguous whether it is feasible to reduce the reliability levels or not. Similar results are obtained in [25] and [26]. Because in this ex-ample (and in the examples in [25] and [26]) only the tower design is consid-ered, larger relative savings could be expected if also the rotor and power train are included. Since the blade design is also governed by stiffness demands relat-ing to tower clearance the increase in relative gain may not be that big. As pointed out in [25] larger gains can potentially be obtained by improving on O&M expenses, which are considerable for offshore turbines. The apparently small economical gain of the reliability-based cost optimisation seen in the light of O&M costs is due to the accuracy of the uncertainty models used in the structural reliability evaluations carried out in the present report. The application of structural reliability methods, and cost-optimisation to offshore wind turbines requires more accurate uncertainty models in order to obtain more reliable results that go beyond what has been achieved in the present report. Be-
48 Risø-R-1420(EN)

cause wind turbines are rather well defined structures it is expected that further investigations into this matter will yield notable improvements. Finally it is noted that the optimisation studies here and in [25] and [26] have been limited to cylindrical steel tube towers as these are expected to be the most realistic design choice because of above-mentioned tower clearance require-ments. One might however look into other design concepts.
4.4 Comparing the Results of Structural Reliabil-ity and System Reliability Assessments In this section the results presented in this chapter and in Chapter 3 are related to each other. As explained in Section 2.3 comparing observed failure rates and theoretically derived structural reliability levels cannot be done in a strict way due to the notional character of the theoretical estimates. Recalling that the theoretical structural reliability analysis considered in the present work provides an estimate of reliability against collapse in the storm situation comparisons can only be made with situation 1 (see formula (5)). That is, one must look into Table 3 for outcomes in situation 1, to see what the failure data analysis can provide. It is seen that for the period 1984-2000 the number of “most probable” observations of turbines that have collapsed in the storm situation with a prop-erly working control/safety system is only 1, which corresponds to a failure rate of 3.35·10-5 yr-1. This is of course much too little data to make a strict compari-son. It is however notable that the reliabilities reported in the table on page 42 are comparable to this failure rate.
49 Risø-R-1420(EN)
5 Conclusions
5.1 Project contents
The over-all aim of the project has been to establish an account of the knowl-edge about the balance between the importance of the wind turbine control and safety system on the one hand and the wind turbines structure on the other hand for the structural failures of wind turbines and possibly judged what would be the situation of offshore turbines. To deal with these issues the project has dealt with
• The formulation of a general framework for the assessment of the struc-
tural reliability of wind turbines including the reliability of the control and safety system. The framework also gives the frame for reliability-based cost-optimisation of design.
• An account of the state-of-the-art in the fields of structural reliability of wind turbines and system analysis of wind turbine control and safety systems.
• An analysis of failure databases for onshore turbines with the aim of in-vestigating the structural and system reliability of existing wind turbines in a few special cases and from the results possibly derive some indica-tion of the balance between structural and system reliabilities of present day offshore turbines.
• The application of structural reliability methods, and cost-optimisation to offshore wind turbines under the assumption that the control and safety system works as required.
5.2 Main conclusions The main conclusions of the project are:
• Available data on failures of wind turbines is generally ambiguous. Only databases for onshore turbines in the 1980’s and 1990’s have been avail-able to the project.
• Reporting failure occasions to the EMD database is voluntary and we may expect that not all failures be recorded in the database. Thus, one can truly conclude that the reliability assessments exhibited in the cur-rent report have to be considered optimistic.
• There is a tendency in the databases that there has been a predominance of structural failures that have been caused by malfunctioning of the control and safety system, i.e. an unfavourable unbalance between sys-tem and structural reliability.
• An idea has been that unfortunate design, due to the youth of the wind turbine industry, rather than careless design and random failures could be the main reason for the unbalance between system and structural reli-ability. Data was too ambiguous to support an investigation of the truth of such an idea.
50 Risø-R-1420(EN)

• There seems to be a positive development in the direction of reduced unbalance between system and structural reliability for newer turbines. This supports a general anticipation that the wind turbine industry has improved. It should however be emphasised that the ambiguity of data does not allow for reliable assessment of developments in time.
• Forecasting the seemingly positive development into the 2000’s is not really possible. However a linear extrapolation of the estimated trend was made. This extrapolation shows that the unbalance prevails though it is reduced. Among the project partners there is however believe that the improvement of the industry has been more rapid than linear in time. Thus it is expected, but not documented, that there is probably at most minor unbalance in present day turbines.
• A thrifty and scrupulous recording and collection of failure occurrences would really be beneficial for the wind turbine manufacturers, as the failure data serve as an important input for the optimisation of the wind turbine design.
• The theoretical assessments of structural reliability against hydrody-namic and aerodynamic loads in the storm situation, under the assump-tion that the control/safety system performs as expected, indicate, within the accuracy of the considered uncertainty models, that the reliabilities levels are comparable if a load safety factor 1.35 is used together with 50-year return period load effects computed as the expected 10-min. max. response to the wind load at the 50-year return period storm peak and the expected 3-hour max. response to wave loads at the 50-year re-turn period storm peak – in both cases in a North sea environment. The obtained reliability levels in terms of (FORM) reliability index is about 3.5.
• Cost-optimisation studies based on structural reliability methods, both under the assumption that the control/safety system performs as ex-pected and not, and when fatigue and inspection planning are regarded, exhibit small improvements in gain of the optimal turbines relative to a present-day reference turbine design. This is due to the fact that the op-timum is rather flat – a general feature of structural optimisation prob-lems.
• The cost-optimum study shows that there is more money to gain in op-timisation of O&M costs. The apparently small economical gain of the reliability-based cost optimisation seen in the light of O&M costs is due to the accuracy of the uncertainty models used in the structural reliability evaluations carried out in the present report.
• The application of structural reliability methods, and cost-optimisation to offshore wind turbines requires more accurate uncertainty models in order to obtain more reliable results that go beyond what has been achieved in the present report. Because wind turbines are rather well de-fined structures it is expected that further investigations into this matter will yield notable improvements.
5.3 Some detailed conclusions Having an optimal wind turbine design requires having some recommended (or obligatory) permissible levels of unreliability. According to the account de-scribed in the current report, the most beneficial would be to have the permissi-ble level imposed on the probability of having a serious structural damage of the wind turbine. This is because this probability is calculated taking into account
51 Risø-R-1420(EN)
the reliability of all subsystems including the reliability of the control and safety system. There is probably no reason to expect that quantification of system reliability based on MTBFs of the individual components should become practise in the near future. Thus the ideal approach of cost-optimisation of offshore wind tur-bines including the system reliability as described in the report is not within reach. On the other hand it would be potentially fruitful to establish a reliable, systematic reporting system based on which one, i.e. the society, could perform an analysis as in this report, and then give firm recommendations on reference system reliability levels attained by present day design. Such a reference value could be taken up by a committee of experts, which by society could be ap-pointed the task of performing calibration of structural design rules (basically safety factors) so that an either cost-optimal or merely a predefined target over-all reliability level is ensured. Alternatively, but maybe less realistic the estab-lished reference value could enter into a reliability based design criterion, which would require, as a minimum, that the designer obeys the rules of current design practise for control/safety systems. For instance optimisation of design with re-spect to target over-all reliability where the free option would be to adjust only the structural design, whereby only the structural reliability would be affected, could be a possibility.
No matter how one turn all this around it seems that solid, exhaustive, unambi-guous failure data is a prime requirement if one wants to move further in the direction of quantitative treatments of system reliability. The approach de-scribed in the previous paragraph rests on the requirement that society collects and evaluates failure data, which is considered the ideal situation. In the current competitive wind turbine market it may be difficult, if not impossible, to obtain such a database. Alternatives would be that each manufacturer establishes its own database on the basis of which manufacture specific structural reliability levels may be derived – still with the acceptance of society, though. One could also imagine large-scale operators doing something similar.
5.4 Recommendation for future research From the conclusions it is clear that two major subjects would be candidates for future research. Both of them would support working out reliability criteria that could be used as constraints when designing “optimal WTBs” whereby proper balance between structural reliability and system reliability can be obtained. The one subject would be the establishment of a continuously working trust-ful system of reporting, retrieving and processing data on failures of wind turbines operating in Denmark or even all of Europe. The other subject would be the investigation of uncertainty models to apply in structural reliability models. There is a need for improved model uncertainty models that are aimed at offshore structures that are not predominantly loaded by wind or wave loads, that is, joint uncertainty models for the joint load effects of wind and wave loads are needed.
52 Risø-R-1420(EN)

53 Risø-R-1420(EN)
References [1] L.W.M.M. Rademakers, A.J. Seebregts, B.A. van den Horn, J.N.T. Je-
hee, B.M. Blok, R.W. van Otterloo: Reliability Analysis Methods for Wind Turbines; ECN-C--92-018, Petten, The Netherlands, June 1992.
[2] L.W.M.M. Rademakers, A.J. Seebregts, B.A. van den Horn, J.N.T. Je-hee, B.M. Blok: Methodology for PSA for Wind Turbines - Demon-strated by a Case Study of the LAGERWEY 15/75 Design; ECN-C--93-010, Petten, The Netherlands, March 1993.
[3] L.W.M.M. Rademakers, A.J. Seebregts, T.W. Verbruggen, R. Dissel-dorp: Reliability Analysis and Design Review of the NEWECS-45, Part 1: Feedback of Operational Experience, ECN-C--94-066, September 1994
[4] B.A. van den Horn, L.W.M.M. Rademakers, T.W. Verbruggen: Reliability Analysis and Design Review of the NEWECS-45, Part 2: Probabilistic Fatigue Analyses, ECN-C--94-067, September 1994
[5] Rademakers, L.W.M.M. and Carter, J.: ‘Reliability Analysis of the AOC 15/50 Wind Turbine Generator’, ECN-C--94-057, Petten, The Nether-lands, November 1994.
[6] Rademakers, L.W.M.M., Braam, H, and Young, M.: Update of the Reli-ability Analysis of the Atlantic Orient Corporation AOC 15/50 Wind Turbine’, ECN-CX--01-068, Petten, The Netherlands, June 2001.
[7] B.J. de Smet, L.W.M.M. Rademakers, F. Goezinne: Betrouwbaarheidsanalyse van de NedWind 40; ECN-C--96-051, Petten, The Netherlands, November 1996
[8] L.W.M.M. Rademakers, F. Van Hulle: Veiligheidsanalyse van de HMZ 1 MW Windturbine; ECN-C--93-077, Petten, The Netherlands, December 1993
[9] European Commission, ‘European Wind Turbine Standards - Project Results’, Contract JOU2-CT93-0387, Final Report, EUR 16898 EN, 1996 Part 2: Calibration of Safety Factors Part 3: Assessment of Wind Turbine Safety: Recommended Practices Part 4: Assessment of Wind Turbine Safety: Case Study,
[10] European Commission, ‘European Wind Turbine Standards II - Project Results’, ECN-C--99-073 Part 2: Quantification of Failure Probabilities
[11] H. Braam et al: Handboek Risicozonering Windturbines, February 2002. [12] A.J. Seebregts, L.W.M.M. Rademakers, B.A. van den Horn, ‘Reliability
Analysis in Wind Turbine Engineering’, Microelectron. Reliab., Vol. 35, Nos 9-10, pp. 1285-1307, 1995.
[13] B. A. van den Horn, L. W. M. M. Rademakers, T. W. Verbruggen: Structural Reliability Analysis for Horizontal Axis Wind Turbines Com-ponents, ECN-RX--94-097, 1994.
[14] L.W.M.M. Rademakers, A.J. Seebregts, and T.W. Verbruggen, ‘Appli-cations of Reliability Analysis Methods for Wind Turbines’, Proceed-ings EWEC’94 Conference, Thessaloniki, Greece, 10-14 October 1994, Vol. 1, pp. 640-646.
[15] I. Kozine, P. Christensen and M. Winther-Jensen. Failure Database and
54 Risø-R-1420(EN)
Tools for Wind Turbine Availability and Reliability Analyses. Report: Risø-R-1200(EN), 2000, 47 pages.
[16] Rekommandation til Teknisk Grundlag, July, 1992 [17] Reference to ISET [18] Ditlevsen, O., and H.O. Madsen: “Structural Reliability Methods”,
Wiley, 1996, ISBN 0-471-96086-1 [19] Madsen, H.O., S. Krenk, and N.C. Lind: Methods of Structural Safety”,
Prentice-Hall, 1986, ISBN 0-13-579475-7 [20] Frier C, and J.D. Sørensen: “Examples of application of Bayesian
probabilistic networks”, Aalborg University, 2003 [21] Tarp-Johansen, N.J., P.H. Madsen, and S.T. Frandsen: “Background
document for Partial Safety Factors for Extreme Load Effects, Proposal for the 3rd Ed. of IEC 61400: Wind Turbine Generator Systems - Part 1: Safety Requirements”, Risø report R-1319(EN), Risø National Labo-ratory, 2004, ISBN 87-550-3002-5
[22] Bomel Ltd: “Component-Based Calibration of North West European Annex Environmental Load Factor to ISO Fixed Steel Offshore Struc-tures Code 19902”, February 2002
[23] Tromans, P: Extreme environmental load statistics in UK waters, Off-shore technology report 2000/066, Health and Safety Executive, UK, www.hsebooks.co.uk, ISBN 0 7176 2061 1.
[24] Tarp-Johansen, N.J: “Partial Safety Factors and Characteristic Values for Combined Extreme Wind and Wave Load Effects”, proceedings of The EWEA Special Topic Conference - The Science of Making Torque from Wind, April 19-21, 2004, Delft University, The Netherlands.
[25] Tarp-Johansen, N.J & J.D. Sørensen & P.H. Madsen: “Experience with Acceptance Criteria for Offshore Wind Turbines in Extreme Loading”,
[26] Sørensen, J.D. & N.J. Tarp-Johansen: “Reliability-based optimization of wind turbines”, AAU, August 2003
[27] Rackwitz, R.: Risk Control and Optimization for Structural Facilities, 20th IFIP TC7 Conference on “System Modelling and Optimization”, July 23-27, 2001, Trier, Germany.
[28] Sumer, B.M. and J. Fredsøe: “Hydrodynamics around cylindrical struc-tures”. Advanced Series on Ocean Engineering – Vol. 12. World Scien-tific, 1997
[29] Sarpkaya, T. and M. Isaacson: “Mechanics of wave forces on offshore structures”. Van Nostrand Reinhold, 1981
[30] Chakrabarti, S.K.: “Hydrodynamics of offshore structures”. Computa-tional Mechanics Publications, 1987.
55 Risø-R-1420(EN)

Appendix A: Failure data and their classification This appendix lists the failure data which was employed in the data analysis described in Chapter 3. The data is listed with its classification. Three data sets were considered. The first two ones listed are from the Danish Consultant Com-pany Energi og Miljødata. They cover the years 1984-1992 and 1993-2000, re-spectively. The third set has been prepared by an expert from Risø National Laboratory and covers the same period.
56 Risø-R-1420(EN)
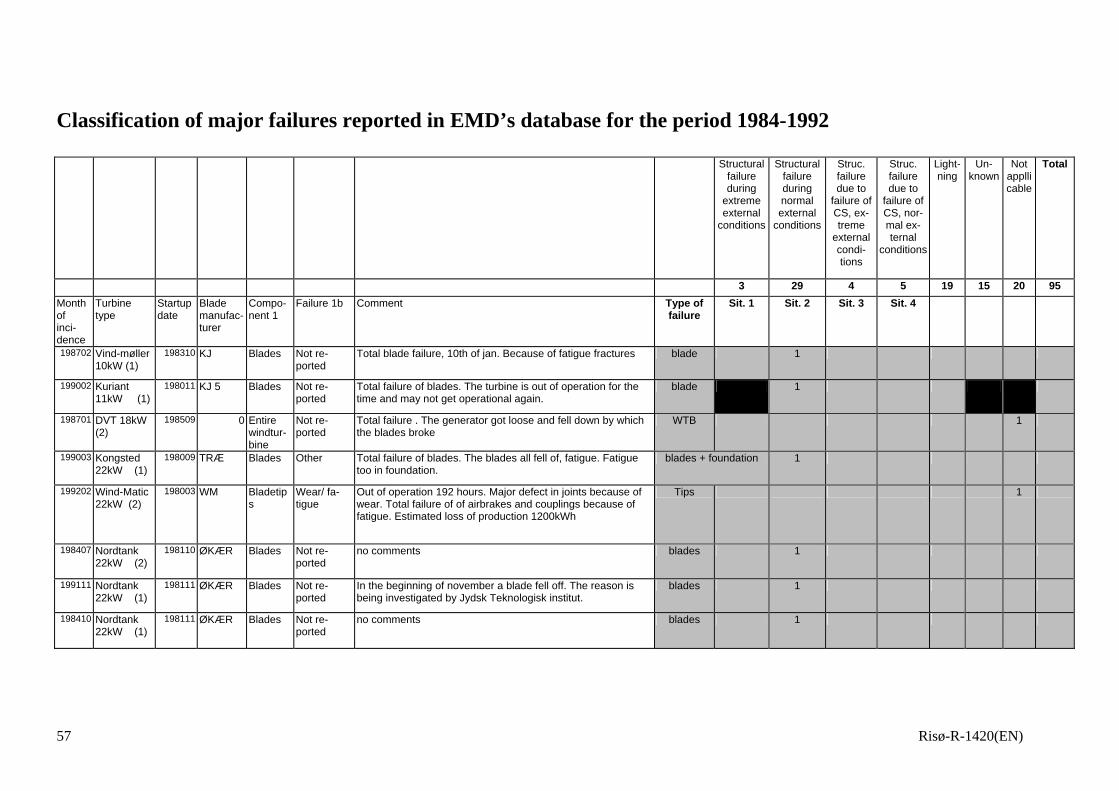
Classification of major failures reported in EMD’s database for the period 1984-1992
Structuralfailure during
extreme external
conditions
Structural failure during normal external
conditions
Struc. failure due to
failure of CS, ex-treme
external condi-tions
Struc. failure due to
failure of CS, nor-mal ex-ternal
conditions
Light-ning
Un-known
Not appllicable
Total
3 29 4 5 19 15 20 95Month of inci-dence
Turbine type
Startup date
Blade manufac-turer
Compo-nent 1
Failure 1b Comment Type of failure
Sit. 1 Sit. 2 Sit. 3 Sit. 4
198702 Vind-møller 10kW (1)
198310 KJ Blades Not re-ported
Total blade failure, 10th of jan. Because of fatigue fractures blade 1
199002 Kuriant 11kW (1)
198011 KJ 5 Blades Not re-ported
Total failure of blades. The turbine is out of operation for the time and may not get operational again.
blade 1
198701 DVT 18kW (2)
198509 0 Entire windtur-bine
Not re-ported
Total failure . The generator got loose and fell down by which the blades broke
WTB 1
199003 Kongsted 22kW (1)
198009 TRÆ Blades Other Total failure of blades. The blades all fell of, fatigue. Fatigue too in foundation.
blades + foundation 1
199202 Wind-Matic 22kW (2)
198003 WM Bladetips
Wear/ fa-tigue
Out of operation 192 hours. Major defect in joints because of wear. Total failure of of airbrakes and couplings because of fatigue. Estimated loss of production 1200kWh
Tips 1
198407 Nordtank 22kW (2)
198110 ØKÆR Blades Not re-ported
no comments blades 1
199111 Nordtank 22kW (1)
198111 ØKÆR Blades Not re-ported
In the beginning of november a blade fell off. The reason is being investigated by Jydsk Teknologisk institut.
blades 1
198410 Nordtank 22kW (1)
198111 ØKÆR Blades Not re-ported
no comments blades 1
57 Risø-R-1420(EN)
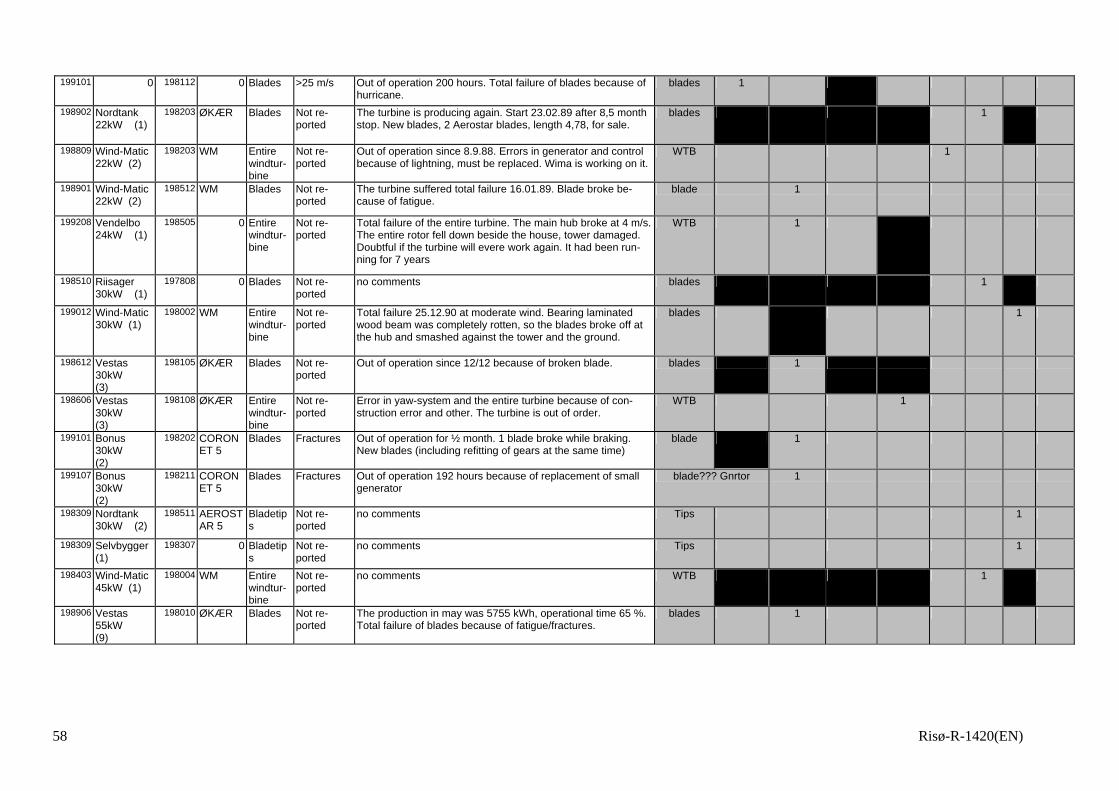
199101 0 198112 0 Blades >25 m/s Out of operation 200 hours. Total failure of blades because of hurricane.
blades 1
198902 Nordtank 22kW (1)
198203 ØKÆR Blades Not re-ported
The turbine is producing again. Start 23.02.89 after 8,5 month stop. New blades, 2 Aerostar blades, length 4,78, for sale.
blades 1
198809 Wind-Matic 22kW (2)
198203 WM Entirewindtur-bine
Not re-ported
Out of operation since 8.9.88. Errors in generator and control because of lightning, must be replaced. Wima is working on it.
WTB 1
198901 Wind-Matic 22kW (2)
198512 WM Blades Not re-ported
The turbine suffered total failure 16.01.89. Blade broke be-cause of fatigue.
blade 1
199208 Vendelbo 24kW (1)
198505 0 Entire windtur-bine
Not re-ported
Total failure of the entire turbine. The main hub broke at 4 m/s. The entire rotor fell down beside the house, tower damaged. Doubtful if the turbine will evere work again. It had been run-ning for 7 years
WTB 1
198510 Riisager 30kW (1)
197808 0 Blades Not re-ported
no comments blades 1
199012 Wind-Matic 30kW (1)
198002 WM Entirewindtur-bine
Not re-ported
Total failure 25.12.90 at moderate wind. Bearing laminated wood beam was completely rotten, so the blades broke off at the hub and smashed against the tower and the ground.
blades 1
198612 Vestas 30kW (3)
198105 ØKÆR Blades Not re-ported
Out of operation since 12/12 because of broken blade. blades 1
198606 Vestas 30kW (3)
198108 ØKÆR Entirewindtur-bine
Not re-ported
Error in yaw-system and the entire turbine because of con-struction error and other. The turbine is out of order.
WTB 1
199101 Bonus 30kW (2)
198202 CORONET 5
Blades Fractures Out of operation for ½ month. 1 blade broke while braking. New blades (including refitting of gears at the same time)
blade 1
199107 Bonus 30kW (2)
198211 CORONET 5
Blades Fractures Out of operation 192 hours because of replacement of small generator
blade??? Gnrtor 1
198309 Nordtank 30kW (2)
198511 AEROSTAR 5
Bladetips
Not re-ported
no comments Tips 1
198309 Selvbygger (1)
198307 0 Bladetips
Not re-ported
no comments Tips 1
198403 Wind-Matic 45kW (1)
198004 WM Entirewindtur-bine
Not re-ported
no comments WTB 1
198906 Vestas 55kW (9)
198010 ØKÆR Blades Not re-ported
The production in may was 5755 kWh, operational time 65 %. Total failure of blades because of fatigue/fractures.
blades 1
58 Risø-R-1420(EN)

198604 Vestas 55kW (9)
198103 ØKÆR Entirewindtur-bine
Not re-ported
Out of operation since 12/4. All 3 blades destroyed, the turbine tipped over, two bolts broke, and the blades smashed into tower before the brake worked.4th. Set of blades.
WTB 1
198802 Nordtank 55kW (2)
198109 ØKÆR Blades Not re-ported
Total failure of blades because of fatigue/fractures. blades 1
198503 Nordtank 55kW (2)
198110 ØKÆR Blades Not re-ported
Blade failure blades 1
199201 Nordtank 55kW (2)
198112 ØKÆR Entirewindtur-bine
Other The turbine raced wild, the blades blew down, the tower bended, Raced for 4 hours and is completely damaged.
WTB 1
198511 Vestas 55kW (9)
198201 ØKÆR Entirewindtur-bine
Not re-ported
no comments WTB 1
198707 Nordtank 55kW (4)
198203 ALTERNAGY 7.5
Blades Not re-ported
Total failure of blades. A blade fractured on the back edge, apparently causing the glass fibre to soak water. All three blades are being replaced.
blades 1
198705 Bonus 55kW Mark1 (1)
198202 ALTERNAGY 7.5
Blades Not re-ported
Total failure of blades in april because of storm. Out of opera-tion for 1,5 month. 18/5 new set of blades after stormdamage, an insurance case.
blades 1
198908 Vestas 55kW (5)
198301 VESTAS 8
Entire windtur-bine
Not re-ported
Total failure of the entire turbine in storm, burned out because of insufficient brakes.
WTB 1
199001 Nordtank 55kW (2)
198206 ØKÆR Entirewindtur-bine
>25 m/s 26.01.90 total failure of the turbine because of storm and over-speeding.
WTB 1
199210 Vestas 55kW (9)
198401 ØKÆR Blades Fractures no comments blades 1
198704 Bonus 55kW Mark2 (1)
198501 ALTERNAGY 7.5
Blades Not re-ported
Out of operation 30 hours, total failure of controlsystem be-cause of wear and construction error. Windvane defect.
blades 1
198505 Nordtank 55kW (4)
198501 ALTERNAGY 7.5
Blades Not re-ported
The turbine has been stopped for nine days because of blade failure.
blade 1
198812 Nordtank 55kW (4)
198412 ALTERNAGY 7.5
Blades Not re-ported
Major defect with the blades because of fatigue/fractures the 8/12. Replaced by new ones?
blades 1
198610 Nordtank 55kW (4)
198412 ALTERNAGY 7.5
Blades Not re-ported
no comments blades 1
198603 Nordtank 55kW (4)
198412 ALTERNAGY 7.5
Blades Not re-ported
no comments blades 1
59 Risø-R-1420(EN)
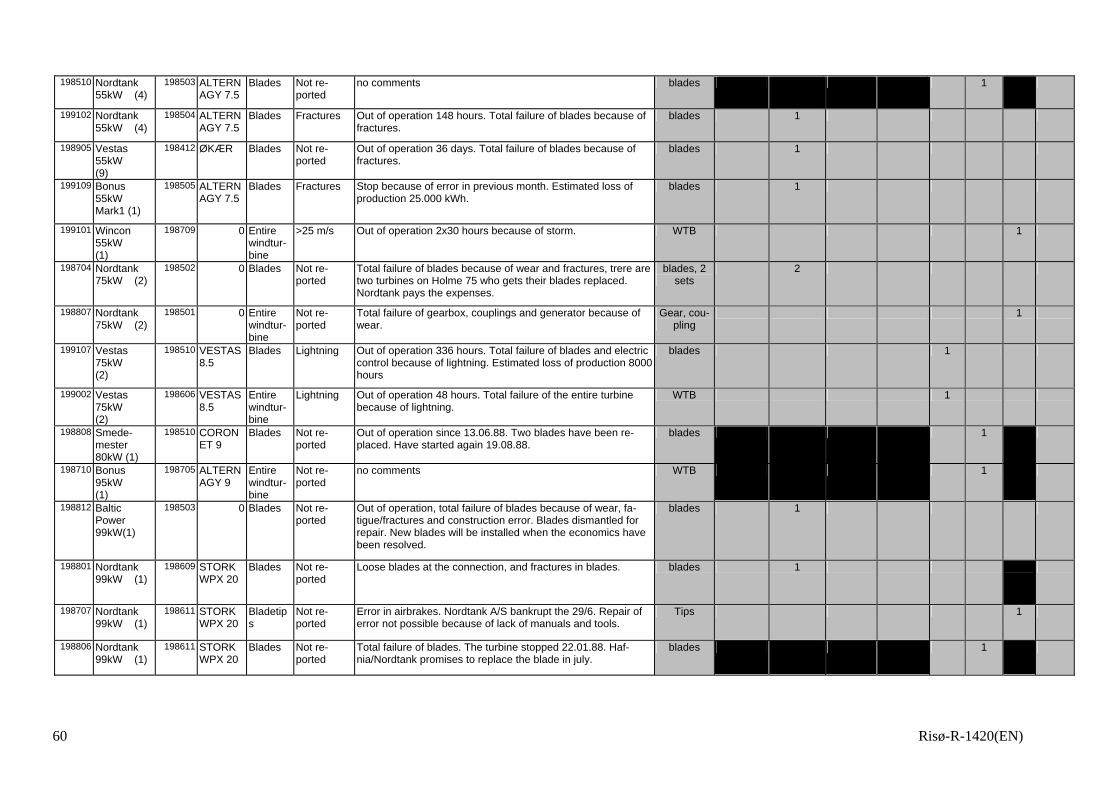
198510 Nordtank 55kW (4)
198503 ALTERNAGY 7.5
Blades Not re-ported
no comments blades 1
199102 Nordtank 55kW (4)
198504 ALTERNAGY 7.5
Blades Fractures Out of operation 148 hours. Total failure of blades because of fractures.
blades 1
198905 Vestas 55kW (9)
198412 ØKÆR Blades Not re-ported
Out of operation 36 days. Total failure of blades because of fractures.
blades 1
199109 Bonus 55kW Mark1 (1)
198505 ALTERNAGY 7.5
Blades Fractures Stop because of error in previous month. Estimated loss of production 25.000 kWh.
blades 1
199101 Wincon 55kW (1)
198709 0 Entire windtur-bine
>25 m/s Out of operation 2x30 hours because of storm. WTB 1
198704 Nordtank 75kW (2)
198502 0 Blades Not re-ported
Total failure of blades because of wear and fractures, trere are two turbines on Holme 75 who gets their blades replaced. Nordtank pays the expenses.
blades, 2 sets
2
198807 Nordtank 75kW (2)
198501 0 Entire windtur-bine
Not re-ported
Total failure of gearbox, couplings and generator because of wear.
Gear, cou-pling
1
199107 Vestas 75kW (2)
198510 VESTAS 8.5
Blades Lightning Out of operation 336 hours. Total failure of blades and electric control because of lightning. Estimated loss of production 8000 hours
blades 1
199002 Vestas 75kW (2)
198606 VESTAS 8.5
Entire windtur-bine
Lightning Out of operation 48 hours. Total failure of the entire turbine because of lightning.
WTB 1
198808 Smede-mester 80kW (1)
198510 CORONET 9
Blades Not re-ported
Out of operation since 13.06.88. Two blades have been re-placed. Have started again 19.08.88.
blades 1
198710 Bonus 95kW (1)
198705 ALTERNAGY 9
Entire windtur-bine
Not re-ported
no comments WTB 1
198812 Baltic Power 99kW(1)
198503 0 Blades Not re-ported
Out of operation, total failure of blades because of wear, fa-tigue/fractures and construction error. Blades dismantled for repair. New blades will be installed when the economics have been resolved.
blades 1
198801 Nordtank 99kW (1)
198609 STORK WPX 20
Blades Not re-ported
Loose blades at the connection, and fractures in blades. blades 1
198707 Nordtank 99kW (1)
198611 STORK WPX 20
Bladetips
Not re-ported
Error in airbrakes. Nordtank A/S bankrupt the 29/6. Repair of error not possible because of lack of manuals and tools.
Tips 1
198806 Nordtank 99kW (1)
198611 STORK WPX 20
Blades Not re-ported
Total failure of blades. The turbine stopped 22.01.88. Haf-nia/Nordtank promises to replace the blade in july.
blades 1
60 Risø-R-1420(EN)
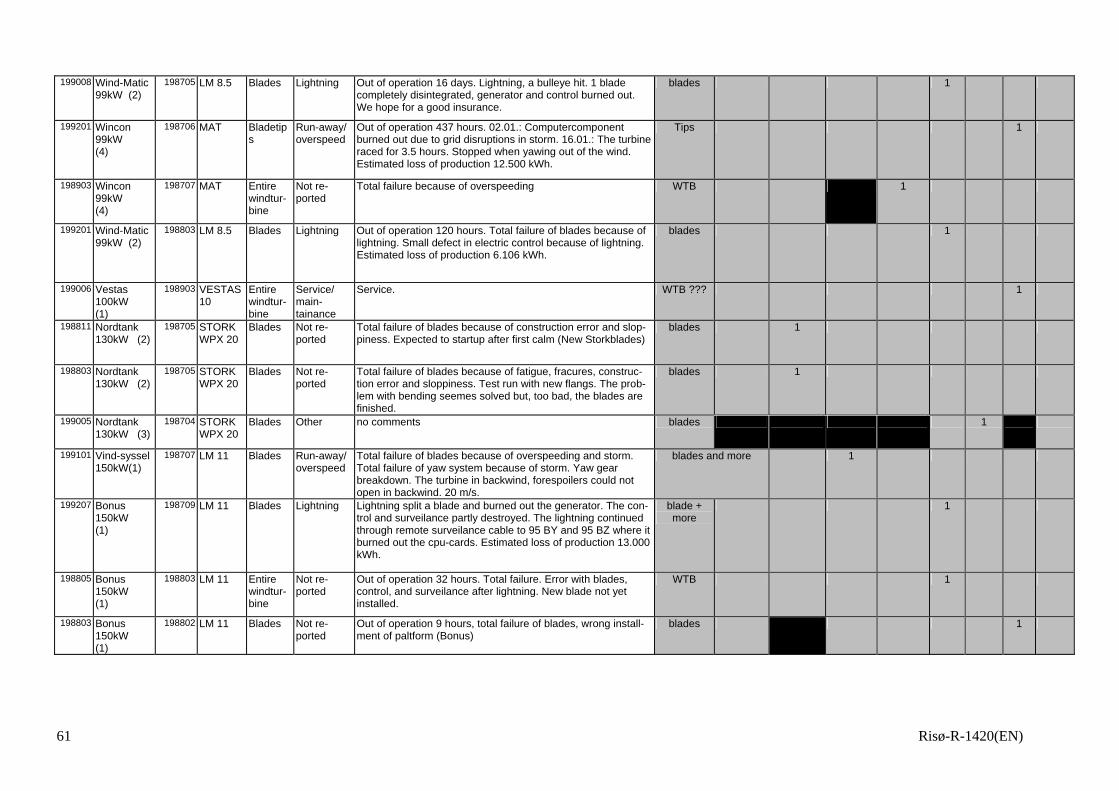
199008 Wind-Matic 99kW (2)
198705 LM 8.5 Blades Lightning Out of operation 16 days. Lightning, a bulleye hit. 1 blade completely disintegrated, generator and control burned out. We hope for a good insurance.
blades 1
199201 Wincon 99kW (4)
198706 MAT Bladetips
Run-away/ overspeed
Out of operation 437 hours. 02.01.: Computercomponent burned out due to grid disruptions in storm. 16.01.: The turbine raced for 3.5 hours. Stopped when yawing out of the wind. Estimated loss of production 12.500 kWh.
Tips 1
198903 Wincon 99kW (4)
198707 MAT Entirewindtur-bine
Not re-ported
Total failure because of overspeeding WTB 1
199201 Wind-Matic 99kW (2)
198803 LM 8.5 Blades Lightning Out of operation 120 hours. Total failure of blades because of lightning. Small defect in electric control because of lightning. Estimated loss of production 6.106 kWh.
blades 1
199006 Vestas 100kW (1)
198903 VESTAS 10
Entire windtur-bine
Service/ main-tainance
Service. WTB ??? 1
198811 Nordtank 130kW (2)
198705 STORK WPX 20
Blades Not re-ported
Total failure of blades because of construction error and slop-piness. Expected to startup after first calm (New Storkblades)
blades 1
198803 Nordtank 130kW (2)
198705 STORK WPX 20
Blades Not re-ported
Total failure of blades because of fatigue, fracures, construc-tion error and sloppiness. Test run with new flangs. The prob-lem with bending seemes solved but, too bad, the blades are finished.
blades 1
199005 Nordtank 130kW (3)
198704 STORK WPX 20
Blades Other no comments blades 1
199101 Vind-syssel 150kW(1)
198707 LM 11 Blades Run-away/ overspeed
Total failure of blades because of overspeeding and storm. Total failure of yaw system because of storm. Yaw gear breakdown. The turbine in backwind, forespoilers could not open in backwind. 20 m/s.
blades and more 1
199207 Bonus 150kW (1)
198709 LM 11 Blades Lightning Lightning split a blade and burned out the generator. The con-trol and surveilance partly destroyed. The lightning continued through remote surveilance cable to 95 BY and 95 BZ where it burned out the cpu-cards. Estimated loss of production 13.000 kWh.
blade + more
1
198805 Bonus 150kW (1)
198803 LM 11 Entire windtur-bine
Not re-ported
Out of operation 32 hours. Total failure. Error with blades, control, and surveilance after lightning. New blade not yet installed.
WTB 1
198803 Bonus 150kW (1)
198802 LM 11 Blades Not re-ported
Out of operation 9 hours, total failure of blades, wrong install-ment of paltform (Bonus)
blades 1
61 Risø-R-1420(EN)
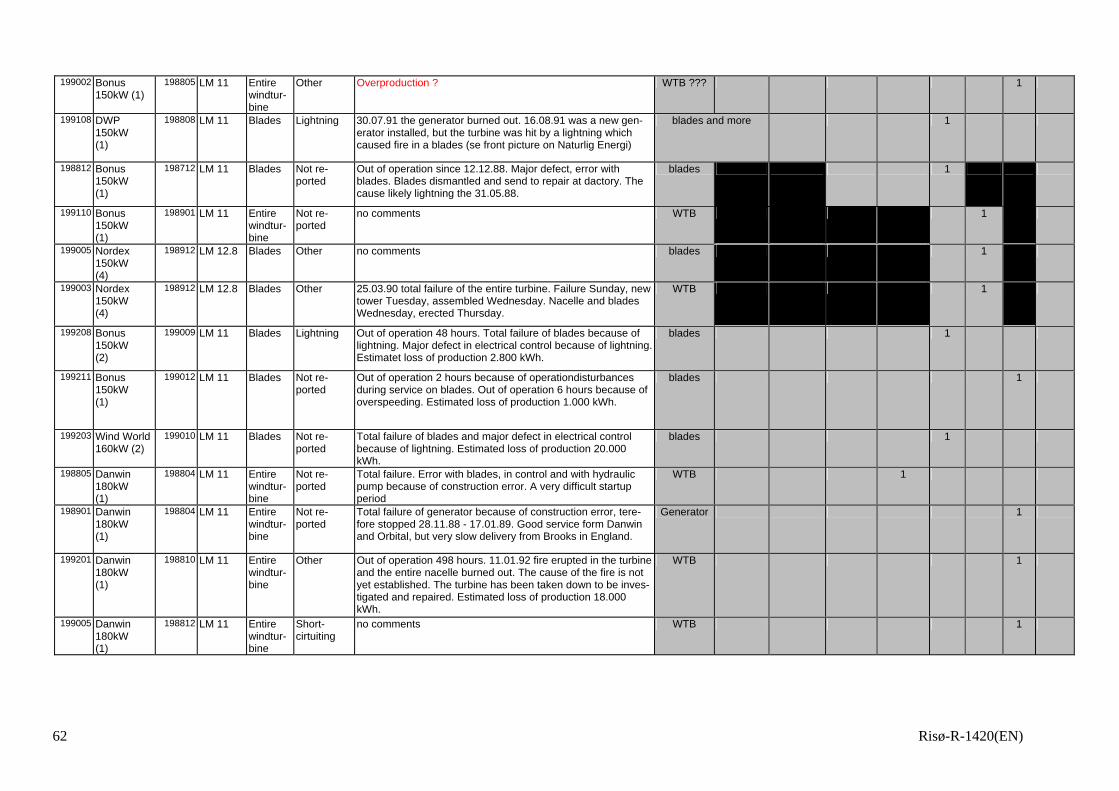
199002 Bonus 150kW (1)
198805 LM 11 Entire windtur-bine
Other Overproduction ? WTB ??? 1
199108 DWP 150kW (1)
198808 LM 11 Blades Lightning 30.07.91 the generator burned out. 16.08.91 was a new gen-erator installed, but the turbine was hit by a lightning which caused fire in a blades (se front picture on Naturlig Energi)
blades and more 1
198812 Bonus 150kW (1)
198712 LM 11 Blades Not re-ported
Out of operation since 12.12.88. Major defect, error with blades. Blades dismantled and send to repair at dactory. The cause likely lightning the 31.05.88.
blades 1
199110 Bonus 150kW (1)
198901 LM 11 Entire windtur-bine
Not re-ported
no comments WTB 1
199005 Nordex 150kW (4)
198912 LM 12.8 Blades Other no comments blades 1
199003 Nordex 150kW (4)
198912 LM 12.8 Blades Other 25.03.90 total failure of the entire turbine. Failure Sunday, new tower Tuesday, assembled Wednesday. Nacelle and blades Wednesday, erected Thursday.
WTB 1
199208 Bonus 150kW (2)
199009 LM 11 Blades Lightning Out of operation 48 hours. Total failure of blades because of lightning. Major defect in electrical control because of lightning. Estimatet loss of production 2.800 kWh.
blades 1
199211 Bonus 150kW (1)
199012 LM 11 Blades Not re-ported
Out of operation 2 hours because of operationdisturbances during service on blades. Out of operation 6 hours because of overspeeding. Estimated loss of production 1.000 kWh.
blades 1
199203 Wind World 160kW (2)
199010 LM 11 Blades Not re-ported
Total failure of blades and major defect in electrical control because of lightning. Estimated loss of production 20.000 kWh.
blades 1
198805 Danwin 180kW (1)
198804 LM 11 Entire windtur-bine
Not re-ported
Total failure. Error with blades, in control and with hydraulic pump because of construction error. A very difficult startup period
WTB 1
198901 Danwin 180kW (1)
198804 LM 11 Entire windtur-bine
Not re-ported
Total failure of generator because of construction error, tere-fore stopped 28.11.88 - 17.01.89. Good service form Danwin and Orbital, but very slow delivery from Brooks in England.
Generator 1
199201 Danwin 180kW (1)
198810 LM 11 Entire windtur-bine
Other Out of operation 498 hours. 11.01.92 fire erupted in the turbine and the entire nacelle burned out. The cause of the fire is not yet established. The turbine has been taken down to be inves-tigated and repaired. Estimated loss of production 18.000 kWh.
WTB 1
199005 Danwin 180kW (1)
198812 LM 11 Entire windtur-bine
Short-cirtuiting
no comments WTB 1
62 Risø-R-1420(EN)
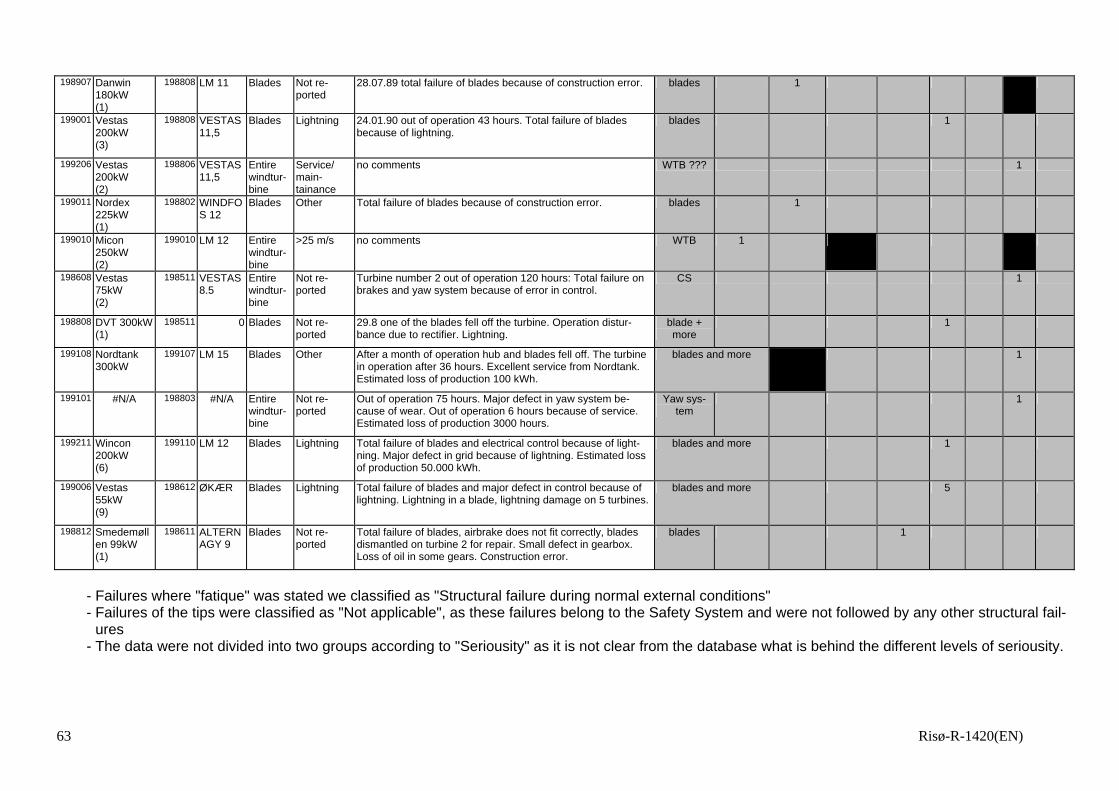
198907 Danwin 180kW (1)
198808 LM 11 Blades Not re-ported
28.07.89 total failure of blades because of construction error. blades 1
199001 Vestas 200kW (3)
198808 VESTAS 11,5
Blades Lightning 24.01.90 out of operation 43 hours. Total failure of blades because of lightning.
blades 1
199206 Vestas 200kW (2)
198806 VESTAS 11,5
Entire windtur-bine
Service/ main-tainance
no comments WTB ??? 1
199011 Nordex 225kW (1)
198802 WINDFOS 12
Blades Other Total failure of blades because of construction error. blades 1
199010 Micon 250kW (2)
LM 12 Entire windtur-bine
>25 m/s 199010 no comments WTB 1
198608 Vestas 75kW (2)
198511 VESTAS 8.5
Entire windtur-bine
Not re-ported
Turbine number 2 out of operation 120 hours: Total failure on brakes and yaw system because of error in control.
CS 1
198808 DVT 300kW (1)
198511 0 Blades Not re-ported
29.8 one of the blades fell off the turbine. Operation distur-bance due to rectifier. Lightning.
blade + more
1
199108 Nordtank 300kW
199107 LM 15 Blades Other After a month of operation hub and blades fell off. The turbine in operation after 36 hours. Excellent service from Nordtank. Estimated loss of production 100 kWh.
blades and more 1
199101 #N/A 198803 #N/A Entirewindtur-bine
Not re-ported
Out of operation 75 hours. Major defect in yaw system be-cause of wear. Out of operation 6 hours because of service. Estimated loss of production 3000 hours.
Yaw sys-tem
1
199211 Wincon 200kW (6)
199110 LM 12 Blades Lightning Total failure of blades and electrical control because of light-ning. Major defect in grid because of lightning. Estimated loss of production 50.000 kWh.
blades and more 1
199006 Vestas 55kW (9)
198612 ØKÆR Blades Lightning Total failure of blades and major defect in control because of lightning. Lightning in a blade, lightning damage on 5 turbines.
blades and more 5
198812 Smedemøllen 99kW (1)
198611 ALTERNAGY 9
Blades Not re-ported
Total failure of blades, airbrake does not fit correctly, blades dismantled on turbine 2 for repair. Small defect in gearbox. Loss of oil in some gears. Construction error.
blades 1
- Failures where "fatique" was stated we classified as "Structural failure during normal external conditions" - Failures of the tips were classified as "Not applicable", as these failures belong to the Safety System and were not followed by any other structural fail-
ures - The data were not divided into two groups according to "Seriousity" as it is not clear from the database what is behind the different levels of seriousity.
63 Risø-R-1420(EN)
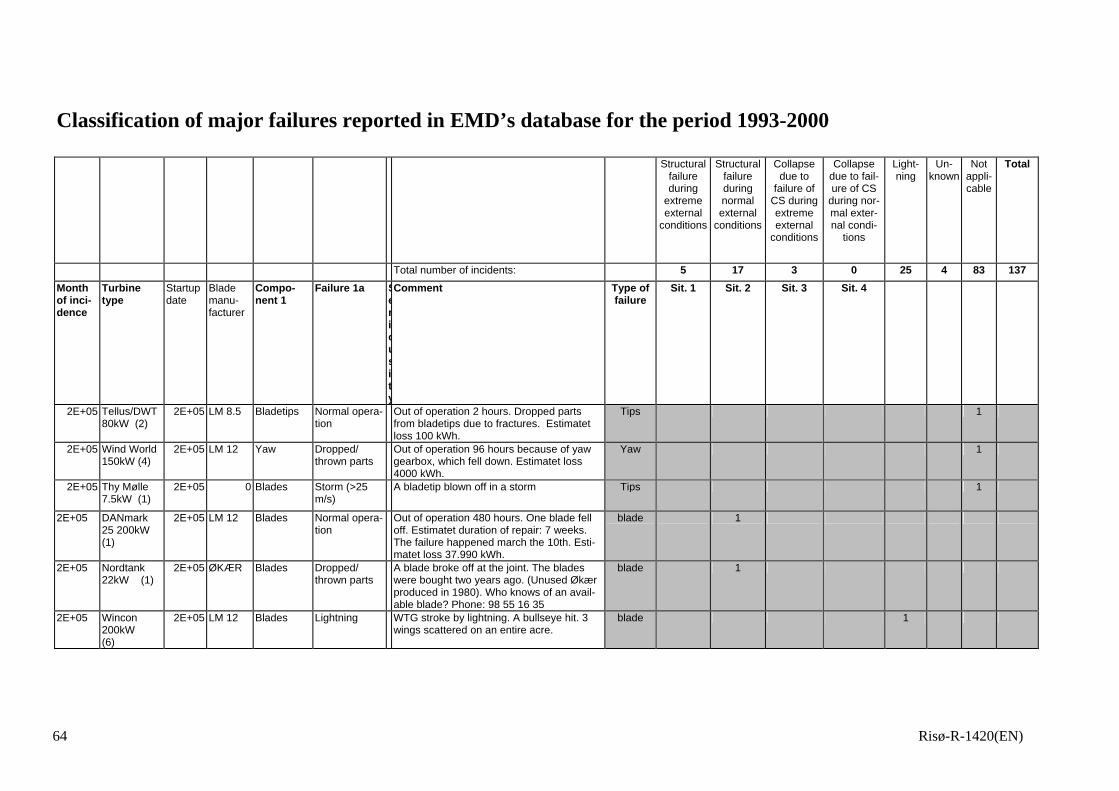
Classification of major failures reported in EMD’s database for the period 1993-2000 Structural
failure during
extreme external
conditions
Structural failure during normal external
conditions
Collapse due to
failure of CS during extreme external
conditions
Collapse due to fail-ure of CS
during nor-mal exter-nal condi-
tions
Light-ning
Un-known
Not appli-cable
Total
Total number of incidents: 5 17 3 0 25 4 83 137Month of inci-dence
Turbine type
Startup date
Blade manu-facturer
Compo-nent 1
Failure 1a Seriousity
Comment Type offailure
Sit. 2 Sit. 1 Sit. 3 Sit. 4
2E+05 Tellus/DWT 80kW (2)
2E+05 LM 8.5 Bladetips Normal opera-tion
Out of operation 2 hours. Dropped parts from bladetips due to fractures. Estimatet loss 100 kWh.
Tips 1
2E+05 Wind World 150kW (4)
2E+05 LM 12 Yaw Dropped/ thrown parts
Out of operation 96 hours because of yaw gearbox, which fell down. Estimatet loss 4000 kWh.
Yaw 1
2E+05 Thy Mølle 7.5kW (1)
2E+05 0 Blades Storm (>25 m/s)
A bladetip blown off in a storm Tips 1
2E+05 DANmark25 200kW (1)
2E+05 LM 12 Blades Normal opera-tion
Out of operation 480 hours. One blade fell off. Estimatet duration of repair: 7 weeks. The failure happened march the 10th. Esti-matet loss 37.990 kWh.
blade 1
2E+05 Nordtank22kW (1)
2E+05 ØKÆR Blades Dropped/thrown parts
A blade broke off at the joint. The blades were bought two years ago. (Unused Økær produced in 1980). Who knows of an avail-able blade? Phone: 98 55 16 35
blade 1
2E+05 Wincon200kW (6)
2E+05 LM 12 Blades Lightning WTG stroke by lightning. A bullseye hit. 3 wings scattered on an entire acre.
blade 1
64 Risø-R-1420(EN)
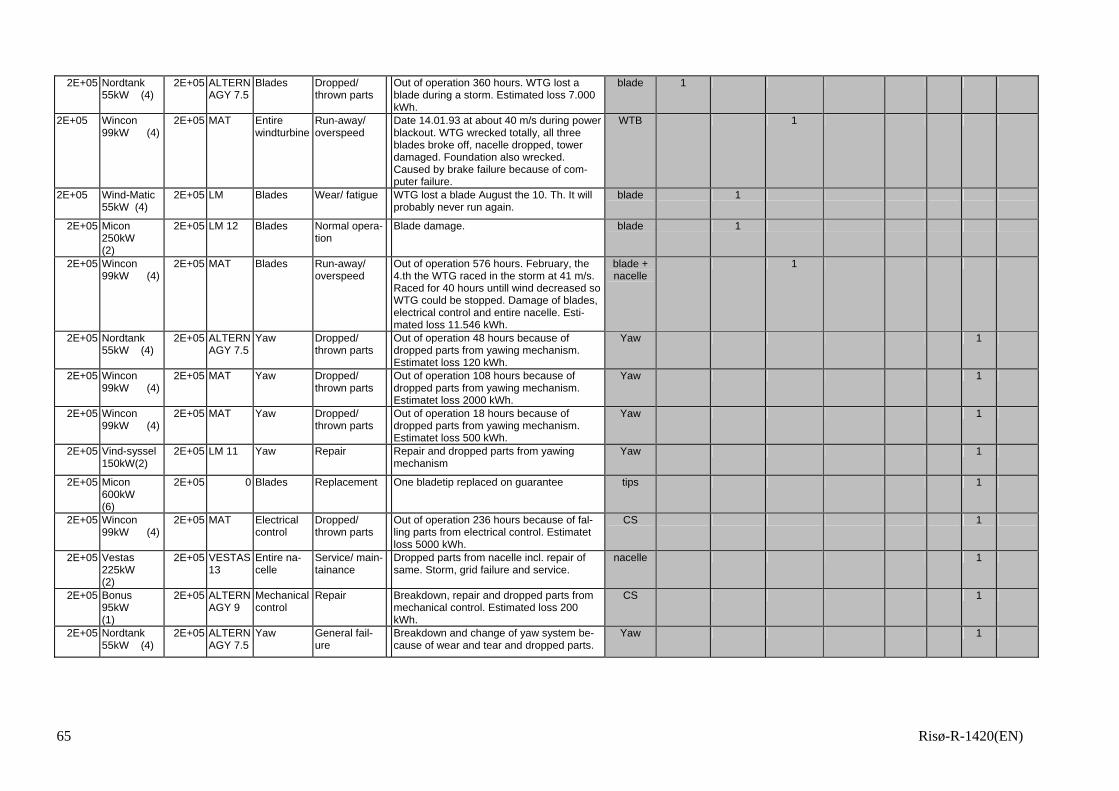
2E+05 Nordtank 55kW (4)
2E+05 ALTERNAGY 7.5
Blades Dropped/thrown parts
Out of operation 360 hours. WTG lost a blade during a storm. Estimated loss 7.000 kWh.
blade 1
2E+05 Wincon99kW (4)
2E+05 MAT Entirewindturbine
Run-away/ overspeed
Date 14.01.93 at about 40 m/s during power blackout. WTG wrecked totally, all three blades broke off, nacelle dropped, tower damaged. Foundation also wrecked. Caused by brake failure because of com-puter failure.
WTB 1
2E+05 Wind-Matic55kW (4)
2E+05 LM Blades Wear/ fatigue WTG lost a blade August the 10. Th. It will probably never run again.
blade 1
2E+05 Micon 250kW (2)
2E+05 LM 12 Blades Normal opera-tion
Blade damage. blade 1
2E+05 Wincon 99kW (4)
2E+05 MAT Blades Run-away/overspeed
Out of operation 576 hours. February, the 4.th the WTG raced in the storm at 41 m/s. Raced for 40 hours untill wind decreased so WTG could be stopped. Damage of blades, electrical control and entire nacelle. Esti-mated loss 11.546 kWh.
blade + nacelle
1
2E+05 Nordtank 55kW (4)
2E+05 ALTERNAGY 7.5
Yaw Dropped/thrown parts
Out of operation 48 hours because of dropped parts from yawing mechanism. Estimatet loss 120 kWh.
Yaw 1
2E+05 Wincon 99kW (4)
2E+05 MAT Yaw Dropped/thrown parts
Out of operation 108 hours because of dropped parts from yawing mechanism. Estimatet loss 2000 kWh.
Yaw 1
2E+05 Wincon 99kW (4)
2E+05 MAT Yaw Dropped/thrown parts
Out of operation 18 hours because of dropped parts from yawing mechanism. Estimatet loss 500 kWh.
Yaw 1
2E+05 Vind-syssel 150kW(2)
2E+05 LM 11 Yaw Repair Repair and dropped parts from yawing mechanism
Yaw 1
2E+05 Micon 600kW (6)
2E+05 0 Blades Replacement One bladetip replaced on guarantee tips 1
2E+05 Wincon 99kW (4)
2E+05 MAT Electricalcontrol
Dropped/ thrown parts
Out of operation 236 hours because of fal-ling parts from electrical control. Estimatet loss 5000 kWh.
CS 1
2E+05 Vestas 225kW (2)
2E+05 VESTAS 13
Entire na-celle
Service/ main-tainance
Dropped parts from nacelle incl. repair of same. Storm, grid failure and service.
nacelle 1
2E+05 Bonus 95kW (1)
2E+05 ALTERNAGY 9
Mechanical control
Repair Breakdown, repair and dropped parts from mechanical control. Estimated loss 200 kWh.
CS 1
2E+05 Nordtank 55kW (4)
2E+05 ALTERNAGY 7.5
Yaw General fail-ure
Breakdown and change of yaw system be-cause of wear and tear and dropped parts.
Yaw 1
65 Risø-R-1420(EN)

2E+05 Vestas 55kW (9)
2E+05 ØKÆR Yaw Dropped/thrown parts
WTG out of operation 48 hours because of repair of yaw system. Yaw brake shaken loose, dropping parts. Yaw gear loosly taken apart and strengthened with extra.
Yaw 1
2E+05 Vestas 55kW (9)
2E+05 ØKÆR #N/A Out of operation 6 hours. At grid failure a parachute brake was activated. In the storm the trap door loosened and fell. WTG was not at any time racing. Estimated loss 250 kWh.
Tips 1
2E+05 Wind World150kW (4)
2E+05 LM 12 #N/A Out of operation 324 hours. Bladetip de-stroyed by lightning. Entire blade replaced. Generator totally damaged because of lightning. Estimated loss 55.000 kWh.
Tips + blade
1
2E+05 Vestas 55kW (9)
2E+05 ØKÆR Mechanicalcontrol
Storm (>25 m/s)
1 machine shield blown off. 1 machine shield damaged. Windcups on 10 WTGs blown off in storm.
shield + windcup
11
2E+05 Vestas 200kW (2)
2E+05 VESTAS 11,5
Blades Lightning Damage of blades and change because of lightning.
blade 1
2E+05 0 2E+05 NACA Blades General fail-ure
Out of operation 408 hours. Blade strongly damaged because of stroke angainst tower. Esimated loss 2.500 hours.
blade 1
2E+05 Wind World160kW (2)
2E+05 LM 11 Blades Lightning Out of operation 744 hours. Total damage of blades because of lightning.
blades 1
2E+05 Danwin200kW (2)
2E+05 LM 11 Blades Normal opera-tion
Out of operation 185 hours. Lightning. Blade damaged. Computer and various sensors and telephone modem damaged. Estimated loss 3.600 kWh.
blades 1
2E+05 Nordtank22kW (1)
2E+05 ØKÆR Blades Other Replacement of blades. blades 1
2E+05 Wind World160kW (2)
2E+05 LM 11 Blades Lightning Out of operation 36 hours. Damage of blades and electrical control and lightning. Estimated loss 1.800 kWh.
blades 1
2E+05 Nordtank 55kW (4)
2E+05 ALTERNAGY 7.5
Blades Lightning Blade damage because of lightning. blades 1
2E+05 Bonus 150kW (9)
2E+05 LM 11 Blades Other Out of operation 18 hours. Blade damage. Steel wire bursted at lightning. Estimated loss 200 kWh.
blade 1
2E+05 Wind World 150kW (6)
2E+05 LM 12 Blades Normal opera-tion
Out of operation 23 hours. Damage of blade on one WTG because of lightning. Esti-mated loss 800 kWh.
blade 1
2E+05 Bonus300kW (3)
2E+05 LM 15 Blades Lightning Out of operation 65 hours. WTG stroken by a lightning. All blades damaged. Electronics apparently unaffected. Change of blades carried out by Bonus. Estimated loss 2.000 kWh.
blades 1
66 Risø-R-1420(EN)
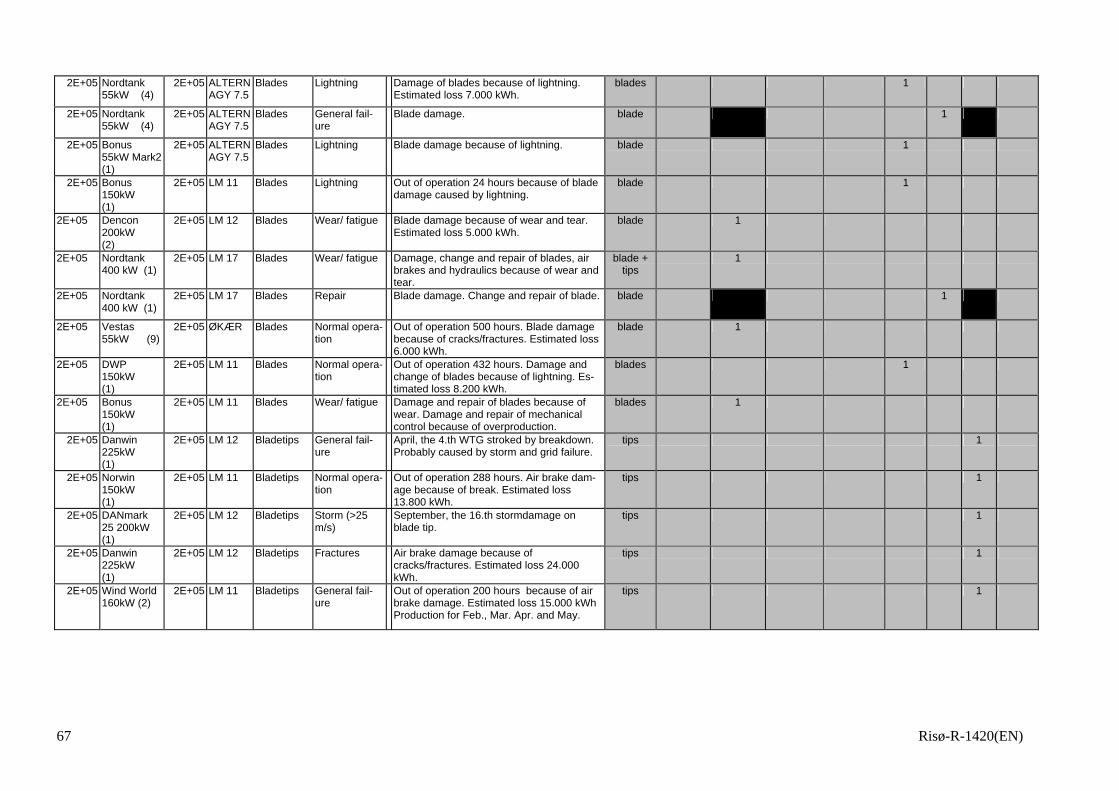
2E+05 Nordtank 55kW (4)
2E+05 ALTERNAGY 7.5
Blades Lightning Damage of blades because of lightning. Estimated loss 7.000 kWh.
blades 1
2E+05 Nordtank 55kW (4)
2E+05 ALTERNAGY 7.5
Blades General fail-ure
Blade damage. blade 1
2E+05 Bonus 55kW Mark2 (1)
2E+05 ALTERNAGY 7.5
Blades Lightning Blade damage because of lightning. blade 1
2E+05 Bonus 150kW (1)
2E+05 LM 11 Blades Lightning Out of operation 24 hours because of blade damage caused by lightning.
blade 1
2E+05 Dencon200kW (2)
2E+05 LM 12 Blades Wear/ fatigue Blade damage because of wear and tear. Estimated loss 5.000 kWh.
blade 1
2E+05 Nordtank400 kW (1)
2E+05 LM 17 Blades Wear/ fatigue Damage, change and repair of blades, air brakes and hydraulics because of wear and tear.
blade + tips
1
2E+05 Nordtank400 kW (1)
2E+05 LM 17 Blades Repair Blade damage. Change and repair of blade. blade 1
2E+05 Vestas55kW (9)
2E+05 ØKÆR Blades Normal opera-tion
Out of operation 500 hours. Blade damage because of cracks/fractures. Estimated loss 6.000 kWh.
blade 1
2E+05 DWP150kW (1)
2E+05 LM 11 Blades Normal opera-tion
Out of operation 432 hours. Damage and change of blades because of lightning. Es-timated loss 8.200 kWh.
blades 1
2E+05 Bonus150kW (1)
2E+05 LM 11 Blades Wear/ fatigue Damage and repair of blades because of wear. Damage and repair of mechanical control because of overproduction.
blades 1
2E+05 Danwin 225kW (1)
2E+05 LM 12 Bladetips General fail-ure
April, the 4.th WTG stroked by breakdown. Probably caused by storm and grid failure.
tips 1
2E+05 Norwin 150kW (1)
2E+05 LM 11 Bladetips Normal opera-tion
Out of operation 288 hours. Air brake dam-age because of break. Estimated loss 13.800 kWh.
tips 1
2E+05 DANmark 25 200kW (1)
2E+05 LM 12 Bladetips Storm (>25 m/s)
September, the 16.th stormdamage on blade tip.
tips 1
2E+05 Danwin 225kW (1)
2E+05 LM 12 Bladetips Fractures Air brake damage because of cracks/fractures. Estimated loss 24.000 kWh.
tips 1
2E+05 Wind World 160kW (2)
2E+05 LM 11 Bladetips General fail-ure
Out of operation 200 hours because of air brake damage. Estimated loss 15.000 kWh Production for Feb., Mar. Apr. and May.
tips 1
67 Risø-R-1420(EN)

2E+05 Vind-syssel 150kW(2)
2E+05 LM 11 Bladetips Other Out of operation 72 hours. Air brake dam-age because of storm and cracks/fractures. Out of operation 120 hours. Grid damage. Short circuit because of mice. Estimated loss 5.560 kWh.
tips 1
2E+05 Wind World 150kW (4)
2E+05 LM 12 Bladetips Storm (>25 m/s)
Out of operation 229 hours. Damage of air brake and brake because of storm. Esti-mated loss 28.000 kWh.
tips 1
2E+05 Wind World 160kW (2)
2E+05 LM 11 Bladetips Run-away/ overspeed
Out of operation 700 hours. WTG raced for one hour (Dec., the 13.th) in strong breeze, while service men was working. Cause: bad service of main brake and air brakes. Blade sent for repair at LM. Estimated loss 25.000 kWh.
tips 1
2E+05 Wind World 160kW (2)
2E+05 LM 11 #N/A Out of operation 720 hours because of lightning on a blade. Total damage of air brakes and elecrical control and grid repair. Estimated loss 13.725 kWh.
tips 1
2E+05 Danwin200kW (1)
2E+05 LM 11 Entire na-celle
Other Out of operation 410 hours. Total damage of entire nacelle because of fire. Estimated loss 45.000 kWh.
nacelle 1
2E+05 Vestas55kW (9)
2E+05 ØKÆR Entire na-celle
Other Entire nacelle burned up and two blades damaged. Cause not known.
nacelle + blades burned
1
2E+05 #N/A #N/A #N/A Entire na-celle
General fail-ure
WTG burned 27.06. 8.30 am. nacelle burned
1
2E+05 Wind World150kW (4)
2E+05 LM 12 Entire na-celle
Short-cirtuiting Tower burned down because of short circuit in generator. Entire nacelle and yawsystem has to be changed.
Tower, nacelle
1
2E+05 Danwin 99kW (1)
2E+05 ALTERNAGY 9
Entire na-celle
General fail-ure
Out of operation 120 hours. WTG top blown up. Oil hoses torn across. 12,5 litre gearoil topped up.
nacelle 1
2E+05 Vestas55kW (9)
2E+05 ØKÆR #N/A Total damage of blades, grid, electrical control and entire nacelle.
blades + nacelle +
more
1
2E+05 Vestas55kW (9)
2E+05 ØKÆR Entirewindturbine
Lightning Total damage of WTG by lightning (August, the 12.th.)
WTB 1
2E+05 Kuriant15kW (2)
2E+05 KJ 5 Entire windturbine
Lightning Total damage of WTG by lightning. This is therefor the last report.
WTB 1
2E+05 Vestas 200kW (2)
2E+05 VESTAS 11,5
Entire windturbine
Lightning Out of operation 10 hours. Damage of entire WTG because of lightning.
WTB 1
2E+05 Vestas 55kW (9)
2E+05 ØKÆR Entirewindturbine
Storm (>25 m/s)
Out of operation 12 hours. Damage be-cause of storm. Estimated loss 600 kWh.
WTB 1
68 Risø-R-1420(EN)
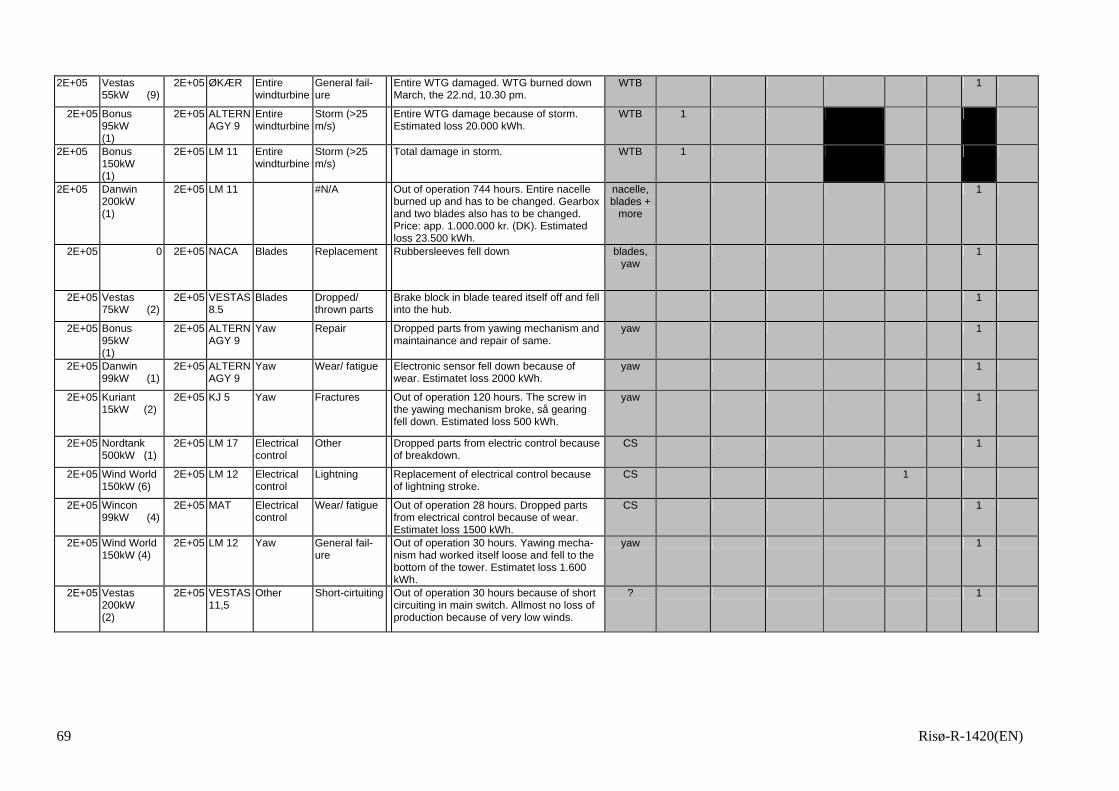
2E+05 Vestas55kW (9)
2E+05 ØKÆR Entirewindturbine
General fail-ure
Entire WTG damaged. WTG burned down March, the 22.nd, 10.30 pm.
WTB 1
2E+05 Bonus 95kW (1)
2E+05 ALTERNAGY 9
Entire windturbine
Storm (>25 m/s)
Entire WTG damage because of storm. Estimated loss 20.000 kWh.
WTB 1
2E+05 Bonus150kW (1)
2E+05 LM 11 Entire windturbine
Storm (>25 m/s)
Total damage in storm. WTB 1
2E+05 Danwin200kW (1)
2E+05 LM 11 #N/A Out of operation 744 hours. Entire nacelle burned up and has to be changed. Gearbox and two blades also has to be changed. Price: app. 1.000.000 kr. (DK). Estimated loss 23.500 kWh.
nacelle, blades +
more
1
2E+05 0 2E+05 NACA Blades Replacement Rubbersleeves fell down blades, yaw
1
2E+05 Vestas 75kW (2)
2E+05 VESTAS 8.5
Blades Dropped/thrown parts
Brake block in blade teared itself off and fell into the hub.
1
2E+05 Bonus 95kW (1)
2E+05 ALTERNAGY 9
Yaw Repair Dropped parts from yawing mechanism and maintainance and repair of same.
yaw 1
2E+05 Danwin 99kW (1)
2E+05 ALTERNAGY 9
Yaw Wear/ fatigue Electronic sensor fell down because of wear. Estimatet loss 2000 kWh.
yaw 1
2E+05 Kuriant 15kW (2)
2E+05 KJ 5 Yaw Fractures Out of operation 120 hours. The screw in the yawing mechanism broke, så gearing fell down. Estimated loss 500 kWh.
yaw 1
2E+05 Nordtank 500kW (1)
2E+05 LM 17 Electrical control
Other Dropped parts from electric control because of breakdown.
CS 1
2E+05 Wind World 150kW (6)
2E+05 LM 12 Electrical control
Lightning Replacement of electrical control because of lightning stroke.
CS 1
2E+05 Wincon 99kW (4)
2E+05 MAT Electricalcontrol
Wear/ fatigue Out of operation 28 hours. Dropped parts from electrical control because of wear. Estimatet loss 1500 kWh.
CS 1
2E+05 Wind World 150kW (4)
2E+05 LM 12 Yaw General fail-ure
Out of operation 30 hours. Yawing mecha-nism had worked itself loose and fell to the bottom of the tower. Estimatet loss 1.600 kWh.
yaw 1
2E+05 Vestas 200kW (2)
2E+05 VESTAS 11,5
Other Short-cirtuiting Out of operation 30 hours because of short circuiting in main switch. Allmost no loss of production because of very low winds.
? 1
69 Risø-R-1420(EN)
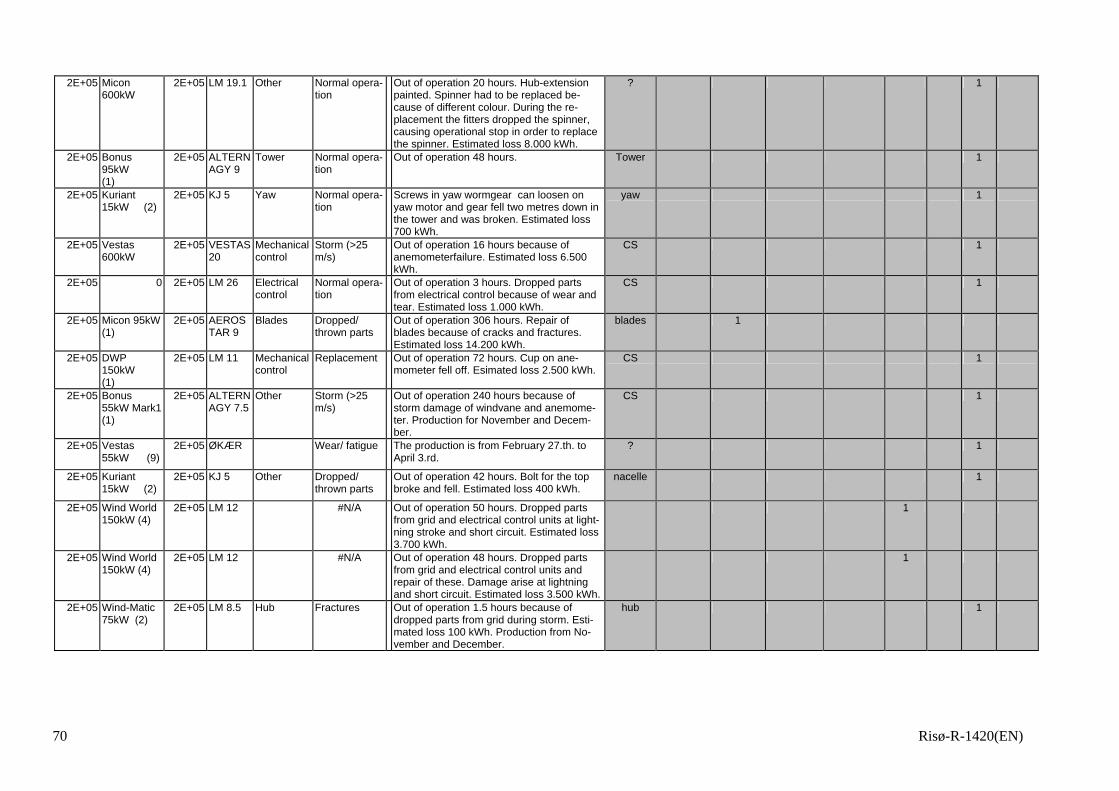
2E+05 Micon 600kW
2E+05 LM 19.1 Other Normal opera-tion
Out of operation 20 hours. Hub-extension painted. Spinner had to be replaced be-cause of different colour. During the re-placement the fitters dropped the spinner, causing operational stop in order to replace the spinner. Estimated loss 8.000 kWh.
? 1
2E+05 Bonus 95kW (1)
2E+05 ALTERNAGY 9
Tower Normal opera-tion
Out of operation 48 hours. Tower 1
2E+05 Kuriant 15kW (2)
2E+05 KJ 5 Yaw Normal opera-tion
Screws in yaw wormgear can loosen on yaw motor and gear fell two metres down in the tower and was broken. Estimated loss 700 kWh.
yaw 1
2E+05 Vestas 600kW
2E+05 VESTAS 20
Mechanical control
Storm (>25 m/s)
Out of operation 16 hours because of anemometerfailure. Estimated loss 6.500 kWh.
CS 1
2E+05 0 2E+05 LM 26 Electricalcontrol
Normal opera-tion
Out of operation 3 hours. Dropped parts from electrical control because of wear and tear. Estimated loss 1.000 kWh.
CS 1
2E+05 Micon 95kW (1)
2E+05 AEROSTAR 9
Blades Dropped/thrown parts
Out of operation 306 hours. Repair of blades because of cracks and fractures. Estimated loss 14.200 kWh.
blades 1
2E+05 DWP 150kW (1)
2E+05 LM 11 Mechanical control
Replacement Out of operation 72 hours. Cup on ane-mometer fell off. Esimated loss 2.500 kWh.
CS 1
2E+05 Bonus 55kW Mark1 (1)
2E+05 ALTERNAGY 7.5
Other Storm (>25m/s)
Out of operation 240 hours because of storm damage of windvane and anemome-ter. Production for November and Decem-ber.
CS 1
2E+05 Vestas 55kW (9)
2E+05 ØKÆR Wear/ fatigue The production is from February 27.th. to April 3.rd.
? 1
2E+05 Kuriant 15kW (2)
2E+05 KJ 5 Other Dropped/ thrown parts
Out of operation 42 hours. Bolt for the top broke and fell. Estimated loss 400 kWh.
nacelle 1
2E+05 Wind World 150kW (4)
2E+05 LM 12 #N/A Out of operation 50 hours. Dropped parts from grid and electrical control units at light-ning stroke and short circuit. Estimated loss 3.700 kWh.
1
2E+05 Wind World 150kW (4)
2E+05 LM 12 #N/A Out of operation 48 hours. Dropped parts from grid and electrical control units and repair of these. Damage arise at lightning and short circuit. Estimated loss 3.500 kWh.
1
2E+05 Wind-Matic 75kW (2)
2E+05 LM 8.5 Hub Fractures Out of operation 1.5 hours because of dropped parts from grid during storm. Esti-mated loss 100 kWh. Production from No-vember and December.
hub 1
70 Risø-R-1420(EN)

2E+05 Bonus 300kW (6)
2E+05 LM Blades Lightning Out of operation 168 hours. Lightning in blade caused lightning plug fuse to fell out and made a crack in the blade tip. Esti-mated loss 10.500 kWh.
blade 1
2E+05 Nordtank 150kW (3)
2E+05 LM 12 Blades General fail-ure
Out of operation 14 hours because of blade failure. Estimated loss 1.500 kWh.
blade 1
2E+05 0 2E+05 0 Blades Fractures Out of operation 72 Blade splitted on front edge.
blade 1
2E+05 Nordtank 150kW (3)
2E+05 LM 12 Blades Lightning Out of operation 9,5 hours because of light-ning on blade. Defect is not repaired. Esti-mated loss 200 kWh.
blade 1
2E+05 Vestas55kW (9)
2E+05 ØKÆR Blades Other WTG stopped because of cracks in the blades and will perhaps never run agian. Estimated loss 2.000 kWh.
blades 1
2E+05 Micon 55kW (1)
2E+05 0 Blades General fail-ure
Out of operation 504 hours. blades 1
2E+05 Wind-Matic 130kW (1)
2E+05 LM 9.7 Blades Run-away/ overspeed
Out of operation because of icing up. Out of operaton 10 hours because of storm. Esti-mated loss 4.800 kWh.
1
2E+05 Swinger T202 11kW(1)
2E+05 KM 13 Blades Storm (>25 m/s)
Out of operation 696 hours because of storm damage. Estimated loss 4.000 kWh.
blades 1
2E+05 Wincon 99kW (4)
2E+05 MAT Blades Normal opera-tion
Out of operation 408 hours. Strong forma-tion of cracks on a blade. WTG stopped Dec. 14.th for repair or replacement of blade. Estimated loss 3.600 kWh.
blades 1
2E+05 Nordtank 150kW (3)
2E+05 LM 12 Bladetips Other Out of operation 10 hours because of faulty construction in air brake. Estimated loss 500 kWh.
Tips 1
2E+05 Vestas 600kW
2E+05 VESTAS 20
Entire na-celle
Storm (>25 m/s)
Out of operation 22 hours because of storm. Out of operation 3 hours because of iced up anemometer. Estimated loss 12.000 kWh.
Nacelle 1
2E+05 Vestas 100kW (2)
2E+05 VESTAS 10
#N/A Out of operation 112 hours. Damage, change and repair of grid, electrical control and entire nacelle because of lightning and short circuit. Estimated loss 3.500 kWh.
nacelle 1
2E+05 Bonus55kW Mark1 (1)
2E+05 ALTERNAGY 7.5
Entire windturbine
General fail-ure
Out of operation 480 hours. Entire nacelle excl. blades has burned (July, the 12.th). Damage on control system. WTG has been taken down and is at Bonus. Estimated loss 4.000 kWh.
WTB 1
2E+05 Bonus 95kW (1)
2E+05 ALTERNAGY 9
Blades Repair no comment blades 1
71 Risø-R-1420(EN)
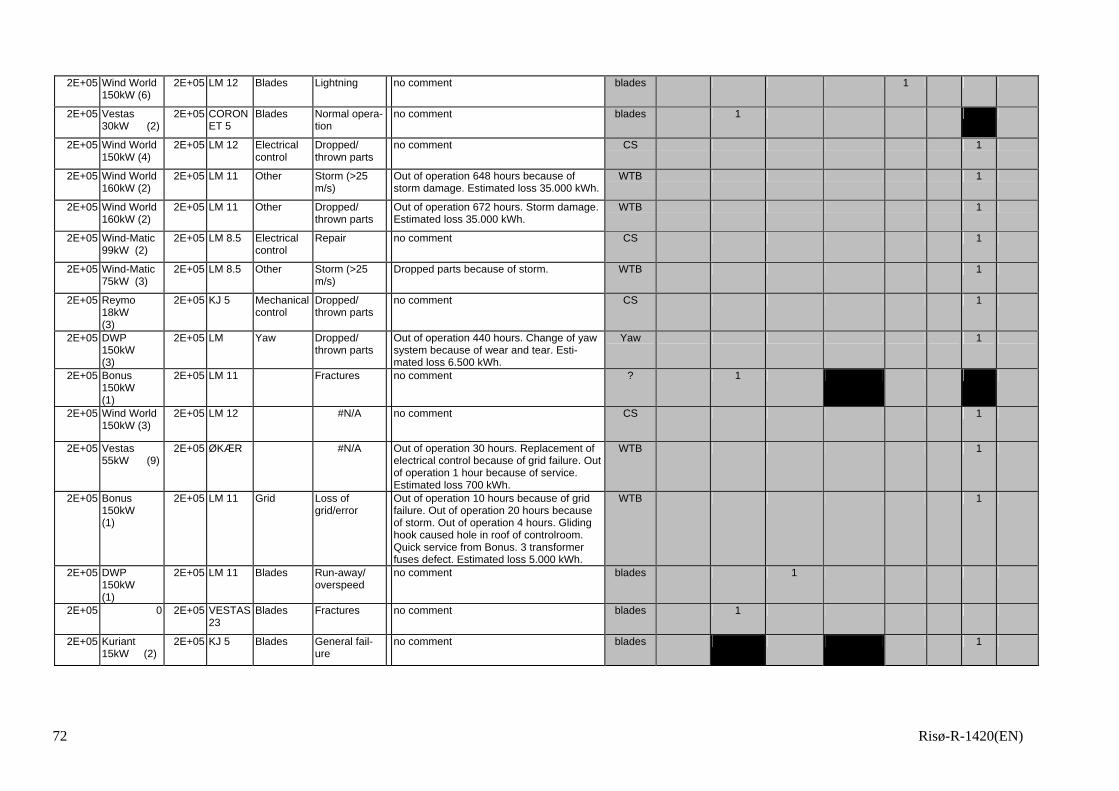
2E+05 Wind World 150kW (6)
2E+05 LM 12 Blades Lightning no comment blades 1
2E+05 Vestas 30kW (2)
2E+05 CORONET 5
Blades Normal opera-tion
no comment blades 1
2E+05 Wind World 150kW (4)
2E+05 LM 12 Electrical control
Dropped/ thrown parts
no comment CS 1
2E+05 Wind World 160kW (2)
2E+05 LM 11 Other Storm (>25 m/s)
Out of operation 648 hours because of storm damage. Estimated loss 35.000 kWh.
WTB 1
2E+05 Wind World 160kW (2)
2E+05 LM 11 Other Dropped/ thrown parts
Out of operation 672 hours. Storm damage. Estimated loss 35.000 kWh.
WTB 1
2E+05 Wind-Matic 99kW (2)
2E+05 LM 8.5 Electrical control
Repair no comment CS 1
2E+05 Wind-Matic 75kW (3)
2E+05 LM 8.5 Other Storm (>25 m/s)
Dropped parts because of storm. WTB 1
2E+05 Reymo 18kW (3)
2E+05 KJ 5 Mechanical control
Dropped/ thrown parts
no comment CS 1
2E+05 DWP 150kW (3)
2E+05 LM Yaw Dropped/thrown parts
Out of operation 440 hours. Change of yaw system because of wear and tear. Esti-mated loss 6.500 kWh.
Yaw 1
2E+05 Bonus 150kW (1)
2E+05 LM 11 Fractures no comment ? 1
2E+05 Wind World 150kW (3)
2E+05 LM 12 #N/A no comment CS 1
2E+05 Vestas 55kW (9)
2E+05 ØKÆR #N/A Out of operation 30 hours. Replacement of electrical control because of grid failure. Out of operation 1 hour because of service. Estimated loss 700 kWh.
WTB 1
2E+05 Bonus 150kW (1)
2E+05 LM 11 Grid Loss of grid/error
Out of operation 10 hours because of grid failure. Out of operation 20 hours because of storm. Out of operation 4 hours. Gliding hook caused hole in roof of controlroom. Quick service from Bonus. 3 transformer fuses defect. Estimated loss 5.000 kWh.
WTB 1
2E+05 DWP 150kW (1)
2E+05 LM 11 Blades Run-away/ overspeed
no comment blades 1
2E+05 0 2E+05 VESTAS23
Blades Fractures no comment blades 1
2E+05 Kuriant 15kW (2)
2E+05 KJ 5 Blades General fail-ure
no comment blades 1
72 Risø-R-1420(EN)
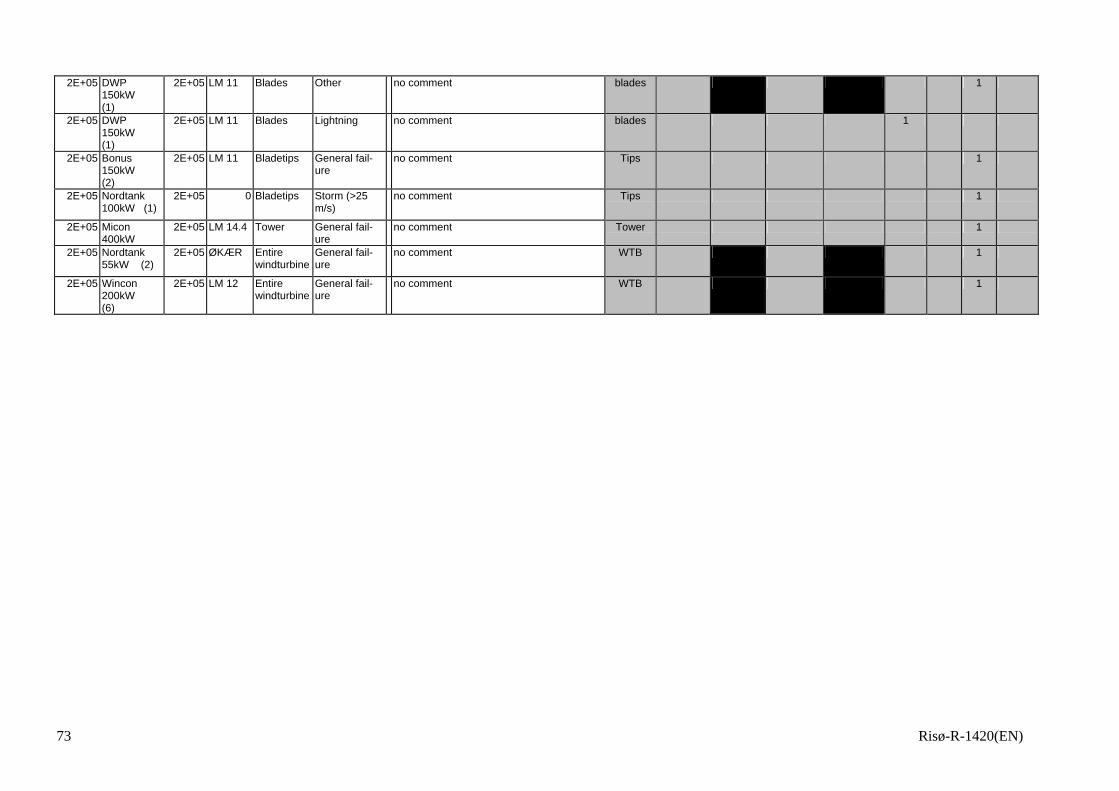
2E+05 DWP 150kW (1)
2E+05 LM 11 Blades Other no comment blades 1
2E+05 DWP 150kW (1)
2E+05 LM 11 Blades Lightning no comment blades 1
2E+05 Bonus 150kW (2)
2E+05 LM 11 Bladetips General fail-ure
no comment Tips 1
2E+05 Nordtank 100kW (1)
2E+05 0 Bladetips Storm (>25 m/s)
no comment Tips 1
2E+05 Micon 400kW
2E+05 LM 14.4 Tower General fail-ure
no comment Tower 1
2E+05 Nordtank 55kW (2)
2E+05 ØKÆR Entirewindturbine
General fail-ure
no comment WTB 1
2E+05 Wincon 200kW (6)
2E+05 LM 12 Entire windturbine
General fail-ure
no comment WTB 1
73 Risø-R-1420(EN)
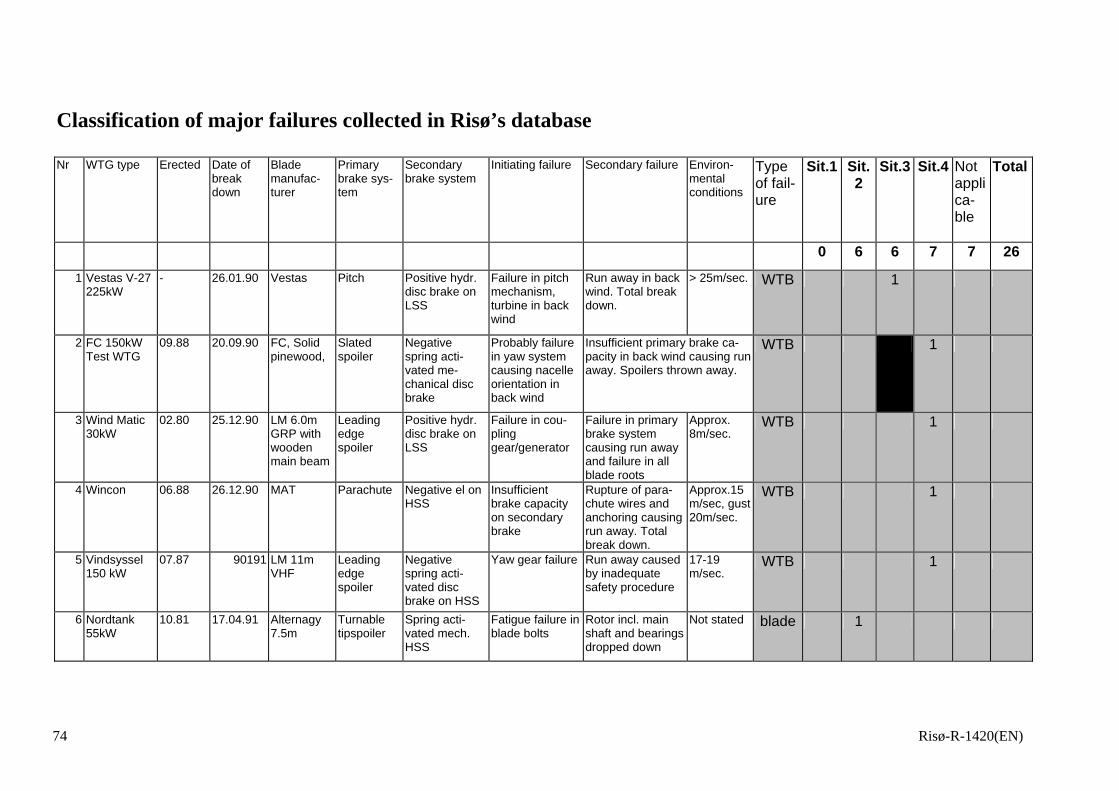
Classification of major failures collected in Risø’s database Nr WTG type Erected Date of
break down
Blade manufac-turer
Primary brake sys-tem
Secondary brake system
Initiating failure Secondary failure Environ-mental conditions
Type of fail-ure
Sit.1 Sit.2
Sit.3 Sit.4 Not applica-ble
Total
0 6 6 7 7 26
1 Vestas V-27 225kW
- 26.01.90 Vestas Pitch Positive hydr.disc brake on LSS
Failure in pitch mechanism, turbine in back wind
Run away in back wind. Total break down.
> 25m/sec. WTB 1
2 FC 150kW Test WTG
09.88 20.09.90 FC, Solid pinewood,
Slated spoiler
Negative spring acti-vated me-chanical disc brake
Probably failure in yaw system causing nacelle orientation in back wind
Insufficient primary brake ca-pacity in back wind causing run away. Spoilers thrown away.
WTB 1
3 Wind Matic 30kW
02.80 25.12.90 LM 6.0mGRP with wooden main beam
Leading edge spoiler
Positive hydr. disc brake on LSS
Failure in cou-pling gear/generator
Failure in primary brake system causing run away and failure in all blade roots
Approx. 8m/sec.
WTB 1
4 Wincon 06.88 26.12.90 MAT Parachute Negative el on HSS
Insufficient brake capacity on secondary brake
Rupture of para-chute wires and anchoring causing run away. Total break down.
Approx.15 m/sec, gust 20m/sec.
WTB 1
5 Vindsyssel 150 kW
07.87 90191 LM 11mVHF
Leading edge spoiler
Negative spring acti-vated disc brake on HSS
Yaw gear failure Run away caused by inadequate safety procedure
17-19 m/sec.
WTB 1
6 Nordtank 55kW
10.81 17.04.91 Alternagy7.5m
Turnable tipspoiler
Spring acti-vated mech. HSS
Fatigue failure in blade bolts
Rotor incl. main shaft and bearings dropped down
Not stated blade 1
74 Risø-R-1420(EN)
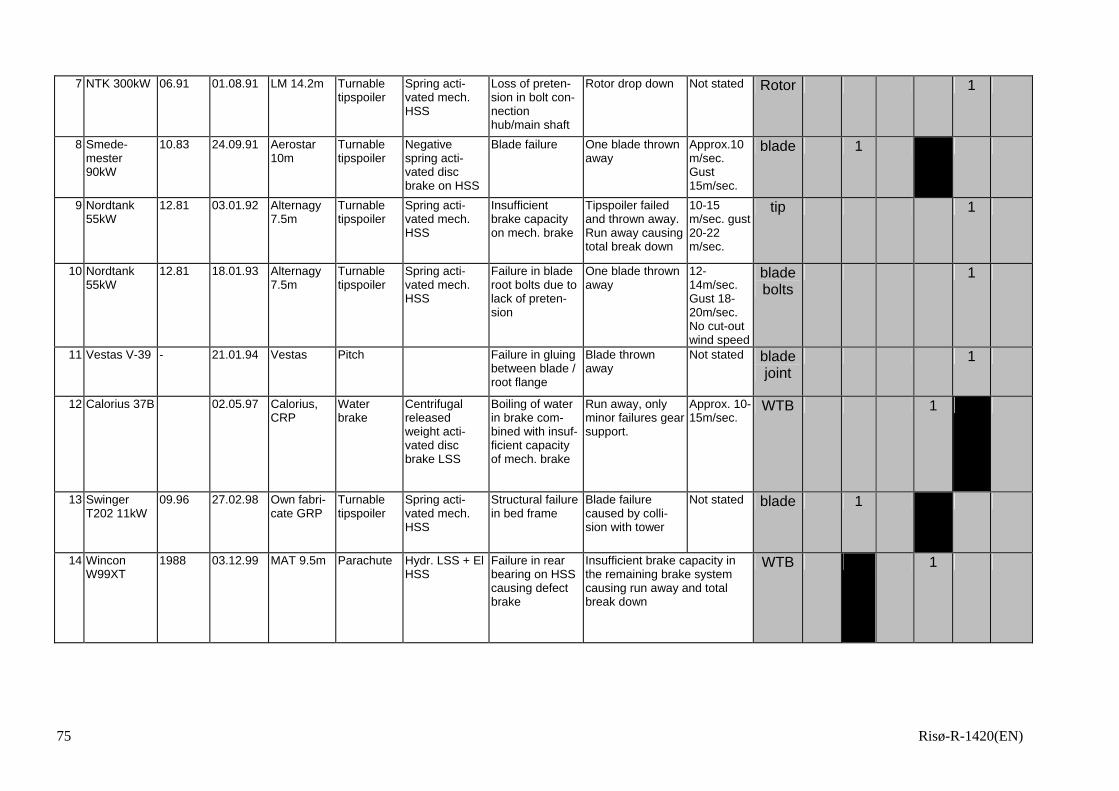
7 NTK 300kW 06.91 01.08.91 LM 14.2m Turnabletipspoiler
Spring acti-vated mech. HSS
Loss of preten-sion in bolt con-nection hub/main shaft
Rotor drop down Not stated Rotor 1
8 Smede-mester 90kW
10.83 24.09.91 Aerostar10m
Turnable tipspoiler
Negative spring acti-vated disc brake on HSS
Blade failure One blade thrown away
Approx.10m/sec. Gust 15m/sec.
blade 1
9 Nordtank 55kW
12.81 03.01.92 Alternagy7.5m
Turnable tipspoiler
Spring acti-vated mech. HSS
Insufficient brake capacity on mech. brake
Tipspoiler failed and thrown away. Run away causing total break down
10-15 m/sec. gust 20-22 m/sec.
tip 1
10 Nordtank 55kW
12.81 18.01.93 Alternagy7.5m
Turnable tipspoiler
Spring acti-vated mech. HSS
Failure in blade root bolts due to lack of preten-sion
One blade thrown away
12-14m/sec. Gust 18-20m/sec. No cut-out wind speed
blade bolts
1
11 Vestas V-39 - 21.01.94 Vestas Pitch Failure in gluing between blade / root flange
Blade thrown away
Not stated blade joint
1
12 Calorius 37B 02.05.97 Calorius, CRP
Water brake
Centrifugal released weight acti-vated disc brake LSS
Boiling of water in brake com-bined with insuf-ficient capacity of mech. brake
Run away, only minor failures gear support.
Approx. 10-15m/sec.
WTB 1
13 Swinger T202 11kW
09.96 27.02.98 Own fabri-cate GRP
Turnable tipspoiler
Spring acti-vated mech. HSS
Structural failure in bed frame
Blade failure caused by colli-sion with tower
Not stated blade 1
14 Wincon W99XT
1988 03.12.99 MAT 9.5m Parachute Hydr. LSS + El HSS
Failure in rear bearing on HSS causing defect brake
Insufficient brake capacity in the remaining brake system causing run away and total break down
WTB 1
75 Risø-R-1420(EN)
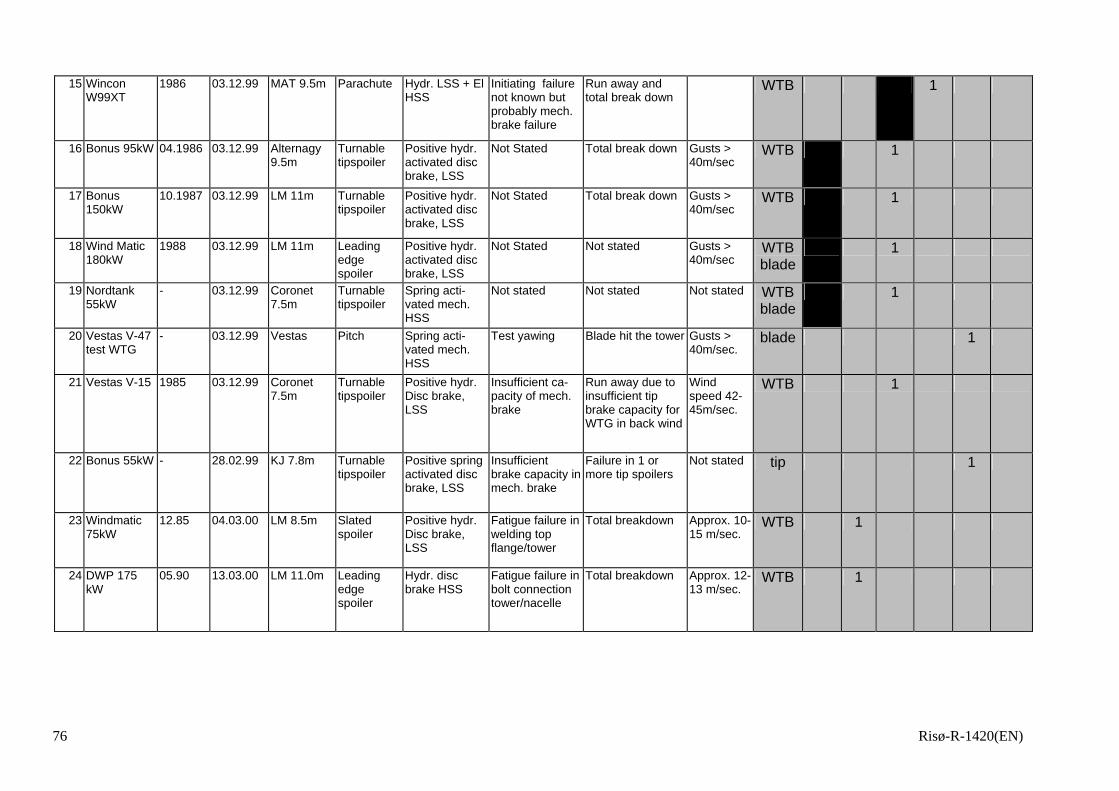
15 Wincon W99XT
1986 03.12.99 MAT 9.5m Parachute Hydr. LSS + El HSS
Initiating failure not known but probably mech. brake failure
Run away and total break down
WTB 1
16 Bonus 95kW 04.1986 03.12.99 Alternagy 9.5m
Turnable tipspoiler
Positive hydr. activated disc brake, LSS
Not Stated Total break down Gusts > 40m/sec
WTB 1
17 Bonus 150kW
10.1987 03.12.99 LM 11m Turnable tipspoiler
Positive hydr. activated disc brake, LSS
Not Stated Total break down Gusts > 40m/sec
WTB 1
18 Wind Matic 180kW
1988 03.12.99 LM 11m Leadingedge spoiler
Positive hydr. activated disc brake, LSS
Not Stated Not stated Gusts > 40m/sec
WTB blade
1
19 Nordtank 55kW
- 03.12.99 Coronet7.5m
Turnable tipspoiler
Spring acti-vated mech. HSS
Not stated Not stated Not stated WTB blade
1
20 Vestas V-47 test WTG
- 03.12.99 Vestas Pitch Spring acti-vated mech. HSS
Test yawing Blade hit the tower Gusts > 40m/sec.
blade 1
21 Vestas V-15 1985 03.12.99 Coronet 7.5m
Turnable tipspoiler
Positive hydr. Disc brake, LSS
Insufficient ca-pacity of mech. brake
Run away due to insufficient tip brake capacity for WTG in back wind
Wind speed 42-45m/sec.
WTB 1
22 Bonus 55kW - 28.02.99 KJ 7.8m Turnable tipspoiler
Positive spring activated disc brake, LSS
Insufficient brake capacity in mech. brake
Failure in 1 or more tip spoilers
Not stated tip 1
23 Windmatic 75kW
12.85 04.03.00 LM 8.5m Slated spoiler
Positive hydr. Disc brake, LSS
Fatigue failure in welding top flange/tower
Total breakdown Approx. 10-15 m/sec.
WTB 1
24 DWP 175 kW
05.90 13.03.00 LM 11.0m Leadingedge spoiler
Hydr. disc brake HSS
Fatigue failure in bolt connection tower/nacelle
Total breakdown Approx. 12-13 m/sec.
WTB 1
76 Risø-R-1420(EN)
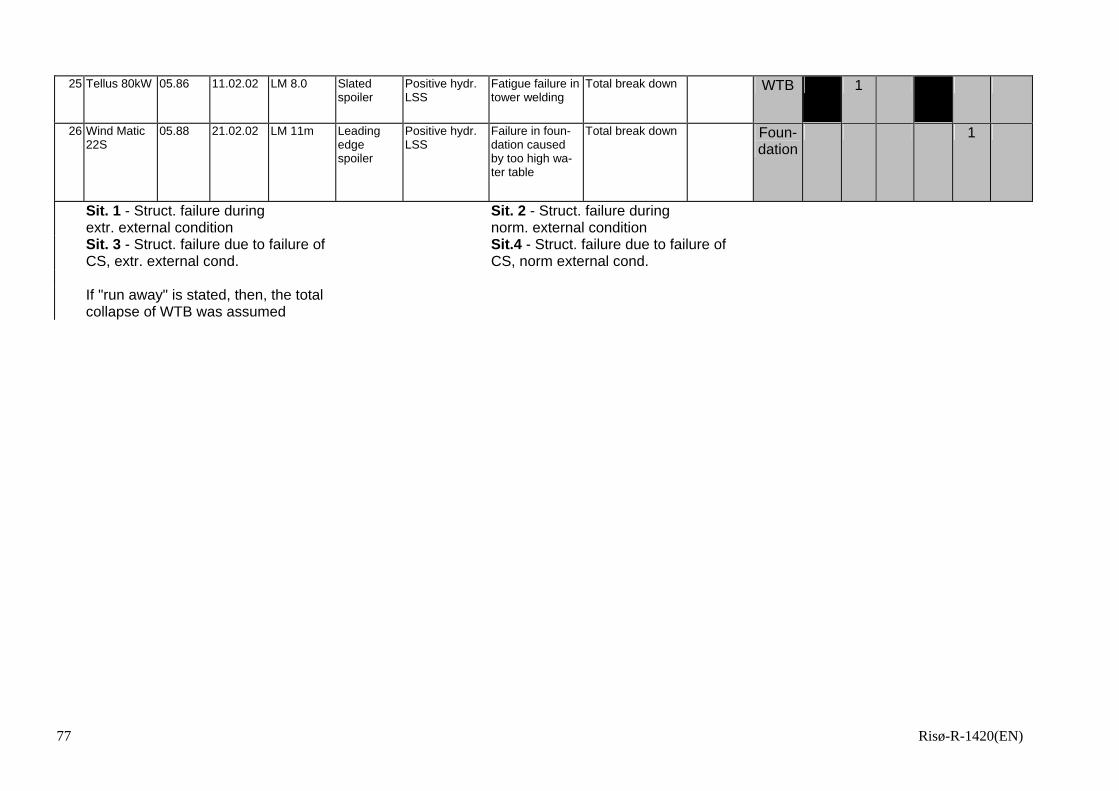
25 Tellus 80kW 05.86 11.02.02 LM 8.0 Slatedspoiler
Positive hydr. LSS
Fatigue failure in tower welding
Total break down WTB 1
26 Wind Matic 22S
05.88 21.02.02 LM 11m Leadingedge spoiler
Positive hydr. LSS
Failure in foun-dation caused by too high wa-ter table
Total break down Foun-dation
1
Sit. 1 - Struct. failure during extr. external condition
Sit. 2 - Struct. failure during norm. external condition
Sit. 3 - Struct. failure due to failure of CS, extr. external cond.
Sit.4 - Struct. failure due to failure of CS, norm external cond.
If "run away" is stated, then, the total collapse of WTB was assumed
77 Risø-R-1420(EN)
Appendix B: Model Uncertainties for Wave Loads on Wind Turbine Foun-dations By Arne Nestegård, Det Norske Veritas
In the present appendix the various sources of model uncertainties related to the modelling of wave loads on offshore wind turbine foundations are qualitatively presented. Uncertainties relating to the determination of the wave climate are not discussed. Wave loads on turbine foundations are due to hydrodynamic forces caused by the fluid-structure interaction between surface waves and the foundations struc-ture. The waves are in general random waves where the wave elevation and fluid velocity and acceleration in the fluid domain are stochastic processes. Modelling of random ocean waves is done assuming water to be incompressible and inviscid. Viscosity plays a central role in the generation of ocean surface waves by wind stresses acting on the water-air interface, however viscosity can be neglected in the propagation and further development of the waves. Hence, assuming potential flow is a very good approximation when modelling ocean surface waves. The role of viscosity in the wave structure interaction process can be determined by estimating the relative magnitudes of the viscous and inertial forces. The ra-tio of viscous to inertia forces is proportional to where U is the fluid velocity, U is the acceleration and D a characteristic horizontal dimension of the structure in the wave zone, typically the diameter in the case of a vertical cylindrical surface piercing structure. Since the acceleration is proportional to U/T, where T is the time local wave period, this ratio is proportional to the Keulegan-Carpenter number KC = UT/D = πH/D which can be used to catego-rize flow regimes. H is the wave height. For KC << 1 the wave force is inertia dominated while the force is drag dominated when KC >> 1. The different wave force regimes for a vertical cylinder is given in Figure 3. Typically, at KC=1, the drag force is about 5% of the inertia force. At KC=10, the drag force is about 50% of the inertia force. At KC = 20, they are nearly equal. For KC > 20, the drag force dominates.
DUU /2
The modelling of the interaction between ocean surface waves and a surface piercing structure can be done with various degree of sophistication. In general the fluid flow bounded by a free surface and a rigid solid boundary of a struc-ture, can be modelled by the Reynolds-averaged Navier-Stokes equations using a proper turbulence model or even by a full simulation like Large Eddy Simula-tion (LES). The force on the structure is then given by integrating the stresses acting on the wetted surface of the structure up to the instantaneous free surface elevation. However in engineering applications simpler methods are used. In the limit of small KC numbers, potential flow can be used. For mild sea-state conditions, when the wave height is much smaller than the wavelength, the in-
78 Risø-R-1420(EN
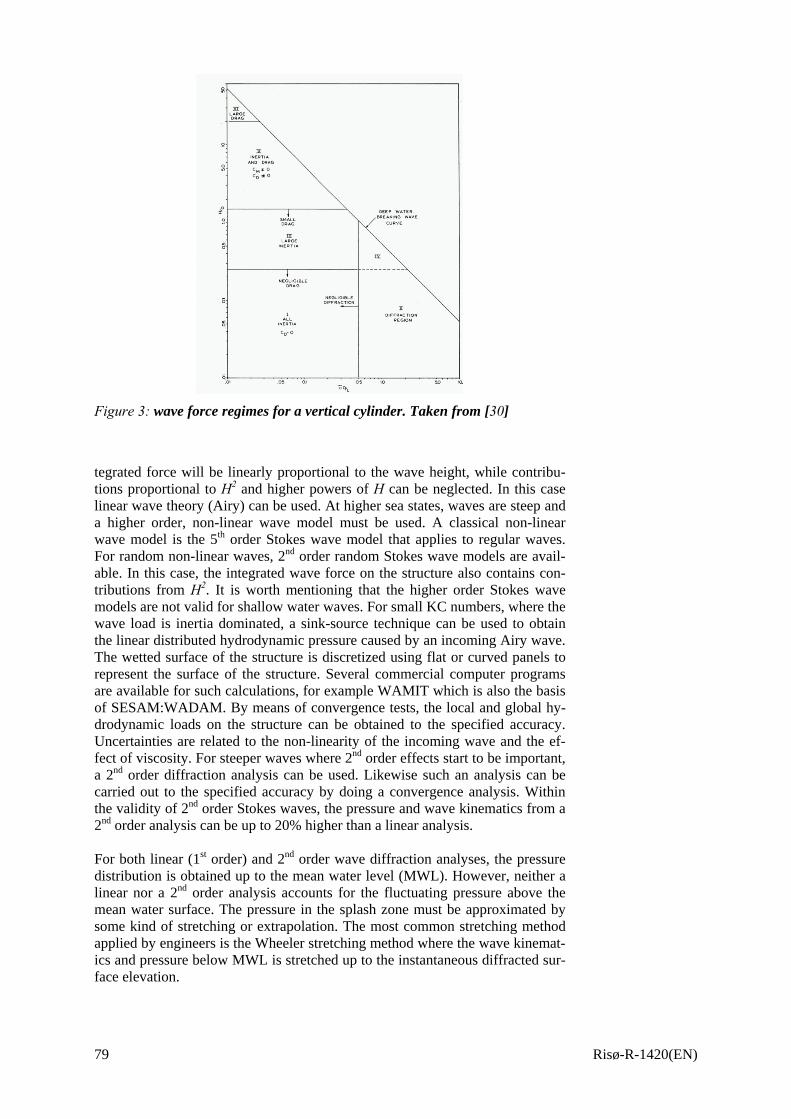
Figure 3: wave force regimes for a vertical cylinder. Taken from [30]
tegrated force will be linearly proportional to the wave height, while contribu-tions proportional to H2 and higher powers of H can be neglected. In this case linear wave theory (Airy) can be used. At higher sea states, waves are steep and a higher order, non-linear wave model must be used. A classical non-linear wave model is the 5th order Stokes wave model that applies to regular waves. For random non-linear waves, 2nd order random Stokes wave models are avail-able. In this case, the integrated wave force on the structure also contains con-tributions from H2. It is worth mentioning that the higher order Stokes wave models are not valid for shallow water waves. For small KC numbers, where the wave load is inertia dominated, a sink-source technique can be used to obtain the linear distributed hydrodynamic pressure caused by an incoming Airy wave. The wetted surface of the structure is discretized using flat or curved panels to represent the surface of the structure. Several commercial computer programs are available for such calculations, for example WAMIT which is also the basis of SESAM:WADAM. By means of convergence tests, the local and global hy-drodynamic loads on the structure can be obtained to the specified accuracy. Uncertainties are related to the non-linearity of the incoming wave and the ef-fect of viscosity. For steeper waves where 2nd order effects start to be important, a 2nd order diffraction analysis can be used. Likewise such an analysis can be carried out to the specified accuracy by doing a convergence analysis. Within the validity of 2nd order Stokes waves, the pressure and wave kinematics from a 2nd order analysis can be up to 20% higher than a linear analysis.
For both linear (1st order) and 2nd order wave diffraction analyses, the pressure distribution is obtained up to the mean water level (MWL). However, neither a linear nor a 2nd order analysis accounts for the fluctuating pressure above the mean water surface. The pressure in the splash zone must be approximated by some kind of stretching or extrapolation. The most common stretching method applied by engineers is the Wheeler stretching method where the wave kinemat-ics and pressure below MWL is stretched up to the instantaneous diffracted sur-face elevation.
79 Risø-R-1420(EN)

In order to predict the hydrodynamic pressure up to the instantaneous water sur-face, a fully non-linear simulation model must be applied. Such simulation codes exist, but they are mainly tried out within the academic community. Since such codes are rather delicate to run, being quite susceptible to numerical insta-bilities, there is a high degree of uncertainty related to their use. For the following FE structural analysis, considered separate from the hydrody-namic analysis, the calculated hydrodynamic pressure must be transferred to the structural discretized model that is often not the same as the hydrodynamic model. Hence, some kind of load interpolation must be used. Using sufficiently fine discretizations, this uncertainty can be neglected. If the structure is a simple structure, for example a vertical cylinder, its global response can be represented in terms of a few modal response modes. Then the response in these modes and the corresponding stresses can be obtained directly from the hydrodynamic analysis by defining generalized (flexible) modes in the diffraction analysis. Depending on the flexibility of the structure, this may be a better model than the classical quasi static load transfer model. If the flexibility of the structure has an effect on the hydrodynamic pressure, the flexible mode approach will account for hydroelastic effects. When the water depth is less than about 1/8 of the wavelength, the Stream Function wave theory can be use. There are two types of the stream function theory, applicable to regular and irregular waves. The application of higher or-der wave theories is only worthwhile when the horizontal dimension of the structure is much less than the wavelength. In this case, the fluid velocity is mainly horizontal and a strip theory approximation can be used. Two dimen-sional inertia force coefficients are defined for each strip in the vertical direction of the structure. The range of suitability of various wave theories is shown in Figure 4.
Figure 4: ranges of suitability of various wave theories. Taken from [30]
80 Risø-R-1420(EN)
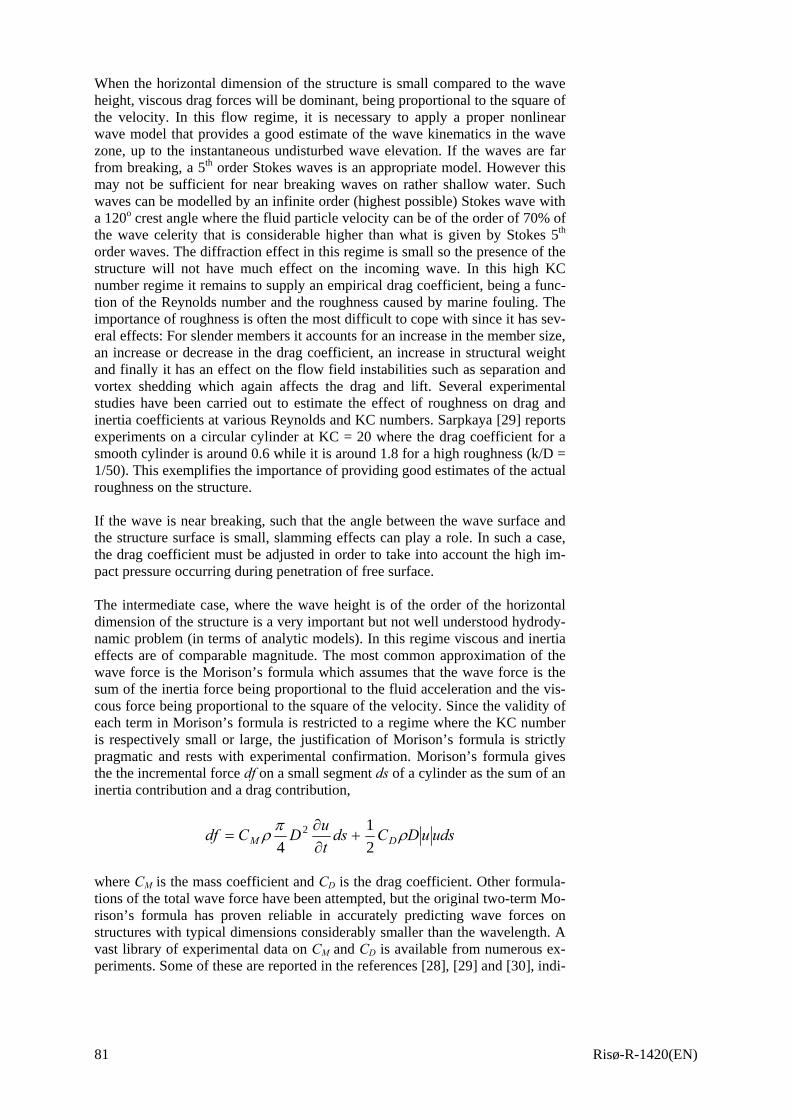
When the horizontal dimension of the structure is small compared to the wave height, viscous drag forces will be dominant, being proportional to the square of the velocity. In this flow regime, it is necessary to apply a proper nonlinear wave model that provides a good estimate of the wave kinematics in the wave zone, up to the instantaneous undisturbed wave elevation. If the waves are far from breaking, a 5th order Stokes waves is an appropriate model. However this may not be sufficient for near breaking waves on rather shallow water. Such waves can be modelled by an infinite order (highest possible) Stokes wave with a 120o crest angle where the fluid particle velocity can be of the order of 70% of the wave celerity that is considerable higher than what is given by Stokes 5th order waves. The diffraction effect in this regime is small so the presence of the structure will not have much effect on the incoming wave. In this high KC number regime it remains to supply an empirical drag coefficient, being a func-tion of the Reynolds number and the roughness caused by marine fouling. The importance of roughness is often the most difficult to cope with since it has sev-eral effects: For slender members it accounts for an increase in the member size, an increase or decrease in the drag coefficient, an increase in structural weight and finally it has an effect on the flow field instabilities such as separation and vortex shedding which again affects the drag and lift. Several experimental studies have been carried out to estimate the effect of roughness on drag and inertia coefficients at various Reynolds and KC numbers. Sarpkaya [29] reports experiments on a circular cylinder at KC = 20 where the drag coefficient for a smooth cylinder is around 0.6 while it is around 1.8 for a high roughness (k/D = 1/50). This exemplifies the importance of providing good estimates of the actual roughness on the structure. If the wave is near breaking, such that the angle between the wave surface and the structure surface is small, slamming effects can play a role. In such a case, the drag coefficient must be adjusted in order to take into account the high im-pact pressure occurring during penetration of free surface. The intermediate case, where the wave height is of the order of the horizontal dimension of the structure is a very important but not well understood hydrody-namic problem (in terms of analytic models). In this regime viscous and inertia effects are of comparable magnitude. The most common approximation of the wave force is the Morison’s formula which assumes that the wave force is the sum of the inertia force being proportional to the fluid acceleration and the vis-cous force being proportional to the square of the velocity. Since the validity of each term in Morison’s formula is restricted to a regime where the KC number is respectively small or large, the justification of Morison’s formula is strictly pragmatic and rests with experimental confirmation. Morison’s formula gives the the incremental force df on a small segment ds of a cylinder as the sum of an inertia contribution and a drag contribution,
udsuDCdstuDCdf DM ρπρ
21
42 +
∂∂
=
where CM is the mass coefficient and CD is the drag coefficient. Other formula-tions of the total wave force have been attempted, but the original two-term Mo-rison’s formula has proven reliable in accurately predicting wave forces on structures with typical dimensions considerably smaller than the wavelength. A vast library of experimental data on CM and CD is available from numerous ex-periments. Some of these are reported in the references [28], [29] and [30], indi-
81 Risø-R-1420(EN)
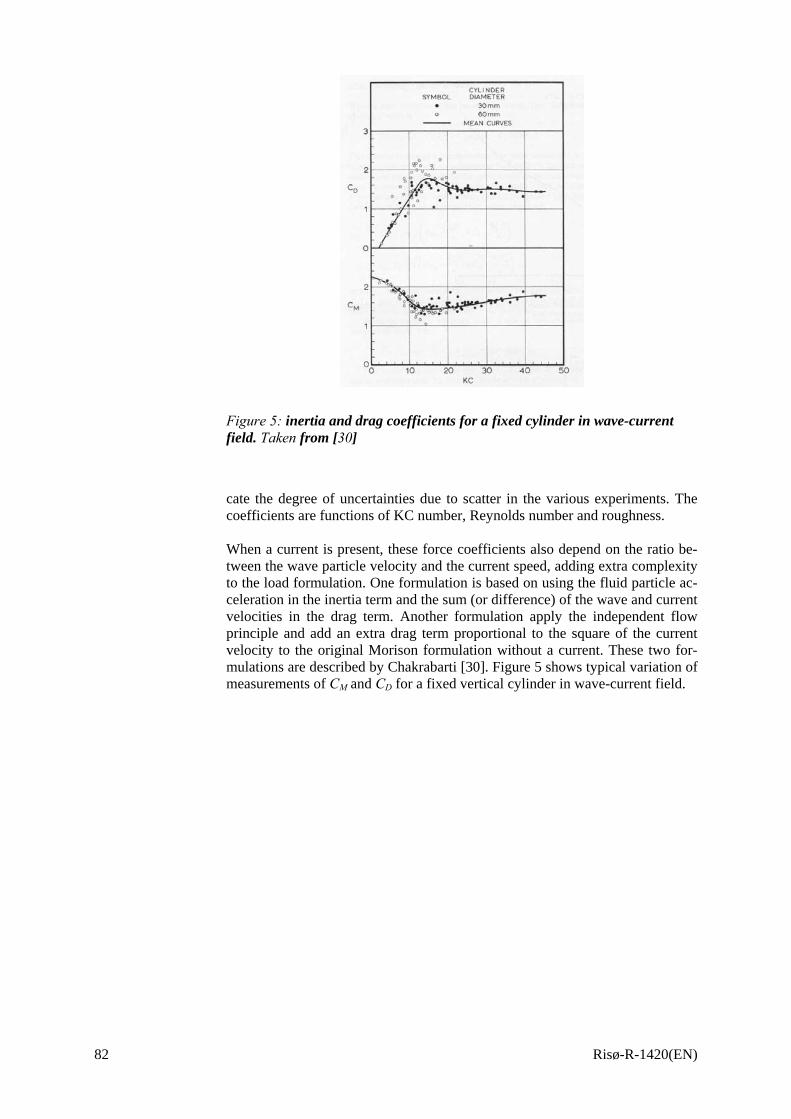
Figure 5: inertia and drag coefficients for a fixed cylinder in wave-current field. Taken from [30]
cate the degree of uncertainties due to scatter in the various experiments. The coefficients are functions of KC number, Reynolds number and roughness.
When a current is present, these force coefficients also depend on the ratio be-tween the wave particle velocity and the current speed, adding extra complexity to the load formulation. One formulation is based on using the fluid particle ac-celeration in the inertia term and the sum (or difference) of the wave and current velocities in the drag term. Another formulation apply the independent flow principle and add an extra drag term proportional to the square of the current velocity to the original Morison formulation without a current. These two for-mulations are described by Chakrabarti [30]. Figure 5 shows typical variation of measurements of CM and CD for a fixed vertical cylinder in wave-current field.
82 Risø-R-1420(EN)

83 Risø-R-1420(EN)
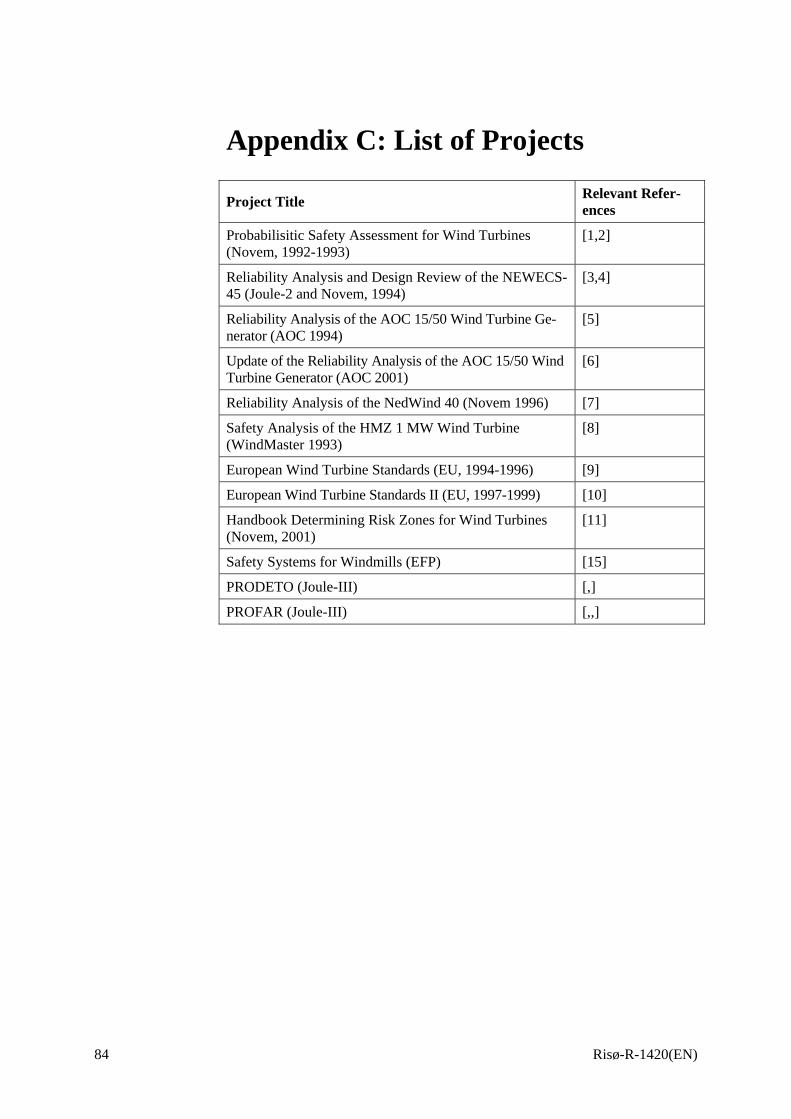
Appendix C: List of Projects
Project Title Relevant Refer-ences
Probabilisitic Safety Assessment for Wind Turbines (Novem, 1992-1993)
[1,2]
Reliability Analysis and Design Review of the NEWECS-45 (Joule-2 and Novem, 1994)
[3,4]
Reliability Analysis of the AOC 15/50 Wind Turbine Ge-nerator (AOC 1994)
[5]
Update of the Reliability Analysis of the AOC 15/50 Wind Turbine Generator (AOC 2001)
[6]
Reliability Analysis of the NedWind 40 (Novem 1996) [7]
Safety Analysis of the HMZ 1 MW Wind Turbine (WindMaster 1993)
[8]
European Wind Turbine Standards (EU, 1994-1996) [9]
European Wind Turbine Standards II (EU, 1997-1999) [10]
Handbook Determining Risk Zones for Wind Turbines (Novem, 2001)
[11]
Safety Systems for Windmills (EFP) [15]
PRODETO (Joule-III) [,]
PROFAR (Joule-III) [,,]
84 Risø-R-1420(EN)

85 Risø-R-1420(EN)
Bibliographic Data Sheet Risø-R-1420(EN) Title and authors Optimised and balanced structural and system reliability of offshore wind tur-bines An account Niels Jacob Tarp-Johansen, Risø National Laboratory Igor Kozine, Risø National Laboratory Luc Rademarkers, Netherlands Energy Research Foundation John Dalsgaard Sørensen, Aalborg University Knut Ronold, Det Norske Veritas ISBN ISSN 87-550-3240-0; 87-550-3241-9 (Internet) 0106-2840 Department or group Date Wind Energy April 2005 Groups own reg. number(s) Project/contract No(s) 1120132-00 PSO 1101 Sponsorship Public Service Obligation (The Danish Power Supplier Elkraft System) Pages Tables Illustrations References 86 8 5 30 Abstract (max. 2000 characters) This report gives the results of the research project “Optimised and Uniform Safety and Reliability of Offshore Wind Turbines (an account)”. The main sub-ject of the project has been the account of the state-of-the art of knowledge about, and/or attempts to, harmonisation of the structural reliability of wind tur-bines, on the one hand, and the reliability of the wind turbine’s control/safety system, on the other hand. Within the project some research pointing ahead has also been conducted. Descriptors INIS/EDB Available on request from Information Service Department, Risø National Laboratory, (Afdelingen for Informationsservice, Forskningscenter Risø), P.O.Box 49, DK-4000 Roskilde, Denmark. Telephone +45 4677 4004, Telefax +45 4677 4013
86 Risø-R-1420(EN)