
Optimal Conditions for Cell Viability on SU-8 Adherent Cell Sorting Microstructures Julius Oatts...
15
Optimal Conditions for Cell Viability on SU-8 Adherent Cell Sorting Microstructures Optimal Conditions for Cell Viability on SU-8 Adherent Cell Sorting Microstructures Julius Oatts Emory University – Neuroscience and Behavioral Biology August 25, 2006 Dr. Mark Bachman, Department of Electrical Engineering and Computer Science Dr. Nancy Allbritton & Dr. Chris Sims, Department of Physiology and Biophysics Photo Courtesy: Yuli Wang
-
date post
19-Dec-2015 -
Category
Documents
-
view
214 -
download
0
Transcript of Optimal Conditions for Cell Viability on SU-8 Adherent Cell Sorting Microstructures Julius Oatts...

Optimal Conditions for Cell Viability on SU-8 Adherent Cell Sorting
Microstructures
Optimal Conditions for Cell Viability on SU-8 Adherent Cell Sorting
Microstructures
Julius OattsEmory University – Neuroscience and Behavioral Biology
August 25, 2006
Dr. Mark Bachman, Department of Electrical Engineering and Computer Science
Dr. Nancy Allbritton & Dr. Chris Sims, Department of Physiology and Biophysics
Photo Courtesy: Yuli Wang
OutlineOutline
1) Project Overview – Long term goals
2) Micro Pallet Array Fabrication
3) Cell Growth on Pallets and Laser Release
4) Virtual Wall Discussion• Effect of silanization on cell growth
5) Fluorescent Protein Coating Stability
6) Density’s effect on cell growth
7) Acknowledgements

Project OverviewProject OverviewSeparate single cells from a heterogeneous population or isolate monoclonal colonies
Expand this technology to multiple cell lines
Mock Transfection: HeLa cells on 175um base, 50um high pallets
Select
Collect
Expand
Photos Courtesy:
Grace Young

Micro Pallet Array Fabrication
Micro Pallet Array Fabrication
1.SPIN COAT
2.UV EXPOSURE
3.POST-EXPOSURE
BAKE
4.DEVELOP
Glass slide
SU-8 coating
UV Radiation
Mask
Mask (removed)
Unwanted SU-8 dissolved
Patterned, cross-linked SU-8
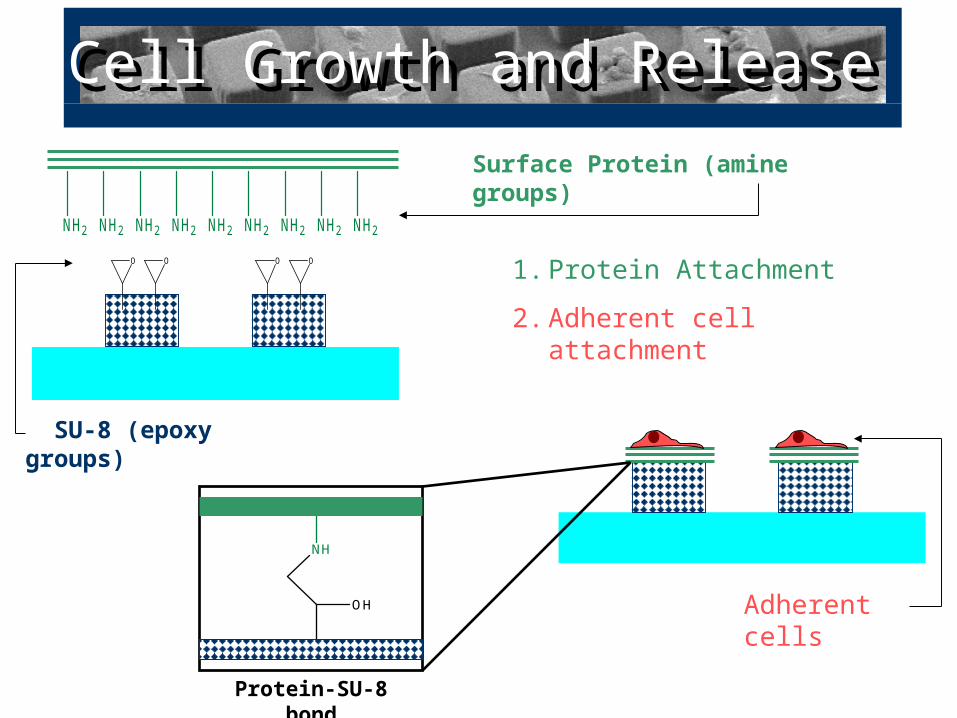
Cell Growth and ReleaseCell Growth and Release
O O O O
NH2 NH2 NH2 NH2 NH2 NH2 NH2 NH2 NH2
1. Protein Attachment
2. Adherent cell attachment
SU-8 (epoxy groups)
Adherent cells
Protein-SU-8 bond
OH
NH
Cell Growth and Release
Surface Protein (amine groups)

Cell Growth and ReleaseCell Growth and Release
3. Laser Pallet Release System
4. Cell/Pallet Collection
2 µJ, 10 ns pulse
Inverted Collection Well
Formation of Cavitation Bubble
Laser Release System
Released Adherent Cell on Pallet
Collection Well
Force causes pallet lift-off
Collected Adherent Cell on Pallet
Unreleased pallets are not collected

Cell Growth and Release“Virtual Wall” Discussion“Virtual Wall” Discussion
1.Deposition of Hydrophobic Silane Layer on Glass between pallets
2. Adding aqueous solution containing surface coating proteins
Protein Coating: Selective to
Pallets3. Formation of “Virtual Air Wall”
Formation of Water Droplets

“Virtual Wall” Discussion“Virtual Wall” Discussion
Top view
Side view
Cell attached to pallet
Water Droplets on Silanized Glass
Dermal Fibroblasts on 175m base pallets

Effect of Silanization on CellsEffect of Silanization on Cells
A-172 Cell Growth Day 4: (15,000 cells/mL seeding density)
0
5
10
15
20
25
30
35
40
45
50
fibr. + SU-8 + silaniz. fibr. + glass + silaniz. fibr. + glass
Ave
r. #
Cel
ls/ 4
0X F
ield
Dermal Fibroblasts Cell Growth Day 4: (20,000 cells/mL Seeding Density)
0123456789
10
fibr. + SU-8 + silaniz. fibr. + glass + silaniz. fibr. + glass
Ave
r. #
Cel
ls/ 4
0X F
ield
Silanized SU-8
Silanized Glass
Glass (control)

Protein Coating StabilityProtein Coating Stability
40 60 80 100 120 1400
20
40
60
80
100
120
140
160
180
200
220
240
260
280
300
320
340
360
FITC-Collagen Coated Pallet Blank Pallet Autofluorescence
y = -0.02441x + 104.51627
y = .06668x + 266.44959
Fluo
resc
ence
Inte
nsity
Time (hours)
Average Stability of FITC-Collagen Coating on a Single Pallet

Protein Coating StabilityProtein Coating Stability
Inconsistency: HeLa cells growing on collagen coated 175 µm pallets
Same Pallet Array:
Cells attached well
Poor cell adhesion
We Don’t Know.
Cause and Effect?
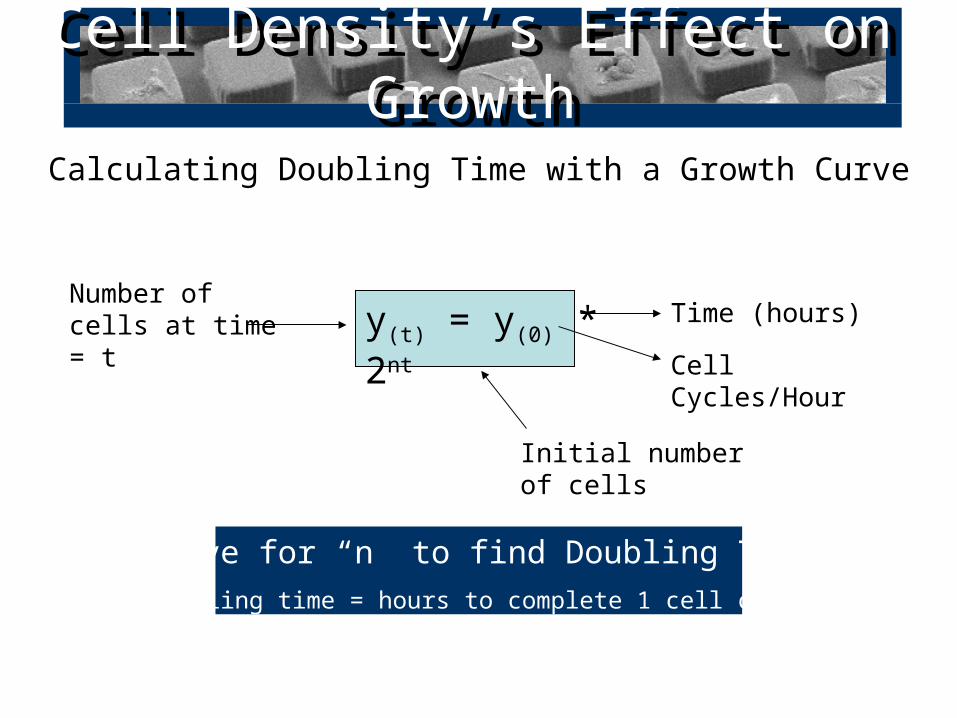
Cell Density’s Effect on GrowthCell Density’s Effect on Growth
Calculating Doubling Time with a Growth Curve
y(t) = y(0) * 2ntNumber of cells at time = t
Initial number of cells
Cell Cycles/Hour
Time (hours)
Solve for “n” to find Doubling Time(Doubling time = hours to complete 1 cell cycle)

Cell Density’s Effect on GrowthCell Density’s Effect on Growth
Cell Density Doubling Time
1,000 82 hours
10,000 62 hours
A-172’s
0 20 40 60 80 100-0.5
0.0
0.5
1.0
1.5
2.0
2.5
3.0
3.5
4.0
4.5
5.0
5.5y
(t) = 1.57478 * 2.01226t
Ave
. #
Ce
lls/F
ield
Time (hours)
1,000 cells/mL
4 hours 24 hours 47 hours 71 hours 95 hours
0 20 40 60 80 1000
5
10
15
20
25
30
35
40
45
50y(t) = 13.8503* 2.01622t
Ave
. # C
ells
/Fie
ld
Time (hours)
10,000 cells/mL
4 hours 24 hours 47 hours 71 hours 95 hours

Cell Density’s Effect on GrowthCell Density’s Effect on Growth
0 20 40 60 80 1000
1
2
3
4
5
6
7
8
9
10
y(t)
= 2.58219 * 2.01449t
1,000 cells/mL
Ave
. # C
ells
/Fie
ld
Time (hours)
5 hours 25 hours 48 hours 72 hours 96 hours
0 20 40 60 80 1000
10
20
30
40
50
60
70
80
90
10,000 cells/mL
y(t)
= 21.35886 * 2.01999tA
ve. # C
ells
/Fie
ld
Time (hours)
5 hours 25 hours 48 hours 72 hours 96 hours
Cell Density Doubling Time
1,000 69 hours
10,000 50 hours
Dermal Fibroblasts

AcknowledgementsAcknowledgements
Professors Mark Bachman, G.P. Li (project direction)
Professors Nancy Allbritton, Chris Sims (laboratory technique, project direction)
Grace Young (laboratory technique, tissue culture, mentoring)
Yuli Wang (mentoring, pallet fabrication)
University of California, Irvine and the Undergraduate Research Opportunities Program
National Institute of Health National Science Foundation


![DUAL ADHERENT/SUSPENSION CO-CULTURE MICRO- … · There are a number of previous works reporting on cell-cell interaction with single-cell resolution [5-8], but those works are limited](https://static.fdocuments.net/doc/165x107/5f6f60a8a81d1c74987e3b8b/dual-adherentsuspension-co-culture-micro-there-are-a-number-of-previous-works.jpg)


