Optimal algorithmic trading and market microstructure
49
HAL Id: hal-00590283 https://hal.archives-ouvertes.fr/hal-00590283v2 Submitted on 6 Jun 2011 HAL is a multi-disciplinary open access archive for the deposit and dissemination of sci- entific research documents, whether they are pub- lished or not. The documents may come from teaching and research institutions in France or abroad, or from public or private research centers. L’archive ouverte pluridisciplinaire HAL, est destinée au dépôt et à la diffusion de documents scientifiques de niveau recherche, publiés ou non, émanant des établissements d’enseignement et de recherche français ou étrangers, des laboratoires publics ou privés. Optimal algorithmic trading and market microstructure Mauricio Labadie, Charles-Albert Lehalle To cite this version: Mauricio Labadie, Charles-Albert Lehalle. Optimal algorithmic trading and market microstructure. 2010. <hal-00590283v2>
Transcript of Optimal algorithmic trading and market microstructure

HAL Id: hal-00590283https://hal.archives-ouvertes.fr/hal-00590283v2
Submitted on 6 Jun 2011
HAL is a multi-disciplinary open accessarchive for the deposit and dissemination of sci-entific research documents, whether they are pub-lished or not. The documents may come fromteaching and research institutions in France orabroad, or from public or private research centers.
L’archive ouverte pluridisciplinaire HAL, estdestinée au dépôt et à la diffusion de documentsscientifiques de niveau recherche, publiés ou non,émanant des établissements d’enseignement et derecherche français ou étrangers, des laboratoirespublics ou privés.
Optimal algorithmic trading and market microstructureMauricio Labadie, Charles-Albert Lehalle
To cite this version:Mauricio Labadie, Charles-Albert Lehalle. Optimal algorithmic trading and market microstructure.2010. <hal-00590283v2>

Optimal algorithmic tradingand market microstructure
Mauricio LABADIE
Charles-Albert LEHALLE
October 2010

Resume
La frontiere efficiente est un concept cle dans la Theorie Moderne du Portefeuille. En nous basantsur cette idee, nous allons construire des courbes de trading optimal pour des differents types deportefeuilles. Ces courbes correspondent aux strategies de trading algorithmique qui minimisentl’esperance des couts de transaction, i.e. l’effet joint de l’impact de marche et le risque de marche.
On va etudier cinq strategies de portefeuille. Pour les trois premieres (un seul actif, multi-actifs et portefeuille balance) on assumera que les sous-jacents suivent une diffusion Gaussienne,tandis que pour les deux derniers on supposera qu’il existe une combinaison d’actifs telle que leportefeuille correspondant suit une dynamique de retour a la moyenne. Les courbes de tradingoptimal peuvent etre calculees en resolvant un probleme d’optimisation dans RN , ou N est lenombre (pre-determine) de temps de trading. Dans quatre cas sur cinq, on obtient un simplealgorithme recursif de la forme
xn+1 = F (xn, xn−1),
sous les contraintes x0 = 1 et xN+1 = 0.
On va resoudre l’algorithme recursif en utilisant la methode de tir (en anglais shootingmethod), une technique numerique des equations differentielles. Cette methode a l’avantageque son equation correspondante est toujours unidimensionnelle, quoi qu’il soit le nombre detemps de trading N . De plus, cette technique peut etre appliquee aussi a des portefeuilles plusgeneraux, pour lesquels l’equation a tant des dimensions comme le nombre de sous-jacents maiselle reste toujours independant de N .
Cette nouvelle approche pourrait interesser des traders haute-frequence et des courtierselectroniques.
i

Abstract
The efficient frontier is a core concept in Modern Portfolio Theory. Based on this idea, we willconstruct optimal trading curves for different types of portfolios. These curves correspond tothe algorithmic trading strategies that minimize the expected transaction costs, i.e. the jointeffect of market impact and market risk.
We will study five portfolio trading strategies. For the first three (single-asset, general multi-asseet and balanced portfolios) we will assume that the underlyings follow a Gaussian diffusion,whereas for the last two portfolios we will suppose that there exists a combination of assets suchthat the corresponding portfolio follows a mean-reverting dynamics. The optimal trading curvescan be computed by solving an optimization problem in RN , where N is the (pre-determined)number of trading times. In four out of the five cases, we will obtain a simple, recursive algorithmof the form
xn+1 = F (xn, xn−1),
under the constraints x0 = 1 and xN+1 = 0.
We will solve the recursive algorithm using the shooting method, a numerical technique fordifferential equations. This method has the advantage that its corresponding equation is alwaysone-dimensional regardless of the number of trading times N . Moreover, this technique can bealso applied to more general portfolios, for which the equation has as many dimensions as thenumber of assets but it is still independent of N .
This novel approach could be appealing for high-frequency traders and electronic brokers.
ii

Contents
1 Introduction 11.1 Modern Portfolio Theory (MPT) and efficient frontier . . . . . . . . . . . . . . . 11.2 Capital Asset Pricing Model (CAPM) and betas . . . . . . . . . . . . . . . . . . 31.3 Optimal trading curve . . . . . . . . . . . . . . . . . . . . . . . . . . . . . . . . . 51.4 The scope of this memoire . . . . . . . . . . . . . . . . . . . . . . . . . . . . . . . 6
2 Market microstructure 82.1 Hypotheses behind MPT and CAPM: The Efficient Market Theory . . . . . . . . 82.2 Market structure . . . . . . . . . . . . . . . . . . . . . . . . . . . . . . . . . . . . 9
2.2.1 Market types . . . . . . . . . . . . . . . . . . . . . . . . . . . . . . . . . . 92.2.2 Tick and fixing . . . . . . . . . . . . . . . . . . . . . . . . . . . . . . . . . 102.2.3 Market orders . . . . . . . . . . . . . . . . . . . . . . . . . . . . . . . . . . 10
2.3 Transaction costs . . . . . . . . . . . . . . . . . . . . . . . . . . . . . . . . . . . . 112.4 Monitoring trading: Benchmarks . . . . . . . . . . . . . . . . . . . . . . . . . . . 13
2.4.1 Pre-trade benchmarks . . . . . . . . . . . . . . . . . . . . . . . . . . . . . 132.4.2 Intraday benchmarks . . . . . . . . . . . . . . . . . . . . . . . . . . . . . . 132.4.3 Post-trade benchmarks . . . . . . . . . . . . . . . . . . . . . . . . . . . . . 14
3 Algorithmic trading 153.1 Some facts on algorithmic trading . . . . . . . . . . . . . . . . . . . . . . . . . . 15
3.1.1 Empirical evidence favoring algorithmic trading over human trading . . . 153.2 Algorithmic trading and its multiple faces . . . . . . . . . . . . . . . . . . . . . . 163.3 Basic bricks for algorithmic trading . . . . . . . . . . . . . . . . . . . . . . . . . . 17
3.3.1 Impact-driven algorithms . . . . . . . . . . . . . . . . . . . . . . . . . . . 173.3.2 Cost-driven algorithms . . . . . . . . . . . . . . . . . . . . . . . . . . . . . 183.3.3 Opportunistic algorithms . . . . . . . . . . . . . . . . . . . . . . . . . . . 18
3.4 Building complex algorithms . . . . . . . . . . . . . . . . . . . . . . . . . . . . . 19
4 Optimal trading for Gaussian assets and portfolios 214.1 Single assets . . . . . . . . . . . . . . . . . . . . . . . . . . . . . . . . . . . . . . . 21
4.1.1 Model . . . . . . . . . . . . . . . . . . . . . . . . . . . . . . . . . . . . . . 214.1.2 Optimization program . . . . . . . . . . . . . . . . . . . . . . . . . . . . . 23
4.2 Multi-asset portfolios . . . . . . . . . . . . . . . . . . . . . . . . . . . . . . . . . . 24
iii
CONTENTS iv
4.2.1 Model . . . . . . . . . . . . . . . . . . . . . . . . . . . . . . . . . . . . . . 244.2.2 Optimization program . . . . . . . . . . . . . . . . . . . . . . . . . . . . . 25
4.3 Balanced portfolios . . . . . . . . . . . . . . . . . . . . . . . . . . . . . . . . . . . 26
5 Optimal trading for mean-reverting portfolios 275.1 General mean-reverting portfolios . . . . . . . . . . . . . . . . . . . . . . . . . . . 27
5.1.1 The model . . . . . . . . . . . . . . . . . . . . . . . . . . . . . . . . . . . 275.1.2 Wealth process and optimization program . . . . . . . . . . . . . . . . . . 28
5.2 Simplified model . . . . . . . . . . . . . . . . . . . . . . . . . . . . . . . . . . . . 295.3 The shooting method . . . . . . . . . . . . . . . . . . . . . . . . . . . . . . . . . . 30
5.3.1 Description . . . . . . . . . . . . . . . . . . . . . . . . . . . . . . . . . . . 305.3.2 Application to optimal trading curves . . . . . . . . . . . . . . . . . . . . 32
5.4 Numerical example using Matlab . . . . . . . . . . . . . . . . . . . . . . . . . . . 32
6 Conclusions 356.1 Optimal trading curves . . . . . . . . . . . . . . . . . . . . . . . . . . . . . . . . . 35
6.1.1 Recursive algorithms and shooting method . . . . . . . . . . . . . . . . . 356.1.2 Dynamic programming and optimal control . . . . . . . . . . . . . . . . . 356.1.3 Nonlinear transaction costs . . . . . . . . . . . . . . . . . . . . . . . . . . 36
6.2 Normal returns vs real returns: stylized facts . . . . . . . . . . . . . . . . . . . . 366.3 Some alternative models in Economics and Finance . . . . . . . . . . . . . . . . . 37
6.3.1 GARCH . . . . . . . . . . . . . . . . . . . . . . . . . . . . . . . . . . . . . 376.3.2 Levy distributions . . . . . . . . . . . . . . . . . . . . . . . . . . . . . . . 386.3.3 Student distributions . . . . . . . . . . . . . . . . . . . . . . . . . . . . . . 386.3.4 Fractional Brownian motion . . . . . . . . . . . . . . . . . . . . . . . . . . 396.3.5 Multifractal Models . . . . . . . . . . . . . . . . . . . . . . . . . . . . . . 396.3.6 Adaptive markets and agent-based models . . . . . . . . . . . . . . . . . . 40
6.4 Taking a stand: quantitative vs discretionary trading . . . . . . . . . . . . . . . . 406.5 A final thought: how would be the trader of the future? . . . . . . . . . . . . . . 41
References 42

Chapter 1
Introduction
The Modern Portfolio Theory (MPT) and the Capital Asset Pricing Model (CAPM) are mile-stones in asset pricing and management in both the academy and the industry. These twotheories are elegant theoretical achievements that have revolutionized the vision of Finance andEconomics. We will review both theories in order to get some insight on the relationship be-tween risk and return. Afterwards we will apply the same ideas for trading strategies in orderto minimize the associated transaction costs.
1.1 Modern Portfolio Theory (MPT) and efficient frontier
MPT (or Markowitz Portfolio) was developed by Markowitz in 1952. The idea behind MPTis simple yet insightful. Imagine a market with two assets A and B, in which we invest today(t = 0) and at time t = 1 we recover our initial investment plus the profits of the period. Assumethat the probability distributions of A and B are known, i.e. their means rA, rB and variancesσA, σB are information available to everybody.
Suppose rA > rB and σA > σB. Then we have two natural choices:
• Maximize profits regardless of the risk (i.e. variance). In this case we choose asset A.
• Minimize risk regardless of profit. In this case we choose B.
Now suppose that the correlation ρ between both assets is negative and that short-selling isnot allowed. Then there exists an investment strategy ω ∈ (0, 1) such that the correspondingportfolio
P = ωA+ (1− ω)B
has minimal variance, i.e. σP < σB. Portfolio P is called the minimal variance portfolio (seeFigure 1.1).
In general, if the market consists on N assets A1, . . . , AN , there is an investment strategy
ωi ≥ 0, i = 1, . . . , N ;N∑i=1
ωi = 1
1

2
Figure 1.1: The effect of diversification. If the correlation ρ = 0 (dotted line) then the minimal varianceportfolio is asset B. However, if ρ < 0 (solid line) there is a portfolio P with less variance than B (calledminimal variance portfolio).
such that the portfolio
P =N∑i=1
ωiAi
has minimal variance, i.e.σP ≤ min{σi : i = 1, . . . , N}. (1.1)
Moreover, if at least one of the correlations is negative then inequality (1.1) is strict.
Now suppose we want to minimize the variance of our portfolio P for a given target returnr. Then the optimization program is to minimize σP under the constraints
ωi ≥ 0, i = 1, . . . , N ;N∑i=1
ωi = 1;N∑i=1
ωiri = r.
Analogously, for a given risk level σ we can maximize the portfolio return rp under the constraints
ωi ≥ 0, i = 1, . . . , N ;N∑i=1
ωi = 1; σP = σ.
Graphing the optimal pair (rP , σP ) we obtain a curve called efficient frontier (see Figure 1.2).Its name comes from the fact that the porfolios on it are the most efficient ones: they maximizereturns for a given risk level, or equivalently, they minimize risks for a given target return.

3
Figure 1.2: Efficient frontier. The curve separates the admissible portfolios (i.e. those satisfying thecontraints) from the non-admissible ones. A portfolio P on the efficient frontier minimizes the risk(volatility) for a given level of return, or equivalently maximizes the return for a given level of risk.
1.2 Capital Asset Pricing Model (CAPM) and betas
MPT is a great idea that relies on the calculation of the variance-covariance matrix. However,when the number of assets grows it becomes very hard to calculate. Indeed, For N assets, sincethe N ×N variance-covariance matrix is symmetric it has N(N + 1)/2 degrees of freedom (SeeTable 1.1).
N N(N + 1)/2 Index with N components5 15 -10 55 -15 120 -20 210 -30 465 Dow Jones, DAX40 820 CAC 4050 1,275 EUROSTOXX100 5,050 FTSE225 25,425 NIKKEI500 125,250 S&P
Table 1.1: Even for the smallest indices (i.e. N = 30), the number of correlations that have to becalculated exceeds 450. This number quickly reaches 1000, even before N = 50.
In order to overcome this difficulty, we could try to calculate first a market portfolio, whichincludes all available assets, and then compare this market portfolio with each and every one

4
of the single assets. If we proceed this way then the number of degrees of freedom is 2(N + 1):N + 1 volatilities and N + 1 correlations. This is far more manageable than the N(N + 1)/2degrees of freedom in MPT.
This is the idea behind CAPM, which was developed by Sharpe, a PhD student of Markowitz,in 1964. According to CAPM, the return of an asset i is
ri = rf + βiM (rM − rf ) + εi, βiM =cov(ri, rM )
var(rM ), (1.2)
where ri is the return of asset i, rf the return of the risk-free asset (e.g. Treasure bonds) andrM the market return. βiM is the marginal contribution of asset i to market risk, also knownas the systematic risk or market risk, whereas εi is the idiosyncratic risk. The idiosincratic riskcan be eliminated via diversification, whereas the systematic risk is inherent of the market andcannot be diversified away.
Now let us study the relative returns with respect to the risk-free asset. Taking expectationsin (1.2) it follows that that the expected return of asset i over the risk-less rate rf is
E(ri − rf ) = βiME(rM − rf ). (1.3)
As we can see from (1.2), the beta of asset i (i.e. its systematic risk βiM ) acts as an amplifierof the expected market returns (see Figure 1.3).
Figure 1.3: Beta. The market portfolio m has β = 1. For assets such that β > 1 both profits and lossesare amplified, whereas for assets such that β < 1 both profits and losses are reduced.

5
1.3 Optimal trading curve
When it comes to intraday trading strategies we have the following dilemma, also known as thetrader’s dilemma: If we trade slow then prices will move away from their current quote, i.e. weare facing a market risk ; however, if we trade fast then our order will drive quotes away fromthe current one, i.e. we will have a great market impact (see Figure 1.4).
Figure 1.4: Trader’s dilemma. Trading faster reduces market risk but increases market impact, whereastrading slower reduces market impact but increases market risk.
Recall that in MPT we optimize the joint effect of two oppossite forces: minimizing therisk of the portfolio and maximizing the (expected) return. Following the idea of the efficientfrontier, it seems natural to build up an optimization program that minimizes simultaneouslyboth the market risk and the market impact.
Suppose we need to sell a certain amount of asset S during the day. We split the tradingorder in exactly N small sub-orders of size νn, n = 1, . . . , N . The goal is to find the right tradingproportions
νi ≥ 0, i = 1, . . . , N ;N∑n=1
νn = 1,
that minimize the expected loss due to market risk and market impact.
As we will see in later chapters, the set of minimizers constitute a curve, the optimal tradingcurve. For a given risk level (variance), the trading strategy P on the optimal trading curve isthe one that minimizes the expected market costs, i.e. the joint effects of market risk and marketimpact. Conversely, given a level of expected market costs, the optimal strategy P minimizesthe market risk (variance) (see Figure 1.3).

6
Figure 1.5: Optimal Trading curve. Trading strategies P on the curve minimize the joint effect of marketrisk (variance) and market impact (expected market costs).
The optimal trading strategy is thus the vector of proportions (ν1, . . . , νN ) that must beexchanged at each trading time. It is customary to describe trading curves not in terms of thenumber of assets exchanged but in terms of the remaining assets in the portfolio:
(x0, . . . , xN+1), x0 = 1, xN+1 = 0, xn =N∑i=n
νi ∀n = 1, . . . , N.
1.4 The scope of this memoire
The goal of this memoire is to describe thoroughly the construction of the optimal trading curve(x0, . . . , xN+1) for different market models and portfolio strategies.
In Chapter 2 we will study the market microstructure. We will see how the hypotheses ofMPT and CAPM, i.e. the Efficient Market Theory, are all violated in real markets. We willfocus in particular on the effect of transaction costs and market impact. We will also review thebenchmarks used for monitoring trades.
Roughly speaking, a trading strategy is algorithmic if it is stripped of human decisions (andemotions). In Chapter 3 we will describe what is algorithmic trading and we will survey thebasic strategies in algorithmic trading, which are the building blocks of almost any systematictrading strategy can be constructed. We will also show evidence that favors algorithmic tradingover human trading.
In Chapter 4 we will construct the optimal trading curve (x0, . . . , xN+1) under normalityassumptions, i.e. the asset is supposed to follow a Brownian motion. This chapter will be basedon the article of Almgren and Chriss [1] for single assets and on the work of Lehalle [14] for

7
multi-asset and balanced portfolios.
In Chapter 5 we will construct again the optimal trading curve (x0, . . . , xN+1), but followingLehalle [14] we will consider that the portfolio has a mean-reverting dynamics. We will solveanalytically and numerical a simplified case of a mean-reverting portfolio using the shootingmethod, a numerical technique used in differential equations. The novelty of our approach is thealternative optimization program we use: we will construct the optimal trading curve using a1-dimensional algorithm regardless of the total number of trades N . Being more advantageousthan the classical approaches based on functional optimization in RN , this approach could beof interest for systematic brokers and traders.
Chapter 6 is the final chapter. We will make some remarks on the portfolio models wehave presented and mention some possible extensions. We will also review several alternativemodels for time series that could be used to describe markets more accurately. Finally, wewill comment on the pros and cons of automated (algorithmic-based) trading with respect todiscretionary (human-based) trading.

Chapter 2
Market microstructure
2.1 Hypotheses behind MPT and CAPM: The Efficient MarketTheory
Despite the beauty and simplicity of MPT and CAPM, the theory they rely on, i.e. the EfficientMarket Theory (EMT) is too reductionistic and idealistic when compared with real market con-ditions. Therefore, MPT and CAPM must be handled with care since they both can lead towrong conclusions.
Let us study each one of the hypotheses of the EMT, the framework in which MPT andCAPM were developed.
1. Existence of a single market price.
According to the theory, market prices reflect the fundamental value of assets. However,the very notion of price is very ambiguous. Indeed, in any market we have several pricescoexisting simultaneously: ask price, bid price, mid-point, last traded price, average price,etc. Moreover, this single-price assumption ignores the price formation process, whichdepends on the subtleties of each market and explains why do we have different prices atdifferent markets and .
2. Information is complete and perfect.
According to EMT, economic information is complete, perfect and everyone has accessto it. Therefore, if investors are rational they will all have the same expectations on thefuture behavior of assets. In practice this is not true because there exists an asymmetry ofinformation. Indeed, not only information has a price (e.g. real-time access via Bloombergor Reuters) but also markets have different degrees of transparency (e.g. dark pools).
3. All investors are equal.
If all investors were rational and share the same information then they would all havethe same expectations on the future value of assets, and in consequence they would allhave the same behavior. However, since there is a huge heterogeneity of investors it is not
8

9
realistic at all to consider that all investors are equal, as the EMT does. Indeed, each singleinvestor has a personal strategy (long-only, long-short, hedging, speculation, arbitrage), atime horizon (ranging from several years to milliseconds) and an asset preference (equities,foreign exchange, interest rates, credit, derivatives, venture capital).
4. Agents are infinitely rational.
All agents (i.e. market participants) are suppose to have a utility function that describesall their preferences, which they try to maximize. This hypothesis rises two questions. Onthe one hand, investors do have personal biases due to their beliefs (politics, culture andreligion), which are hard to quantify. On the other hand, there is abundant evidence ofherd behavior and self-fulfilling anticipations.
5. No endogenous crashes.
The EMT affirms that market prices reflect the fundamental value of the assets, and thatthese prices only move due to unpredictable events or news. Under this framework, crashescan only be exogenous, never provoked by the inner dynamics of the markets. However, inthe past hundred years we have had several crashes, most of them caused by the marketsthemselves : the Great Depression in 1929, the “Black Monday” on October 19 1987, theInternet bubble in 2000, the subprime in 2008 and the flash crash on May 6 2010.
Since none of these hypothesis is fully verified in real markets, it is important to be awareof the limits of the EMT approach. This is particularly true for constructing market models,especially if the goal is to exploit trading opportunities. The discipline known as market mi-crostructure aims to understand the effect of these factors (among others) in order to betterunderstand the markets.
2.2 Market structure
Among the microstructure effects, market structure is one of the most important ones, justbehind transaction costs. Unlike the assumptions of the EMT, where all markets are treatedin a democratic fashion, the microstructure theory states that the specific organization of eachmarket determines the price-formation processes and its intrinsic trading dynamics.
Understanding the way each market works is crucial for all traders, especially high-frequencytraders who try to reap profits from small anomalies in intraday prices, without being exposedto market trends. Here we will survey the different kinds of markets and orders. For furtherreferences we invite the reader to check Barry Johnson [13] and Fabrice Riva [21].
2.2.1 Market types
There are three types of markets: order-driven markets, quote-driven markets and hybrid mar-kets.

10
In an Order-driven market all traders participate equally, placing orders on an orderbook that are matched following a consistent set of priority rules. In general, first and secondpriority in the order book are given to price and time, respectively. However, there are marketswith a membership priority, which is placed between price and time. A remarkable feature oforder-driven markets is their degree of automatization, which makes this kind of markets veryappealing for automated trading, in particular for high-frequency strategies.
In a Quote-driven market traders must transact with dealers or market makers who quoteprices at which they will buy and sell a given quantity. Since the role of the market maker is toprovide liquidity, the prices they quote are firm.
A Hybrid market is in principle an order-driven market, but they allow direct negotiationbetween counterparties if the trading volumes are sufficiently big.
2.2.2 Tick and fixing
Independently of their kind, all markets share two specific intraday trading characteristics, thetick and the fixing.
A tick is the smallest price change available. As a rule of thumb, the more liquid the assetis, the tighter its bid-ask spread is. However, if the tick size is too big then even for the mostliquid assets the spread will be large because it is always a multiple of the tick. The tick size alsoaffects the volatility: if the tick is big then even the slightest change in price has a strong impact.
A fixing is a market period with discontinuous price quotes. It has two stages: a pre-fixingperiod when buy/sell orders are cumulated but not executed, and a trading period where allcumulated orders are traded at a fixed price. In practice, this unique price is such that thenumber of exchanges is maximized, i.e. it is a walrasian equilibrium price. There are severalreasons for a fixing: during the opening, it allows a more efficient price discovery mechanism,whereas for the closing it reduces the volatility and the price manipulation. There also existnon-schedule fixings. For example, if the volatility is too high then the stock exchange can calla fixing, which lasts 5 minutes. This permits to stop the abnormal price trend and facilitatesthe return to the normal equilibrium.
2.2.3 Market orders
A Market order is an instruction to trade a given quantity at the best price possible. Marketorders demand liquidity because their focus is on completing the order. Therefore, the main riskis the uncertainty of the ultimate execution price: if the volume at the current market price isnot enough then the market order jumps to the next level of the order book; this process goeson until the order is fully executed.
A Limit order is an instruction to trade a given quantity at a specified price or better. Abuy limit order must execute at or below this limit price, whereas a sell order must execute at
11
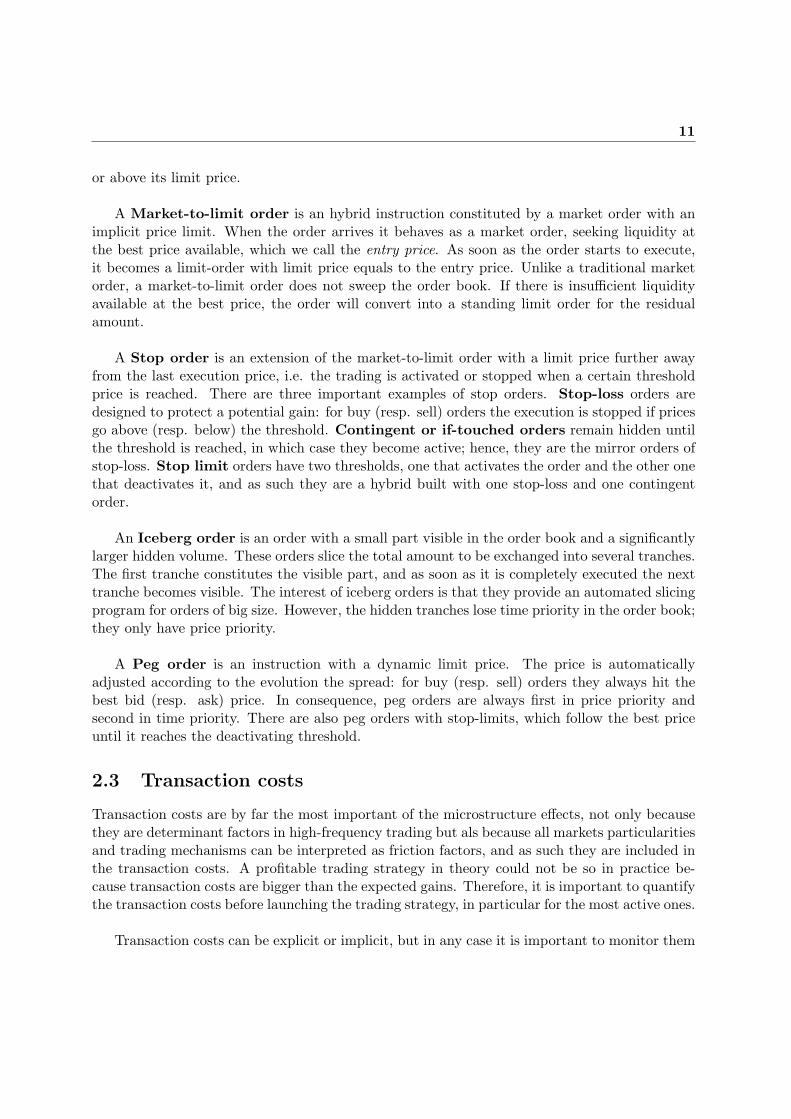
or above its limit price.
A Market-to-limit order is an hybrid instruction constituted by a market order with animplicit price limit. When the order arrives it behaves as a market order, seeking liquidity atthe best price available, which we call the entry price. As soon as the order starts to execute,it becomes a limit-order with limit price equals to the entry price. Unlike a traditional marketorder, a market-to-limit order does not sweep the order book. If there is insufficient liquidityavailable at the best price, the order will convert into a standing limit order for the residualamount.
A Stop order is an extension of the market-to-limit order with a limit price further awayfrom the last execution price, i.e. the trading is activated or stopped when a certain thresholdprice is reached. There are three important examples of stop orders. Stop-loss orders aredesigned to protect a potential gain: for buy (resp. sell) orders the execution is stopped if pricesgo above (resp. below) the threshold. Contingent or if-touched orders remain hidden untilthe threshold is reached, in which case they become active; hence, they are the mirror orders ofstop-loss. Stop limit orders have two thresholds, one that activates the order and the other onethat deactivates it, and as such they are a hybrid built with one stop-loss and one contingentorder.
An Iceberg order is an order with a small part visible in the order book and a significantlylarger hidden volume. These orders slice the total amount to be exchanged into several tranches.The first tranche constitutes the visible part, and as soon as it is completely executed the nexttranche becomes visible. The interest of iceberg orders is that they provide an automated slicingprogram for orders of big size. However, the hidden tranches lose time priority in the order book;they only have price priority.
A Peg order is an instruction with a dynamic limit price. The price is automaticallyadjusted according to the evolution the spread: for buy (resp. sell) orders they always hit thebest bid (resp. ask) price. In consequence, peg orders are always first in price priority andsecond in time priority. There are also peg orders with stop-limits, which follow the best priceuntil it reaches the deactivating threshold.
2.3 Transaction costs
Transaction costs are by far the most important of the microstructure effects, not only becausethey are determinant factors in high-frequency trading but als because all markets particularitiesand trading mechanisms can be interpreted as friction factors, and as such they are included inthe transaction costs. A profitable trading strategy in theory could not be so in practice be-cause transaction costs are bigger than the expected gains. Therefore, it is important to quantifythe transaction costs before launching the trading strategy, in particular for the most active ones.
Transaction costs can be explicit or implicit, but in any case it is important to monitor them

12
and have an idea of the impact they have on the trading strategy. We will survey the mostimportant transaction costs from the most visible ones to the most hidden ones.
Commissions, which are the most obvious cost component, represent the broker compen-sation.
Fees are charges that may be levied by floor brokers and exchanges. They also include thecosts of clearing and settlement. In general, fees are already included in the comission charge.
Taxes are generally charged on the realized profits from capital gains. However, there arestock markets (e.g. UK) where there is a duty on share purchases for non-members, and thereis a current debate on whether this measure should be extended to other markets.
Spread costs are the only compensation that market makers and traders receive for pro-viding liquidity. As we have mentioned before, the spread usually reflects the liquidity of anasset and strongly depends on the tick size. For single executions, spreads are straightforwardto calculate, but for trades that are split up into several small orders we need to track down thespread costs for each executed order separately.
Delay costs reflect any price change between the time when the decision to invest was madeand the actual time when the order started to be executed. Delay costs can be a substantialproportion of overall costs, particularly for assets with high volatility and/or whose price istrending unfavorably.
Market impact represents how much effect does the trading order have on the price: largerorders will result in a bigger impact than smaller ones. This effect decreases significantly as liq-uidity (i.e. the available trading volume) increases. Market impact can be split into temporaryand permanent. The temporary market impact reflects the overall cost incurred by demandingimmediacy. The permanent impact carries the information leakage: the trade unveils a differentlong-term price expectation, hence the price is adjusted accordingly in the long term.
Price trends can affect a trade in a significant way. Indeed, if there is an upward trendthen the best strategy is to buy early and sell later, whereas for a downward trend we shouldsell early and buy later. Therefore, if we entered into the wrong position we will be paying thetrend, especially if the benchmark we are using to monitor our trade is the closing price.
Market risk or timing risk reflects the uncertainty of prices as time passes. It is related tovolatility because the more volatile is an asset, the more likely it is to drift away from its initialprice. Therefore, market risk can have a considerable cost for strategies based on volatile assetsand/or orders that have a long trading horizon.
Opportunity costs represent missed opportunities due to incomplete trading orders orunfavorable market conditions. This costs are generally tracked using a paper portfolio, i.e. atheoretical, ideal trading strategy that we are trying to replicate.

13
In the next chapters we will build several microstructure models focussed on market impactand market risk. It is important to notice that we are not losing any generality because fixedand liquidity costs (commisions, fees, taxes and spreads) can be incorporated in the marketimpact function, whereas delay and opportunity costs can be related to market risk.
2.4 Monitoring trading: Benchmarks
Choosing the right benchmark is of utmost importance because it is the measure stick thatdetermines whether a trading strategy is profitable or not. A good benchmark should be easyto track, verifiable and provide an accurate measurement. There are three kinds of benchmarks:pre-trade, intraday and post-trade.
2.4.1 Pre-trade benchmarks
They have the advantage that they are easily determined and immediately available for com-parison. The most used ones are previous close (i.e. last quote yesterday), opening price(first quote today), decision price (price at the moment when the investor decided to trade)and arrival price (price when the broker started to execute the order).
Since pre-trade benchmarks do not influence or get influenced by the market, they are objec-tive measures for transaction costs. However, a substantial price shift during the day can makethe bechmark less meaningful because the traded orders will be compared to a price they couldnever have achieved.
2.4.2 Intraday benchmarks
They are average prices that try to reflect more accurately the intraday market conditions thanpre-trade benchmarks do.
OHLC is the average of four numbers: Open, High, Low, and Close. It used to be a proxyfor mean market price, but given the available amount of data nowadays it has lost its appeal.Notice that OHLC being an average of only four points, it is only meaningful if the market isnot volatile because it can be easily distorted by extreme values.
TWAP (Time Weighted Average price) is an average of the observed trade prices over atime period. TWAP is a dynamic benchmark because for each new trade it incorporates a newprice to the existing ones and updates the average. Notice that since all values for TWAP havethe same weight, extreme prices can have a large effect on it.
VWAP (Volume Weighted Average Price) is the total traded value over the total tradedquantity, and as such it gives the fairest indication on how do market prices have moved over atime period. Unlike TWAP, where all prices have the same weight, VWAP weights each tradedprice by its corresponding traded size. Therefore, small trades at extreme prices are smoothed

14
out whereas the largest trades will dominate the average. However, VWAP is not very accuratefor large trades. Indeed, if an order represents an important percentage of the day’s trading (i.e.over 30%) then VWAP has no meaning as a performance measure because the trade will have agreat impact on the average. VWAP can also lead to artificially poorer performances for assetsthat are volatile or markets that have a strong trend.
2.4.3 Post-trade benchmarks
We have two important post-trade benchmarks: closing and implementation shortfall.
Closing prices are a very popular benchmark, widely used as a milestone for marking tomarket and for profit and loss because it is a succint summary of price changes during the day.However, closing prices have the same disadvantage than opening prices: they do not reflect thetrading conditions trhoughout the day. In consequence, although closing prices are a popularbenchmark, they are not the best reference for performance analysis.
Implementation Shortfall (IS) is a measure of the total transaction costs. It consistson comparing the actual performance of the portfolio with its paper equivalent, i.e. a virtualportfolio traded at benchmark prices:
IS = Returns of paper portfolio− Returns of real portfolio.
In order to describe IS more precisely, let us first make some definitions. Let X be the intendedinvestment, pD the price when the investment decision was made, pF the final market price,pA the price when the order started to be executed (i.e. the arrival price), νn the size of theindividual executions and pn the achieved prices. Under this framework, the transaction costsare
IS = X(pA − pD)︸ ︷︷ ︸Delay costs
+N∑n=1
νn(pn − pA)︸ ︷︷ ︸trading costs
+
(X −
N∑n=1
νn
)(pF − pA)︸ ︷︷ ︸
opportunity costs
+ explicit costs.
Observe that if all the order was executed, i.e.
X =N∑n=1
νn,
then the only transaction costs are the delay and explicit costs,
IS =N∑n=1
νn(pn − pD) + explicit costs.

Chapter 3
Algorithmic trading
3.1 Some facts on algorithmic trading
There are two different classifications of trading strategies: on the one hand we have algorithmicvs human trading, whereas on the other hand we have high vs low frequency trading. It isimportant to stress that both classifications are not at all exclusive. Indeed, a high frequencytrader can be algorithmic or human as long as it trades actively; on the contrary, an algorithmcan decide to trade and hold a position on an illiquid asset for a long time horizon.
There is no strict distinction between high and low frequency trading. However, as a ruleof thumb , practitioners set the threshold at 15 minutes: we are in the high frequency regimeif the time between trades is less than 15 minutes and in the low frequency regime if the timebetween trades is greater than 15 minutes (see Lehalle and Rosenbaum [15]).
3.1.1 Empirical evidence favoring algorithmic trading over human trading
According to Hendershott and Riordan [12], high-frequency trading (HFT) has currently strongerpresence than any other trading strategy (discretionary trading included). The authors presenttwo main reasons to support this statement. First, HFT firms are just 2% of the 20,000 tradingfirms in the US but nevertheless they hold 73% of stock trading in the US and 40% in Europe.Second, in the German stock market (Deutsche Boerse), automated HFT dominates HumanHFT: algorithms count for more than 52% of total liquidity demand and 50% of total liquidityoffer.
Hendershott and Riordan also present empirical evidence that algorithmic traders are moreefficient than human traders. They monitored the German stock market and compared thebehavior of algorithmic and human traders. On Xetra, the electronic trading platform of theGerman stock market, they observed that algorithms and humans have different trading pat-terns:
• Algorithmic traders are more present in transactions of smaller size than humans and their
15

16
participation rate is decreasing in size.
• Human traders are more present in transactions of bigger size than algorithms and theirparticipation rate is increasing in size.
• Given an algorithmic order of very small size, there is a 48% probability that the tradethat follows will be very small and algorithm-generated as well.
Concerning the behavior of algorithmic traders in terms of liquidity and price discovery, theauthors found the following facts:
• Algorithmic traders improve the bid-ask spread: they are liquidity consumers when it ischeap (i.e. narrow spreads) and providers when it is expensive (i.e. big spreads). Moreover,they are within the spread more frequently than humans.
• Algorithmic traders contribute for 51% to price discovery whereas human contribute foronly 39%.
• Automated traders do not increase market volatility. All the opposite, they lower thevolatility by keeping steady the available liquidity level.
3.2 Algorithmic trading and its multiple faces
Let us describe the different types of algorithmic trading.
Systematic trading, also called automated trading, consists on adopting the same approachfor each trade, i.e. following a pre-determined set of rules to trade in a specific way. For ex-ample, we can fix entry or exit thresholds in order to start or stop trading. The rules behind asystematic trading algorithm can be simple or complex, but the nature is always the same : torepeat a given strategy over and over again.
In Quantitative trading, sometimes referred to as black-box trading, the trading rules areenforced by adopting propietary quantitative models. Such models are called black-boxes sincethey are closely guarded and only known by a few. Quantitative trading is sometimes confusedwith algorithmic trading. However, the former instigate trades whereas the latter merely exe-cute them. In consequence, the goals of quantitative trading are wider than those of systematictrading. Quantitative trading is considered the most scientific kind of trading because tradersbuild their own market models in order to define trading strategies. In consequence, quantitativetrading aims to make money because of a better understanding of markets, whereas discretionarytrading prefers a heuristic approach based on experience.
High frequency trading aims to take advantage of opportunities intraday. This kind oftrading is a specialized form of quantitative trading focussed on exploiting short term gains.Frequently, high frequency traders take relatively market neutral positions, i.e. a net exposureto market equal to zero, whose only goal is to profit from price discrepancies (i.e. market mi-crostructure). It is important to stress that high frequency traders need instant response to

17
market changes; in fact, the decision-making time in HFT is measured in milliseconds. This isthe main reason why they invest on huge computing power and on direct market access (e.g.they rent clusters next to the stock exchanges they trade).
Statistical arbitrage represents a systematic trading approach based on a fusion betweenreal-time and historical data analysis. The goal is to take advantage of the mispricing of financialinstruments while minimizing overall risk. Frequently, statistical arbitrage relies on black-boxstrategies based on innovative tools borrowed from Economics and Science, e.g. time series, datamining, artificial intelligence, agent-based models and fractals.
3.3 Basic bricks for algorithmic trading
There are hundreds of different trading algorithms available. However, we can decompose theminto a handful of basic algorithms regrouped in three main categories: impact-driven, cost-drivenand opportunistic.
3.3.1 Impact-driven algorithms
They aim to minimize market impact by slicing a big trading order into smaller child orders.The core impact-driven algorithms here are three: TWAP, VWAP and POV.
Time Weighted Average Price (TWAP) slices one big order of size X into N equal childorders of size X/N , which are uniformly traded during a pre-determined time horizon. Thismeans that each time-step a child order of size X/N is executed, independently of both marketand volume price. Since this trading algorithm is extremely predictable, common variation ofTWAP include small random perturbations of both the pre-determined trading times and childorder size to reduce detectability.
Volume Weighted Average Price (VWAP) corresponds to the overall turnover dividedby the total volume, hence large trades have more impact on the benchmark price than smallones. Unlike TWAP, when the only thing that matters is to trade regularly throughout the day,for VWAP we also need to trade in the right proportions, which are defined statistically follow-ing historical volume profiles. The performance of VWAP algorithms depends on how historicalvolume profiles are calculated and how well they forecast market volumes. In consequence, theyare vulnerable to sudden shifts in trading volume or liquidity.
Percent of Volume (POV) aims to trade a fixed percentage of the current market volume.Unlike TWAP or VWAP, where the trading pattern is predetermined, the trading schedulefor POV is dynamically determined. Since POV does not predict market volumes, commonvariations include historical analysis of volume profiles in order to anticipate upcoming tradingvolumes.

18
3.3.2 Cost-driven algorithms
They try to reduce the effect of overall transaction costs such as market impact and market risk.
Implementation Shortfall (IS) represents the difference between the price at which theinvestor decides to trade and the average execution price that is actually achieved, hence ISalgorithms strike the right balance between market impact and market risk. Frequently, IS al-gorithms trade most of the order at the beginning of the execution because prices are closest totheir benchmark. There are three optimization steps to do for IS algorithms. First, we deter-mine the optimal trading horizon, depending on the order size and historical market volumes.Second, we decide the trading schedule, e.g. the number of trades and the time between trades.Third, we determine the sizes of each one of the child trades.
The trading strategies of the following chapters are all IS algorithms. We will assume thatboth the optimal trading horizon and schedule are already determined, so we will only have toworry about the optimal slicing of the order.
Market Close (MC) is an algorithm used when the benchmark is the close price, as it isthe case of many trading firms. Since the bechmark is unknown until the end of the day, MCalgorithms will try to trade near the closing time. MC is the mirror of IS: just as IS algorithmsdetermine the optimal ending time, MC algorithms calculate the optimal starting time. Commonvariations of MC include a minimum (or maximum) order size allowed to participate in the closeauction.
3.3.3 Opportunistic algorithms
They seek to take advantage whenever market conditions (price, liquidity, volatility or anotherfactor) are favorable.
Price Inline (PI) algorithms are based on an impact-driven trading algorithm (e.g. VWAPor POV) to which they add a price adaptive functionality (i.e. a price sensitivity factor). PIalgorithms adapt their strategy to the market price in a similar way to how POV algorithmsadjust to market volume: they alter their trading pattern based on how does the market pricecompare to the benchmark. Common variations include aggressive or passive behaviors, de-pending on whether the participation rate is increased when prices are favorable or unfavorable,respectively. An aggressive strategy assumes that trends are short-lived and will soon revertwhereas passive strategies rely on the trend persisting. Therefore, the choice between aggressiveand passive relies on an a priori on the market behavior.
Liquidity-driven (LD) algorithms are the second-generation of simple rule-based orderrouting. The current world market is fragmented because there are several execution venuesthat compete with the traditional stock exchanges. In consequence, liquidity has become a cru-cial asset, and as such it must be tracked closely. LD algorithms aim to capture the liquidity assoon as it appears. In order to do so, LD algorithms follow in general two rules: First, they slice

19
the original order into small child orders that are sent to different execution venues. Second,they search hidden liquidity on each of the venues (e.g. iceberg or pegged orders). If the tradingconstraints imposed on a LD algorithm are too tight, there is a risk that the full order willnot be completely executed. In practice, LD algorithms have some finish-up logic that avoidsthis scenario. It is worth to mention that the original LD algorithms were designed for tradingilliquid assets, for which the signalling (i.e. informational) risk is a determinant factor.
Pair trading (PT), by far the basic tool for statistical arbitrage, consists on buying one as-set while simultaneously selling another. This strategy is market neutral because the risk on thelong side offsets the risk on the short side. However, this strategy only works if the two chosenassets are sufficiently correlated. PT assumes that the spread (i.e. the difference in prices) hasa mean-reverting behavior. When the spread crosses a threshold, a trading signal is activated:if the spread goes above the upper threshold we sell the spread, whereas if it goes below thelower threshold we buy the spread. We exit the position when the spread crosses the benchmark(see Figure 3.1). Traders use different statistical tools to determine the benckmark and theupper and lower thresholds. The simplest case is to choose the mean (or a moving average) asbenchmark, whereas the upper and lower thresholds are placed two standard deviations aboveor below the man, respectively.
Figure 3.1: Pair trading. When the spread leaves the stripe between the upper and lower thresholdwe enter the position, i.e. we trade the spread. We exit the position as soon as the spread coincideswith its mean, making a profit equal to half the stripe (double-headed arrows). This process is repeatedthroughout the day.
3.4 Building complex algorithms
Using the basic algorithms we have just described we can construct more complex algorithms.We will mention here three of the most common ones.

20
Portfolio trading, also known as basket or program trading, provides investors with thealternative to trade multiple assets in one go rather than trading them individually. This typeof trading is provided by brokers, who generally use automated trading in order to execute theorders. There are two main advantages for portfolio trading over trading single stocks. First,trading a whole basket of assets is more cost-effective than trading the assets individually. Sec-ond, a portfolio has a diversification effect that tends to decrease its volatility.
In the following chapters we study in more detail some of these portfolio trading strategies.They belong to the IS category because they aim to minimize the joint effect of market risk andmarket impact.
Multi-leg (ML) is the next level of complexity of pair trading. It consists on trading severalassets according to a benchmark price: we go long the undervalued assets and short the over-valued ones. They are widely used for term-structure arbitrage, i.e. we trade the same assetsbut with different maturities (e.g. bonds, futures and options). ML algorithms are also used forcarry trade (borrow at a low interest rate and deposit on a high one) and for trading specificoptional profiles (e.g. bull/bear spreads, collars, butterflies, condors, straddles and strangles).
Multi-asset (MA) algorithms started with derivatives trading. Derivatives depend on sev-eral factors such as underlying price, volatility, dividends, interest rates and time to maturity.Sometimes a trader wants to hedge the derivative, i.e. neutralize its sensitivity with respectto one of the factors. For example, Delta-hedging consists on trading a certain amount of theunderlying, which in the right proportions eliminates the sensibility of the option to changeson the underlying. There is also Vega-hedging (with respect to volatility), Rho-hedging (timeto maturity) and Gamma-hedging (big changes in the underlying), for which it is necessary toinclude other assets to the portfolio.
Investment banks used MA trading to hedge their positions, not only in vanilla derivativesbut also in structured products, which are a combination of cash and derivatives. Two examplesof these structured products are principal protected notes (bond + option) and equity linkednotes (corporate bond + option + credit default risk). Hedge funds and propietary trading desksare also interested in MA trading for cross-asset arbitrage. Some of the most used strategies areindex arbitrage (futures vs stocks), basis trading (futures vs bonds), option arbitrage (optionsvs stocks) and credit arbitrage (CDS or convertible bonds vs stocks).

Chapter 4
Optimal trading for Gaussian assetsand portfolios
As we have stressed in previous chapters, the performance of trading algorithms depends onhow well they process historical and real-time data and predict future market conditions. It istherefore evident that the accuracy of the forecasting model is of paramount importance.
As we mentioned before, when we trade we try to do so in an optimal way, i.e. minimizingsimultaneously our market impact and market risk. To achieve this goal under the frameworkof systematic trading strategies, we need to construct an algorithm with market data as inputsand trading sizes as outputs. In this chapter we will construct two models for ImplementationShortfall algorithms, for which we will assume that the assets follow a Gaussian diffusion.
4.1 Single assets
4.1.1 Model
We will suppose that all assets are Gaussian. More precisely, for any asset Sn where n = 1, . . . , Nare the trading times, we have
Sn+1 = Sn + σn+1εn+1, (4.1)
where σn > 0 for all n and (εn)1≤n≤N are i.i.d.1 Normal random variables of mean zero andvariance 1. Following Almgren and Chriss [1], we will model the market impact as a function hdepending on the average trading on each interval. More precisely, let
(ν1, . . . , νN ),N∑n=1
νn = 1
be the number of units we trade at each time n. Then our assumption is that, for any n,hn = h(νn).
1 Independent and identically distributed.
21

22
Under this framework, we can calculate the wealth process (i.e. the full trading revenueupon completion of all trades):
W =N∑n=1
δnνn(Sn + δnh(νn)), (4.2)
where δn = 1 if we buy at time n and δn = −1 if we sell. To simplify the analysis we will supposethat the trading strategy is long-only, i.e. δn = 1 for all n. We will also assume that the marketimpact function h is linear and piecewise constant. More precisely, we will suppose that
h(νn) = ησnνnVn
, η > 0, (4.3)
with Vn the historical volume of the asset at time n. It is worth to remark that in Almgren andChriss [1] the market impact is h(νn) = ηνn. However, in (4.3) we are assuming that the marketimpact is proportional to the volatility of the asset and inversely proportional to the availablevolume, as it is done in Lehalle [14].
Under these conditions, the wealth process (4.2) in its simplified form is
W =N∑n=1
νnSn + ηN∑n=1
σnVnν2n. (4.4)
In order to optimize (4.4) it is desirable to eliminate the dependence of W with respect tothe random process (Sn)1≤n≤N .
Using
Sn = S0 +n∑i=1
σiεi
we haveN∑n=1
νnSn =N∑n=1
νnS0 +N∑n=1
n∑i=1
νnσiεi.
However, a simple computation shows that
N∑n=1
n∑i=1
νnσiεi =N∑n=1
σnεn
(N∑i=n
νi
).
Therefore, if we define xn as the remaining quantity of asset to buy at time n, i.e.
xn =N∑i=n
νi, νn = xn − xn+1,
we obtain thatN∑n=1
νnSn = S0 +N∑n=1
σnεnxn.

23
In summary, (4.4) can be rewritten as a function of (x1, . . . , xn), i.e.
W (x1, . . . , xn) = S0 +N∑n=1
σnεnxn + ηN∑n=1
σnVn
(xn − xn+1)2. (4.5)
4.1.2 Optimization program
We compute the expectation and variance of the wealth process (4.5) as functions of xn,
E(W ) = S0 + ηN∑n=1
σnVn
(xn − xn+1)2, (4.6)
V(W ) =N∑n=1
x2nσ
2n.
Our goal is to find the trading strategy (x1, . . . , xN ) that minimizes the expected market costs,represented by the wealth process W , for a given level of risk aversion λ. Therefore, we have tominimize the cost functional
Jλ(x1, . . . , xN ) = E(W ) + λV(W )
= S0 + η
N∑n=1
σnVn
(xn − xn+1)2 + λ
N∑n=1
x2nσ
2n.
The partial derivative of Jλ with respect to xn is
∂Jλ∂xn
= −2ησn−1
Vn−1(xn−1 − xn) + 2η
σnVn
(xn − xn+1) + 2λσ2nxn. (4.7)
Let us compute the Hessian matrix of Jλ,
∂2
∂xn∂xmJλ =
2ησn−1/Vn−1 + 2ησn/Vn + 2λσ2
n if m = n,−2ησn−1/Vn−1 if m = n− 1,−2ησn/Vn if m = n+ 1,0 otherwise.
If η = 0 then the Hessian matrix of Jλ is diagonal and has positive eigenvalues, which impliesthat the unique critical point of Jλ is a global minimum. By continuity of the eigenvalues, if ηis small then all critical points of Jλ are still minima.
To find the minimum of Jλ we equate (4.7) to zero. We thus obtain the optimal tradingcurve as a solution to the recursive algorithm
xn+1 =(
1 +Dn−1
Dn+ λ
σ2n
Dn
)xn −
Dn−1
Dnxn−1 , Dn = η
σnVn
, (4.8)
under the constraints x0 = 1 and xN+1 = 0 (see Figure 1.3).

24
Figure 4.1: Optimal Trading curve. The curve describes the trading schedule that minimizes the jointeffect of market impact and market risk.
4.2 Multi-asset portfolios
This section generalizes the previous ideas to the case of multi-asset Gaussian portfolios.
4.2.1 Model
We will consider here N trading dates and a portfolio of K assets S = (S1, . . . , SK). For any nwe define the asset vector Sn = (S1
n, . . . , SKn ), whose dynamics is supposed to be Gaussian, i.e.
Sn+1 = Sn + En+1, (4.9)
where (En)1≤n≤N are i.i.d. K-dimensional Gaussian vectors with mean zero and covariancematrix Sn. Following Almgren and Chriss [1] again, we will model the market impact as afunction
hn = h(νkn),
where
(νk1 , . . . , νkN ),
N∑n=1
νkn = 1 for all k = 1, . . . ,K
are the number of units of asset k that are traded at time n. We define as before xkn as theremaining quantity of asset k to buy at time n, i.e.
xkn =N∑i=n
νkn, νkn = xkn − xkn+1.
Under this framework, we can calculate the wealth process (i.e. the full trading revenue uponcompletion of all trades):
W =K∑k=1
N∑n=1
δknνn(Skn + δknh(νkn)). (4.10)

25
As in the single-asset case we will suppose that δkn = 1 for all pairs (n, k) and that
h(νkn) = ηkσknν
kn
V kn
, ηk > 0, (4.11)
with σkn and V kn the volatility and the historical volume of the asset k at time n, respectively.
Repeating the arguments for the single-asset case it can be shown that the wealth process(4.12) in its simplified form is
W =K∑k=1
Sk0 +K∑k=1
N∑n=1
Eknxkn +K∑k=1
N∑n=1
ηkσknV kn
(xkn − xkn+1)2. (4.12)
4.2.2 Optimization program
Computing the expectation and the variance in (4.12) yields
E(W ) =K∑k=1
Sk0 +K∑k=1
N∑n=1
ηkσknV kn
(xn − xn+1)2, (4.13)
V(W ) =N∑n=1
x′nSnxn, xn = (x1n, . . . , x
Kn ).
We are looking for the strategy (x1, . . . ,xN ) that minimizes the cost functional
Jλ(x1, . . . ,xN ) = E(W ) + λV(W )
=K∑k=1
Sk0 +N∑n=1
(λx′nSnxn +
K∑k=1
ηkσknV kn
(xn − xn+1)2). (4.14)
As in the single-asset case, if ηk = 0 for all k = 1, . . . ,K then the unique critical point ofJλ is a minimum. In consequence, if the vector η = (η1, . . . , ηK) is sufficiently small then thecritical points of Jλ are still minima.
Notice that Jλ is a functional of the variables xkn. Therefore, in order to find its minimumwe have to solve the K ×N scalar equations
∂Jλ∂xkn
= 0, k = 1, . . . ,K n = 1, . . . N.
This is equivalent to solving the N vectorial equations for the corresponding gradients, i.e.
∂Jλ∂xn
= 0, n = 1, . . . N.
After some computations we obtain the recursive algorithm
xn+1 =(1 +D−1
n Dn−1 + λD−1n Sn
)xn −D−1
n Dn−1xn−1 , (4.15)

26
where Dn is the K ×K diagonal matrix with kth element
Dkn =ηkσknV kn
.
Therefore, the optimal trading curve solves the recursive algorithm (4.15) for (x1, . . . ,xN ) underthe constraints xk0 = 1 and xkN+1 = 0 for all k = 1, . . . ,K.
4.3 Balanced portfolios
We will study now a particular case of multi-asset Gaussian portfolio, the so-called balancedportfolio. Let us suppose that that there is a unique trading strategy
(ν1, . . . , νN ),N∑n=1
νn = 1, (4.16)
such that the trading schedule of any asset k is a constant multiple of it. More precisely, we willassume that for any k = 1, . . . ,K there exists πk > 0 such that
νkn = πkνn for all n = 1, . . . , N .
πk is thus the total number of shares of asset k to be traded. Under this framework we also have
xkn =N∑i=n
νki =N∑i=n
πkνi
= πkN∑i=n
νi = πkxn. (4.17)
Define π = (π1, . . . , πK). From (4.16) and (4.17) it follows that the wealth process (4.12) fora balanced portfolio takes the form
W =N∑n=1
Sn0 +N∑n=1
xn
(K∑k=1
Eknπk)
+N∑n=1
(xn − xn+1)2(
K∑k=1
ηk(πk)2σknV kn
),
whereas the cost functional (4.14) becomes
Jλ(x1, . . . , xN ) =K∑k=1
Sk0 + λN∑n=1
(xn)2(π′Snπ
)+
N∑n=1
(xn − xn+1)2(
K∑k=1
ηk(πk)2σknV kn
).
As we have already seen before, if η = (η1, . . . , ηK) is small then the minimum of Jλ exists.After some calculations it can be shown that the optimal trading curve (x1, . . . , xN ) solves therecursive algorithm
xn+1 =(
1 +Dπn−1
Dπn+ λ
π′Snπ
Dπn
)xn −
Dπn−1
Dπnxn−1 , Dπn =
K∑k=1
(πk)2ηkσknV kn
, (4.18)
under the constraints x1 = 1 and xN+1 = 0.

Chapter 5
Optimal trading for mean-revertingportfolios
In this chapter we will still assume that the assets still follow a Gaussian diffusion. However, wewill suppose that there exists a non-gaussian asset such that the corresponding portfolio has amean-reverting dynamics.
5.1 General mean-reverting portfolios
5.1.1 The model
We start with a multi-asset Gaussian portfolio S = (S1, . . . , SK) with dynamics
Sn+1 = Sn + En+1, n = 1, . . . , N
where (En)1≤n≤N are i.i.d. K-dimensional Gaussian vectors with covariance matrix Sn. Supposethat we decide to trade portfolio S in balanced mode and that there exists an asset A (withfinite standard deviation σA) such that the portfolio
Cn =K∑k=1
πkSkn +An
has a mean-reverting dynamics. We will assume that C follows an Ornstein-Uhlenbeck process,i.e.
dCt = γ(M − Ct)dt+ σdWt, (5.1)
where M is the mean. The speed parameter γ determines how fast does the process convergeto its mean. The discrete version of (5.3) is the so-called auto-regressive process of order one(AR(1)),
Cn+1 = Cn + γ(M − Cn) + σεn+1, (5.2)
where (εn)1≤n≤N are i.i.d normal random variables. For the sake of simplicity we will supposethat M = 0. Under this considerations, (5.2) becomes
Cn+1 = (1− γ)Cn + σεn+1. (5.3)
27

28
Finally, using induction on (5.3) yields
Cn = (1− γ)nC0 +n∑i=1
(1− γ)n−iσεi. (5.4)
5.1.2 Wealth process and optimization program
We normalize portfolio C, i.e.
Cn =K∑k=1
πk
mSkn +
1mAn, m =
K∑k=1
πk + 1,
and assume that portfolio C is balanced, i.e. for all n we have
νkn =πkνnm
k = 1, . . . ,K and νAn =νnm.
As in the previous chapter, we will suppose that the portfolio is long in all assets and thatthe market impact is
ηkσknν
kn
V kn
for asset Sk, k = 1, . . . ,K
ηAσAn ν
An
V An
for asset A.
We readily compute,
N∑n=1
νnCn =N∑n=1
νn
((1− γ)nC0 +
n∑i=1
(1− γ)n−iσεi
)
=N∑n=1
νn(1− γ)nC0 +N∑n=1
n∑i=1
νn(1− γ)n−iσεi
=N∑n=1
νn(1− γ)nC0 +N∑n=1
N∑i=n
νi(1− γ)i−nσεn
=N∑n=1
νn(1− γ)nC0 +N∑n=1
σεn
(N∑i=n
νi(1− γ)i−n)
and we find that the wealth process W takes the form
W =N∑n=1
νnm
(1− γ)nC0 +N∑n=1
σεnm
(N∑i=n
νi(1− γ)i−n)
+N∑n=1
bn(νn)2 , (5.5)
where
bn =1m2
(K∑k=1
ηk(πk)2σknV kn
+ ηAσAnV An
).

29
Unfortunately, the wealth process W (ν1, . . . , νN ) given in (5.5) does not admit a reducedrepresentation in terms of (x1, . . . , xN ), which implies that there is no explicit recursive algorithmfor the optimal trading curve. In consequence, in order to construct the optimal trading curve itis necessary find a minimum of the cost functional Jλ(ν1, . . . , νN ) via an optimization programin RN under the constraints
νn ≥ 0 for all n = 1, . . . , N andN∑n=1
νn = 1.
5.2 Simplified model
We would like to have some insight on the shape of the optimal trading curve for mean-revertingportfolio. For that purpose, let us consider a simplified mean-reverting model.
Recall the recursive form for Cn given in (5.4) and observe that it can also be expressed as
Cn = (1− γ)nC0 +n−1∑i=1
(1− γ)i−1σεn−i+1 . (5.6)
We propose a new portfolio process Cn satisfying
Cn = (1− γ)nC0 +n∑i=1
(1− γ)i−1σεi . (5.7)
Notice that our simplified model (5.7) is just the original AR(1) model given in (5.6) after apermutation on the normal random variables, i.e.
Cn ↔ Cn
εi ↔ εn−i+1 .
Unlike the full mean-reverting model, the new process (5.7) does admit a wealth process Wwith explicit dependence on (x1, . . . , xN ). Indeed,
N∑n=1
νnCn =N∑n=1
νn
((1− γ)nC0 +
n−1∑i=1
(1− γ)i−1σεi
)
=N∑n=1
νn(1− γ)nC0 +N∑n=1
n∑i=1
νn(1− γ)i−1σεi
=N∑n=1
νn(1− γ)nC0 +N∑n=1
N∑i=n
νi(1− γ)n−1σεn
=N∑n=1
νn(1− γ)nC0 +N∑n=1
(1− γ)n−1σεn
(N∑i=n
νi
)
=N∑n=1
νn(1− γ)nC0 +N∑n=1
(1− γ)n−1σεnxn .

30
We thus obtain that the wealth process is
W =N∑n=1
(xn − xn+1)m
(1− γ)nC0 +N∑n=1
xnm
(1− γ)n−1σnεn +N∑n=1
bn(xn − xn+1)2 , (5.8)
where
bn =1m2
(K∑k=1
ηk(πk)2σknV kn
+ ηAσAnV An
).
Computing the expectation and the variance of the wealth function W we obtain the costfunctional
Jλ(x1, . . . , xN ) =N∑n=1
C0
m(1− γ)n(xn − xn+1) + λ
N∑n=1
σ2
m2(1− γ)2n−2(xn)2 +
N∑n=1
bn(xn − xn+1)2.
(5.9)As we have already seen before, if η = (η1, . . . , ηK , ηA) is small enough then Jλ has a
minimum. In order to find this minimum, we compute the partial derivatives of Jλ,
∂Jλ∂xn
= −γ(1− γ)n−1C0 +2λm2
(1− γ)2n−2σ2xn + 2bn(xn − xn+1)− 2bn−1(xn−1 − xn) ,
and equate them to zero. We thus obtain the following recursive algorithm for the optimaltrading curve,
xn+1 = γ(1− γ)n−1Un +(1 + λ(1− γ)2n−2Zn +Bn
)xn −Bnxn−1, (5.10)
where
Un = − C0
2bnm, Zn =
σ2
bnm2, Bn =
bn−1
bn,
which has to be solved under the constraints x0 = 1, xN+1 = 0.
In Section 5.3 we will make a detour to the realm of differential equations in order to describea numerical method for solving recursive algorithms, called the shooting method. In Section5.4 we will program the shooting method in Matlab and construct the optimal trading curveassociated to the algorithm (5.10).
5.3 The shooting method
5.3.1 Description
Consider the initial-value problem
y′′ = g(y, y′); t ∈ [a, b], y(a) = A, y′(a) = α, (5.11)

31
where g is a bounded and differentiable function. According to the standard theory of OrdinaryDifferential Equations (ODE), the initial value problem (5.11) has a unique solution y(t).1
Now consider the boundary problem
y′′ = g(y, y′); t ∈ [a, b], y(a) = A ∈ R, y(b) = B ∈ R. (5.12)
It is not evident that (5.12) has a solution. However, we can try to translate the boundary prob-lem (5.12) into an initial-value problem of type (5.11), for which we know that solutions do exist.
The shooting method consists exactly in this translation. Given α ∈ R, the initial-valueproblem (5.11) has a solution y(t, α). To solve the boundary problem (5.12), we need to find α0
such that y(b;α0) = B. Roughly speaking, we are playing with the“ shooting angle” α in orderto “hit” B at t = b (see Figure 5.1).
Figure 5.1: The shooting method. Varying the “angle of shooting” α we can find the right angle α0
such that the curve y(t, α) that ”hits the target”, i.e. y(b;α0) = B.
In consequence, the boundary problem (5.12) reduces to find a zero of the function
F (α) = y(b, α)−B,
which can be solved using any numerical method, e.g. bisection or Newton (see Stoer and Bu-lirsch [22] for mode details).
The shooting method is also valid for systems of second-order ODEs. Indeed, the initial-valueproblem
y′′ = g(y,y′); t ∈ [a, b], y(a) = A ∈ RK , y′(a) = α ∈ RK ,
1 Strictly speaking, the solution y(t) only exists locally, but it is globally defined if g and all its partial derivativesare continuous and bounded. See Perko [20] for more details.

32
admits a unique solution y(t, α), which permits to define the functional
F (α) = y(b, α)−B.
5.3.2 Application to optimal trading curves
Suppose we have already found the optimal trading curve (x1, . . . , xN ) via a recursive algorithmof the form, i.e.
xn+1 = F (xn, xn−1) (5.13)
under the constraints x0 = 1 and xN+1 = 0. Using an induction argument it can be shown thatxn is a function of x0 and x1 for n ≥ 2. By induction we obtain that xN+1 is a function of x1,i.e.
xN+1 = F (x1),
because x0 has been already fixed to be equal to 1. If we define x1 = α then α is a free parameterthat completely determines the optimal trading curve. An important remark is that α can berelated to the the slope of the trading curve at x0 because
x1 − x0
1− 0= α− 1.
By considering α as the “slope” we can see an analogy of the optimal trading curve with theshooting method. Under this new framework, our optimization problem reduces to find a zeroof xN+1 = F (α), i.e. a number α0 such that F (α0) = 0.
The beauty of the analogy with the shooting method is that we are working with a 1-dimensional function F (x1) instead of the N -dimensional functional Jλ(x1, . . . , xN ). In conse-quence, using the shooting method we are always solving a 1D problem regardless of the numberof trades N . This fact renders our algorithm very appealing for high frequency trading.
In summary, the shooting method can be used to find optimal trading curves as long as theoptimization program admits a recursive algorithm of the form
xn+1 = F (xn,xn−1),
where x0 ∈ RK is given and xN+1 = (0, . . . , 0). This condition is rather general because it issatisfied by a large class of algorithms, e.g. single asset (4.8), balanced portfolio, multi-assetportfolio (4.15), (4.18) and simplified mean-reverting (5.10).
5.4 Numerical example using Matlab
We solved numerically the trading algorithm (5.10),
xn+1 = γ(1− γ)n−1U + (2 + λ(1− γ)2n−2)xn − xn−1,
with the constraints x0 = 1 and xN+1 = 0. We programmed the shooting method in Matlab forthe values U = 0.1, λ = 0.2 and N = 100. The free parameter α = x1 lies in [0, 1]. Since for any

33
γ ∈ (0, 1) we found that F (0) < 0 and F (1) > 0, we only need to construct a simple bisectionmethod (i.e. nested intervals) in order to find the zero of the function F .
Let us describe the bisection method we used:
• We start with the interval I1 = [0, 1] with F (0) < 0 and F (1) > 0.
• If F (1/2) > 0 then we choose the interval I2 = [0, 1/2] because F changes sign inside. IfF (1/2) < 0 then the sign changes in I2 = [1/2, 1]
• Given the interval Ij = [aj , bj ] with F (aj) < 0 and F (bj) > 0, define r = (aj + bj)/2,i.e. the mid-point of Ij . If F (r) > 0 then define Ij+1 = [aj , r], whereas if F (r) < 0 thenIj+1 = [r, bj ].
• Proceeding this way we can find α0 such that F (α0) = 0.
• The optimal trading curve is now completely determined using x0 = 1 and x1 = α0. Noticethat by construction we necessarily have xN+1 = 0.
Figure 5.2: Optimal trading curves as a function of the speed parameter γ.
The graph of the optimal trading curve for three different values of γ is given in Figure 5.2.From the shape of the curves we can infer the following facts:
• For big γ (e.g. γ = 0.80) the mean-reverting process is stronger than the diffusion process.Therefore, we are only minimizing the market impact, which implies that the tradingstrategy looks like the a straight line.

34
• However, for small γ (e.g. γ = 0.15) the mean-reverting process is almost inexistent, i.e.we have only a diffusion process. Hence, the optimal strategy is to trade more at thebeginning of the execution in order to minimize the market risk.
In the graph of the trading curve with γ = 0.15 we can see that there are two distinct tradingpatterns:
• At the beginning of the execution we minimize the market risk by trading as fast aspossible. At n = 15 we have already executed 70% of the order.
• For the rest of the execution (i.e. the remaining 85 trades) we minimize the market impactby trading the remaining 30% of the portfolio as slow as possible.
When we switch from a trading pattern to the other, the amount of shares x remaining in theportfolio is an increasing function of γ: if γ is small then x is small, and vice-versa. This two-foldpattern is also visible for γ = 0.40, but when γ → 1 the market risk disappears and we haveonly the trading pattern that minimizes market impact. Such a behavior was to be expectedfrom a dynamics similar to an Ornstein-Uhlenbeck process because for short times the leadingterm is of order
√t, i.e. the diffusion term σdWt, whereas for large times the leading term is of
order t, i.e. the drift term γ(M − Ct)dt, which in the long run converges to the mean M .

Chapter 6
Conclusions
6.1 Optimal trading curves
6.1.1 Recursive algorithms and shooting method
As we have shown, the theoretical framework for optimal trading curves is analogue to the effi-cient frontier, which is one of core results of Modern Portfolio Theory (MPT) and Capital AssetPricing Model (CAPM). The idea of the efficient frontier comes from the fact that investorswant to maximize his return given a risk budget, or equivalently to minimize his risk given atarget or fixed return.
In this work we explicitly computed the optimal trading curves for single assets and portfo-lios. Moreover, they are algebraic and have a nice graphic interpretation in terms of the tradingschedule of the portfolio, which grants flexibility to the trader and lets him monitor the execu-tion of his trading schedule at all times, so he can adjust the parameters on the run if necessary.The same approach holds for other trading strategies, and could also be applied for other marketmodels.
We have used the shooting method, a well-known numerical technique in differential equa-tions, to solve the optimization of the trading curve. With this technique we can find optimaltrading curve as long as the optimization program admits an explicit recursive algorithm of theform
xn+1 = F (xn,xn−1),
where x0 is given and xN+1 = (0, . . . , 0).
6.1.2 Dynamic programming and optimal control
If a recursive algorithm is not possible, we have to try a different approach. Our first suggestionis the method of dynamic programming.
Several problems in Finance and Economics involve the maximization of a utility function (orthe minimization of a cost/hedging function) under some constraints. When the functions are
35

36
deterministic the optimization program is easily achieved using Lagrange multipliers as before;however, if the utility function depends explicitly on stochastic processes we need to maximizeit over a certain range of possible choices (called controls).
In the Black-Scholes framework, there is a unique hedging strategy, which leads to a lin-ear partial differential equation (PDE). In practice, however, there are cases where the hedgingstrategy is not unique and other where it does not even exist. In those non-Black-Scholes scenar-ios we end up dealing with more complicated PDEs, either nonlinear equations or inequalities,which solutions (called viscosity solutions) can only be found numerically (see Evans [8]).
The application of the dynamic programming principle in Bouchard et al [4] involves stochas-tic targeting, where the admissible controls satisfy some given constraints (e.g. a fixed numberof trades, a maximum/minimum level of volume per trade and/or fixed trading dates). Thisleads to complicated but fascinating mathematics, which is currently a fertile ground of research.
6.1.3 Nonlinear transaction costs
In the seminal work of Almgren and Chriss [1], the liquidity cost per share traded is a linearfunction of trading rate or of block size, and that the only source of uncertainty in executionis the volatility of the underlying asset. Researchers are currently looking for more complextransaction cost functions. Almgren [2] proposed nonlinear transaction cost functions, wheremarket impact cost per share are a power law function of the trading rate. Almgren et al [3]analyzed real data and found that market impact is a power law of exponent 3/5 of block size,with specific dependence on trade duration, daily volume and volatility.
For the reader interested in these nonlinear models for transaction costs we suggest to startwith Bouchaud and Potters [7], Almgren et al [3] and the references therein.
6.2 Normal returns vs real returns: stylized facts
According to the Efficient Market Theory (EMT), the future states of world markets and theirrespective probabilities are known. In other words, the distribution of prices at any time isknown by all and every agent. However, instead of estimating the distribution directly fromthe empirical data, the mainstream economic theory supposes a priori that the distribution is(log)normal. This is scientifically wrong because it is the facts that determine the models, notvice versa.
After studying carefully the real distributions of financial returns, the empirical evidenceshows that, despite the heterogeneity of the assets (commodities, fixed income, foreign exchange,equities, credit), they all share the same properties. These pattern are very recurrent, almostubiquitous, and they appear regardless of the time-scale of the returns (intra-day, week, month,year). For all these reasons, the distinctive characteristics of real returns have been elevated tothe status of facts: they are called stylized facts (Embrechts et al [19]).

37
The real distribution of any financial assets has the following stylized facts, as it is shown inEmbrechts et al [19] and Veredas [23] :
• It is approximately symmetric.
• It has fat tails, i.e. extreme returns are more likely to happen that the normal theorywould forecast.
• It has a high peak (i.e. leptokurtic).
• There is weak autocorrelation between the returns for different days, i.e. conditionalexpected returns are close to zero.
• There is a high autocorrelation in the fluctuations of returns, i.e. in the absolute value ofsquare returns.
• Volatility varies over time and presents clustering patterns, i.e. there are periods of highvolatility and others of low volatility.
6.3 Some alternative models in Economics and Finance
It is important to remark that a normal distribution does not satisfy any of these properties.Therefore, it is necessary to use more accurate distributions to approach real financial mar-kets. There are several models that are becoming serious alternatives to the (flawed) normaldistribution.
6.3.1 GARCH
We want to to take into account the stylized facts, but perhaps we do not want to abandoncompletely the idea of normal returns. In that case we could suppose a normal distribution, noton the unconditional returns but on the conditional ones, and that the volatility at a given timedepends on past volatilities and returns. A natural step forward is the GARCH (GeneralizedAutoregressive Conditional Heteroskedasticity) model, published by Robert F. Engle in 1982.1
Suppose that today is time t and that the information available is up to yesterday, i.e. Ft−1.We will assume that the conditional returns today rt|Ft−1 are normal, and that today’s volatilityt depends on the volatility and return levels of yesterday, i.e.
rt|Ft−1 ∼ N(µ, ht),ht|Ft−1 = h(rt−1, ht−1).
More precisely, the conditional returns and volatility have the form
rt = µ+ h1/2t−1zt, zt ∼ N(0, 1) i.i.d. (6.1)
ht = ω + α(rt−1 − µ)2 + βht−1 .
1 Robert F. Engle won the Nobel prize in Economics in 2003 for his GARCH model.

38
Model (6.1) satisfies all the stylized facts : returns are not autocorrelated yet they are not in-dependent, there is volatility clustering and the unconditional GARCH distribution has morekurtosis than the normal distribution.
There are several generalizations of the GARCH model :
• Asymmetric versions of GARCH : they have non-zero skewness.
• GARCH(p, q) : The conditional volatility depends on several past levels of volatility andreturns :
rt = µ+ h1/2t−1zt, zt ∼ N(0, 1) i.i.d. (6.2)
ht = ω +q∑i=1
αi(rt−i − µ)2 +p∑j=1
βjht−j .
6.3.2 Levy distributions
The tails of a Gaussian distribution decay exponentially fast :
N(x) ∼x→±∞
exp(−x2
).
Therefore, any distribution whose tails decay slower is a good candidate for a fat tail modeling.In that sense, Levy (also called Pareto) distributions are a natural choice because they decayfollowing a power-law (see e.g. Bouchaud and Potters [7]) :
Lµ(x) ∼x→±∞
µAµ±|x|1+µ
, 0 < µ < 2, Aµ± > 0.
Some Levy distributions carry an asymmetry parameter β that measures the relative weight ofthe positive and negative tails. Since in the limit µ = 2 we recover the Gaussian distribution,Levy distributions are generalizations of normal distributions. However, their tails are a bit toofat: for µ < 2 the variance is infinite and for µ ≤ 1 even the mean is infinite. In order to overcomethis problem we can use a truncated Levy distribution, which is Levy in an intermediate regime|x| << +∞ and exponential at the tails (hence still fatter than the Gaussian) :
P (x) ∼x→±∞
exp(−α|x|), α > 0
This allows to have finite moments of all order, and in particular the most useful ones in Finance :first (the mean), second (variance), third (skewness) and fourth (kurtosis).
6.3.3 Student distributions
Besides truncated Levy distributions, Student distributions are also compatible with the stylizedfacts,
Sν(x) = c(ν)[1 +
x2
ν
]−(1+ν)/2
, 1 ≤ ν < +∞,

39
where c(ν) is a normalizing constant. A remarkable property of the Student distribution isthat the parameter ν determines the tail behavior : the tails got heavier as ν decreases. Sincein the limit ν → +∞ the distribution Sµ(x) tends towards the normal, Student distributionsare generalizations of Gaussian distributions. Moreover, unlike the pure Levy distributions, theparameter ν can be chosen such that the real distribution and the Student one have exactlythe same finite (resp. inifinte) moments (see Bouchard and Potters [7]). Using the Studentdistribution we can construct a non-Gaussian GARCH model, where the residuals are no longerGaussian but Student :
rt = µ+ h1/2t−1zt, zt ∼ Student(0, 1, ν) i.i.d. (6.3)
ht = ω + α(rt−1 − µ)2 + βht−1 .
6.3.4 Fractional Brownian motion
One of the properties of the Brownian motion B (i.e. normal increments) is that they areproportional to the square root of the time step, i.e.
B(t)−B(s) ∝ |t− s|1/2.
The fractional Brownian motion BH of Hurst exponent H ∈ (0, 1) is a generalization of thisfact :
BH(t)−BH(s) ∝ |t− s|H .
The process BH possess the following properties (Bouchaud and Potters [7] and Mandelbrot[18]) :
• If H = 1/2 the returns are not correlated and BH is the Brownian motion (also calledwhite noise).
• If H > 1/2 the returns are positively correlated ( and the process is called red noise).
• If H < 1/2 the returns are negatively correlated (blue noise).
Mandelbrot [18] reckons that there are a lot of financial assets whose returns are positivelycorrelated (e.g. Apple). This fact is a flagrant violation of the EMT, which cannot explain thephenomenon. Other phenomena outside the scope of the EMT (yet always present in financialmarkets) are bubbles, crashes, herd behavior and long-run trends.
6.3.5 Multifractal Models
According to Mandelbrot [18], trading time is relative: there are periods of high market activitywhen news do not stop arriving and prices change very rapidly, but there are also periods ofvery few market activity when prices are rather quiet and news are scarce (see Mandelbrot [18]).A multifractal model can be constructed as a mix of two fractals : a fractal mother determiningthe dynamics of market prices and a fractal father representing the trading time relativity.Mandelbrot’s choice for the fractal mother and father is the fractional Brownian Motion, whoseHurst exponents can be calibrated using market data. The main feature of multifractals is

40
that, unlike fractional Brownian motion and classical fractals, they are not scale-invariant byconstruction. In consequence, short-term and long-term behaviors are different. This is crucialfor understanding the dynamics of real markets and microstructure effects in trading patterns.
6.3.6 Adaptive markets and agent-based models
A very clever way to think about Economics in general and financial markets in particularis borrowed from the Theory of Eolution. Andrew Lo and Doyne Farmer [9], [17] considerthat we should be looking at financial markets from a biological perspective, i.e. within anevolutionary point of view. In their opinion, markets, instruments and participants interact andevolve dynamically according to the “law” of Economic Selection (i.e. the equivalent to NaturalSelection). Financial agents compete, learn and adapt, but not necessarily in an optimal fashion(there is asymmetry of information and emotions that bias the decision-making process of eachindividual). When market condition change, new trading strategies emerge and replace the oldones that are obsolete for the current context. Eventually, the new strategies will in turn becomeobsolete and be replaced; and the evolutionary cycle will continue ad infinitum.
6.4 Taking a stand: quantitative vs discretionary trading
There is an interesting debate between quantitative and discretionary traders. There are severalseminars and discussion groups on the topic in universities, financial firms and the Internet.The idea of technology eventually replacing humans is very recurrent in every field. In trading,however, it is not far from reality because trading floors and brokers are becoming electronicand automated.
I would like to draw the reader’s attention to the online announcement for a seminar on quan-titative trading that will be held next autumn in Paris, France (Quant Invest 2010, November29 - December 10) :
“Manager vs Machine :
The investment universe is densely populated with skilled managers all hunting forelusive alpha. Amongst these managers a new breed is emerging: Generation Q -the investment managers that are backed by an arsenal of quantitative techniquesand strategies that consistently give them the edge over others in the market.
Quantitative managers take a scientific approach to financial markets, stripping hu-man emotions such as fear and greed out of the equation. Instinct and intuition playlittle part in strategies that employ immense computing power.
The disciplined process that underpins quantitative investment strategies means thatwhile the models themselves are complex the investment philosophy of a quantitativemanager is highly transparent.”
As long as the market in question is electronic and liquid, quantitative approaches are betterpositioned to capture short-living profit opportunities. Indeed, some of the most sophisticated

41
algorithms can monitor several hundreds of variables simultaneously, hence they beat any hu-man trader in terms of reactivity and accuracy. However, there is a strong point supportinghuman trading. When markets are illiquid and/or OTC (as it is the case for credit derivativessuch as CDS), human traders are necessary because prices and volumes are negotiated directlywith dealers and market makers. Moreover, a trader has to anticipate the impact of news onthe course of equities and credit spreads, which is not easy to quantify. Nevertheless, in order tobuild up a profitable trading book, any trader has to rely on some quantitative signals, modelsand forecasts of volatility, correlation, volume, market impact, transaction costs, spreads, etc.Indeed, there are a lot of players in the marked nowadays, which means that simple rules ofthumb and easy profitable opportunities do not longer exist. In addition, the current trend inFinance favors the homogenization of OTC markets via clearing houses and standard products.This could eventually lead to more liquid credit markets, thus opening the gate for algorithmictrading.
In my opinion, all market participants will eventually become quantitative to a higher orlesser extent. The only ones that can be spared from the trend are long-term investors, but theywill put their money in the hands of managers relying on quantitative signals and/or algorithms.
6.5 A final thought: how would be the trader of the future?
My personal opinion is that algorithms will substitute humans in the execution processes. Bro-kers are becoming more electronic and automated, and the trend will continue to widespread inthe whole financial industry. My bet is that the ”trader of the future” will be less operationaland more intellectual: he will be less involved in eye-blinking reactivity of buy-sell gunfire typeand much more involved in thinking, e.g. calibrating his algorithms on the run and creatingnew automated strategies. Therefore, human traders are not disappearing, they will just evolveand become more tech-friendly.
Let me try to explain better what I mean with“on the run”. I am thinking on a semi-automated kind of trading, as in the following examples :
• An algorithm that can be easily adapted, e.g. changing the knock-in or knock-out thresh-olds at any time.
• An algorithm that you can switch off in order to trade by yourself for a while becausethere is new information coming and the AI will not be able to incorporate. After theopportunity is gone you turn the switch the algorithm on again.
It is like an airplane: when there is turbulence the human pilot takes full control, but in generalhe only monitors the automatic pilot. In the short run we will only have the sophisticatedversion of old trading style, but eventually the “rules of thumb” will be less and less usefuldue to automated trading, which is faster and more accurate when dealing with empirical rules.Therefore, I believe, in the long run humans will not be involved in trade-by-trade decisionmaking, except in rare and profitable occasions when there is a need of inspiration, and muchmore involved in programming and calibrating algorithms.

Bibliography
[1] Robert Almgren, Neil Chriss, Optimal execution of portfolio transactions. Journal of Risk,Vol. 3, No. 2, 2010, pp. 5-39.
[2] Robert Almgren, Optimal execution with nonlinear impact functions and trading-enhancedrisk. Applied Mathematical Finance 10, pp. 1-18.
[3] Robert Almgren, Chee Thum, Emmanuel Hauptman, Hong Li, Equity market impact. Risk,July 2005, pp. 57-62.
[4] Bruno Bouchard, Ngoc-Minh Dang and Charles-Albert Lehalle, Optimal control of tradingalgorithms: a general impulse control approach. Preprint.
[5] Jean-Philippe Bouchaud, Economics needs a scientific revolution. Nature, Vol. 45, p. 30,October 2008.
[6] Jean-Philippe Bouchaud, The (unfortunate) complexity of the economy. Physics World,April 2009.
[7] Jean-Philippe Bouchaud, Marc Potters, Theory of financial risk and derivative pricing, 2nd.edition, Cambridge, 2003.
[8] Laurence C. Evans, An introduction to mathematical optimal control theory. Course notes,University of California, Berkeley, 2010.
[9] J. Doyne Farmer, Andrew W. Lo, Frontiers of finance: Evolution and efficient markets.Proc. Natl. Acad. Sci. USA, Vol. 96, pp. 9991-9992, August 1999.
[10] Carole Gresse, Evaluation d’actifs. Course notes, University Paris-Dauphine, 2010.
[11] Larry Harris, Trading and exchanges : market microstructure for practitionners. OxfordUniversity Press, 2002.
[12] Terrence Hendershott, Ryan Riordan, Algorithmic Trading and Information. Working paperSSRN, September 2009.
[13] Barry Johnson, Algorithmic trading and DMA. 4Myeloma Press, USA, 2010.
[14] Charles-Albert Lehalle, Rigorous strategic trading : balanced portfolio and mean reversion.Journal of Trading, Summer 2009, pp. 40-46.
42

BIBLIOGRAPHY 43
[15] Charles-Albert Lehalle, Mathieu Rosenbaum, Trading haute frequence. Course notes, EN-SAE, 2010.
[16] Francois-Serge Lhabitant, Handbook of hedge funds. John Wiley and Sons, 2006.
[17] Andrew W. Lo, The Adaptive Market Hypothesis. The Journal of Portfolio Management,30th anniversary issue, pp. 15-29, 2004.
[18] Benoıt Mandelbrot, The (mis)behaviour of markets. Profile Books, 2008.
[19] Alexander J. McNeil, Rudiger Frey, Paul Embrechts, Quantitative Risk Management: Con-cepts, Techniques, and Tools. Princeton University Press, 2005.
[20] Laurence Perko, Differential equations and dynamical systems. Springer, USA, 2001.
[21] Fabrice Riva, Microstructure des marches financiers. Course notes, University Paris-Dauphine, 2010.
[22] Josef Stoer, Roland Bulirsch, Introduction to numerical analysis. Springer, USA, 1983.
[23] David Veredas, Financial time series. Course notes, University Paris-Dauphine, 2010.