
Optical Remote Continuous Sens ing of Intraocular...
8
Optical Remote Continuous Sensing of Intraocular Pressure Variations Yevgeny Beiderman 1 , Alon Skaat 2 , Michael Belkin 2 , Ralf-Peter Tornow 3 , Vicente Mico 4 , Javier Garcia 4 and Zeev Zalevsky 1,5* 1 Faculty of Engineering, Bar-Ilan University, Ramat-Gan 52900, Israel 2 Goldshleger Eye Research Institute, Tel-Aviv University, Tel-Hashomer, Israel 3 Augenklini, Schwabachanlage 6, 91054 Erlangen, Germany 4 Departamento de Óptica, Universitat de València, C/Doctor Moliner 50, 46100 Burjassot, Spain 5 Erlangen Graduate School in Advanced Optical Technologies (SAOT), Friedrich-Alexander Universität Erlangen-Nürnberg, Paul-Gordan-Straße 6, 91052 Erlangen, Germany ABSTRACT We present the first steps of a new measurement principle for high-precision non-contact remote and continuous monitoring of intra-ocular pressure. A photonic device involving a fast camera and a laser is presented and tested in rabbit’s eyes for continuous remote monitoring of the intra-ocular pressure. The device is based on tracking the secondary speckle patterns trajectories produced by reflection of an illuminating laser beam from the iris or the sclera. The rabbit’s eyes were stimulated with increasing and decreasing ramps of intra-ocular pressure. Data from the photonic device were correlated with the induced intra-ocular pressure as consequence of the infusion bag elevation variations. The measurements show a good correlation and sensitivity of the proposed device with intra-ocular pressure changes while providing a high precision measurement (5% estimated error) for the best experimental configuration. Keywords: Intraocular pressure, Speckle; Remote monitoring 1. INTRODUCTION Glaucoma, the second most common blinding disease in the industrial world and the most common one in Asia, is caused by increased intra-ocular pressure (IOP) and which eventually may lead to an irreversible damage to the optic nerves and retinal fibers, to malformation or malfunction of the eye’s drainage structures resulting with permanent loss of vision [1,2]. Furthermore, the only effective method to treat glaucoma is to reduce the IOP medically or surgically. Inordinate increase in IOP is mostly caused by progressive disturbances in the absorption of the aqueous humor (the fluid circulating in the anterior part of the eye). The IOP is dynamic, rising and falling from minute to minute as muscle tone and physiologic states of the subject changes [3,4]. Thus, the accurate monitoring of IOP is an essential clinical facet in glaucoma care. Although many clinical decisions are based on IOP, the measurement of IOP is usually performed a few times during a day providing reduced information about how IOP behaves. The most commonly used ophthalmic device for measuring IOP, and current gold standard, is called applanation tonometer [5]. It is based on the assumption that the eye is a perfect sphere. Thus, the force required to achieve a fixed degree of applanation (3.06 mm in diameter) when the tonometer head directly applanates the cornea is converted into millimetres of mercury (mmHg) providing the IOP resisting this deformation. Despite of its accuracy and precision [6], Goldmann tonometry mainly suffers from inter- individual variations due to difference in corneal thickness and rigidity while being an invasive (contact) technique with limitations for monitoring the IOP over time. Note also that this standard method, which involves touching the cornea, also consequently necessitates the use of anesthetic eye drops. As alternative, one can measure the area of applanation when a given constant force is applied to the eye. This can be accomplished, for instance, by blowing from a given distance with a standard blast of air into the eye and measuring the applanation area of the cornea [7]. Using this procedure, the contact in the measurement is avoided but the technique still remains unpractical for monitoring IOP at large periods of time, that is, it fails when identifying peaks and IOP variations. Ophthalmic Technologies XXII, edited by Fabrice Manns, Per G. Söderberg, Arthur Ho, Proc. of SPIE Vol. 8209, 820908 · © 2012 SPIE · CCC code: 1605-7422/12/$18 · doi: 10.1117/12.905857 Proc. of SPIE Vol. 8209 820908-1 Downloaded from SPIE Digital Library on 07 Jun 2012 to 212.193.41.137. Terms of Use: http://spiedl.org/terms
Transcript of Optical Remote Continuous Sens ing of Intraocular...
Optical Remote Continuous Sensing of Intraocular Pressure Variations
Yevgeny Beiderman1, Alon Skaat2, Michael Belkin2, Ralf-Peter Tornow3, Vicente Mico4, Javier
Garcia4 and Zeev Zalevsky1,5*
1Faculty of Engineering, Bar-Ilan University, Ramat-Gan 52900, Israel 2Goldshleger Eye Research Institute, Tel-Aviv University, Tel-Hashomer, Israel
3Augenklini, Schwabachanlage 6, 91054 Erlangen, Germany 4Departamento de Óptica, Universitat de València, C/Doctor Moliner 50, 46100 Burjassot, Spain
5Erlangen Graduate School in Advanced Optical Technologies (SAOT), Friedrich-Alexander Universität Erlangen-Nürnberg, Paul-Gordan-Straße 6, 91052 Erlangen, Germany
ABSTRACT
We present the first steps of a new measurement principle for high-precision non-contact remote and continuous monitoring of intra-ocular pressure. A photonic device involving a fast camera and a laser is presented and tested in rabbit’s eyes for continuous remote monitoring of the intra-ocular pressure. The device is based on tracking the secondary speckle patterns trajectories produced by reflection of an illuminating laser beam from the iris or the sclera. The rabbit’s eyes were stimulated with increasing and decreasing ramps of intra-ocular pressure. Data from the photonic device were correlated with the induced intra-ocular pressure as consequence of the infusion bag elevation variations. The measurements show a good correlation and sensitivity of the proposed device with intra-ocular pressure changes while providing a high precision measurement (5% estimated error) for the best experimental configuration.
Keywords: Intraocular pressure, Speckle; Remote monitoring
1. INTRODUCTION Glaucoma, the second most common blinding disease in the industrial world and the most common one in Asia, is caused by increased intra-ocular pressure (IOP) and which eventually may lead to an irreversible damage to the optic nerves and retinal fibers, to malformation or malfunction of the eye’s drainage structures resulting with permanent loss of vision [1,2]. Furthermore, the only effective method to treat glaucoma is to reduce the IOP medically or surgically. Inordinate increase in IOP is mostly caused by progressive disturbances in the absorption of the aqueous humor (the fluid circulating in the anterior part of the eye). The IOP is dynamic, rising and falling from minute to minute as muscle tone and physiologic states of the subject changes [3,4]. Thus, the accurate monitoring of IOP is an essential clinical facet in glaucoma care.
Although many clinical decisions are based on IOP, the measurement of IOP is usually performed a few times during a day providing reduced information about how IOP behaves. The most commonly used ophthalmic device for measuring IOP, and current gold standard, is called applanation tonometer [5]. It is based on the assumption that the eye is a perfect sphere. Thus, the force required to achieve a fixed degree of applanation (3.06 mm in diameter) when the tonometer head directly applanates the cornea is converted into millimetres of mercury (mmHg) providing the IOP resisting this deformation. Despite of its accuracy and precision [6], Goldmann tonometry mainly suffers from inter-individual variations due to difference in corneal thickness and rigidity while being an invasive (contact) technique with limitations for monitoring the IOP over time. Note also that this standard method, which involves touching the cornea, also consequently necessitates the use of anesthetic eye drops. As alternative, one can measure the area of applanation when a given constant force is applied to the eye. This can be accomplished, for instance, by blowing from a given distance with a standard blast of air into the eye and measuring the applanation area of the cornea [7]. Using this procedure, the contact in the measurement is avoided but the technique still remains unpractical for monitoring IOP at large periods of time, that is, it fails when identifying peaks and IOP variations.
Ophthalmic Technologies XXII, edited by Fabrice Manns, Per G. Söderberg, Arthur Ho, Proc. of SPIE Vol. 8209, 820908 · © 2012 SPIE · CCC code: 1605-7422/12/$18 · doi: 10.1117/12.905857
Proc. of SPIE Vol. 8209 820908-1
Downloaded from SPIE Digital Library on 07 Jun 2012 to 212.193.41.137. Terms of Use: http://spiedl.org/terms
This single measurement working principle of classical tonometers has encouraged researchers to develop new ways of continuous IOP monitoring. Some examples are the use of sensing contact lenses [8,9], some sort of implants with telemetric pressure transducers [10-13] and devices based on optical principles [14-17].
Recently, a special configuration based upon usage of reflected secondary speckle pattern was demonstrated for “hearing” remote speech signals and extraction of heart beats [18,19] as well as for remote estimation of blood pulse pressure [20] and glucose concentration [21]. In the current study, we apply our photonic sensor to validate proof of principle for the usage of this novel measurement concept for remote and non-invasive continuous monitoring of IOP.
2. MATERIALS AND METHODS Animals
The experimental setup involved anesthetized rabbits with an infusion set connected to the vitreous cavity of their eyes via a 25 gauge needle in order to control their IOP by raising or lowering the infusion bag in respect to the position of the inspected rabbit. The animal was anesthetized by ketamine (40mg/kg) and xylazine (8mg/kg). The needle used was a 25 gangue anterior chamber maintainer. The needle was inserted into anterior chamber and fixated so as not to touch the cornea, lens or iris.
Experimental setup
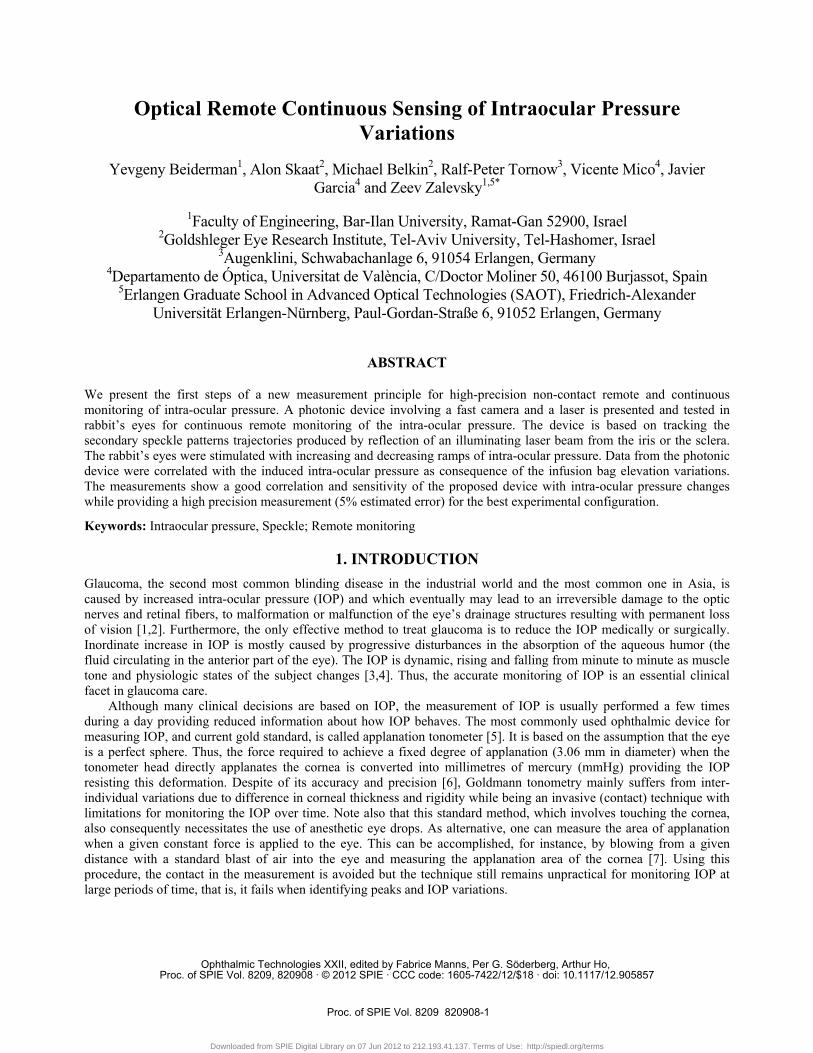
The optically based monitoring device was positioned at range of about 50cm from the rabbit’s eye. An image of the experimental configuration can be seen in Fig. 1. The system involves only a fast camera and a laser. The system monitors the secondary speckle patterns generated due to reflection from the rabbit’s iris and tracks the trajectory of their movement. In the experiments, we used the second harmonic of a CW (continuous) Nd:YAG laser (wavelength of 532nm) for illuminating the iris of the rabbit and the reflections were analyzed using fast digital camera called “PixelLink” B-771. Note that the same measurement can be done with eye safe laser at wavelength of 1550nm and with camera sensitive to this infra-red wavelength.
Fig. 1: The proposed experimental configuration for remote continuous monitoring of the IOP.
Underlying principle of the proposed method for IOP monitoring
To obtain remote estimation of IOP, not only the temporal frequency of the movement of the iris/sclera reflected speckle pattern is analyzed but also the amplitude of the movement. The key point of our monitoring device is not to focus the camera on the inspected surface but rather to have the camera focused on the far or close field such that the object itself is defocused. Thus, the movement of the object (its vibrations) causes a lateral shift of the self generated secondary speckle patterns. Actually due to this defocusing, the movement of the object instead of constantly changing
Proc. of SPIE Vol. 8209 820908-2
Downloaded from SPIE Digital Library on 07 Jun 2012 to 212.193.41.137. Terms of Use: http://spiedl.org/terms

the speckle pattern creates a situation in which we see the same speckle pattern which is only moving or vibrating in the transversal plane. This is very important feature since it allows, by tracking the maxima intensity spots, the extraction of the trajectory of the movement. Actually the relative shift of speckle pattern due to the displacement of the reflecting surface (iris or sclera in our case) can be estimated as [20]
4 tan 4π α παβ
λ λ= ≈ (1)
where β is proportional to the relative shift of the speckle pattern, α is the tilting angle of the iris/sclera and λ is the optical wavelength. Assuming that the change in the angle is small enough, we obtain a linear proportion between the relative shift and the angle of tilting.
In this study, we show that using information incoming from both the relative shift of the speckle pattern as well as its amplitude change, that is, the temporal variation of β(t), it is possible to track temporal changes of the IOP.
Our basic assumption in this paper, which we basically proved before for the blood artery of the wrist [20], is that the blood pressure in the blood vessels in the retina affects the movement of the sclera/iris in a way that is correlated to the IOP, i.e. the sclera/iris slightly pulsates due to the blood supply to the eye. This movement, although being very small, can be detected by our speckle based measurement since the movement precision that our technique can allow is in the nanometric scale [22]. In it is important to emphasis that what we try to measure is not the movements of the iris or the eye. Those movements are actually non desired movements for our system and we aim to filter them out by doing the measurement over sufficiently short time scale. Experimental procedure
The IOP of the rabbit’s eye is varied during the experiments by changing the elevation of the infusion bag. It is known that pressure difference is proportional to the elevation difference and can be estimated as
P g hρΔ = Δ (2) where ρ is the density of the infusion liquid, g the gravity acceleration and Δh the elevation difference between the position of the bag and the rabbit’s eye.
In order to test and improve the performance of our photonic device, several measurements have been performed. In the first one, the acquisition frequency rate of the imaging device was 100frames/sec while each measurement was taken separately and not in a continuous manner along the time axis. In a second experiment, we had measured at sampling rate of 133frames/sec in a continuous measuring manner. The third experiment was obtained using a continuous processing but at sampling rate of 100frames/sec. For all the three experiments, the current to the laser was 0.25A which means illumination power of about 10mW.
After that, we have performed an additional experiment in a different rabbit but varying the emission characteristics of the laser source instead of the camera. Thus, we have applied a current of 0.2A to the laser which corresponded with an output optical power of about 2mW. Final device design
The final apparatus for the IOP measurement based on the proposed technique should be constructed as manual hand held device that contains small laser pointer and a fast camera with sampling and processing card positioned behind a circular ring that is mechanically adapted to the eye socket of the subject (similar to a spectacle). This adaptation is required since as we are about to show in the experiments, the measurement and the calibration are dependent on the exact measurement position of the spot along the sclera/iris. The sensitivity to position is of about one mm. The mechanical adaptor can allow such mechanical precision for repeated measurements. In addition to the mechanical precision, the exact position along the field of view of the camera can be allocated by simple image processing algorithm that can run as part of the pre-processing procedure of the processing card.
The measurement itself will be done from close distance of about 10cm. The subject will place the device in front of his eye. He will look at a marker inside the device for a few seconds while the measurement is taken by the camera and the laser facing the sclera of the subject. The measurement takes only a few seconds and thus blinking, head and eye movements should not be too relevant in such a short time scale.
Note that measurements of few seconds will be able to measure only IOP fluctuations over short timescales. In order to see the change in IOP over longer timescale, this measurement should be repeated by the subject every few hours along the day.
Proc. of SPIE Vol. 8209 820908-3
Downloaded from SPIE Digital Library on 07 Jun 2012 to 212.193.41.137. Terms of Use: http://spiedl.org/terms
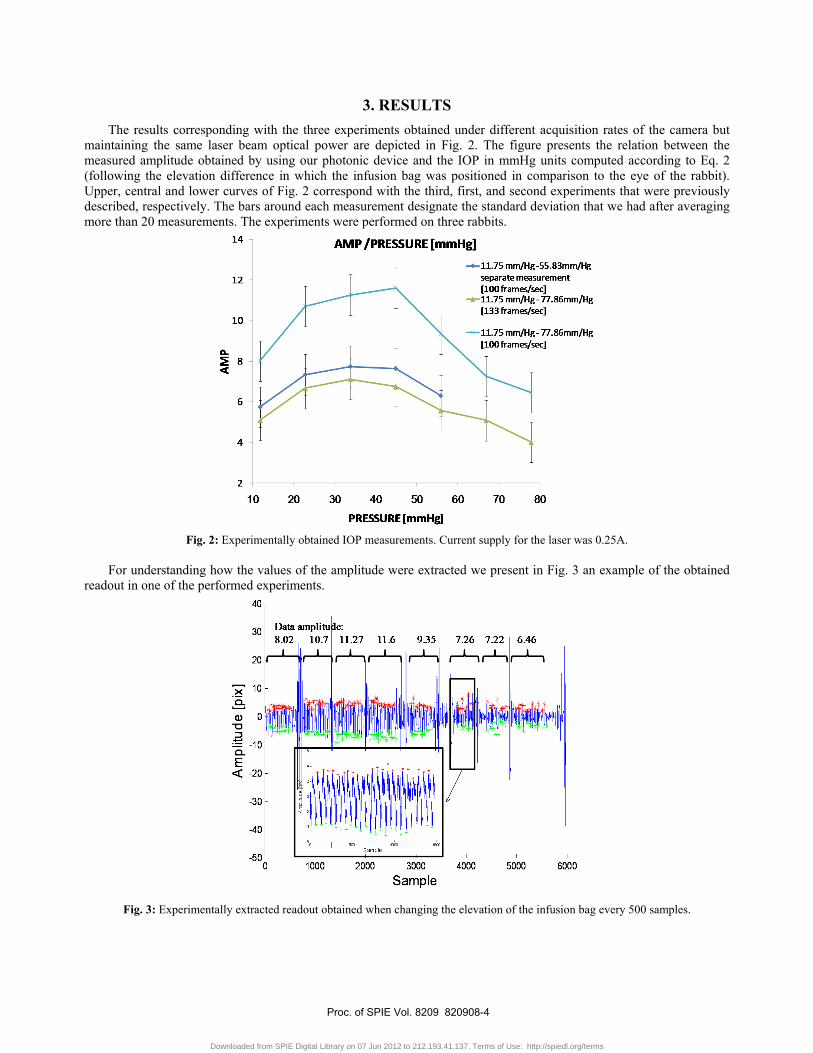
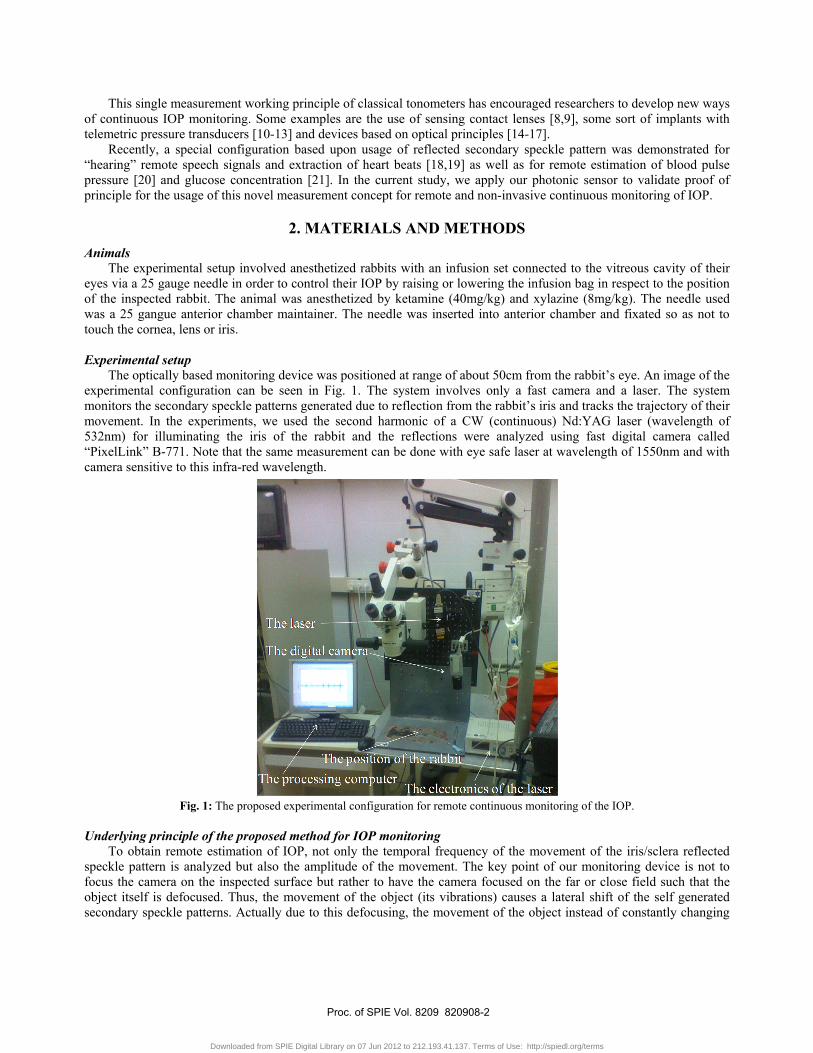
3. RESULTS The results corresponding with the three experiments obtained under different acquisition rates of the camera but
maintaining the same laser beam optical power are depicted in Fig. 2. The figure presents the relation between the measured amplitude obtained by using our photonic device and the IOP in mmHg units computed according to Eq. 2 (following the elevation difference in which the infusion bag was positioned in comparison to the eye of the rabbit). Upper, central and lower curves of Fig. 2 correspond with the third, first, and second experiments that were previously described, respectively. The bars around each measurement designate the standard deviation that we had after averaging more than 20 measurements. The experiments were performed on three rabbits.
Fig. 2: Experimentally obtained IOP measurements. Current supply for the laser was 0.25A.
For understanding how the values of the amplitude were extracted we present in Fig. 3 an example of the obtained
readout in one of the performed experiments.
Fig. 3: Experimentally extracted readout obtained when changing the elevation of the infusion bag every 500 samples.
Proc. of SPIE Vol. 8209 820908-4
Downloaded from SPIE Digital Library on 07 Jun 2012 to 212.193.41.137. Terms of Use: http://spiedl.org/terms

In the figure one may see the pulsation measured from the reflections from the iris while every approximately 500 samples we changed the elevation of the infusion bag (high amplitude artefacts appear between the measurements due to the change of the elevation of the infusion bag).
Finally, in Fig. 4 we show the experimental results obtained when the output optical power of the laser was decreased until about a power of 2mW. In this case, we show the comparison between the extracted amplitude values of the reflected secondary speckle patterns for a sampling rate of 100frames/sec using a continuous type of monitoring.
Fig. 4: Experimentally extracted readout obtained when changing the elevation of the infusion bag every 500 samples. Current supply
to the laser was 0.2A. Note that the difference between the various curves of Figs. 2 and 4 is related to the measurements performed at
different positions along the iris or measurements performed for different eyes. The measurement and its calibration are dependent on the exact measurement position along the sclera/iris.
Another important measurement was performed on a new rabbit (the forth one) following the same measurement procedure as for the experiment of Fig. 4 but this time while comparing the extracted results with absolute reference measurement coming from a conventional Goldmann tonometer. The measurement was done as before from the iris.
Please note that the measurement at 10mm/Hg in Fig. 5 is done before inserting the infusion bag. The measurement presented in Figs. 2 and 4 were done on rabbits after tens of attempts of inserting the infusion into their eye. Those attempts deformed the rabbit’s eye and changed their inherent IOP. In the measurement of Fig. 5 a new rabbit was used and indeed its IOP was lower. Actually we experimentally verified, using the reference Goldmann tonometer, that the average IOP after finishing the experiment indeed changed from 10mmHg (before experiment) to around 35mmHg (right after the experiment).
In Fig. 5 we summarize the extracted results showing good monotonic relation between the optically measured amplitude and the reference IOP measurement. Note that the amplitude values are smaller than those of Figs. 2 and 4 since this time we used in our optical device a lens with different focal length (55mm instead of a lens with focal length of 50mm as in Figs. 2 and 4). Obviously, the calibration of the final device depends on the technical parameters of the measuring device.
Proc. of SPIE Vol. 8209 820908-5
Downloaded from SPIE Digital Library on 07 Jun 2012 to 212.193.41.137. Terms of Use: http://spiedl.org/terms
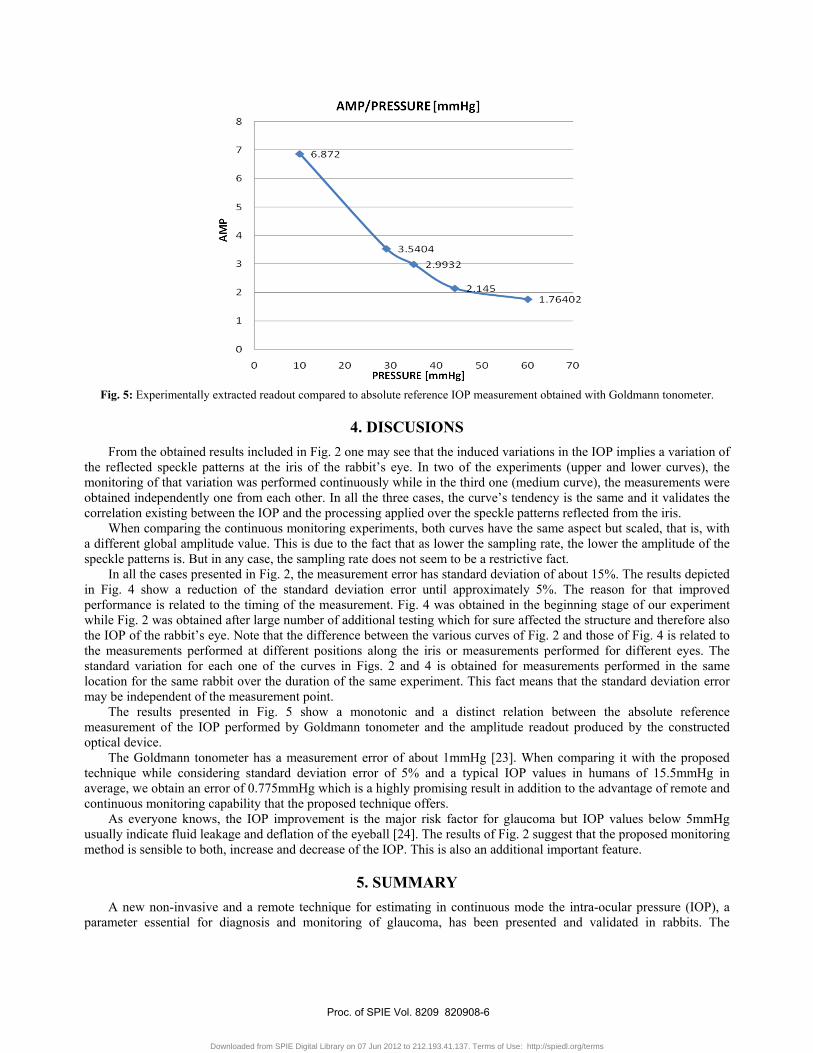
Fig. 5: Experimentally extracted readout compared to absolute reference IOP measurement obtained with Goldmann tonometer.
4. DISCUSIONS From the obtained results included in Fig. 2 one may see that the induced variations in the IOP implies a variation of
the reflected speckle patterns at the iris of the rabbit’s eye. In two of the experiments (upper and lower curves), the monitoring of that variation was performed continuously while in the third one (medium curve), the measurements were obtained independently one from each other. In all the three cases, the curve’s tendency is the same and it validates the correlation existing between the IOP and the processing applied over the speckle patterns reflected from the iris.
When comparing the continuous monitoring experiments, both curves have the same aspect but scaled, that is, with a different global amplitude value. This is due to the fact that as lower the sampling rate, the lower the amplitude of the speckle patterns is. But in any case, the sampling rate does not seem to be a restrictive fact.
In all the cases presented in Fig. 2, the measurement error has standard deviation of about 15%. The results depicted in Fig. 4 show a reduction of the standard deviation error until approximately 5%. The reason for that improved performance is related to the timing of the measurement. Fig. 4 was obtained in the beginning stage of our experiment while Fig. 2 was obtained after large number of additional testing which for sure affected the structure and therefore also the IOP of the rabbit’s eye. Note that the difference between the various curves of Fig. 2 and those of Fig. 4 is related to the measurements performed at different positions along the iris or measurements performed for different eyes. The standard variation for each one of the curves in Figs. 2 and 4 is obtained for measurements performed in the same location for the same rabbit over the duration of the same experiment. This fact means that the standard deviation error may be independent of the measurement point.
The results presented in Fig. 5 show a monotonic and a distinct relation between the absolute reference measurement of the IOP performed by Goldmann tonometer and the amplitude readout produced by the constructed optical device.
The Goldmann tonometer has a measurement error of about 1mmHg [23]. When comparing it with the proposed technique while considering standard deviation error of 5% and a typical IOP values in humans of 15.5mmHg in average, we obtain an error of 0.775mmHg which is a highly promising result in addition to the advantage of remote and continuous monitoring capability that the proposed technique offers.
As everyone knows, the IOP improvement is the major risk factor for glaucoma but IOP values below 5mmHg usually indicate fluid leakage and deflation of the eyeball [24]. The results of Fig. 2 suggest that the proposed monitoring method is sensible to both, increase and decrease of the IOP. This is also an additional important feature.
5. SUMMARY A new non-invasive and a remote technique for estimating in continuous mode the intra-ocular pressure (IOP), a
parameter essential for diagnosis and monitoring of glaucoma, has been presented and validated in rabbits. The
Proc. of SPIE Vol. 8209 820908-6
Downloaded from SPIE Digital Library on 07 Jun 2012 to 212.193.41.137. Terms of Use: http://spiedl.org/terms

monitoring was performed using a simple and low cost photonic device including only a laser and a fast digital camera that processes the change in the positions of the secondary speckle patterns reflected from the iris/sclera.
Preliminary experimental results were performed with rabbits and demonstrated a repeatable correlation between the reduction in the measured amplitude of the shift of the speckle distribution and the IOP. Therefore, if a calibration between the measured parameters and the reference IOP is done at initiation, a quantitative estimation of the IOP value can be performed using the proposed optical technique. By mechanical and image processing means we intend to insure having repeated measurements to be performed from the same position along the subject’s iris/sclera.
REFERENCES
[1]. Lee, D.A., Higginbotham, E.J., 2005. Glaucoma and its treatment: A review. Am. J. Health-Syst. Pharm. 62, 691-699.
[2]. Quigley, H.A., 1996. Number of people with glaucoma worldwide. Br. J. Ophthalmol. 80, 389-393. [3]. Ericson, L.A, 1958. Twenty-four hourly variation in the inflow of aqueous humor. Acta Ophthalmol. Suppl. 50,
381-386. [4]. Wilensky, J.T., 1991. Diurnal variations in intraocular pressure. Trans. Am. Ophthalmol. Soc. 89, 757-757. [5]. Goldmann, H., 1954. Un nouveau tonometre a applanation. Bull. Soc. Fr. Ophthalmol. 67, 474-478. [6]. Cockburn, D.M., 1991. Tonometry, in: Eskridge, J.B., Amos, I.F., Bartlett, I.D. (Eds.), Clinical Procedures in
Optometry. Philadelphia: Lippincott, pp. 221-237. [7]. Grolman, B., 1972. A new tonometer system. Am. J. Optom. Arch. Am. Acad. Optom. 49, 646-660. [8]. Entenmann, B., Robert, Y.C., Pirani, P., Kanngiesser, H., Dekker, P.W., 1997. Contact lens tonometry - application
in humans. Invest. Ophthalmol. Vis. Sci. 38, 2447–2451. [9]. Leonardi, M., Leuenberger, P., Bertrand, D., Bertsch, A., Renaud, P., 2004. First steps toward noninvasive
intraocular pressure monitoring with a sensing contact lens. Invest. Ophthalmol. Vis. Sci. 45, 3113-3117. [10]. McLaren, J.W., Brubaker, R.F., FitzSimon, J.S., 1996. Continuous measurement of intraocular pressure in rabbits
by telemetry. Invest. Ophthalmol. Vis. Sci. 37, 966-75. [11]. Kakaday, T., Hewitt, A.W., Voelcker, N.H., Li, J.S., Craig, J.E., 2009. Advances in telemetric continuous
intraocular pressure assessment. Br. J. Ophthalmol. 93, 992-996. [12]. Hernández-Verdejo, J.L., Teus, M.A., Bolivar, G., 2010. Simultaneous measurement of intraocular pressure in the
anterior chamber and the vitreous cavity. Acta Ophthalmol. 88, e265-e268. [13]. Mansouri, K., Shaarawy, T., 2011. Continuous intraocular pressure monitoring with a wireless ocular telemetry
sensor: initial clinical experience in patients with open angle glaucoma. Br. J. Ophthalmol. 95, 627-629. [14]. Matsumoto, T., Nagata, R., Saishin, M., Matsuda, T., Nakao, S., 1978. Measurement by holographic interferometry
of the deformation of the eye accompanying changes in intraocular pressure. Appl. Opt. 17, 3538-3539. [15]. De la Torre-Ibarra, M.H, Ruiz, P.D., Huntley, J.M., 2006. Double-shot depth-resolved displacement field
measurement using phase-contrast spectral optical coherence tomography. Opt. Express 14, 9643-9656. [16]. Asejczyk-Widlicka, M., Pierscionek, B.K., 2007. Fluctuations in intraocular pressure and the potential effect on
aberrations of the eye. Br. J. Ophthalmol. 91, 1054-1058. [17]. Dubois, P., Zemmouri, J., Rouland, J.F., Elena, P.P., Lopes, R., Puech, P., 2007. A new method for Intra Ocular
Pressure in vivo measurement: first clinical trials. Conf. Proc. IEEE Eng. Med. Biol. Soc. 1, 5762-5765. [18]. Zalevsky, Z., Garcia, J., 2008. Motion detection system and method. WO/2009/013738 International Application No
PCT/IL2008/001008. [19]. Zalevsky, Z., Beiderman, Y., Margalit, I., Gingold, S., Teicher, M., Mico, V., Garcia, J., 2009. Simultaneous remote
extraction of multiple speech sources and heart beats from secondary speckles pattern. Opt. Express 17, 21566-21580.
[20]. Beiderman, Y., Horovitz, I., Burshtein, N., Teicher, M., Garcia, J., Mico, V., Zalevsky, Z., 2010. Remote estimation of blood pulse pressure via temporal tracking of reflected secondary speckles pattern. J. Biomed. Opt. 15, 061707-1−061707-7.
[21]. Beiderman, Y., Blumenberg, R., Rabani, N., Teicher, M., Garcia, J., Mico, V., Zalevsky, Z., 2011. Optical sensor for remote estimation of glucose concentration in blood. Biomed. Opt. Express 2, 858-870.
[22]. Beiderman, Y., Amsel, A. D, Tzadka, Y., Fixler, D., Mico, V., Garcia, J., Zalevsky, Z., 2011. A microscope configuration for nanometer 3-D movement monitoring accuracy. Micron 42, 366-375.
Proc. of SPIE Vol. 8209 820908-7
Downloaded from SPIE Digital Library on 07 Jun 2012 to 212.193.41.137. Terms of Use: http://spiedl.org/terms

[23]. Chihara, E., 2008. Assessment of true intraocular pressure: the gap between theory and practical data. Surv. Ophthalmol. 53, 203-218.
[24]. Henderer, J.D., Budenz, D.L., Flynn, H.W., Schiffman, J.C., Feuer, W.J., Murray, T.G., 1999. Elevated intraocular pressure and hypotony following silicone oil retinal tamponade for complex retinal detachment: incidence and risk factors. Arch. Ophthalmol. 117, 189-95.
Proc. of SPIE Vol. 8209 820908-8
Downloaded from SPIE Digital Library on 07 Jun 2012 to 212.193.41.137. Terms of Use: http://spiedl.org/terms