Optical Properties and Visual Effects of Smoke-Stack Plumes · light and the angle between light...
92
Transcript of Optical Properties and Visual Effects of Smoke-Stack Plumes · light and the angle between light...


INTRODUCTION
Evaluation of Black Smoke by Means of Reflectance Standards (Ringelmann Charts)
It is nearly 70 years since the French engineer Maximilian Ringelmann 1 devised this famous procedure for assessing black smoke. The luminance of the plume is compared to the luminance of four white charts (numbered 1, 2, 3, and 4) on which are black grids obscuring respectively 20, 40, 60, and 80 percent of the chart surfaces.
The comparison is between (1) the amount of light transmitted to the observer through the black smoke from the portion of sky on its far side and (2) the amount of light from a different and wider area of sky and from the sun, in whatever position it happens to be, reflected to the observer from the white areas of the chart. Even if the smoke does not scatter an appreciable amount of sun- and sky-light toward the observer, the limitations of such a comparison between totally different quantities has long been recognized. 2 Nevertheless, the Ringelmann charts remain the basis of smoke legislation and control in all indus- trial nations.
Evaluation of Black Smoke by Means of Transmittance Standards
A black smoke is better evaluated by comparing its luminance with the luminance of an adjacent and like portion of sky viewed through a series of neutral filters of known transmittances. When the lumi- nances are equal, so are the transmittances. The U.S. Public Health Service Smoke Guide 3,4 and several commercial instruments oper- ate on this principle.
lt must be emphasized that the true optical transmittance ex- presses the full effect of the smoke in attenuating the light that would have come directly to the observer’s eye in its absence, both by scattering of this light from the particles and by absorption within them. The measurement of transmittance by comparison with neutral filters is erroneous if the smoke is not black and if it scatters appreciable light from the sun or other parts of the sky to the observer.
Vision Obscuration as a Specification for the Acceptability
of Non-Black Plumes
If the smoke is not black, then evaluation by comparing its luminance with filters or Ringelmann charts becomes unrealistic. The plume luminance due to transmitted sky-light may be augmented con- siderably by the scattering of light the plume receives from the rest of the sky and from the sun. If the smoke is white, its luminance may equal that of “Ringelmann 0, ” a white card with no grid, or exceed that of the adjacent sky seen through a filter with 100 percent transmit- tance, the more so as the smoke density increases. In the absence of any recognized method of evaluating white plumes, a concept of vision obscuration is sometimes used. 5 In California plumes are illegal if they obscure vision as much or more than did a black smoke of Ringel- mann shade No. 2.
For a given plume, the plume-scattered light and the contrast reduction caused by the plume vary with the strength of the illuminating light and the angle between light source, plume, and observer. There- fore, vision obscuration for a given plume varies considerably accord- ing to the lighting and observing conditions. Also, it is often impossible to measure the vision obscuration by a plume from a smoke stack under
‘i the limitations of routine evaluation in the field. In practice, inspectors are trained to recognize white test-smokes, whose obscuration of vision
( is known by previous calibrations to be equivalent to the obscuration of t / vision of black smokes of various Ringelmann shades. ’ ! this experience,
On the basis of the inspectors then allocate equivalent Ringelmann
-‘t shades to white smokes seen in the field. 6,7
APPARATUS
For study of these phenomena under controlled conditions, facil- ities for generating and measuring smoke were established. * At the Robert A. Taft Sanitary Engineering Center of the U.S. Public Health Service, an experimental outdoor stack (Figure 1) was constructed so that a Sl-cm-high, 20-cm-thick, 60-cm-long horizontal black or white plume could be maintained at uniform concentration and at a uniform velocity of about 16 km/hr. To attain a uniform, nondiffusing plume around 60 cm long when the ambient wind direction and speed deviates only slightly from those of the plume, an air sheath 5 cm thick surround- ing the smoke plume was made to travel at the same velocity as the smoke. A narrow-angle transmissometer (Figure 2) was mounted in the stack for monitoring the transmittance of the plumes. The stack and all associated apparatus were mounted on a base that can be easily rotated to allow plume observation in any direction relative to plume travel and sun position.
2 OPTICAL PROPERTIES AND VISUAL EFFECTS

Figure 1. Laboratory smoke stock.
OF SMOKE-STACK PLUMES

Figure 2. Smoke stack transm~ssometer.
OPTICAL PROPERTIES AND VISUAL EFFECTS
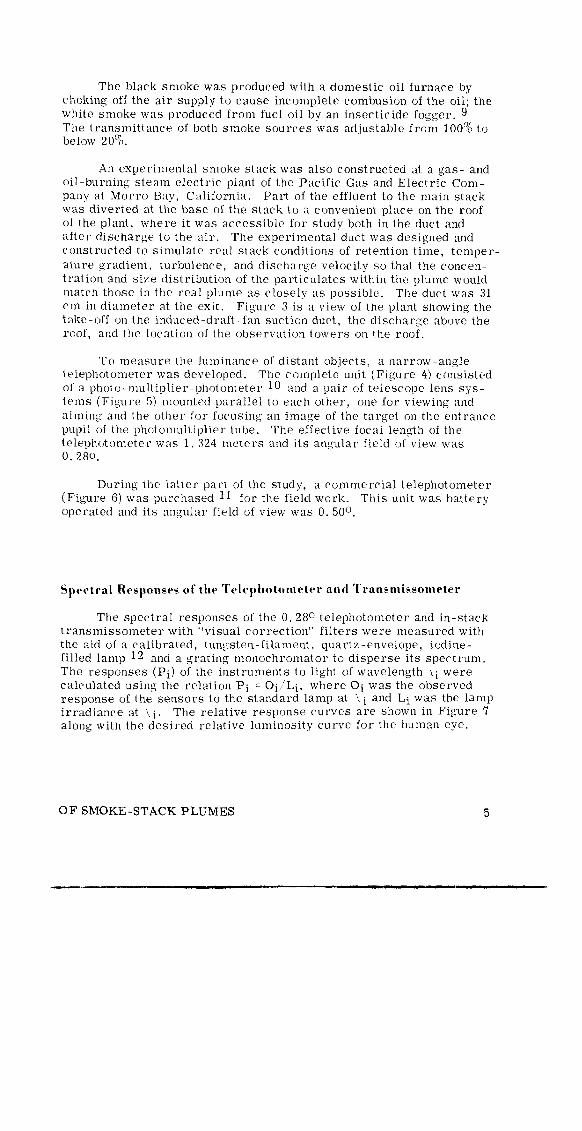
The black smoke was produced with a domestic oil furnace by choking off the air supply to cause incomplete combusion of the oil; the white smoke was produced from fuel oil by an insecticide fogger. 9 The transmittance of both smoke sources was adjustable from 100% to below 20%.
An experimental smoke stack was also constructed at a gas- and oil-burning steam electric plant of the Pacific Gas and Electric Com- pany at Mnrro Bay, C:tlifornia. Part of the effluent to the main stack was diverted at the base of the stack to a convenient place on the roof of the plant, where it was accessible for study both in the duct and after discharge to the air. The experimental duct was designed and constructed to simulate real stack conditions of retention time, temper- ature gradient, turbulence, and discharge velocity so that the concen- tration and size distribution of the particulates within the plume would match those in the real plume as closely as possible. The duct was 31 cm in diameter at the exit. Figure 3 is a view of the plant showing the take-off on the induced-draft-fan suction durt, the discharge above the roof, and the location of the observation towers on the “roof.
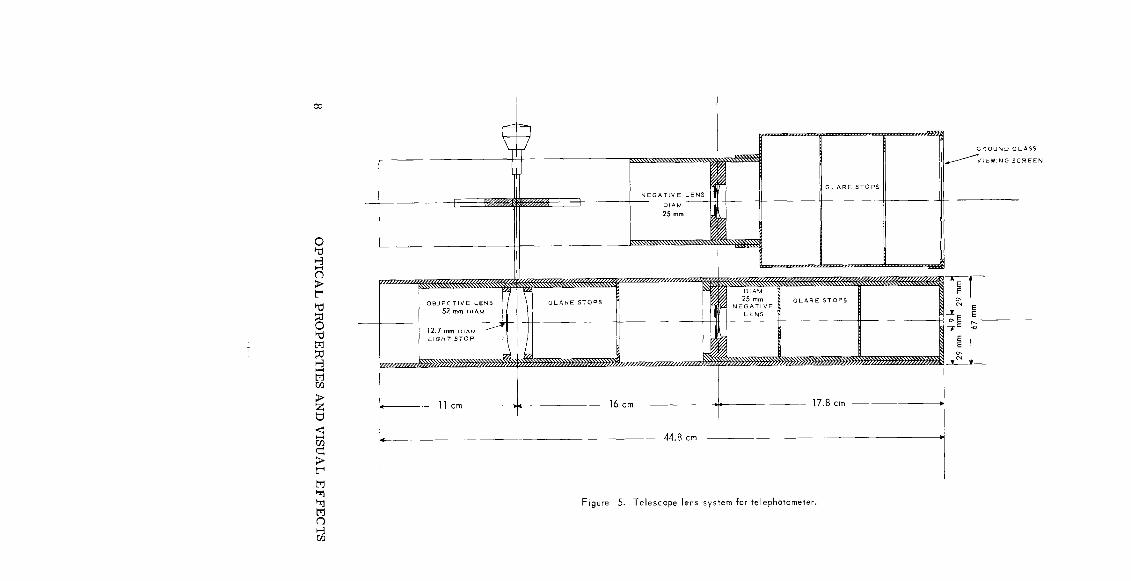
To measure the luminance of distant objects, a narrow-angle telephotometer was developed. The complete unit (Figure 4) consisted of a photo-multiplier-photometer lo and a pair of telescope lens sys- tems (Figure 5) mounted parallel to each other, one for viewing and aiming and the other for focusing 311 image of the target on the entrance pupil of the photomultiplier tube. The effective focal length of the telephotometer was 1. 324 meters and its angular field of view was 0.280.
During the latter part of the study, a commercial telephotometer (Figure 6) was purchased lf for the field work. This unit was battery operated and its angular field of view was 0. 50°.
Spectral Responses ol’ the Telephotumetrr and Transmissomrter
The spectral responses of the 0. 28O telephotometer and in-stack transmissometer with “visual correction” filters were measured with the aid of a calibrated, tungsten-filament, quartz-envelope, iodine- filled lamp 12 and a grating monochromator to disperse its spectrum. The responses (Pi) of the instruments to light of wavelength \i were calculated using the relation Pi = Oi,:Li, where Oi was the observed response of the sensors to the standard lamp at ii and Li was the lamp irradiance at \.i. The relative response curves are shown in Figure 7 along with the desired relative luminosity curve for the human eye.
OF SMOKE-STACK PLUMES

Figure 3. Expersmental smoke stack ot o power plant.
Telephotometer Calibration
For calibration of the telephotometer, a self-luminous laboratory target was constructed and its luminance was determined with the aid of a Weston Model 614 illumination meter. This laboratory target was used to determine the effective luminance of a field light source, which was placed on the front of the telephotometer for periodic checks of calibration in the field.
The laboratory target was composed of a 61-cm-long, 31-cm- diameter cylindrical container, two sheets of ground glass, and a 350-
6 OPTICAL PROPERTIES AND VISUAL EFFECTS

watt flood lamp. The double layer of ground glass diffusing screens was placed over the open end of the cylinder, and the flood lamp was placed at the opposite closed end of the cylinder to illuminate them.
Flgure 4. Telephotometer assembly.
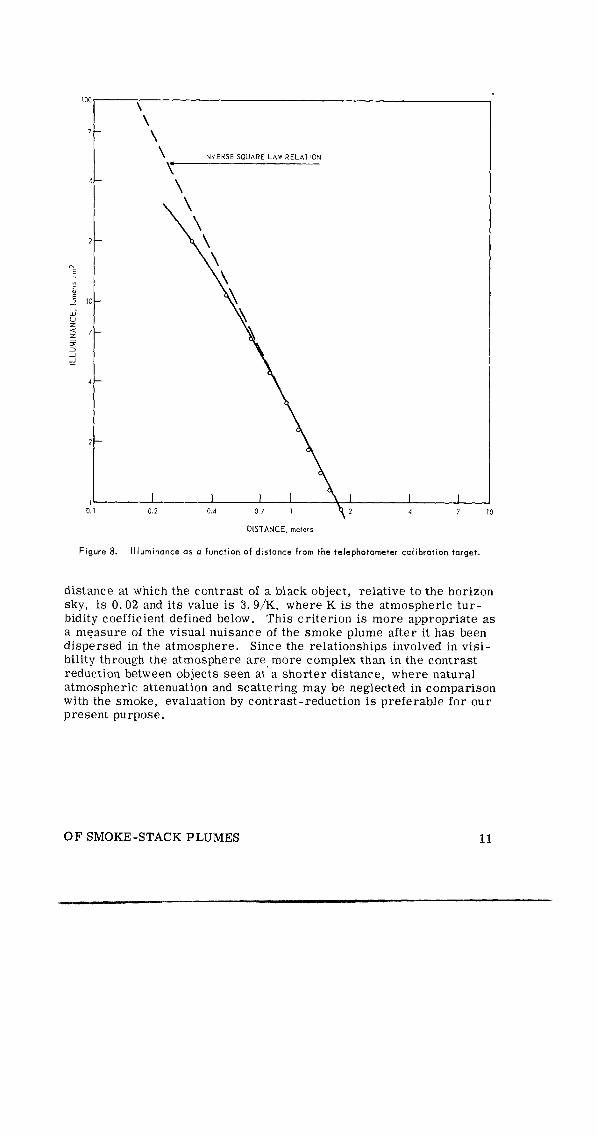
After it was determined that the ground glass was evenly illumi- nated by the flood lamp, it was masked down until a 64-cm2 area was exposed at the center. The intensity of this area was determined by measuring the illumination received at various distances from the source with the illumination meter. A curve of the illumination versus meter distance from the light source is shown in Figure 8. Where the slope of this curve was linear and equal to -2, the illumination was varying with distance as though’ the 64-cm2 light source was a point source. The intensity of the source can be determined from any point on the linear part of the curve by multiplying the illumination at this point by the square of the corresponding distance. The intensity of the target was 320 candles. The luminance of the target, which is defined
OF SMOKE-STACK PLUMES 7
12.7 mm D,AM
Ll‘HT STOP
44.8 cm
Figure 5. Telescope lens system for telephotometer.

as the intensity of the target divided by the target area, was 50 x 103 candlesimeter2. Although the luminance of the target was higher than the luminances that will be encountered in the field, by a factor of about 10, the extra brightness was needed so that the illumination measure- ments could be taken at a distance great enough for the intensity of the source to be determined. A neutral density filter with a transmittance of 10% was placed in front of the telephotometer objective to give an apparent luminance of 5000 candles/meter2 for calibrating.
The field light-calibrating source was built into a cylindrical container 7.6 cm in diameter and about 25 cm long. A ground-glass diffusing screen located about 7. 6 cm from the open end of the tube
Figure 6. Telephotometer.
OF SMOKE-STACK PLUMES 9

was illuminated by a 40-watt incandescent lamp with voltage regulation located at the closed end of the tube. The effective luminance of this field calibrating source was found to be 5200 candles/meter2 when compared with the laboratory target.
WAVE LENGTH, m,ll,m,~r~n~
Figure 7. Spectral response of telephotometer and smoke stack transmissometer.
VISUAL EFFECTS OF SMOKE PLUMES
Vision involves physiological factors and cannot be defined by physical measurements alone: however, in the absence of color con- trasts, visibility of objects depends among other things on the per- ception of luminance contrasts between the objects and their surround- ings. For scenes of normal brightness in daylight, the eye can usually distinguish an object from its background when their relative contrast (defined below) exceeds *O. 02 to 0.05; in general, the greater the con- trast of the object with its background, the greater its visibility. 13 In this study we take photometric measurements of contrast between plumes and their background (usually the sky) as an index of the visi- bility of the plumes themselves; and we take the reduction in contrast between objects viewed through plumes as an index of obscuration by the plumes. The relationships can be expected to be simplest when the plumes are viewed with a restricted field of view as in a telescope. For normal unrestricted vision, perception of contrasts between parts of the field can be influenced significantly by the brightness of the field as a whole.
The other common criterion of vision obscuration is the reduction in meteorological visual range. This range is usually defined as the
10 OPTICAL PROPERTIES AND VISUAL EFFECTS
\ \
\ \ INVERSE SOUARE LAW RELATION
c
\
1
DISTANCE. meters
Figure 8. llluminonce as o function of distance from the telephotometer calibration target.
distance at which the contrast of a black object, relative to the horizon sky, is 0.02 and its value is 3. 9/K, where K is the atmospheric tur- bidity coefficient defined below. This criterion is more appropriate as a measure of the visual nuisance of the smoke plume after it has been dispersed in the atmosphere. Since the relationships involved in visi- bility through the atmosphere are. more complex than in the contrast reduction between objects seen at a shorter distance, where natural atmospheric attenuation and scattering may be neglected in comparison with the smoke, evaluation by contrast-reduction is preferable for our present purpose.
OF SMOKE-STACK PLUMES 11

Contrast Between Targets Viewed Through Smoke Plumes
The luminance contrast between two equal-size targets with luminances of Bl and B2 (Bl > B2) may be defined as
c : Bl - Bz
Bl (1) I f the targets are not self-luminous, their luminances depend on their reflectances (Rl and R2), and on the illuminance (E) such that
BI = klRlE
and B2 = k2R2E (2)
where kl and k2 are factors depending on the diffusing characteristics of the target surfaces and viewing direction. For perfectly diffuse surfaces (that obey Lambert’s law) k= l/n and their luminances are independent of viewing direction, a good approximation for the behavior of many surfaces. If the targets have similar, even if not perfectly diffusing surfaces and are illuminated in the same way kl = k2 and C becomes
(3)
an intrinsic property of the targets independent of ambient lighting conditions.
When the targets are viewed through a light-scattering plume, their luminance will appear to change because of the attenuation of light being transmitted through the plume and to the addition of air-light resulting from the scatterin, 0 of ambient light by the-plume in the direc- tion of the viewer. If, in addition to the foregone assumptions, the plume transmittance and the scattered light are the same along both lines of sight, then the apparent luminances of the targets (Bi and B2) may be written
B’=B +BT 1 a 1
and B2’ = Ba + B2T (4)
where B1 and B2 are the luminances of the targets viewed clear of the plume, T is the plume transmittance, and B, is the plume air-light. Plume air-light is defined here as the limiting apparent luminance of a black target viewed through the plume as its size goes to zero. The apparent contrast (Ca) between the targets is
Bi - B2 ca =-
Bi (5)
12 OPTICAL PROPERTIES AND VISUAL EFFECTS
which becomes
(B1 - B2) T ‘a = Ba + BIT
(6)
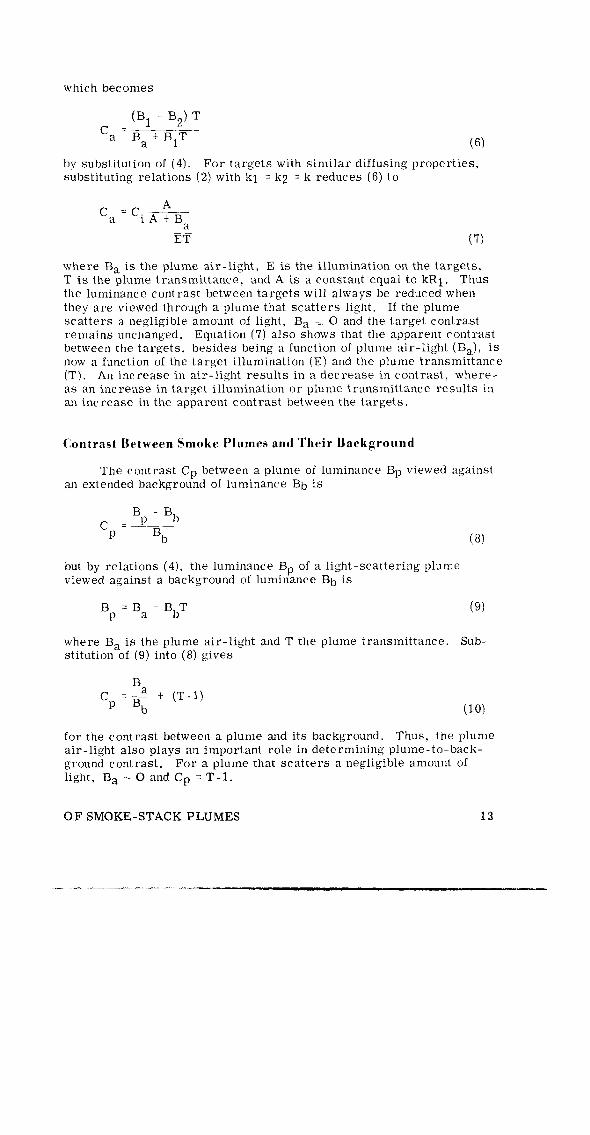
by substitution of (4). For targets with similar diffusing properties, substituting relations (2) with kl = k2 = k reduces (6) to
ca=ci&& EG (7)
where B, is the plume air-light, E is the illumination on the targets, T is the plume transmittance, and A is a constant equal to kR1. Thus the luminance contrast between targets will always be reduced when they are viewed through a plume that scatters light. If the plume scatters a negligible amount of light, B, - 0 and the target contrast remains unchanged. Equation (7) also shows that the apparent contrast between the targets. besides being a function of plume air-light (B,), is now a function of the target illumination (E) and the plume transmittance (T). An increase in air-light results in a decrease in contrast, where- as an increase in target illumination or plume transmittance results in an increase in the apparent contrast between the targets.
Contrast Between Smoke Plumes and Their Background
The contrast Cp between a plume of luminance BP viewed against an extended background of luminance Bb is
Bp - Bb cP =- Bb
but by relations (4), the luminance BP of a light-scattering plume viewed against a background of luminance Bb is
(8)
where B, is the plume air-light and T the plume transmittance. Sub- stitution of (9) into (8) gives
for the contrast between a plume and its background. Thus, the plume air-light also plays an important role in determining plume-to-back- ground contrast. For a plume that scatters a negligible amount of light, B, 2 0 and Cp = T-l.
OF SMOKE-STACK PLUMES 13

Contrast Reduction by the Experimental Rlack aud White Plumes
To illustrate how the contrast between objects can vary when the objects are viewed through plumes from different directions relative to the sun on clear days, the apparent contrast between targets was measured through the experimental black and white plumes on clear and overcast days for periods of 6 to 7 hours from fixed plume-viewing positions. The viewing directions chosen were east and west, since extremes in the angle between plume, viewer, and sun occur when plumes are viewed throughout the day in these directions, Runs were conducted from about 9:00 a. m. to 4:00 p. m. with plumes having in- stack transmittances of 60 and 40 percent. The plume directions were south or north, according to the wind. The targets were located about 3 meters behind the plumes, and the telephotometer was located about 12 meters east or west of the plumes. Measurements of the inherent contrast between the targets and of intensity of solar radiation on a horizontal surface, as indicated by an Eppley globe pyrheliometer, l4 were taken concurrently during each run. Tests were also conducted to illustrate how the apparent contrast between targets can vary with plume transmittance when the targets are viewed through plumes under illu- minating conditions that result in high and low plume-air-light luminances
Two types of target-pairs were used. The first pair of targets consisted of 31- by 62-cm black and white panels, The surfaces of these targets were of matte finish and exhibited similar diffusing char- acteristics. Consequently, the contrast between them showed little variation when they were illuminated from different directions as the day progressed, even though their luminances varied considerably.
The targets in the second pair were self-luminous; each con- sisted of a circular, 13-cm-diameter frosted-glass sheet located in the back of a cylindrical 93-cm-long, 31-cm-diameter “black box target.” The luminance of the frosted glass was controlled by illuminating it from behind with four loo-watt lamps and one 25-watt lamp. Its lumi- nance was 10700 candles/meter2 with all lamps on and 800 candles,/ meter2 with the 25-watt lamp on; it served as a black box target with the lamps off. The lamp housing was cooled with a small blower. The luminances of these targets, unlike those of the panel targets, were independent of ambient illumination and remained constant as the day progressed.
The apparent contrasts between the panel targets were measured through white and black plumes with 60 and 40 percent transmittance during clear days from both east and west (Figures 9a and 9b), and during overcast days from the east only (Figure 10). The apparent contrasts between the self-luminous targets were measured through white and black plumes with 60 and 40 percent transmittance during clear days from the east (Figures lla and lib). Measurements of plume air-light were taken concurrently during the latter runs by using the target as a black box to eliminate transmitted light from the back- ground.
14 OPTICAL PROPERTIES AND VISUAL EFFECTS
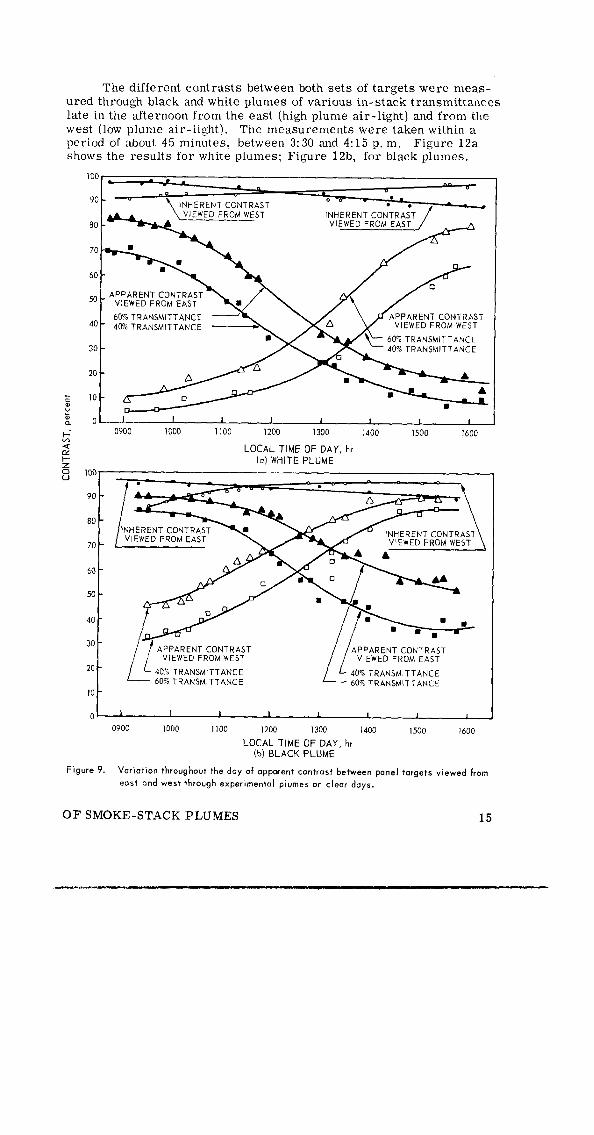
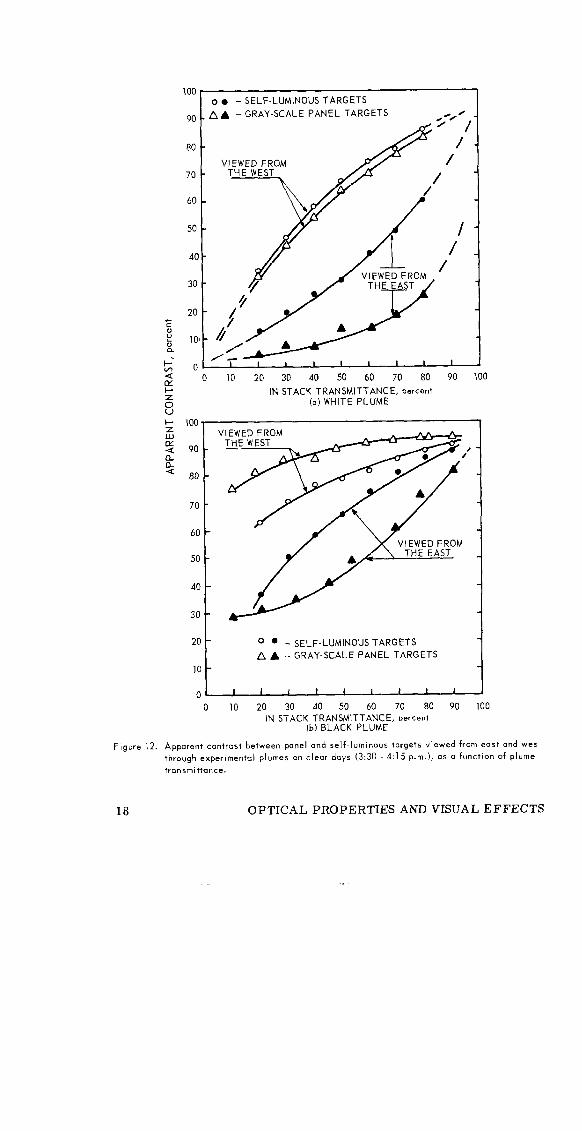
The different contrasts between both sets of targets were meas- ured through black and white plumes of various in-stack transmittances late in the afternoon from the east (high plume air-light) and from the west (low plume air-light). The measurements were taken within a period of about 45 minutes, between 3:30 and 4:15 p.m. Figure 12a shows the results for white plumes; Figure 12b, for black plumes.
100 r
RAST /EST -
i 0900 1000 1100 1200 1300 1400 1500 1600 h 4 LOCAL TIME OF DAY, hr
(01 WHITE PLUME !z E loor
40
30 i
i APPARENTCONTRAST
VIEWED FROM kEST
20 40% TRANSMITTANCE 60% TRANSMITTANCE
10
-
II APPARENTCONTRAST VIEWED FROM EAST
/ 40% TRANSMITTANCE 60% TRANSMITTANCE
01 ’ I I I 1 I I 1
0900 1000 1100 1200 1300 1400 1500 1600
LOCAL TIME OF DAY, hr (b) BLACK PLUME
Figure 9. Variation throughout the day of apparent contrast between panel targets viewed from
east and west through experimental plumes on clear days.
OF SMOKE-STACK PLUMES 15

100 I I I I I 1
90 - .
INHERENT CONTRAST
a0 -
70- APPARENT CONTRAST 60% TRANSMITTANCE
60-
50 - 0
00 0
40 -
30 -
40% TRANSMITTANCE 20 -
5 j , , , , , I 1
a . 900
1000 1100 1200 1300 1400 1500 1600
tG -=l
LOCAL TIME OF DAY, hr
E (0) WHITE PLUME
$ loo- , I i I I I
u .
90 -4 A
INHERENT CONTRAST
80 - APPARENT CONTRAST 60% TRANSMITTANCE
60 -
50 - APPARENT CONTRAST 40% TRANSMITTANCE
40 -
30 -
20 -
lo-
0 I I I I 1 I
900 1000 1100 1200 1300 1400 1 so0 1600
LOCAL TIME OF DAY, hr (b) BLACK PLUME
Figure 10. Variation throughout the day of apparent contrast between panel targets viewed from
the east through experimental plumes on overcast days.
OPTICAL PROPERTIES AND VISUAL EFFECTS

-
60% TRANSMITTANCE
40% TRANSMITTANCE - - u 2,000 -5
90 - INHERENT CONTRAST / - 10,000
PLUME AIR-LIGHT
80 - 60% TRANSMITTANCE 405 TRANSMITTANCE .
60 - 7,000
APPARENT CONTRAST
LOCAL TIME OF DAY, hr ((11 WHITE PLUME
z 100 2,400 ;
5 2.200 -’ 90 -
80 -
70 -
60 -
I 50 -
40 -
30 -
20 -
IO -
APPARENT CONTRAST 60% TRANSMITTANCE 40% TRANSMITTANCE
PLUME AIR-LIGHT 60”: TRANSMITTANCE 40% TRANSMITTANCE
u.
- 2,000
- 1,800
- 1,600
- 1,400
- 1,200
- 1,000
- 800
- 600
0 I I I I I I J 400
900 1000 1100 1200 1300 1400 1500 1600
LOCAL TIME OF DAY, hr (b) BLACK PLUME
Figure 11. Variation throughout the day of apparent contrast between self-luminous targets viewed
from the cost through experimental plumes on clear days.
OF SMOKE-STACK PLUMES 17
ILaY I
o . - SELF-LUMINOUS TARGETS
nn A A - GRAY-SCALE PANEL TARGETS ,
Figure 12.
lY 0 IO 20 30 40 50 60 70 80 90 100
5 IN STACK TRANSMITTANCE, percent
s (a) WHITE PLUME
I- loo-
z
2g 90- a
% 80 -
70 -
60 -
50 -
40 -
30 -
VIE\
VIEWED FROM
VED FROM E WEST
41 , $ : 1 ;~k:!~::~~E; , 1
0 10 20 30 40 50 60 70 80 90 100
IN STACK TRANSMITTANCE, percent (b) BLACK PLUME
Apparent contrast between panel and self-luminous targets viewed from eas
through experimental plumes on clear days (3:30 - 4:15 p.m.), os a function
transmittance.
t and WBL
of DI ume
18 OPTICAL PROPERTIES AND VISUAL EFFECTS
Contrast Between the Experimental Black and White Plumes
and Their Sky Backgrounds
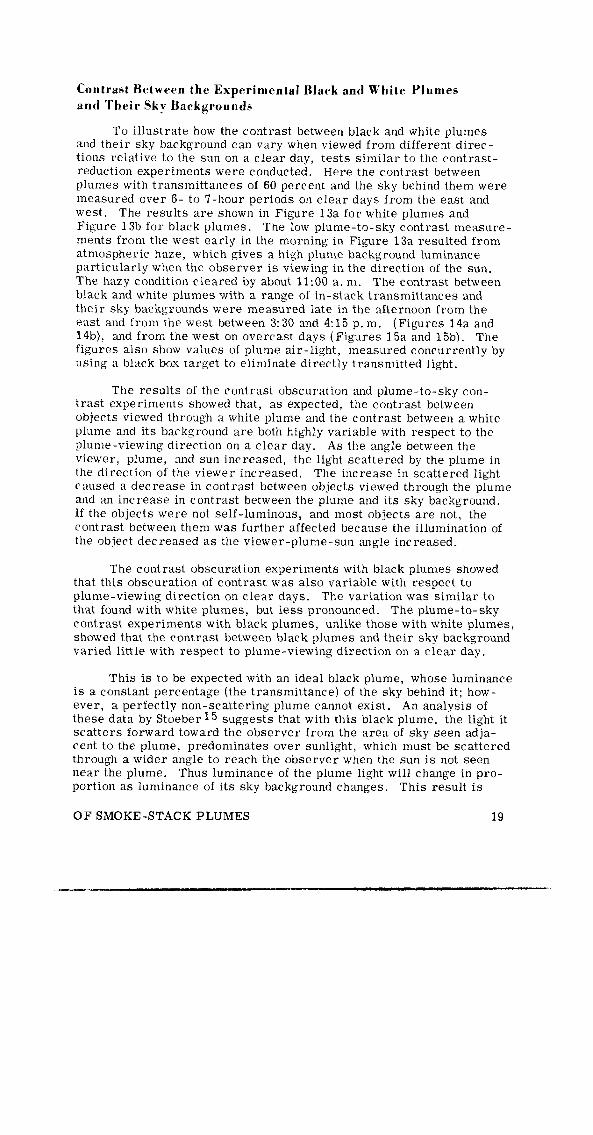
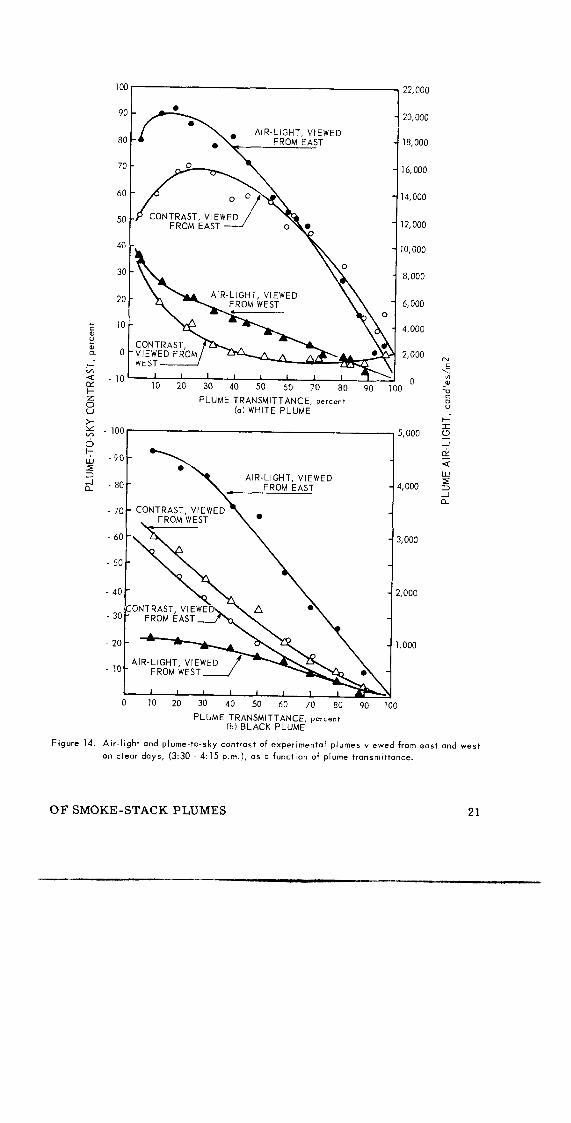
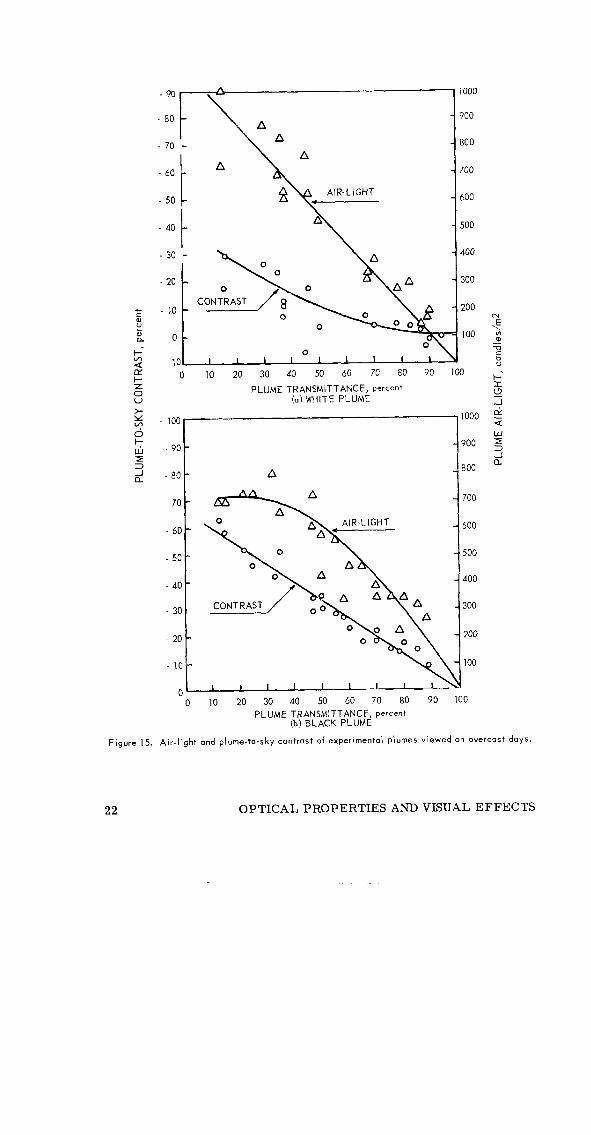
To illustrate how the contrast between black and white plumes and their sky background can vary when viewed from different direc- tions relative to the sun on a clear day, tests similar to the contrast- reduction experiments were conducted. Here the contrast between plumes with transmittances of 60 percent and the sky behind them were measured over 6- to Y-hour periods on clear days from the east and west. The results are shown in Figure 13a for white plumes and Figure 13b for black plumes. The low plume-to-sky contrast measure- ments from the west early in the morning in Figure 13a resulted from atmospheric haze, which gives a high plume background luminance particularly when the observer is viewing in the direction of the sun. The hazy condition cleared by about 11:00 a. m. The contrast between black and white plumes with a range of in-stack transmittances and their sky backgrounds were measured late in the afternoon from the east and from the west between 3:30 and 4:15 p.m. (Figures 14a and 14b), and from the west on overcast days (Figures 15a and 15b). The figures also show values of plume air-light, measured concurrently by using a black box target to eliminate directly transmitted light.
The results of the contrast obscuration and plume-to-sky con- trast experiments showed that, as expected, the contrast between objects viewed through a white plume and the contrast between a white plume and its background are both highly variable with respect to the plume-viewing direction on a clear day. As the angle between the viewer, plume, and sun increased, the light scattered by the plume in the direction of the viewer increased. The increase in scattered light caused a decrease in contrast between objects viewed through the plume and an increase in contrast between the plume and its sky background. If the objects were not self-luminous, and most objects are not, the contrast between them was further affected because the illumination of the object decreased as the viewer-plume-sun angle increased.
The contrast obscuration experiments with black plumes showed that this obscuration of contrast was also variable with respect to plume-viewing direction on clear days. The variation was similar to that found with white plumes, but less pronounced. The plume-to-sky contrast experiments with black plumes, unlike those with white plumes, showed that the contrast between black plumes and their sky background varied little with respect to plume-viewing direction on a clear day.
This is to be expected with an ideal black plume, whose luminance is a constant percentage (the transmittance) of the sky behind it; how- ever, a perfectly non-scattering plume cannot exist. An analysis of these data by Stoeber 15 suggests that with this black plume, the light it scatters forward toward the observer from the area of sky seen adja- cent to the plume, predominates over sunlight, which must be scattered through a wider angle to reach the observer when the sun is not seen near the plume. Thus luminance of the plume light will change in pro- portion as luminance of its sky background changes. This result is
OF SMOKE-STACK PLUMES 19

AIR-LIGHT, VIEwED FROM EAST
1000 1100 1200 1300 1400 1500 1600
LOCAL TIME OF DAY, hr (0) WHITE PLUME
J 11,OOC
/
10,000
9,000
1
8,000
7,000
1
6 000
120r 12,600
AIK-LIGHT. VIEWED FROM EAST
P AIR-LIGHT, VIEWED inn,, WCCT
CONTRAST, VIEWED FROM WEST AAA CONTRAST, VIEWED FROM EAST l l l
J - 2,400 5
- 1,800
- 1,600
- 1,400
- 1,200
- 1,000
- 800
- 600
- 400
0’ I I I I I I I 1 200
“00 1000 1100 1200 1300 1400 1500 1600
LOCAL TIME OF DAY, hr (b) BLACK PLUME
Figure 13. Air-light and plume-to-sky contrast of experimental plumes with 60 percent transmittance
viewed from east andwest on clear days, as a function of time.
20 OPTICAL PROPERTIES AND VISUAL EFFECTS
-- FROM EAST -
OY=,
10 I I I I 1 - t I t lo 20 30 40 50 60 70 80
PLUME TRANSMITTANCE, percent (a) WHITE PLUME
-90
- 80 AIR-LIGHT, VIEWED
FROM EAST
1 22,000
20,000
18,000
16,000
14,000
12,000
10,000
8,000
6,000
> \ . lO(
4,000
2,000
0 )
5,000
4,000
3,000
2,000
1,000
70 - CONTRAST, VIEWED
60 -
CONTRAST, VIEWE 3o - FROM EAST
L 1 I I I I I 1 0 10 20 30 40 50 60 70 80 90 100
PLUME TRANSMITTANCE, percent (b) BLACK PLUME
Figure 14. Air-light and plume-to-sky contrast of experimental plumes viewed from cost and west
on clear days, (3:30 4:15 p.m.), 05 0 function of plume transmittance.
OF SMOKE-STACK PLUMES 21
-60 -
- 50
- 40
I
- 20
- 10
0
10 1
0 10 20 30 40 50 60 70 80 90 100
PLUME TRANSMITTANCE, percent (a) WHITE PLUME
- 900 2 3
-800 a.
- 700
- 600
- 500
- 400
- 300
- 200
-0 10 20 30 40 50 60 70 80 90 100
PLUME TRANSMITTANCE, percent (b) BLACK PLUME
Figure 15. Air-light and plume-to-sky contrast of experimental plumes viewed on overcast days.
22 OPTICAL PROPERTIES AND VISUAL EFFECTS

physically reasonable because the scattering by absorbing particles differs from that by transparent particles chiefly in the reduction in scattering at angles outside the main forward lobe in the scattering pattern. This effect would not be expec,ted if the plume background were a dark object.
On overcast days when illumination of plumes was by diffused light and not strongly directional, the contrast between objects viewed through black and white plumes and the contrast between the plumes and their background did not show the extreme variation with viewing direction that was apparent on clear days; rather, the contrasts fluctu- ated randomly as overcast areas of varying density passed in front of the sun. The plume-to-background contrast of a white plume and its obscuration of contrast on an overcast day can be extremely complex and vary in no predictable manner as overcast conditions vary from day to day and minute to minute.
Evaluation of Plumes by Trained Observers
Since tests have shown that the visual appearance of a plume as measured instrumentally by telephotometer varies with direction of view relative to the sun, we must ask whether the subjective evaluation of plumes by trained observers also varies with direction of view rela- tive to sun. Or can the trained observer compensate for the observed variation in the luminance contrast of plumes with viewing direction?
Evaluation tests were made at the smoke school of an air pollu- tion control district. A group of five observers was positioned about 18 meters east of the training stacks and a group of four observers was positioned about 18 meters west of the stacks. The observers were requested to allot Ringelmann numbers to the plumes in accordance with their training and to allow for any variation in plume appearance due to viewing direction. A telephotometer was stationed with both groups. The observers had been trained to recognize plumes of a given Ringel- mann number as indicated by appropriate readings of the in-stack transmittance under various lighting conditions. Both black and white plumes with in-stack transmittances of 15, 35, 50, 65, and 85 percent were generated in random sequences. On signal, the observers assessed the plumes and the telephotometer operators measured the plume and background luminances.
Eight runs were made with the groups located east and west of the stacks, four runs with dark plumes and four with white plumes. Six of the runs were made with alternating dark and white plumes between 9: 30 and 11:OO a. m. The other runs were made between 12:30 and 1:15 p.m. A run consisted of 10 assessments, with each of the transmittance levels occurring twice in each run, Each run lasted about 15 minutes, The average assessments by the observers for the five transmittances of each run are shown in Figures 16 and 17, for white and dark plumes, respectively. The assessments were made in terms of Ringelmann numbers for the dark plumes and equivalent Ringelmann
0 F SMOKE -STACK PLUMES 23
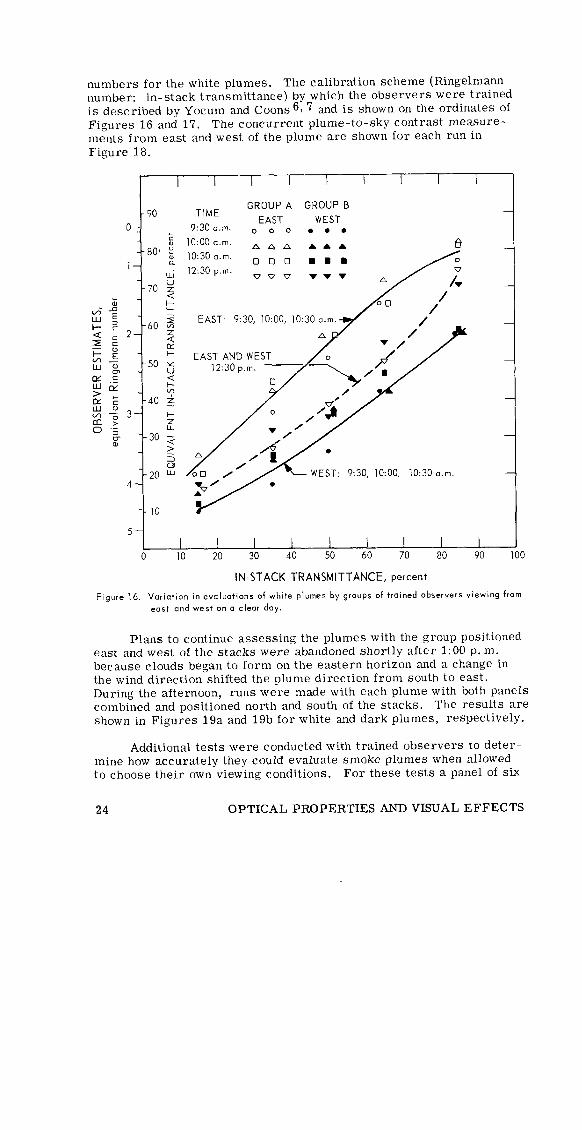
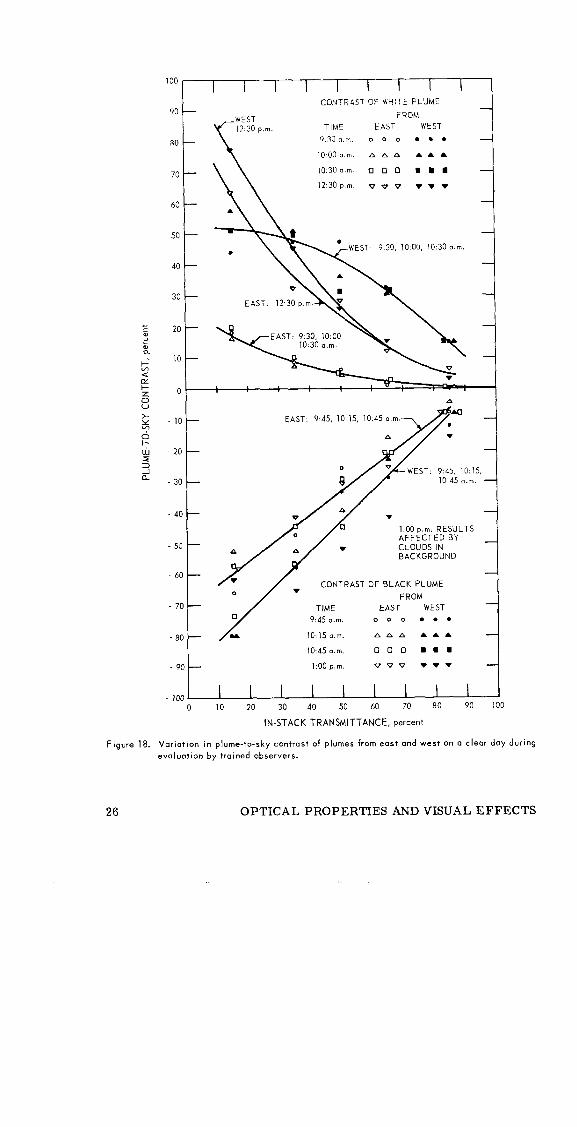
numbers for the white plumes. The calibration scheme (Ringelmann number: in-stack transmittance) by which the observers were trained is described by Yocum and Coons 6, 7 and is shown on the ordinates of Figures 16 and 17. The concurrent plume-to-sky contrast measure- ments from east and west of the plume are shown for each run in Figure 18.
I I I I I I I
- 90
0:
-70
z
-f - 2 -60 E 2-
z - -z -50
z? iz
i -40
5 3- .?
CT -- 30
TIME GROUP A GROUP B
EAST WEST r:30 a.m. o o o . . .
lo:oo a.m. AAA AAA t3 10:30 a.m.
0 0 0 n n l 12:30 p.m.
vv v VW- A
EAST: 9:30, lO:OO, lo:30 a.m.
FAST AND WEST
WEST: 9:30, l@nn JO:30 r-0
o.m
0 10 20 30 40 50 60 70 80 90
! IN-STACK TRANSMITTANCE, perceni
Figure 16. Variation in evaluations of white plumes by groups of trained observers viewing from
east and west on o clear day.
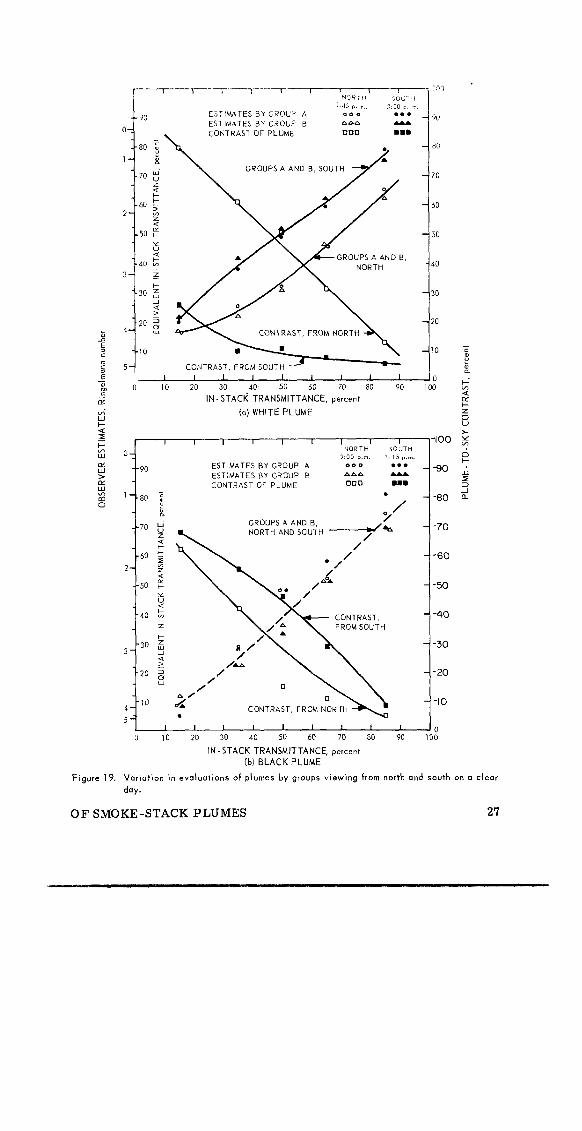
Plans to continue assessing the plumes with the group positioned east and west of the stacks were abandoned shortly after 1:00 p.m. because clouds began to form on the eastern horizon and a change in the wind direction shifted the plume direction from south to east. During the afternoon, runs were made with each plume with both panels combined and positioned north and south of the stacks. The results are shown in Figures 19a and 19b for white and dark plumes, respectively.
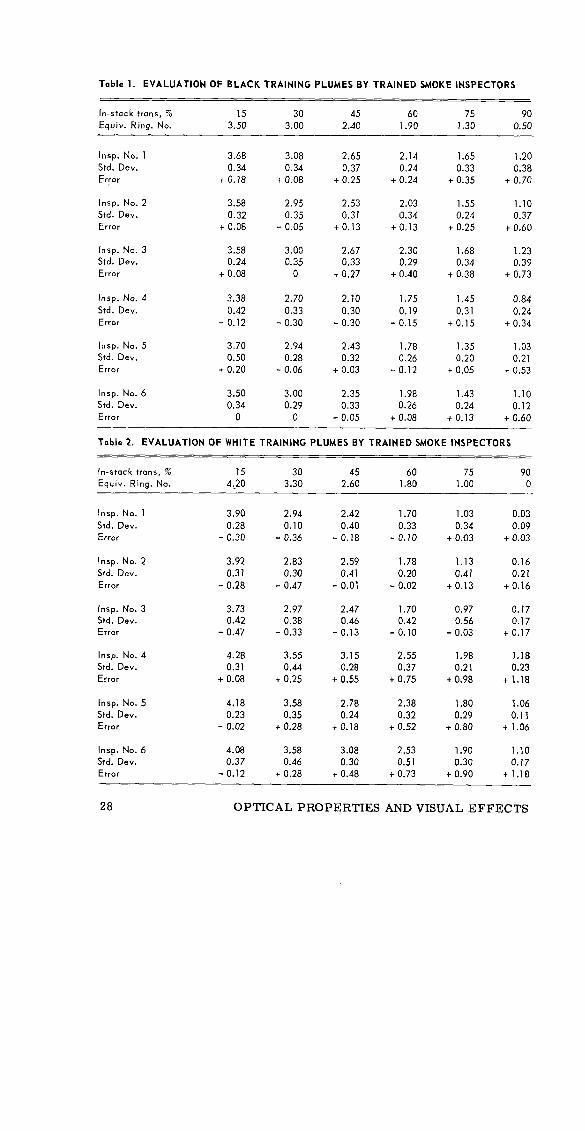
Additional tests were conducted with trained observers to deter- mine how accurately they could evaluate smoke plumes when allowed to choose their own viewing conditions. For these tests a panel of six
OPTICAL PROPERTIES AND VISUAL EFFECTS

observers were shown black and white plumes with in-stack transmit- tances of 15, 30, 45, 60, 75, and 90 percent. As before, the plumes were generated in random sequence and on signal the observers assessed the plumes. Five runs were made, each consisting of 12 assessments with each of the transmittance levels occurring twice in each run. No
restriction was placed on viewing direction. The tests were conducted near noon. Results are given in Tables 1 and 2, which show the mean of the IO estimates by each inspector for the six transmittances assessed with both plumes, the standard deviation of the estimates from the mean, and the error of the mean.
EAST: 9:45, 10:15, lo:45 a.m.
EAST AND WEST: 1:OO p.m.
WEST: 9:45, 10:15, lo:45 a.m.
GROUP A GROUP B
9:45 a.m. 0 o 0 l l l
10: 15 a.m. AAA AAA
10:45 a.m. 0 Cl 0 l DD 1:oo p.m. vvv www
5 I I I I I I I I
0 10 20 30 40 50 60 70 80 90 100
IN-STACK TRANSMITTANCE, percent
Figure 17. Variation in evaluations of block plumes by groups of trained observers viewing from east and west on a clear day.
These tests of trained observers show that the observers that viewed white plumes on a clear day facing the sun assessed the plumes at a higher Ringelmann number (lower transmittance) than did observ- ers that viewed the plumes with the sun to their backs. For darker
plumes, the effect was less pronounced. Group assessments showed good agreement for similar sun-plume-viewer geometries.
OF SMOKE-STACK PLUMES 25
. . . ..-. --.-~--_ ..--
100 1 I I I I 1
I CONTRAST OF VrHlTE PLUME
FROhl
TIME EAST WEST
9:30o.m 0 0 0 . . .
10.00 a.m. AfTA‘ **.
70 IO:30 a.m. 000 n l l
12:30 p.m. oov . . .
60
WEST, 9:30, 10.00, 10.30 a.m.
2 - 10 -
d t-
-2o- s.i
2 - 30 -
40 -
-50 -
60 -
70 -
80 -
90 -
EAST. 9:45, 10 15, lo:45 a.m.
&J7rM 1
WEST: 9:45, 10.15,
. 1:00 p.m. RESULTS AFFECTED BY CLOUDS IN BACKGROUND
CONTRAST OF BLACK PLUME .
FROM
TIME EAST WEST
9:45 a.m. 0 0 0 . . l
10.15 a.m. noA . . .
10:45 0.m. 0 0 0 l mm
l:oo p.m. vov . . .
- ml I I I I I I 0 10 20 30 40 50 60 70 80 90 100
IN-STACK TRANSMITTANCE, percent
Figure 18. Variation in plume-to-sky contrast of plumes from east and west on (1 clear day during
evaluation by trained observers.
26 OPTICAL PROPERTIES AND VISUAL EFFECTS
7”
ESTIMATES BY GROUP B PPP - 0
_. ’ CONTRAST OF PLUME on0 8Drn
80 i
l- L
-70 ;;
$ - E
4 ,20 2 - w
--10
S-
GROUPS A AND B. SOUTH
CONTRAST, FROM NORTH
CONTRAST, FROM SOUTH
- 80
- 60
- 50
-40
-30
- 20
0 10 20 30 40 50 60 70 80 90
IN STACk TRANSMITTANCE, percent
(a) WHITE PLUME
I I I I I 5 I I I
O- NORTH SOUTH
2:oo p.m. 3: 15 p.m.
--90 ESTIMATES BY GROUP A 000 . . .
ESTIMATES BY GROUP B hhP &AA
CONTRASTOF PLUME q nn ,..
l--80 ;
% --70 pj GROUPS A AND B,
7 K NORTH AND SOUTH
4 10 x CONTRAST, FROM NORTH
‘r .
E .I00 2
e -90 u; 5
-80 2
-70
-60
-50
-40
-30
-20
-10
0 0 '0 20 30 40 50 60 70 80 90 100
IN-STACK TRANSMITTANCE, percen+ (b) BLACK PLUME
Figure 19. Variation in evaluations of plumes by groups viewing from north and south on (1 clear
day.
OF SMOKE-STACK PLUMES 27
Tablel. EVALUATIONOF BLACKTRAININGPLUMESBY TRAINEDSMOKEINSPECTORS
In-stack % trons, 15 30 45 60 75 90
Equiv. Ring. No. 3.50 3.00 2.40 1.90 1.30 0.50
Imp. No. 1 3.68 3.08 2.65 2.14 1.65 1.20
Std. Dev. 0.34 0.34 0.37 0.24 0.33 0.38
Error t 0.18 t 0.08 + 0.25 + 0.24 t 0.35 + 0.70
Imp. No. 2 3.58 2.95 2.53 2.03 1.55 1.10
Std. Dev. 0.32 0.35 0.31 0.34 0.24 0.37
Error + 0.08 - 0.05 t 0.13 t 0.13 + 0.25 t 0.60
hp. No. 3 3.58 3.00 2.67 2.30 1.68 1.23
Std. Dev. 0.24 0.35 0.33 0.29 0.34 0.39
Error t 0.08 0 t 0.27 t 0.40 t 0.38 + 0.73
Insp. No. 4 3.38 2.70 2.10 1.75 1.45 0.84
Std. Dev. 0.42 0.33 0.30 0.19 0.31 0.24
Error - 0.12 - 0.30 - 0.30 - 0.15 to.15 t 0.34
hp. No. 5 3.70 2.94 2.43 1.78 1.35 1.03
Std. Dev. 0.50 0.28 0.32 0.26 0.20 0.21
Error + 0.20 - 0.06 + 0.03 - 0.12 t 0.05 t 0.53
Imp. No. 6 3.50 3.00 2.35 1.98 1.43 1.10
Std. Dev. 0.34 0.29 0.33 0.26 0.24 0.12
Error 0 0 - 0.05 + 0.08 + 0.13 t 0.60
Table2. EVALUATION OF WHITE TRAINING PLUMES BY TRAINED SMOKE INSPECTORS
In-stack trans, % 15 30 45 60 75 90
Equiv. Ring. No. 4,20 3.30 2.60 1.80 1.00 0
Imp. No. 1 3.90 2.94 2.42 1.70 1.03 0.03
Std. Dev. 0.28 0.10 0.40 0.33 0.34 0.09
Error - 0.30 - 0.36 - 0.18 - 0.10 t 0..03 + 0.03
Insp. No. 2 3.92 2.83 2.59 1.78 1.13 0.16
Std. Dev. 0.31 0.30 0.41 0.20 0.41 0.21
Error - 0.28 - 0.47 - 0.01 - 0.02 t 0.13 t 0.16
Imp. No. 3 3.73 2.97 2.47 1.70 0.97 0.17
Std. DE-V. 0.42 0.38 0.46 0.42 0.56 0.17 Error - 0.47 - 0.33 - 0.13 - 0.10 - 0.03 t 0.17
Imp. NO. 4 4.28 3.55 3.15 2.55 1.98 1.18
Std. Dev. 0.31 0.44 0.28 0.37 0.21 0.23
Error t 0.08 t 0.25 t 0.55 + 0.75 + 0.98 + 1.18
Insp. No. 5 4.18 3.58 2.78 2.38 1.80 1.06
Std. Dev. 0.23 0.35 0.24 0.32 0.29 0.11
Error - 0.02 + 0.28 + 0.18 + 0.52 t 0.80 t 1.06
hp. No. 6 4.08 3.58 3.08 2.53 1.90 1.10
Std. Dev. 0.37 0.46 0.30 0.51 0.30 0.17
Error - 0.12 t 0.28 t 0.48 t 0.73 t 0.90 + 1.10
28 OPTICAL PROPERTIES AND VISUAL EFFECTS

A similar series of tests conducted with white plumes on an overcast day did not show any variation with plume-viewing direction. This was to be expected, since on an overcast day the plume illumina- tion is not directional.
OPTICAL PROPERTIES OF SMOKE PLUMES
A Brief Outline of Scattering by Fine Particles
The optical properties of smokes could be studied to some extent without reference to their connection with the size, composition, and concentration of the constituent smoke particles; however, some knowl- edge of this connection is of great practical interest, and can aid in interpreting and understanding the observations.
If in the presence of an interposed aerosol the observing eye or instrument receives a flux F direct from a source of light (which can be a portion of sky or an object such as a lamp) and in the absence of the aerosol a flux F,, then the aerosol transmittance T is given by Bouguer’s law (often called the Lambert-Beer law), which may be written
T E i = exp (-naQt) 0
where n = the number of particles per unit volume of air in the light path of length t through the aerosol; a = the projected area of one of these particles; Q = the particle extinction coefficient or extinction- efficiency factor defined as
QE total flux scattered and absorbed by a particle flux geometrically incident on the particle
If particles of different sizes and extinction coefficients are present then a summation over all values of a and Q must be taken, or alternatively, appropriately taken average values a’and & must be taken, so the law may be written
T-exp(-txniaiQi)-exp(-naQt).
The product na& = K is sometimes called the turbidity coefficient or the extinction coefficient of the aerosol as a whole, and has the dimensions (length) -1.
The particle extinction coefficient or extinction efficiency factor Q depends on the particle refractive index relative to the surrounding medium, its shape, and its size relative to the wavelength usually expressed as r* z 7$, where d is the particle diameter and 1 is the wavelength of light in the medium surrounding it.
OF SMOKE-STACK PLUMES 29
Particles of transparent materials, i. e. , materials with negli- gible electrical conductivity, have real values for the refractive index,
e.g., 1. 33 for water, 1. 55 for quartz. Absorbing materials, i.e., those having appreciable conductivity, have a complex refractive index, e. g., (2 -i) for carbon (moderately absorbing) in much of the visible spectrum 16 or (0.89 - 2.23i) for copper at 5, 500 A. 17
In visible light, in air, Q 7 d4 when d 6 0.05 microns. This is the Rayleigh or dipole scattering regime for very small particles in which Q seldom exceeds lo- 2. When d = 2 microns, Q exceeds by less than 50 percent, sometimes by less than 10 percent, the limiting value 2 to which it tends at larger diameters. At larger diameters the total extinction by the particle, regardless of how it is divided between scattering and absorption and regardless of particle composition and shape, is simply proportional to its projected area. If the particle is a transparent sphere, then as d increases above 0.05 micron, Q rises, attains a maximum value about 3 or 4 somewhere between 2/3 and 1 micron diameter, and settles after some oscillation to the limiting value 2 (Figure 20, curves A and B). With an irregular transparent particle averaged over all orientations (rotational Brownian motion physically accomplishes this), the Q curve settles to 2 after passing through a simple maximum whose position and size depend on the par- tic le shape. For an absorbing particle of any shape, Q settles to 2 without oscillation and with only a weak maximum or none, completing the rise when 2 1 l/2 to 1 (Figure 20, curve C).
The Q curves for transparent, non-spherical particles averaged over all orientations resemble those for absorbing particles, except that the rise is slower than with transparent spheres. The maximum is less marked the more irregular the particle shape. I8
Thus, if the aerosol transmittance is found not to vary with wave- length, its projected-area-concentration na or n5 can be deduced from Bouguer’s law taking Q = 2 without serious error, and without needing to know its particle size or composition. If the transmittance does vary with wavelength, then an estimate of size and area-concentration can be derived by fitting measurement at two wavelengths to the theoretical curves of Q; the better the particle composition is known, the more accurate the estimate.
It is interesting to express the Bouguer law also in terms of the mass concentration of the particles, Cn,=nsPd3/6, where P and d are the density and diameter of the particles in consistent units, giving for monodisperse particles
T = exp ( - 3CmQt/2Pd).
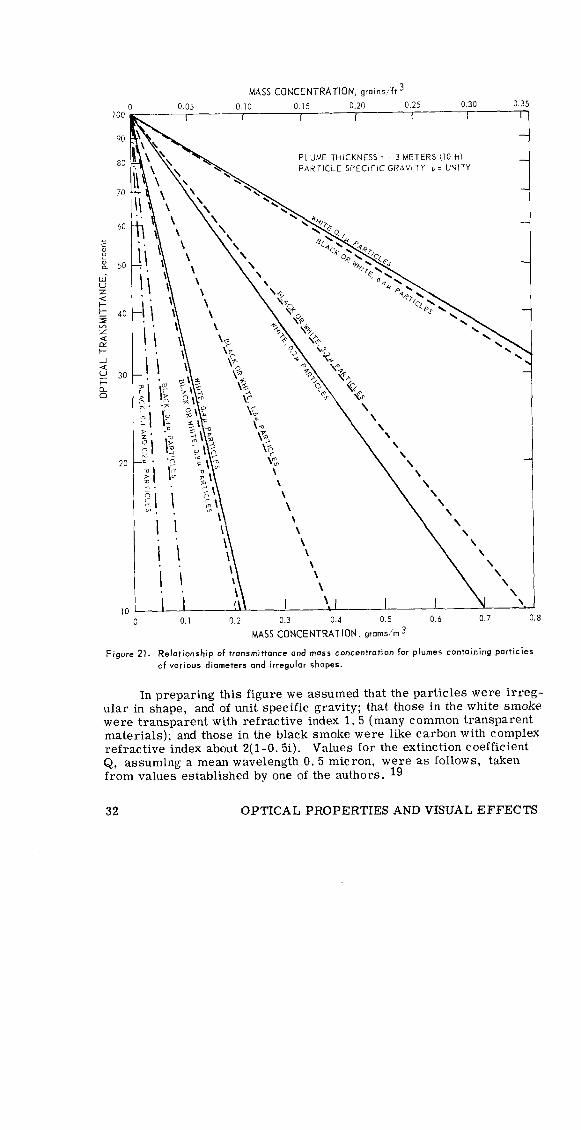
Even when Q = 2 and the mass-concentration is constant, the transmit- tance will decrease with decreasing particle size. A family of curves showing the relation between plume transmittance and mass concentra- tion in a plume 3 meters in diameter with black and white particles of different sizes is shown in Figure 21.
30 OPTICAL PROPERTIES AND VISUAL EFFECTS

OF
I I I - - , -4 %.I N
D ‘lN313143303 NOIL3NllX3
SMOKE-STACK PLUMES 31
MASS CONCENTRATION, graitdft 3
\ \\
' ' ' ' '1
h'
L\ -
I----
PLUME THICKNESS + = 3 METERS (IO ft)
ii
PARTICLE SPECIFIC GRAVITY P = UNITY
II
Q \ 1 , I I
I
\ \ \ \ \ \ \
\ \
\ . I I \ \ \
i i ii
0 0.1 0.2 0.3 0.4 0.5 0.6 u./ U.8
MASS CONCENTRATION, grams/m 3
Figure 21. Relationship of transmittance and mass concentration for plumes containing particles
of various diameters and irregular shapes.
In preparing this figure we assumed that the particles were irreg- ular in shape, and of unit specific gravity; that those in the white smoke were transparent with refractive index 1.5 (many common transparent materials); and those in the black smoke were like carbon with complex refractive index about 2(1-O. 5i). Values for the extinction coefficient Q, assuming a mean wavelength 0.5 micron, were as follows, taken from values established by one of the authors. 19
32 OPTICAL PROPERTIES AND VISUAL EFFECTS
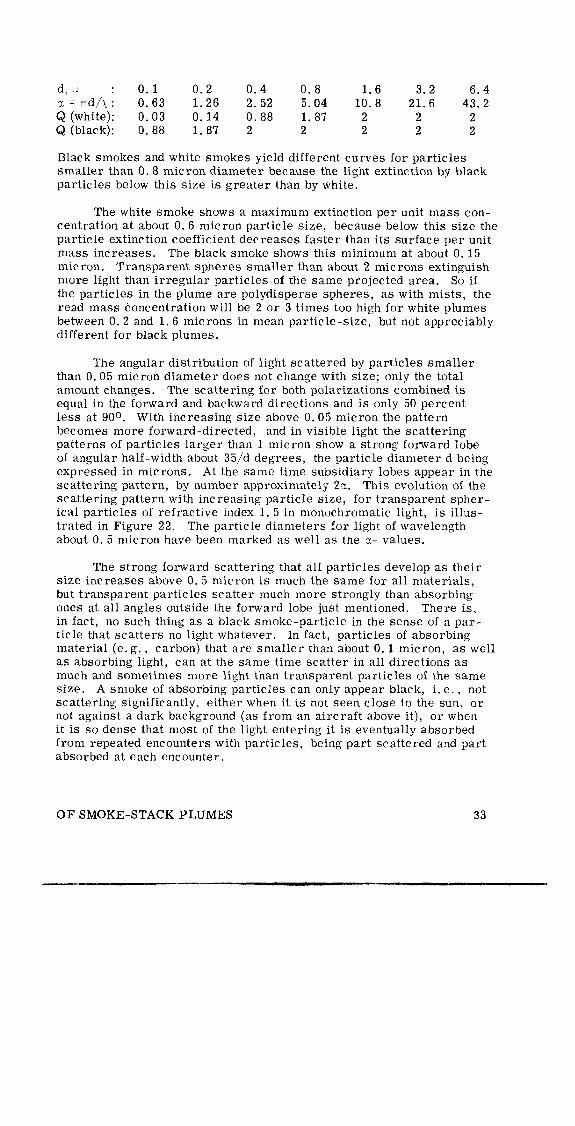
d,cl : 0.1 0.2 0.4 0.8 1.6 3. 2 6.4 z = rrd/i : 0.63 1. 26 2. 52 5.04 10. 8 21. 6 43.2 Q (white): 0.03 0.14 0.88 1. 87 2 2 2 Q (black): 0.88 1.87 2 2 2 2 2
Black smokes and white smokes yield different curves for particles smaller than 0.8 micron diameter because the light extinction by black particles below this size is greater than by white.
The white smoke shows a maximum extinction per unit mass con- centration at about 0. 6 micron particle size, because below this size the particle extinction coefficient decreases faster than its surface per unit mass increases. The black smoke shows this minimum at about 0.15 micron. Transparent spheres smaller than about 2 microns extinguish more light than irregular particles of the same projected area. So if the particles in the plume are polydisperse spheres, as with mists, the read mass concentration will be 2 or 3 times too high for white plumes between 0.2 and 1.6 microns in mean particle-size, but not appreciably different for black plumes.
The angular distribution of light scattered by particles smaller than 0.05 micron diameter does not change with size; only the total amount changes. The scattering for both polarizations combined is equal in the forward and backward directions and is only 50 percent less at 900. With increasing size above 0. 05 micron the pattern becomes more forward-directed, and in visible light the scattering patterns of particles larger than 1 micron show a strong forward lobe of angular half-width about 35/d degrees, the particle diameter d being expressed in microns. At the same time subsidiary lobes appear in the scattering pattern, by number approximately 2%. This evolution of the scattering pattern with increasing particle size, for transparent spher- ical particles of refractive index 1. 5 in monochromatic light, is illus- trated in Figure 22. The particle diameters for light of wavelength about 0. 5 micron have been marked as well as the a- values.
The strong forward scattering that all particles develop as their size increases above 0. 5 micron is much the same for all materials: but transparent particles scatter much more strongly than absorbing ones at all angles outside the forward lobe just mentioned. There is, in fact, no such thing as a black smoke-particle in the sense of a par- ticle that scatters no light whatever. In fact, particles of absorbing material (e.g., carbon) that are smaller than about 0. 1 micron, as well as absorbing light, can at the same time scatter in all directions as much and sometimes more light than transparent particles of the same size. A smoke of absorbing particles can only appear black, i. e., not scattering significantly, either when it is not seen close to the sun, or not against a dark background (as from an aircraft above it), or when it is so dense that most of the light entering it is eventually absorbed from repeated encounters with particles, being part scattered and part absorbed at each encounter.
OF SMOKE-STACK PLUMES 33

In white light the oscillations in the angular scattering pattern of a spherical particle (Figure 22) would be diminished because of the smoothing over a range of 12 -values, and a range in particle size would have the same effect. The angular scattering patterns for an assembly of irregular particles in random orientation are similar to those of an assembly of spheres of similar size-range in white light. Even with such smoothing, there remain large differences between the patterns of particles with different refractive indices. Figures 23 and 24 show how the intensities of scattering through 4S” and 90°, respectively, by single spheres vary with particle size and refractive index. 2O The curve for the complex refractive index (2 - i) would be appropriate for carbon; a curve for water, 1. 33, may be interpolated between the curves for 1.2 and 1.4; and many transparent minerals, such as quartz, have a refractive index about 1.6.
The angular scattering pattern of an assembly of particles, such as portion of a smoke plume, is given by the sum of the patterns of the individual particles in it only so long as its transmittance exceeds at least 80 percent. The lower the transmittance, the greater is the proportion of light that is scattered more than once before emerging from the plume. This secondary scattering modifies the overall scat- tering pattern, reducing the angular variation and especially the forward lobe. The scattering process at the individual particles in the plume is not affected by increasing particle concentration until the mean inter- particle distance is reduced to a few particle diameters; these condi- tions could not persist in an aerosol because of the rapid coagulation that would ensue even if it arose.
20 60 ,dO 180 20 60 100 140 ‘80
SCATTERING ANGLE, degrees
Figure 22. Scattering by transparent spheres, calculated from Mie theory.
34 OPTICAL PROPERTIES AND VISUAL EFFECTS

For a fuller account of light scattering, one may refer to the review by Hodkinson 13 and the theoretical treatise of Van de Hulst. 17 Because the angular scattering phenomena are much more complex than the extinction phenomena, it is considered impracticable to evalu- ate plumes by measurements of scattered light, whether from natural or artificial sources.
I
0.1
0.01
0.001
:
*-,. . . . .
. -
2-i
ULATED FROM REFRACTION
1.6 -----mm
1.8 -.- . -
2.0 -..-.*
2.4 ----
: : PARTICLE DIAMETER FOR MEAN A- 0.5 micron
O.S# 11 511 JOEI I I I I
1 10 100
PARTICLE SIZE PARAMETER ( LI =+)
Figure 23. Scattering at 45 degrees by transparent spheres in white light, calculated from Mie theory.
OF SMOKE-STACK PLUMES 35

. . . . . . . . . . . . . . . . . . . . - SCATTERING CALCULATED FROM REFRACTION AND REFLECTION
I , 2 . . . . . w . . . . .
1.4 . ..v...-...
-.-.-.
PARTICLE DIAMETER FOR MEAN X = 0.5 micron
PARTICLE SIZE PARAMETER (a =+)
Figure 24. Scattering a+ 90 degrees by transparent spheres in white light, calculated from Mle
theory.
Transmittance-Wavelength (Characteristics of the
Experimental Plumes
The out-of-stack transmittances of the plumes were determined by viewing a 500-watt incandescent reflecting flood lamp through the
36 OPTICAL PROPERTIES AND VISUAL EFFECTS

plumes with the telephotometer. This procedure permitted direct out- of-stack transmittance measurements in daylight because the intensity of the lamp was high enough that the light scattered by the plume was negligible when the sun was not directly behind the plumes. Without interference from scattered light, the transmittance is given by the ratio of the telephotometer reading of the lamp sighted through the plume to the telephotometer reading of the lamp sighted clear of the plume, The transmittance measurements were made for white light by using the telephotometer with the visual correction filter and for blue (No. 4’7), green (No. 58), and red (No. 29).
The effective overall spectral distribution of the telephotometer with the color filters and lamp was measured with the aid of the mono- chromator by using the telephotometer lP22 phototube with each of the three filters. The relative distributions are shown in Figure 25. The mean responses (r) of the distributions were calculated from the rela- tion
c RiXi
;~ =- ; i Ri i
where Ri is the spectral response at the corresponding wavelength 7 i. The mean responses of the telephotometer to the flood lamp with blue, green, and red filters were at the wavelengths 0.438, 0. 531, and 0. 651 micron, respectively.
300 400 500 600 700
WAVE LENGTH, mllamicron.
Figure 25. Effective spectral response of telephotometer-filter-lamp combinations used for plume
transmittance measurements.
OF SMOKE-STACK PLUMES 37

For the measurements on the black and white experimental plumes, the lamp (12-cm diameter) was placed about 3 meters behind the plumes and the telephotometer was placed about 12 meters in front of the plumes. The out-of-stack transmittances of red, blue, green, and white light through the experimental white and black plumes are compared to concurrent measurements of in-stack white light trans- mittance in Figures 26 and 27, respectively.
100 ) I I I I I I I I I
60
40
20
0
WHITE LIGHT
BLUE LIGHT
GREEN LIGHT
/ /
I I I I I I I I I
0 20 40 60 80 100
IN - STACK TRANSMITTANCE, percent
Figure 26. White plume: transmittance measurements by tronsmissometer inside stock and telephotometer with color filters slghted on lamp outside stock.
The variation in transmittance with wavelength observed with these plumes shows that the particles are so small that the particle extinction coefficient (Q) varies with wavelength, i. e., they are on average smaller than about 1 micron.
Linear plots, as in Figures 26 and 27, give curved lines passing through the points (lOO%, 100%) and OS, 0%). A straight line (slope = 1) in Figures 26 and 27 results only when T2 = Tl, which is when 11 = 12, or when Q is independent of wavelength, i. e., for polydisperse smokes of particle-size exceeding about 1 micron.
38 OPTICAL PROPERTIES AND VISUAL EFFECTS
100
90
8.0
70
60
50
40
30
20
10
0
Figure
-
GREEN AND WHITE LIGHTS
0 10 20 30 40 50 60 70 80 90 100
IN-STACK TRANSMITTANCE, percent
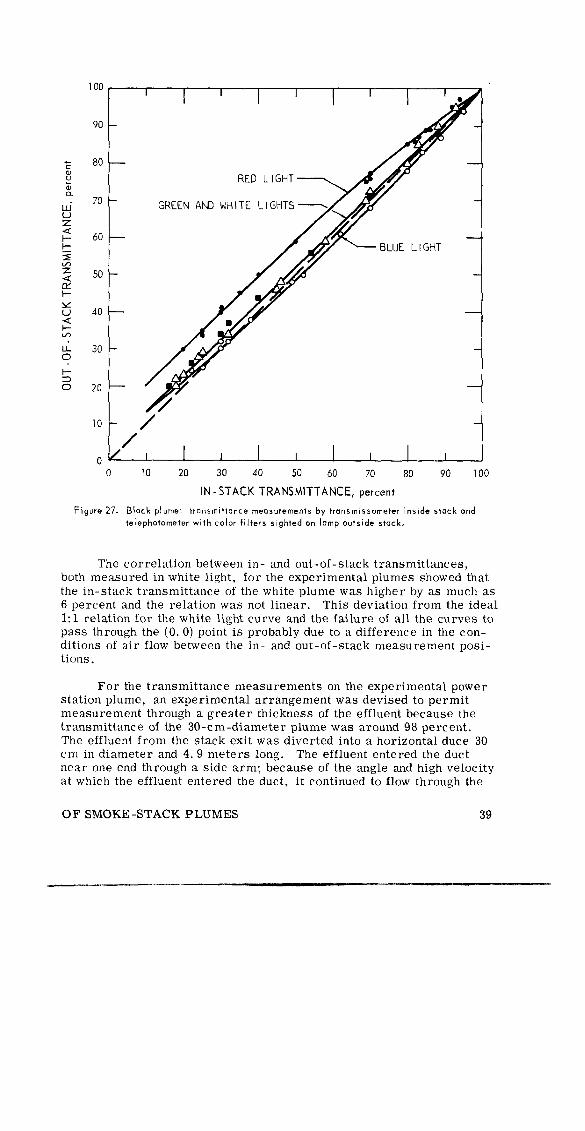
7. Black plume: transmittance measurements by transmissometer inside stack end
telephotometer with color filters sighted on lamp outside stock.
The correlation between in- and out-of-stack transmittances, both measured in white light, for the experimental plumes showed that the in-stack transmittance of the white plume was higher by as much as 6 percent and the relation was not linear. This deviation from the ideal 1:l relation for the white light curve and the failure of all the curves to pass through the (0, 0) point is probably due to a difference in the con- ditions of air flow between the in- and out-of-stack measurement posi- tions.
For the transmittance measurements on the experimental power station plume, an experimental arrangement was devised to permit measurement through a greater thickness of the effluent because the transmittance of the 30-cm-diameter plume was around 98 percent. The effluent from the stack exit was diverted into a horizontal duce 30 cm in diameter and 4.9 meters long. The effluent entered the duct near one end through a side arm; because of the angle and high velocity at which the effluent entered the duct, it continued to flow through the
OF SMOKE -STACK PLUMES 39
duct and out at the far end. By viewing the lamp through the duct, the observers measured transmission through a section of the effluent 5 meters long or more. The average transmittance measurements for four runs with blue, green, and red filters were 81. 5, 86.0, and 93,O percent, respectively.
Angular Scattering (Characteristics of’thr Experimental Plumes
The angular scattering patterns of the plumes were measured at night by viewing the plumes with the telephotometer while rotating a lamp around them. A lamp-holding mechanism was attached to the stack exits to permit the lamp to be rotated at a fixed distance from the center of the plumes in a plane normal to the direction of the plumes. The plumes were viewed along the lamp rotation plane and as close to the plumes as practicable to eliminate interference from light scattered by the intervening air between the telephotometer and plumes.
Before the angular scattering of the black and white plumes was measured, it was necessary to attach a 23-cm-diameter, 46-cm-length of duct to the stack exit to change its rectangular cross section to a circular one. For these measurements, a 500-watt flood lamp was rotated at a distance of 1. 2 meters from the center of the plumes and the telephotometer was located about 50 cm from the plumes. The angular scattering patterns of black and white experimental plumes with transmittances of 60 and 90 percent were measured in white light. Because of the low plume density of the experimental power plant plume, it was necessary to rotate two 250-watt spot lamps around the 30-cm- diameter plume at a distance of 1. 1 meters from its center. The scattering patterns are shown in Figure 28.
Optical Properties and Particle Sizes of Experimental Plumes
The mean particle sizes of the experimental plumes were esti- mated by fitting the ratios of the mean particle extinction coefficients of the plumes for red, green, and blue light to theoretical extinction curves plotted from Mie-theory computations for the correct refractive index. If the plume transmittances are Tl and T2 when measured at two different wavelengths 11 and X 2, it follows from Bouguer’s law that
Q 2 log, T2 = q loge T1
where Ql and Q2 are the mean particle extinction coefficients at Xl and
x2. Consequently, as the particle concentration is varied a log-log plot of T2 versus Tl would give a straight line of slope Q2/Ql through the point 1, 1 (1000/o, 100%).
If Tr, Tg, and Tb are the measured transmittances for red, green, and blue light, then from Bouguer’s law
40 OPTICAL PROPERTIES AND VISUAL EFFECTS

I I
l- 0
.I\ I I I I I
-\T
-
-
-
a A 60%
0 . 90%
0” 98%
TRANSMITTANCE
TRANSMITTANCE
TRANSMITTANCE
POWER STATION PLUME
‘NHITE (OILi PLUME
I J 30 60 90 120 150
SCATTERING ANGLE FROM FORWARD DIRECTION, degrees
Figure 28. Angular scattering measurements of experimental plumes.
180
OF SMOKE-STACK PLUMES 41

Qr : Qg : Qb = logeT, : IogeTg : 1ogeTb
where Qr, Qg, and Qb are the corresponding particle extinction coef- ficients. The corresponding ratios of the particle size parameters
dr, 59, and o.b are
cl : c :a =A -1 r g b r
: A -1 : Lb-l g
where A,, X and kb are the mean spectral responses of the tele- photometer a%d filter combinations used for the measurement.
To obtain the estimate, the theoretical curve of particle extinc- tion coefficient Q against particle size parameter 2 = -d/X is plotted on a log-log scale; on an identical graph sheet are plotted the points (log Tr/log Tr = 1, T/Xr), (log Tg./log Tr, ‘/Xg), and (log Tb/log Tr, rr,/Xb); the second sheet is slid over the first, with the axes kept paral- lel until the three points are fitted to the portion of the theoretical curve with the appropriate curvature; then the correspondence of the loga- rithmic abscissae of rd/Aand 7/h. gives the value of particle diameter d. With this value of d the actual value of Q for any of the wavelengths may be read from the theoretical curve for the appropriate ~1 and hence the projected-area concentration also derived, from Bouguer’s equation.
A second estimate of the particle sizes of the plumes was obtained by comparing the angular scattering patterns of the plumes with theo- retical patterns for different particle sizes plotted from Mie-theory computations (Appendix A),
Transmittance-Wavelength Chararteristics and Particle-Size of the White (oil) Plume
The published Mie-theory extinction computations for spherical particles that came nearest to the refractive index of the oil, approx- imately 1.45, were those for 1.44 by Penndorf 21 and are plotted as the dashed curve in Figure 29. Since the droplets were not monodis- perse but ranged in size, a sliding average of this extinction curve was taken over a 2-to-1 range in diameter for an equal number frequency of particles through this range. If the range is considered to run from 2D/3 to 4D/3 with a frequency of 1 particle per unit size-range, then the area-mean particle diameter is given by
d; = J2$,'" D2dD +J ,$(” dD = ; D2 3
da = 1.02D zD.
The area-mean diameter is the appropriate measure of mean particle size because the particle extinction coefficient Q is defined with respect
42 OPTICAL PROPERTIES AND VISUAL EFFECTS
MIE THEORY FOR REFRACTIVE INDEX
1.44 AFTER PENNDORF
/ SINGLE SPHERES, DIAM d 7
/
AVERAGEDOVER 2:l DlAhl
RANGE OF SPHERES, AREA-MEAN DIAM d
/I / :
/
//
: PLOT OF TRANSMITTANCE
DATA FOR SLIDING OVER Q: =CLlRVE
IN -STACK
i TRANSMITTANCE
/
:
:
/
3 s
I I I III
l 80
. 70
. 60
/ 2 .50 -
B l 40
/ :
0 l 30
l 20
0 ;
t
4 5 67 8 910
WA,/4 -’
I .I I I I I
I-
0.1 - I I I I I I III
IO I I I I I I I I I
l-l 1 1.5 PARIlL 2.5
SIZE PAR&R 3 (a%; 7 8 910
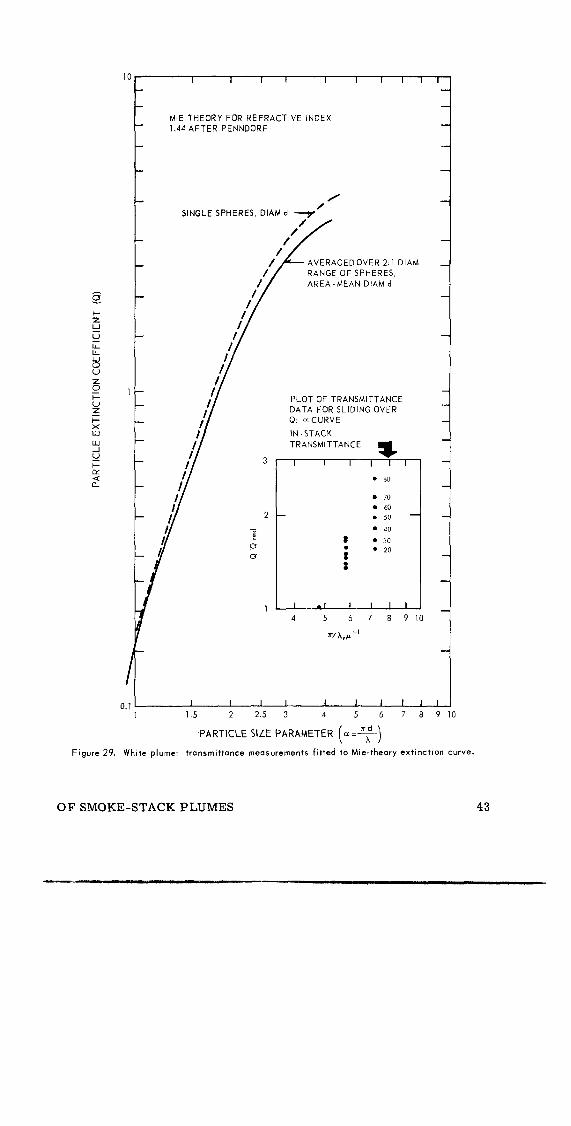
Figure 29. White plume: transmittance measurements fitted to Mie-theory extinction curve.
OF SMOKE-STACK PLUMES 43
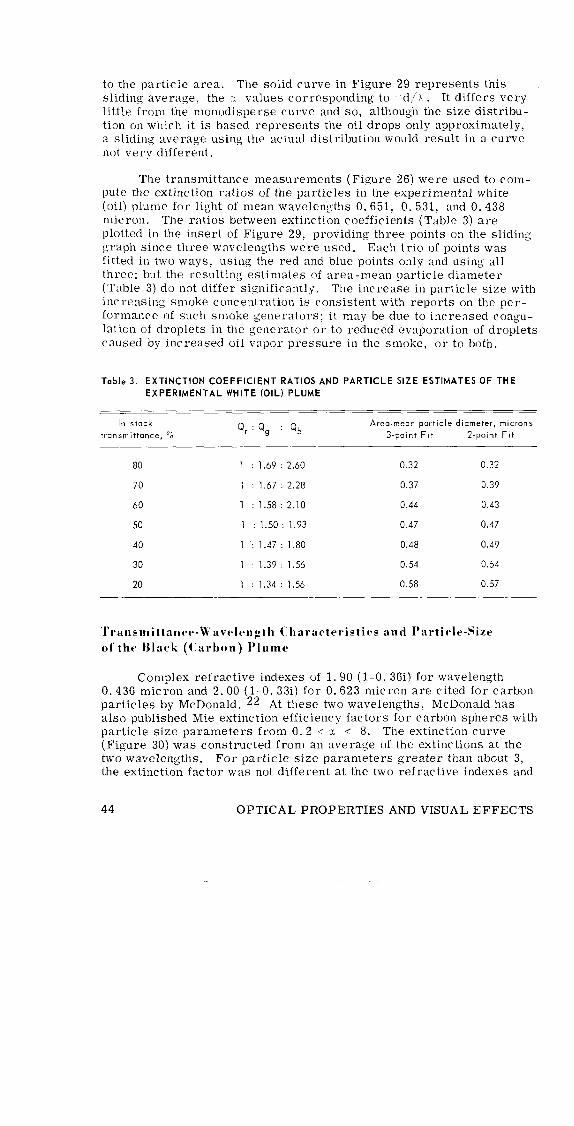
to the particle area. The solid curve in Figure 29 represents this sliding average, the ‘1 values corresponding to -id/X. It differs very little from the monodisperse curve and so, although the size distribu- tion on which it is based represents the oil drops only approximately, a sliding average using the actual distribution would result in a curve not very different.
The transmittance measurements (Figure 26) were used to con- pute the extinction ratios of the particles in the experimental white (oil) plume for light of mean wavelengths 0. 651, 0. 531, and 0.438 micron. The ratios between extinction coefficients (Table 3) are plotted in the insert of Figure 29, providing three points on the sliding graph since three wavelengths were used. Each trio of points was fitted in two ways, using the red and blue points only and using all three: but the resulting estimates of area-mean particle diameter (Table 3) do not differ significantly. The increase in particle size with increasing smoke concentration is consistent with reports on the per- formance of such smoke generators; it may be due to increased coagu- lation of droplets in the generator or to reduced evaporation of droplets caused by increased oil vapor pressure in the smoke, or to both.
Table 3. EXTINCTION COEFFICIENT RATIOS AND PARTICLE SIZE ESTIMATES OF THE
EXPERIMENTAL WHITE (OIL) PLUME
In-stack
transmittance, % Qr : Q, : Qb
Area-mean port~cle diameter, microns
3-point Fit 2.point Fit
80 1 : 1.69 2.60 0.32 0.32
70 1 : 1.67 2.28 0.37 0.39
60 1 : 1.58 2.10 0.44 0.43
50 1 : 1.50 1.93 0.47 0.47
40 1 .: 1.47 1.80 0.48 0.49
30 1 1.39 1.56 0.54 0.54
20 1 : 1.34 1.56 0.58 0.57
Transmittancr-~avclen:rth Cherarteristics and Partirle-Size ot’the Black ((:arhon) Plume
Complex refractive indexes of 1.90 (1-O. 36i) for wavelength 0. 436 micron and 2.00 (1-O. 33i) for 0.623 micron are cited for carbon particles by McDonald, 22 At these two wavelengths, McDonald has also published Mie extinction efficiency factors for carbon spheres with particle size parameters from 0. 2 < z 6 8. The extinction curve (Figure 30) was constructed from an average of the extinctions at the two wavelengths. For particle size parameters greater than about 3, the extinction factor was not different at the two refractive indexes and
44 OPTICAL PROPERTIES AND VISUAL EFFECTS

was only slightly different below 3. As with the white plume the extinc- tion curve was averaged over a 2:l range in particle diameters.
The extinction coefficients of the particles in the black plume - computed from the transmittance measurements of Figure 27 - did not vary with plume density as did the coefficients of the white plume. Con- sequently, an average of the extinction ratios at in-stack transmittance intervals of 10 percent gave 1: 1.23: 1. 37 as the extinction ratios of the particles in the black plume for light of wavelengths 0. 651, 0. 531, and 0.438 micron. The extinction size parameter ratios are plotted in the insert of Figure 30. The points were fitted to the averaged Mie-theory curve in the manner described above and gave an area-mean particle diameter estimate of 0. 23 micron for the black experimental plume.
10 I I II I IIIlll I I II I IIll-
AT POSITION OF BEST FIT d = 0 23~
MIE THEORY CURVE AVERAGE OF INDEXES 1.90 (l-O.36 11 AND 2.00 (1.0.33 i)
o., I III I111111 I III IIIIIJ
0.1 .I5 .2 .25 .3 .4 .5 .6 7 .a .9 l.C 1.5 2 2.5 3 4 5 6 789
PARTICLE SIZE PARAMETER (e =F)
Figure 30. Block pl ume: transmittance measurements fitted to Mle-theory extinction curve.
OF SMOKE-STACK PLUMES 45
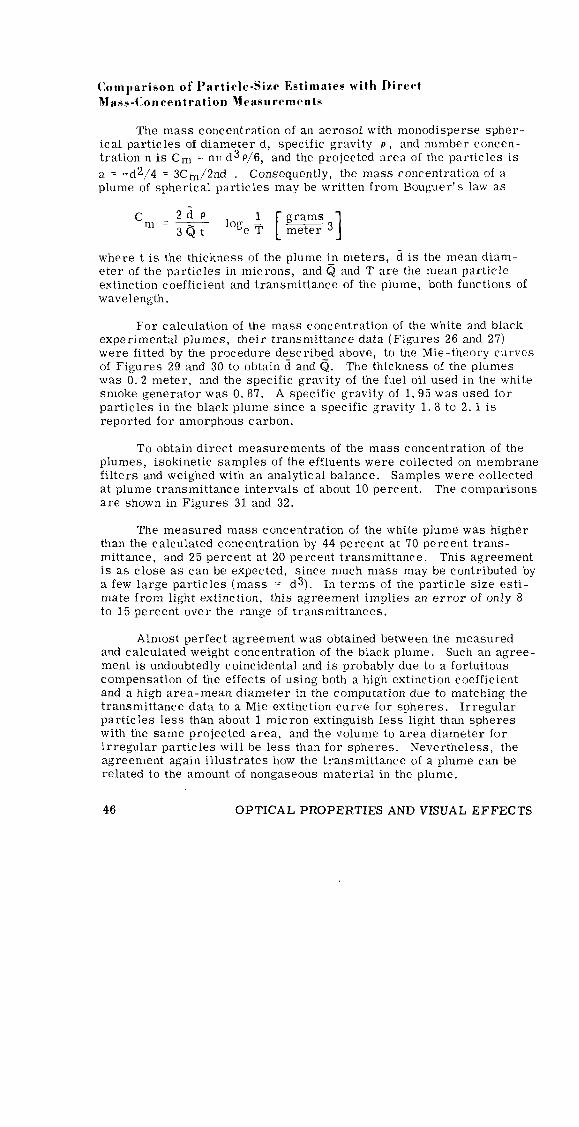
Comparison of’ Particle-Size Estimates with Direct
Mass-Conrentration Measurements
The mass concentration of an aerosol with monodisperse spher- ical particles of diameter d, specific gravity P, and number concen- tration n is Cm = nn d3 p/6, and the projected area of the particles is
a = vd2,/4 = 3Cm/2nd . Consequently, the mass concentration of a plume of spherical particles may be written from BouLqer’s law as
C 2d P
In = 3$t loge; [gg3]
where t is the thickness of the plume in meters, d is the mean diam- eter of the particles in microns, and Q and T are the mean particle extinction coefficient and transmittance of the plume, both functions of wavelength.
For calculation of the mass concentration of the white and black experimental plumes, their transmittance data (Figures 26 and 27) were fitted by the procedure described above, to the Mie-theory curves of Figures 29 and 30 to obtain d and Q. The thickness of the plumes was 0. 2 meter, and the specific gravity of the fuel oil used in the white smoke generator was 0. 87. A specific gravity of 1.95 was used for particles in the black plume since a specific gravity 1. 8 to 2. 1 is reported for amorphous carbon.
To obtain direct measurements of the mass concentration of the plumes, isokinetic samples of the effluents were collected on membrane filters and weighed with an analytical balance. Samples were collected at plume transmittance intervals of about 10 percent. The comparisons are shown in Figures 31 and 32.
The measured mass concentration of the white plume was higher than the calculated concentration by 44 percent at 70 percent trans- mittance, and 25 percent at 20 percent transmittance. This agreement is as close as can be expected, since much mass may be contributed by a few large particles (mass = d3). In terms of the particle size esti- mate from light extinction, this agreement implies an error of only 8 to 15 percent over the range of transmittances.
Almost perfect agreement was obtained between the measured and calculated weight concentration of the black plume. Such an agree- ment is undoubtedly coincidental and is probably due to a fortuitous compensation of the effects of using both a high extinction coefficient and a high area-mean diameter in the computation due to matching the transmittance data to a Mie extinction curve for spheres. Irregular particles less than about 1 micron extinguish less light than spheres with the same projected area, and the volume to area diameter for irregular particles will be less than for spheres. Nevertheless, the agreement again illustrates how the transmittance of a plume can be related to the amount of nongaseous material in the plume.
46 OPTICAL PROPERTIES AND VISUAL EFFECTS

90
80
70
60
50
40
30
20
I I I I I I I I I I I
MEASURED BY DIRECT SAMPLING
CALCULATED FROM PLUME TRANSMITTANCE
0 .I .2 .3 .4 .5 .6 .7 .8 .9 1.0 1.1 1.2
MASS CONCENTRATION, grams/m3
Figure 31. Mass concentration of white plume CIS calculated from transmittance and measured by
direct sampling.
OF SMOKE-STACK PLUMES 47

100
90
80
70
60
1C
n An - CALCULATED FROM LIGHT TRANSMISSION DATA
0 0 0 - MEASURED BY DIRECT SAMPLING
MASS CONCENTRATION, groms/m3
Figure 32. Mass concentration of black plume as calculated from transmittance and measured by
direct sampling.
48 OPTICAL PROPERTIES AND VISUAL EFFECTS
Transmittance-Wavelength (Iharacteristirs and Particle-Size
of the Oil-Burning Power Station Plume
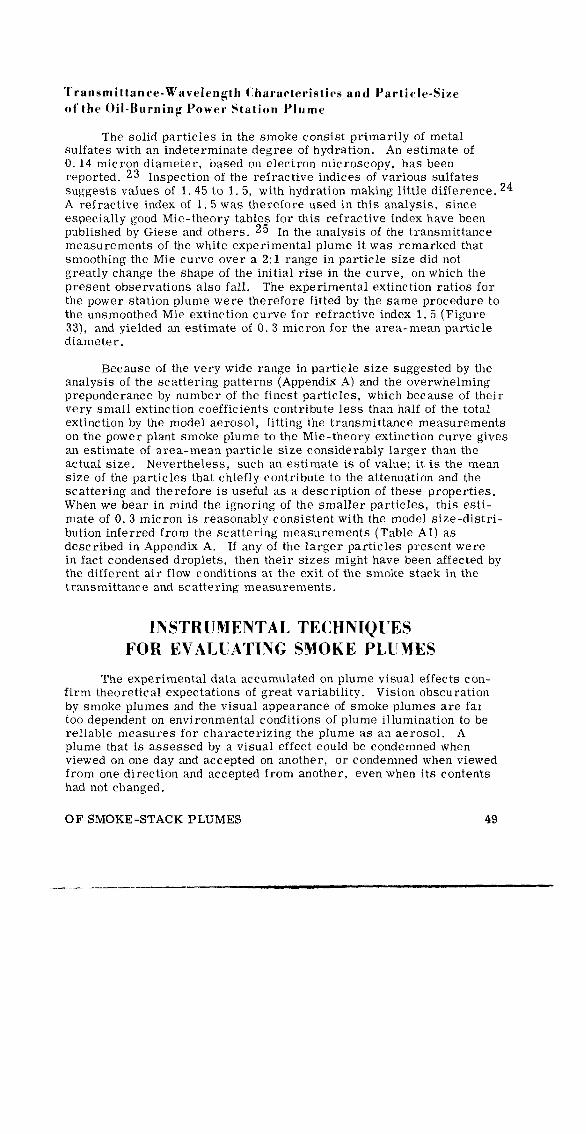
The solid particles in the smoke consist primarily of metal sulfates with an indeterminate degree of hydration. An estimate of 0.14 micron diameter, based on electron microscopy, has been reported. 23 Inspection of the refractive indices of various sulfates suggests values of 1. 45 to 1. 5, with hydration making little difference. 24 A refractive index of 1. 5 was therefore used in this analysis, since especially good Mie-theory tables for this refractive index have been published by Giese and others. 25 In the analysis of the transmittance measurements of the white experimental plume it was remarked that smoothing the Mie curve over a 2:l range in particle size did not greatly change the shape of the initial rise in the curve, on which the present observations also fall. The experimental extinction ratios for the power station plume were therefore fitted by the same procedure to the unsmoothed Mie extinction curve for refractive index 1. 5 (Figure 33), and yielded an estimate of 0. 3 micron for the area-mean particle diameter.
Because of the very wide range in particle size suggested by the analysis of the scattering patterns (Appendix A) and the overwhelming preponderance by number of the finest particles, which because of their very small extinction coefficients contribute less than half of the total extinction by the model aerosol, fitting the transmittance measurements on the power plant smoke plume to the Mie-theory extinction curve gives an estimate of area-mean particle size considerably larger than the actual size. Nevertheless, such an estimate is of value; it is the mean size of the particles that chiefly contribute to the attenuation and the scattering and therefore is useful as a description of these properties. When we bear in mind the ignoring of the smaller particles, this esti- mate of 0. 3 micron is reasonably consistent with the model size-distri- bution inferred from the scattering measurements (Table Al) as described in Appendix A. If any of the larger particles present were in fact condensed droplets, then their sizes might have been affected by the different air flow conditions at the exit of the smoke stack in the transmittance and scattering measurements.
INSTRUMENTAL TECHNIQUES FOR EVALUATING SMOKE PLUMES
The experimental data accumulated on plume visual effects con- firm theoretical expectations of great variability. Vision obscuration by smoke plumes and the visual appearance of smoke plumes are far too dependent on environmental conditions of plume illumination to be reliable measures for characterizing the plume as an aerosol. A plume that is assessed by a visual effect could be condemned when viewed on one day and accepted on another, or condemned when viewed from one direction and accepted from another, even when its contents had not changed.
OF SMOKE-STACK PLUMES 49

1.0
1
I- I /?
PLOT OF TRANSMITTANCE DATA FOR SLIDING OVER 0: c( CURVE
4 5 6 7 8 9 IO
I 0.1 I I I I I I I III, 1 1.5 2 2.5 3 4 5 6 7 8 9 10
PARTICLE SIZE PARAMETER (a=+)
Figure 33. Experimental power-station plume: transmittance measurements fitted to Mie-theory
extinction curve.
OPTICAL PROPERTIES AND VISUAL EFFECTS
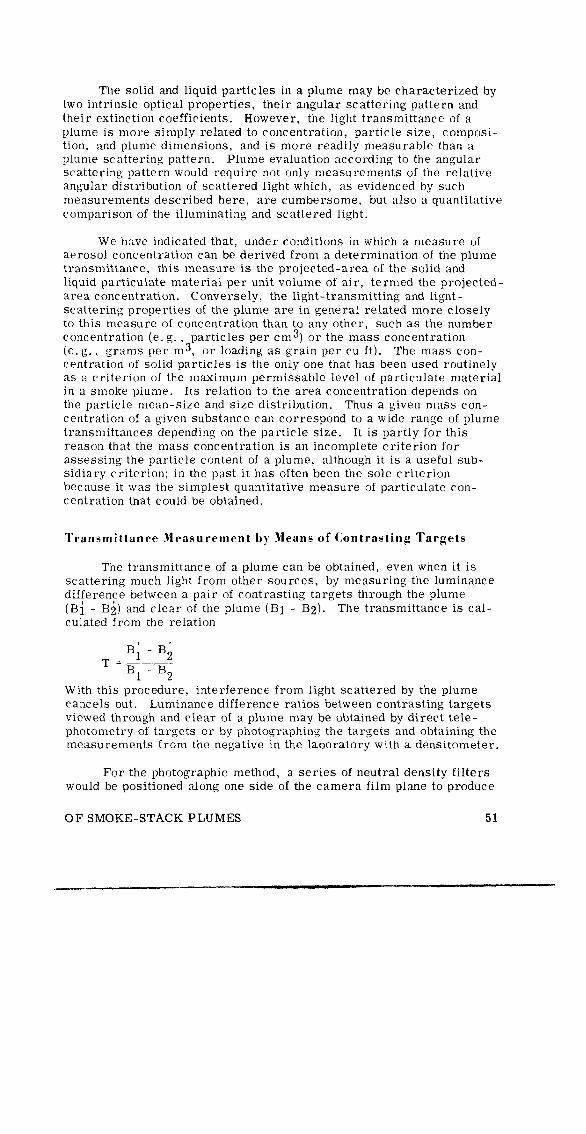
The solid and liquid particles in a plume may be characterized by two intrinsic optical properties, their angular scattering pattern and their extinction coefficients. However, the light transmittance of a plume is more simply related to concentration, particle size, composi- tion, and plume dimensions, and is more readily measurable than a plume scattering pattern. Plume evaluation according to the angular scattering pattern would require not only measurements of the relative angular distribution of scattered light which, as evidenced by such measurements described here, are cumbersome, but also a quantitative comparison of the illuminating and scattered light.
We have indicated that, under conditions in which a measure of aerosol concentration can be derived from a determination of the plume transmittance, this measure is the projected-area of the solid and liquid particulate material per unit volume of air, termed the projected- area concentration. Conversely, the light-transmitting and light- scattering properties of the plume are in general related more closely to this measure of concentration than to any other, such as the number concentration (e.g., particles per cm3) or the mass concentration (e.g., grams per m 3, or loading as grain per cu ft). The mass con- centration of solid particles is the only one that has been used routinely as a criterion of the maximum permissable level of particulate material in a smoke plume. Its relation to the area concentration depends on the particle mean-size and size distribution. Thus a given mass con- centration of a given substance can correspond to a wide range of plume transmittances depending on the particle size. It is partly for this reason that the mass concentration is an incomplete criterion for assessing the particle content of a plume, although it is a useful sub- sidiary criterion; in the past it has often been the sole criterion because it was the simplest quantitative measure of particulate con- centration that could be obtained.
Transmittance Measurement by Means of (Contrasting Targets
The transmittance of a plume can be obtained, even when it is scattering much light from other sources, by measuring the luminance difference between a pair of contrasting targets through the plume (Bi - Bi) and clear of the plume (Bl - Bz). The transmittance is cal- culated from the relation
B; - B;
T =Bl - B2
With this procedure, interference from light scattered by the plume cancels out. Luminance difference ratios between contrasting targets viewed through and clear of a plume may be obtained by direct tele- photometry of targets or by photographing the targets and obtaining the measurements from the negative in the laboratory with a densitometer.
For the photographic method, a series of neutral density filters would be positioned along one side of the camera film plane to produce
OF SMOKE-STACK PLUMES 51

a calibration scale on the negative. For the photograph, the camera is orientated to position the filters in the brightest part of the scene, usually the sky. A calibration curve is obtained from the negative by plotting the optical density of the images as a function of the filter transmittance (relative negative exposure). Then by measuring the densities of the contrasting targets, their relative luminances are obtained from the calibration curve.
Contrasting targets that may be viewed through plumes from the ground mav be a portion of blue sky and white cloud, or, where avail- able, high‘ground or a building and a portion of sky.
Contrasting targets on the ground may also be used to measure plume transmittance by use of a helicopter. The contrasting targets may be distant land and horizon, plowed field and wooded areas, water and sandy beaches, etc. I f the density of the smoke or ambient lighting conditions are unstable, the photographic technique is preferred because it gives a permanent and instantaneous record of the measurements. The camera must be equipped with lenses that will produce images of sizes suitable for densitometer measurements. Direct telephotometry of the targets has the advantages of greater simplicity and faster data reduction.
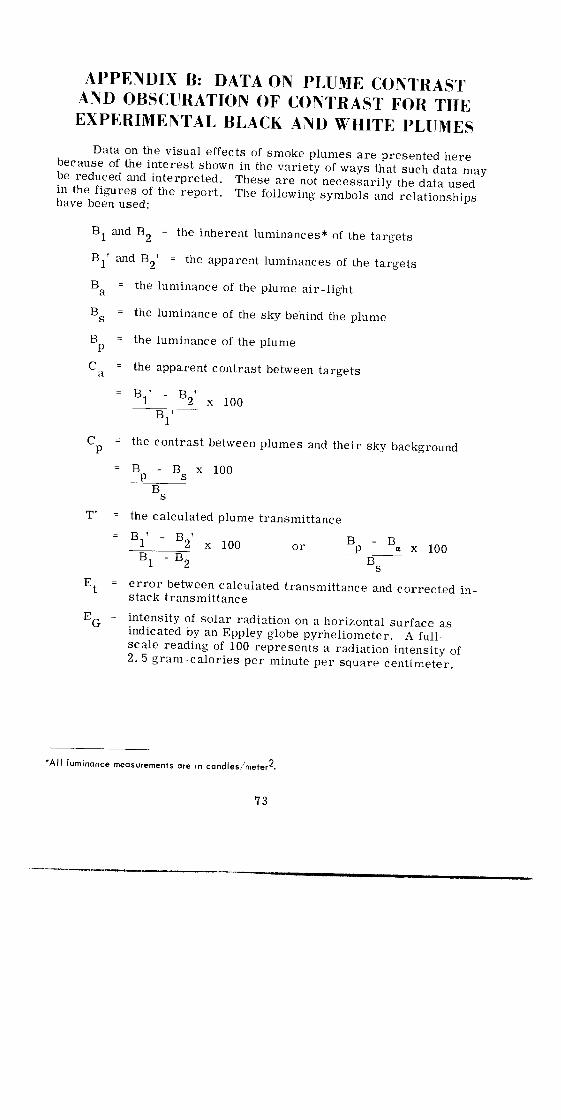
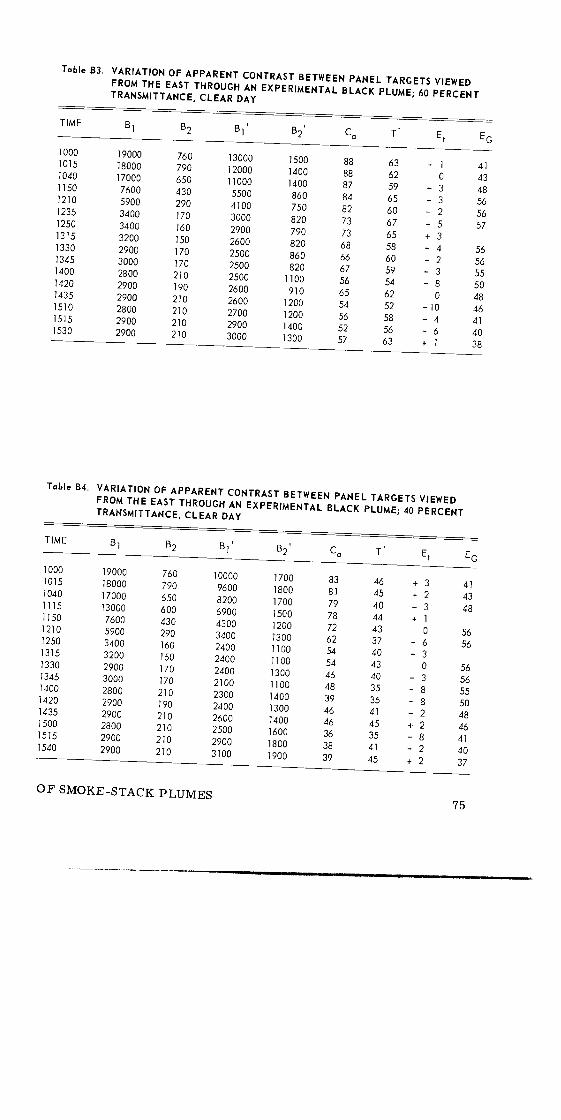
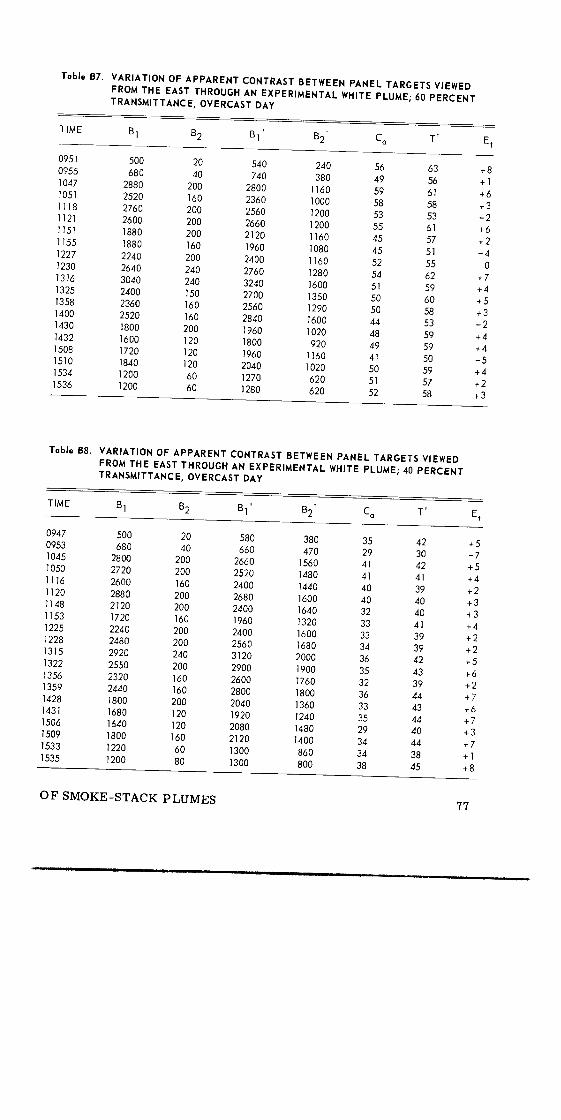
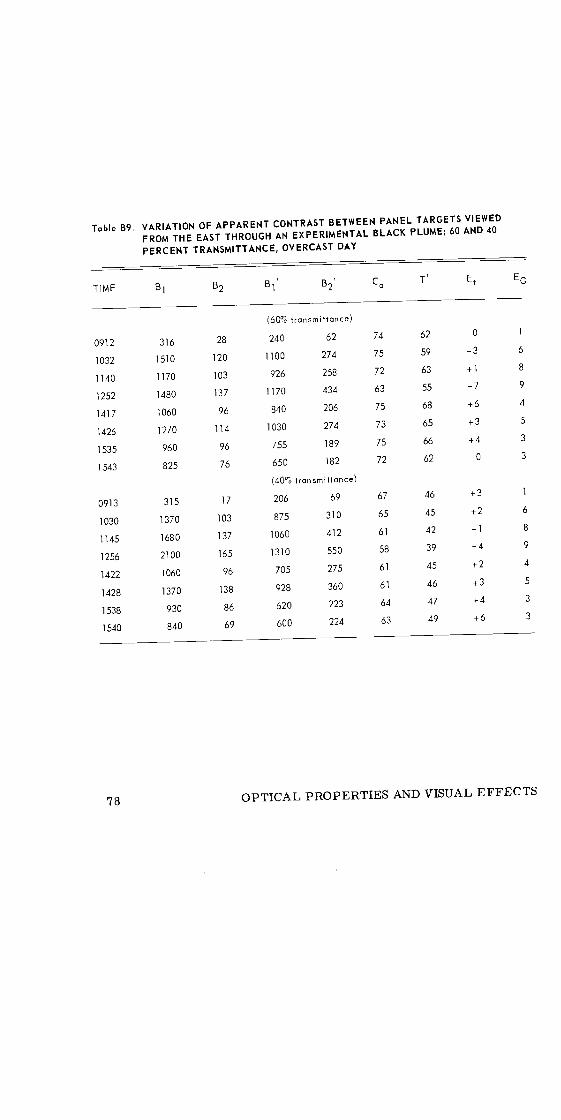
The technique of obtaining plume transmittance by direct tele- photometry of contrasting targets has been illustrated in all the con- trast reduction experiments on panel targets viewed through the black and white experimental plumes. Computations of transmittance from these measurements are compared with in-stack transmittance meas- urements in Appendix B.
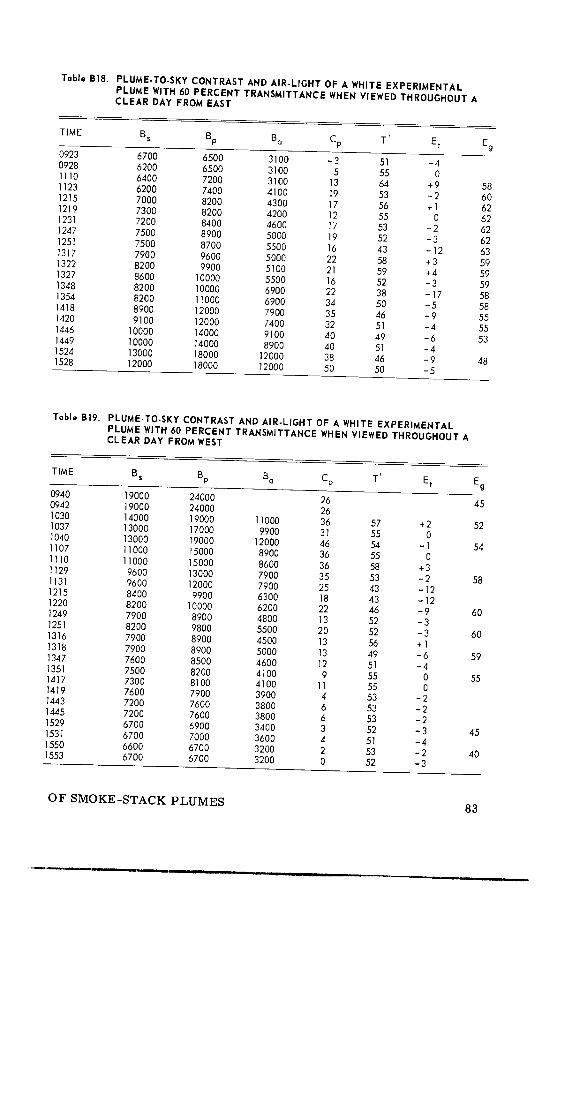
The transmittance of plumes was also measured with a telepho- tometer by viewing distant hills and horizon skies through the plumes. Table 4 shows transmittances of the white experimental plume measured by sighting on a distant hill and adjacent sky. The measurements were made on a clear day and the viewing direction was northwest. The agreement between the two sets of transmittance measurements is acceptable.
Table 5 shows transmittance of a coal-burning power plant plume measured by sighting on a distant hill and adjacent sky. The measure- ments were made at various times over a 5-day period. Illuminating conditions were highly variable throughout the entire period because of the varying overcast conditions that persisted. A coal-cleaning opera- tion located in the area also caused variable luminance measurements and was probably responsible for the particularly high luminance of the wooded hillside when viewed clear of the plume. The viewing direction was southwest.
Figure 34 illustrates the photographic technique of measuring the transmittance of a smoke plume. The coal-burning power plant plume was used for the test and the contrasting objects were the distant hill and adjacent sky. The sky was overcast. In Figure 34 the calibration
52 OPTICAL PROPERTIES AND VISUAL EFFECTS

Table 4. TRANSMITTANCE OF WHITE PLUME MEASURED BY SIGHTING ON HILL AND SKY
THROUGH THE PLUMEWITHATELEPHOTOMETER
(luminances ore in candles meter2)
2900 600 3100 2600 22 22
2900 600 2800 2000 45 36
2650 600 3050 2400 32 28
2600 600 2800 1800 50 48
2600 600 2700 1600 55 50
2600 600 2650 1250 70 68
2550 600 2600 950 85 82
2650 600 3600 3250 17 14
2650 550 3100 2400 34 29
2700 600 3000 2600 19 24
0
9
4
2
3
2
3
3
5
5
E, = 3.7
T’ = calculated plume transmittance
6,’ - Bh’ z-
Bs -%
T = in-stock plume tronsmlttonce
(measured with transmissometer)
E, = error in the calculated transmittance
curve of density versus relative exposure is shown in upper right and the calibration scale is shown in the upper left. The calibration curve was obtained from densitometer readings of the negative image of the calibration scale. Densitometer readings of them% images of the targets indicated a plume transmittance of 28 percent. Direct tele- photometry of the targets indicated the transmittance of the plume was varying between 23 and 30 percent.
Transmittance Mrasuremrnt by IIleans of’ Single Targeta
If the target is so bright that light scattered by the plume is neg- ligible when compared to the transmitted light, the transmittance can be obtained directly as the ratio of the target intensity when viewed through the plume to the target intensity when viewed clear of the plume.
At night almost any light source behind the plume that is bright enough to be measured with a telephotometer is suitable, since the plume is not scattering light from its surroundings. The targets may be the moon, light scattered from an intense searchlight beam behind the plume, light reflected from illuminated objects behind the plume, or similar sources. In the daytime, the sun offers a suitable target. A simple sun photometer sighted on the sun, first clear of the plume and then through the plume, gives the transmittance directly, since any
OF SMOKE-STACK PLUMES 53

Toble5. TRANSMITTANCEOFACOAL-BURNING POWER PLANT PLUMEMEASURED BY SIGHTINGON HILLAND SKY THROUGH THE PLUMEWITHATELEPHOTOMETER
(luminonces in candles,'me+er')
Time (EDT) Bs Bh 8s'
1115 10000 3100 10000
2 1120 11000 3200 8600 > 1136 10000 3400 8200
x 1200 12000 2800 7900
1235 10000 2200 6200
1240 9300 2600 6400
0935 5500 1800 5500
? 0940 5700 1800 5500 2 0942 6000 1800 5800
a 0947 6900 2100 6900
0951 6500 2100 6700
0950 7400 1500 5100
1030 8100 2400 5800 1059 8600 2100 6500
3 1130 5000 1000 3400
2 1300 8200 1500 5300
s 1314 7500 1500 5500
1342 7400 1400 5500
1432 8200 1400 6200
1514 11500 1400 6900
1530 14500 2100 10000
0923 5800 1000 2700
q 0930 0943 3200 5200 1000 510 3400 2000 w > 1000 4600 1000 2400
1015 6900 1000 4300
1045 5800 860 2900
Bh' ___-
T'
7200 23
7200 18
6700 23
6400 16
4600 21
5100 19
4600 24
4600 23
4500 31
5500 29
5500 27
3600 25 4500 23 5500 15
2700 1B
3900 21
4300 20
4100 23
4500 25
4100 18
8200 15
2100
2700
1500
1700
3400
2200
13
17
19
19 I5
14 -
scattered light is faint compared to the brightness of the sun. Figure 35 shows two modified Volz sun photometers 26 that have been combined to permit simultaneous measurement of the transmittance of blue and red light through plumes. The spectral responses of the photometers are shown in Figure 36.
Table 6 shows the transmittances of red and blue light through the experimental white plume measured with the sun photometers. The measurements have been corrected for the angle of view through the rectangular plume, about 45 degrees. The results are compared with the in-stack transmissometer readings and the transmittance measure- ments of red and blue light as measured with the telephotometer and lamp (Figure 26).
54 OPTICAL PROPERTIES AND VISUAL EFFECTS

Figure 34. Transmittance of power-plant plume, measured by photography of contrasting targets.
Table 6. TRANSMITTANCES OF RED AND BLUE LIGHT THROUGH THE WHITE EXPERIMEN-
TAL PLUME MEASURED WITH A SUN PHOTOMETER
Transmlttonce with Transmittance with
in-stack sun photometer, 5
Extinction telephotometer and lamp, %
Extinction tronsmlttonce, 5 Red Blue ratio, Qb,‘Q, Red Blue ratio, Qb’Q,
40 52 31 1.78 48 26 1.85
44 57 33 1.97 53 28 1.97
49 61 36 2.07 58 34 1.97
63 69 50 1.90 70 46 2.16
65 74 54 2.03 72 48 2.22
90 a7 a4 1.25 90 75 2.90
OF SMOKE-STACK PLUMES 55

5.6 cm, f3 LENS
,/
SIGHTING PIN HOLE
\ 5.6 cm, f3
LENS
Figure 35. Modified sun photometer for measuring light-transmission characteristics of smoke
plumes.
56 OPTICAL PROPERTIES AND VISUAL EFFECTS
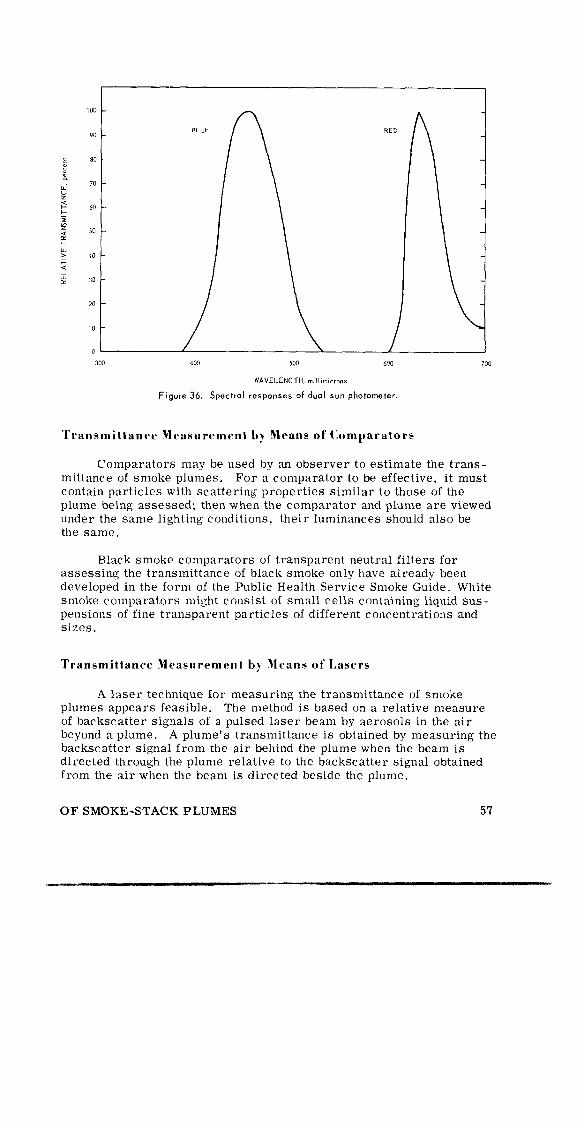
‘too 500 600
WAVELENGTH, m,ll~m,crans
Figure 36. Spectral responses of dual sun photometer.
Transmittance Neasurement by Means of Comparators
Comparators may be used by an observer to estimate the trans- mittance of smoke plumes. For a comparator to be effective, it must contain particles with scattering properties similar to those of the plume being assessed; then when the comparator and plume are viewed under the same lighting conditions, their luminances should also be the same.
Black smoke comparators of transparent neutral filters for assessing the transmittance of black smoke only have alreadv been developed in the form of the Public Health Service Smoke Guide. White smoke comparators might consist of small cells containing liquid sus- pensions of fine transparent particles of different concentrations and sizes.
Transmittance Measurement by Means of Lasers
A laser technique for measuring the transmittance of smoke plumes appears feasible. The method is based on a relative measure of backscatter signals of a pulsed laser beam by aerosols in the air beyond a plume. A plume’s transmittance is obtained by measuring the backscatter signal from the air behind the plume when the beam is directed through the plume relative to the backscatter signal obtained from the air when the beam is directed beside the plume.
OF SMOKE-STACK PLUMES 57

The laser technique of measuring smoke plume transmittance was tested at the oil-burning power plant at Morro Bay. The tests were conducted by the Stanford Research Institute with their Mark I “lid&‘. 27 The measurements were made on the number one stack, which carries the effluent from two of the four generating units of the plant. The gen- erating units can burn oil or gas. When the effluent contained 50 percent oil combustion products from one unit and 50 percent gas combustion products from the other unit, laser measurements indicated that the transmittance of the plume was around 82 percent. A slightly higher transmittance of 85 percent was indicated when the gas-burning unit was shut down and the plume contained only oil combustion products.
Sun photometer measurements on the plume when it was composed of equal parts of oil and gas combustion products indicated a transmit- tance of 85 percent for red and blue light. Sun photometer measure- ments on the plume when the plume contained only oil combustion products indicated a transmittance of 92 percent for red light and 89 percent for blue light.
Although field testing of instrumental techniques for measuring plume transmittance has been limited, the tests have served to illus- trate the techniques and demonstrate their feasibility. The methods that require targets behind the plume, although completely objective, are not always applicable. They may be classified as two-ended tech- niques of measuring plume transmittance. The sun photometer method is most applicable in areas where overcast conditions are few and the sun may be viewed through the plume. The telephotometer method is most applicable in mountainous or metropolitan areas where a hill or building may be viewed through the plume or in areas with a large num- ber of days where the sky offers areas of sufficiently contrasting brightness. The telephotometer, sun-photometer, and neutral filter method for black smoke could be combined in a single, inexpensive field instrument. A schematic for such an instrument is shown in Figure 37. The accuracy with which a nonblack plume may be assessed by use of a comparator has not been demonstrated, though the method is promising in principle. The laser method represents an objective, single-ended. general technique for measuring the transmittance of plumes, and may offer a standard for evaluating smoke plumes with which other less expensive methods can be compared.
CONCLUSIONS
The visual appearance of smoke plumes and vision obscuration by smoke plumes are closely related to the amount of light the plumes scatter in the direction of the viewer from their surroundings and the sun. Consequently, evaluations of plumes by a visual effect are more stringent for nonblack plumes than for black plumes and depend on plume illuminating and viewing conditions. Because of this, nonblack plumes could be evaluated differently when viewed on different days or viewed from different directions, though their aerosol content had not changed.
58 OPTICAL PROPERTIES AND VISUAL EFFECTS

SWI
EYEPIECE
NEUTRAL DENSITY FILM ANNULUS
MICROMETER
60% FIELD OF VIEW
GLASS PLATE
TCH
PHOTOCELL MIRRO
Flgure 37. Schematic for combination smoke meter.
I f a plume is regarded as contributing to an air pollution problem mainly by virtue of the nature and amount of its aerosol content, it would be desirable to evaluate the plume by an intrinsic property that can be related to that content, independent of environmental lighting conditions. Then the plume could be evaiuated according to emission standards based on the composition, diameter, and velocity of the plume, the prevailing meteorological conditions, and other pollution sources in the area.
If the main objection to the plume is its appearance and the decrease in visibility that it will cause, it would still be desirable to evaluate the plume by an intrinsic property. In such a case emission limits in terms of some intrinsic property of the plume (e.g., trans- mittance) will have to be formulated from a consideration of the visual effects of plumes under the most unfavorable conditions. Then plumes meeting this emission limit would also be acceptable under all illumi- nating and viewing conditions.
Also, if plumes are evaluated by a property that can be related to the composition, size, and concentration of particles in the plume and a measurement technique is available, the operator of a stack can determine more readily for himself when his emission is excessive and he can better define specifications for control equipment to make the emission acceptable.
The optical property of a plume that is easiest to measure and most simply related to concentration, particle size, composition, and
OF SMOKE-STACK PLUMES 59

dimensions of the plume is its light transmittance. Although no general, inexpensive instrumental technique is available for objectively measur- ing the transmittance of plumes, there are several special techniques which collectively under most circumstances will provide an objective means of measuring the transmittance of a plume.
It appears that an observer may be trained to estimate the trans- mittance of a plume from its visual appearance. Results presented in this report indicate, however, that plume illuminating, background, and viewing conditions must be considered in training of the inspector and by the inspector when he is assessing plumes in the field. The evaluations of a nonblack plume by observers even with training, may vary significantly if they assess plumes without regard to plume illumi- nating, background, and viewing conditions. A valuable aid to the inspector of a nonblack plume would be comparators with light-scatter- ing characteristics similar to those of the plume being assessed. Such comparators would help the observer compensate for variations in the appearance of a plume due to illumination and viewing conditions.
A completely general technique that uses a pulsed laser beam for measuring the transmittance of plumes appears feasible. A laser may offer a standard technique for measuring the transmittance of plumes with which less expensive methods can be compared.
ACKiVOVk7LEDGMENTS
We wish to express our thanks to the Steering Committee of the study for their support and interest. especially to Mr. V. F. Estcourt of the Pacific Gas and Electric Co. and Dr. J. H. Ludwig and Mr. J. S. Nader of the Public Health Service. We extend thanks for valuable scientific discussions to Mr. E. S. Johnson of the Pacific Gas and Electric Co. and Dr. Werner Stoeber (now at the Max Planck Institute, Goettingen, Germany), who was a consultant to the Edison Electric Institute for this study. One of us (Dr. J. R. Hodkinson) was a con- sultant to the Public Health Service for the study. It is also a pleasure to thank Mr. C. F. Smith of the Public Health Service for his partici- pation in all experiments and the construction of apparatus, and the late Mr. J. A. Tash of the Duquesne Light Co. and Mr. W. L. Crider of the Public Health Service for the development of the experimental smoke stack facilities. Finally, the authors wish to gratefully acknowl- edge the assistance of the personnel of the Bay Area Air Pollution Control District, California in obtaining the data involving trained observers.
60 OPTICAL PROPERTIES AND VISUAL EFFECTS