Optical Communication Systems for Smart Dust...Optical Communication Systems for Smart Dust Yunbin...
72
Optical Communication Systems for Smart Dust by Yunbin Song Thesis submitted in partial fulfillment of the requirements for the degree of Master of Science in Department of Electrical Engineering Committee: Dr. Richard O. Claus , Chair Dr. Ioannis M. Besieris, Committee Member Dr. William B. Spillman, Committee Member August 2002 Virginia Polytechnic Institute and State University Keywords: Smart Dust, CCR, Free-Space Optical Communication, Fiber-Optic Communication
Transcript of Optical Communication Systems for Smart Dust...Optical Communication Systems for Smart Dust Yunbin...

Optical Communication Systems for Smart Dust
by Yunbin Song
Thesis submitted in partial fulfillment of the requirements for the degree of
Master of Science in
Department of Electrical Engineering
Committee:
Dr. Richard O. Claus, Chair Dr. Ioannis M. Besieris, Committee Member Dr. William B. Spillman, Committee Member
August 2002 Virginia Polytechnic Institute and State University
Keywords: Smart Dust, CCR, Free-Space Optical Communication, Fiber-Optic
Communication

Optical Communication Systems for Smart Dust
Yunbin Song
(Abstract)
In this thesis, the optical communication systems for millimeter-scale sensing
and communication devises known as “Smart Dust” are described and analyzed. A
smart dust element is a self-contained sensing and communication system that can be
combined into roughly a cubic-millimeter mote to perform integrated, massively
distributed sensor networks. The suitable passive optical and fiber-optic
communication systems will be selected for the further performance design and
analysis based on the requirements for implementing these systems. Based on the
communication link designs of the free-space passive optical and fiber-optic
communication systems, the simulations for link performance will be performed.

iii
CONTENTS
1. Introduction 1 1.1 Overview 1 1.2 Application 2
2. Smart Dust System Requirements 5
2.1 Power 5 2.2 Sensor 5 2.3 Communication 6
3. Communication System Option 7
3.1 RF Communication 7 3.2 Optical Communication 9
3.2.1 Free-Space Optical Communication 10 3.2.1.1 Active Optical Communication 10 3.2.1.2 Passive Optical Communication 11
3.2.2 Fiber-Optic Communication 13
4. Passive Optical Communication 15 4.1 System requirements 16
4.1.1 Line-of-Sight Requirement 16 4.1.2 Link Directionality 17
4.2 Link Components 18 4.2.1 Interrogation Laser 18 4.2.2 CCR 19 4.2.3 Imaging Receiver 22
4.3 Analysis 24 4.3.1 Average Received Photocurrent 24 4.3.2 Ambient Light Noise 29 4.3.3 Average SNR 31 4.3.4 Design Parameters 34
5. Fiber-Optic Communication 35 5.1 Optical Fiber 37
5.1.1 Fiber Dispersion 37 5.1.2 Fiber Loss 38
5.1.2.1 Absorptive Losses 38 5.1.2.2 Radiative Losses 39 5.1.2.3 Bending Losses 39
5.2 Link Components 40 5.2.1 Directional Coupler 40 5.2.2 Beam Splitter 41 5.2.3 Optical Isolator 43 5.2.4 Index-matching material 44 5.2.5 GRID-rod Lens 44 5.2.6 Fiber Connector 46
5.3 Analysis 47 5.3.1 Downlink 47 5.3.2 Uplink 48

iv
6. Network Performance 50 6.1 Free-Space Passive Optical Communication 51 6.2 Fiber-Optic Communication 55 6.3 Future of Smart Dust 60
7. Conclusion 61
8. References 64

v
Figures
Figure 1.1: Smart dust mote 4
Figure 1.2: 63 mm3 mote 4
Figure 3.1: Active transmitter on dust mote 11
Figure 3.2: Microfabricated corner-cube retrofrflector 14
Figure 3.3: Design of a bidirectional free-space optical communication link 15
Figure 4.1: Raytrace through CCR 21
Figure 4.2: Effective areas of CCR surfaces 21
Figure 4.3: Diagram for Separating the interrogating light and received light 22
Figure 4.4: Imaging receiver based on CMOS image sensor system. 24
Figure 4.5: The propagation of the interrogating laser light at a base station. 25
Figure 4.6: Fraunhofer diffraction at a circular aperture. 27
Figure 5.1: Bidirectional fiber-optic communication link. 36
Figure 5.2: Architecture of the directional coupler 41
Figure 5.3: Y-junction beam splitter 42
Figure 5.4: Structure of optical isolators 43
Figure 5.5: 0.25 pitch GRIN-rod lens 45
Figure 5.6: A simplified diagram of the fiber-optic link design 50
Figure 6.1: Performance of free-space optical link with Pt=10 W 51
Figure 6.2: Performance of free-space optical link with various input powers 52
Figure 6.3: maximum ranges of free-space optical link 54
Figure 6.4: Performance of fiber-optic link with PL=1 mW 56
Figure 6.5: Performance of fiber-optic link with various input powers 57
Figure 6.6: maximum ranges of fiber-optic optical link 59

vi
Tables
Table 1: Sensor Specifications 6
Table 2: Typical values of design parameters for free-space optical link 55
Table 3: The practical optical fiber components with specifications 59
Table 4: Comparison of the estimated performances 63

1
1. INTRODUCTION
The purpose of this thesis is to analyze techniques for designing communication systems
for millimeter-scale sensing and communication devises known as “Smart Dust.” A smart dust
element is a self-contained sensing and communication system that can be combined into
roughly a cubic-millimeter mote to perform integrated, massively distributed sensor networks
[1].
Smart dust can consist of hundreds to thousands of dust motes, each containing the
capability of sensing and monitoring environmental conditions and communicating to other
devices. Figure 1.1 shows the conceptual diagram of a smart dust mote. Each mote contains
one or more sensors, a power supply, analog circuitry, bi-directional communication, and a
programmable microprocessor. Advances in miniaturization, integration, and energy
management in digital circuit, optical communications and Micro Electro-Mechanical Systems
(MEMS) led to the manufacturing of small sensors, optical communication components, and
power supplies, whereas microelectronics provides increasing functionality in smaller areas,
with lower energy consumption [1,2].
Actual smart dust motes are being developed by professor Kris Pister at the University
of California, Berkeley, as part of a program to produce the smallest possible devices that have a
viable way of communicating with each other. At present, each mote is about 5 mm long as
shown in Figure 1.2. A free-space passive optical communication that will be discussed in
section 4 is based on their works.
Due to advantages in discreet size, substantial functionality, connectivity and low cost,
smart dust will provide new methods to sense and interact with the environment. Each dust
mote can be equipped with many different sensors depending on specific purposes: temperature,
light, humidity, pressure, 3 axis magnetometers, 3 axis accelerometers and other sensors. Dust

2
motes can be mounted to the objects that one wishes to monitor, or a large collection of motes
can just be deployed over the environment at random.
The motes obtain the desired information from the surrounding environment and report
these via a communication network. Depending on the application, dust motes can be made to
only communicate directly with a base station transceiver, or peer-to-peer communication can
be performed between dust motes. The applications of smart dust are numerous for industry as
well as the military. Useful applications for smart dust are listed below [3].
• Collecting data for meteorological, geophysical, or planetary research
• Tracking the movements of birds, small animals, and even insects
• Virtual keyboard (Acceleration sensing glove)
- 2 axis accelerometer on top of the each finger on a data glove
• Smart office spaces
- temperature, humidity, and environmental comfort sensors
• Monitoring product quality
- temperature, humidity, pressure sensors
• Defense-related sensor networks
- acoustic, vibration, and magnetic field sensors
• Providing interfaces for the disabled
In section 2, the functions of a smart dust component required to design a fully
autonomous smart dust system are described: power supplies, sensor suites, and communication
conditions. With those requirements in mind, we will realize the important design parameters to
design a reliable smart dust system in following section.
In section 3, several possible communication systems will be described including free-
space optical links with active and passive transmitters, fiber-optic links and RF links. The
advantages and disadvantages of each system will be considered. The suitable passive optical

3
and fiber-optic communication systems will be selected for the further performance design and
analysis based on the requirements for implementing these systems.
In section 4, an optical link with a passive transmitter on the dust mote will be analyzed.
Basic requisites of the optical communication will be described: line of sight, and link
directionality. Several design issues will be analyzed for both uplink and downlink. The signal-
to-noise ratio of a free-space optical link using a corner cube retroreflector (CCR) and a CMOS
image sensor receiver will be analyzed and it will provide quantitatively the feasibility of this
link design and help identify critical design parameters. In this analysis, the ambient light noise
by the camera would also be considered. At the end of this section, the important design
parameters and characteristics of the passive optical communication will be pointed out.
In section 5, a fiber-optic link with a passive transmitter that I have designed will be
discussed and analyzed. After investigating the detailed system-level analysis, the critical
components to fiber-optic communication link are analyzed. Further, some of factors governing
the design of transmitter and receiver components will be examined. At the end of this section,
the signal-to-noise ratio of a fiber-optic link using a corner cube retroreflector (CCR) will be
derived.
Based on the previous design content, simulations for link performance of the free-space
passive optical and fiber-optic communication systems will be performed in section 6. Since
the system has the unique characteristics of the transmitting and receiving components, a simple
communication protocol for each communication system with smart dust will be designed.

4
Thick-FilmBatter
1-2 mm
Solar Cell
PowerCapacitor
Analog I/O,DSP, Control
Photodetector
Active Transmitter(mote-to-mote Communication)
Corner-Cube Retroreflector
Sensor
Figure 1.1: Smart dust mote with sensor, optical receiver, passive and active optical transmitters, signal-processing and control circuitry, and power sources.
Figure 1.2: 63 mm3 mote with a MUMPS optics chip containing a CCR for communication, a CMOS ASIC for control, and a hearing aid battery for power. [from http://www-bsac.eecs.berkeley.edu/~warneke/SmartDust/index.html]
5
2. SMART DUST SYSTEM REQUIREMENTS
2.1 Power
The dust motes must have enough energy to survive anywhere from a few hours to
months in order to monitor an environment. Because of the small size of the mote, energy
management is a key constraint of the design. The power system consists of a thick-film battery
or a solar cell with a charge-integrating capacitor to allow for charge retention for periods of
darkness, or both.
Current battery and capacitor technology can store approximately 1J/mm3 and
10mJ/mm3, respectively, while solar cells can provide about 1J/day/mm2 in sunlight and 1-
10mJ/day/mm2 indoors [4]. Energy consumption must therefore be minimized in every part of
the system. The optical receiver of smart dust consumes approximately 0.1 nJ/bit and the
transmitter uses 1 nJ/bit. The analog-to-digital converter will require 1 nJ/sample, and
computations are anticipated to consume under 1pJ/instruction.
2.2 Sensor
Depending on its objective, the design integrates various sensors, including light,
temperature, vibration, magnetic field, acoustic, and wind shear, onto the mote. The Micro
Electro-Mechanical Systems (MEMS) industry has been growing with major markets in
automotive pressure sensors and accelerometers, medical sensors, and process control sensors.
Recent advances in technology have put many of these sensor processes on exponentially
decreasing size/power/cost curves, and the results of this technology are of direct use here.

6
The sensors could be classified into two groups: weather monitors, and motion detectors.
The table 1 summarizes the different types of sensors that can be used on the smart dust [5].
Current
consumption
Voltage
range
Min range/
Max range
Accuracy
Temperature
dependence
Magnetometer
650µA
2.7-
5.25V -/+0.5 Gauss 2 mGauss 1.4mG / °C
Accelerometer
600µA 3- 5.25V -/+2g 25 mg negligible
Light sensor
200µA 2.7-5.5V
0 mW/m2
/26mW/m2 6 mW/m2 negligible
Temperature
Sensor 600µA 2.7-5.5V -20°C/100°C 0.25°C not applicable
Pressure sensor
650µA 2.7-5.5V
0.6 PSI gauge
range @ 14.4 PSI
absolute
2.4 mPSI 10 mPSI/°C
Humidity
sensor 200µA @5V 4-9V
0-100% relative
humidity +/-2% RH negligible
Table 1: Sensor Specifications
2.3 Communication
Smart dust’s full potential can only be attained when the sensor nodes communicate with
one another or with a central base station. Communication system facilitates simultaneous data
collection from thousands of sensors. There are several constraints in designing of the
communication system due to the size and low power of dust motes. In the downlink, the
central transceiver is assumed to broadcast to all of the dust motes at a bit rate of several kbps

7
[1]. For the uplink, each dust motes must transfer at a bit rate of 1kbps. When a smart dust
ensemble employs 1,000 dust motes, an aggregate throughput is 1 Mbps.
The position of each dust mote should be identified by the central transceiver with an
angular resolution of the order of 1/100 of the field of view [1]. Both uplink and downlink
should be able to transfer data over a range of at least several hundred meters. The size of the
dust mote transceiver should be around 1 mm3, and each mote should require an average power
not exceeding 1µW. A very low probability of data interception is preferred for both uplink and
downlink. There are several secure transmission options for communicating to and from such a
mote-sized cubic-millimeter computer. Radio frequency and optical communications each have
their strengths and weaknesses, and are compared and contrasted in following section.
3. COMMUNICATION SYSTEM OPTIONS
In order to realize the concepts of smart dust, ultra-low-power communication should be
achieved. This is one of the challenging problems in the smart dust system. The
communication system is supposed to send commands to sensors on the motes and collect the
reading data from the sensors. Four preliminary platforms that could be the primitive
communicative functions of the smart dust will be considered: radio frequency, free-space
active optical, free-space passive optical and fiber-optic communication. Each system has
unique characteristics, advantages and disadvantages.
3.1 RF Communication
Radio frequency communication is one of the well-developed communication systems.
It is based on the generation, propagation and detection of electromagnetic waves with a
frequency range from tens of kHz to hundreds of GHz. It could be used to function as both the

8
uplink and the downlink. Since RF transceiver typically consists of relatively complex circuitry,
it is impossible to achieve the required low power operation using such an approach in a smart
dust system. When large numbers of motes are involved in smart dust, RF links may employ
alternative multiplexing techniques: time, frequency or code-division multiplexing. Their use
leads to modulation, bandpass filtering, demodulation circuitry, and additional circuitry, all of
which needs to be considered based on power consumption.
RF communication has potential for smart dust, but also poses several problems.
Among the many factors included in RF communication, perhaps one of the most important
problems in cubic millimeter devices is antenna size [2]. Smart mote offers very limited space
for antennas. Since the size of antenna should be at least ¼ of the carrier wavelength, the limited
antenna size leads to a very short wavelength [1]. In this regime, communication is not
compatible with low power operation. RF communication consumes minimum power levels in
the multiple milliwatt range due to analog mixers, oscillators, and filters. For example, when
RF communication employs a quarter wavelength of 1 mm, the length of smart dust mote, the
carrier frequency should be around 75GHz, which is not acceptable using standard RF
communication methods. Nevertheless, whisker-thin antennas of centimeter length can be
employed on the smart dust depending on the application. Currently, the size of a complete RF
communication port is around few hundred cubic millimeters.
RF communication can be performed by using time, frequency, or code division
multiplexing (TDMA, FDMA or CDMA). However, each of these techniques contains some of
major factors that could not be suitable for smart dust system [1]. For example, for the case of
TDMA, the dust mote should transfer at a high bit rate, as high as the aggregate uplink capacity
when other multiplexing techniques are absent. Besides, dust motes should coordinate their
transmission with others. In FDMA, the accurate control of oscillator frequency is required.
Since CDMA operates for a relatively extended time interval, it requires high-speed digital
circuitry and it consumes excessive power. Both FDMA and CDMA should avoid coordination
between dust motes and they require dust motes to be preprogrammed with unique frequencies

9
or codes in order to prevent such coordination. When smart dust employs RF communication as
primary communication platform, it requires the combination of two or more of multiplexing
techniques.
Space-division multiplexing (SDMA) is another multiplexing technique that we can
employ in RF communication [1]. In SDMA, since the transmission from each smart dust
motes should be separated from others, we need to use an antenna array in the central
transceiver. Because of the limited size of the smart dust mote, SDMA would not be able to
satisfy the required spatial resolution in this system. Similarly, RF communication would not be
able to identify the location of the dust motes. Also, multipath propagation decreases the spatial
resolution to determine the location of dust motes.
3.2 Optical Communication
Optical communication links instead employ semiconductor lasers and diode receivers to
transfer and detect on/off keyed optical signals. Because of the relatively small size of the
optical transceiver, optical communication may be more amenable to low-power operation than
most RF communication approaches. Optical power may be collimated in tight beams even
from small apertures. Diffraction effectively defines the fundamental limit on the divergence of
a beam from antenna or a lens. In optical communication, the 1 GHz frequency is easily
obtained from a millimeter aperture, while RF communication requires an antenna size of 100
meters across to produce collimation for a 1 GHz radio frequency signal, due to the difference
in the wavelengths of the two transmissions [6]. Optical transmitters of the millimeter size can
be used to obtain antenna gains of one million or more, while similarly sized radio frequency
antennas are doomed by physics to be mostly isotropic.
The optical communication link has several reasons for power advantage. Optical
transceivers require relatively simple baseband analog and digital circuitry. As mentioned
above, the short wavelength makes a millimeter-scale device capable of emitting a narrow beam.

10
Also, a compact imaging receiver in the base station may be capable of decoding the
simultaneous transmission from a large number of motes, at different locations.
3.2.1 Free-Space Optical Communication
Free-space optical communication, however, has two major drawbacks. First, it
requires line of sight and narrow beams for accurate pointing. By using MEMS technology and
clever algorithms, accurate pointing of the narrow beams can be obtained [7]. Therefore, when
a line of sight path is available, smart dust can employ free-space optical links with significantly
lower energy per bit than RF links. In the following sections, two approaches to optical
communication will be explored: active steered laser systems and passive reflective systems.
3.2.1.1 Active Optical Communication
Active optical communication typically uses an active-steered onboard laser-diode based
transmitter to send a collimated laser beam to a base station. This system contains a
semiconductor laser, a collimating lens and a beam-steering micro-mirror as shown in Figure
3.1. Active optical communication is suitable for peer-to-peer communication when the
application requires. Using MEMS technology, the components of the active communication
network can be made to be small enough to fit into the smart dust motes [7].
One of the disadvantages of the active transmitter is its relatively high power
consumption. This leads to the use of active optical communication for short duration burst-
mode communication only. In order to minimize the power consumption, the active transmitter
should employ some protocol to aim the beams toward the receiver: likely using directional
beam and an active beam-steering mechanism. These components would make the design of
the dust mote more complicated.

11
Active communication has the advantage of high power density. This provides capable
for optical wireless communication over enormous distances. Using active optical
communication, the most exciting application in peer-to-peer communication is forming
multihop networks. Burst-mode communication provides the most energy-efficient way to
schedule the multihop network [1]. The active laser-diode transmitter operates at up to several
tens of megabits per second for a few milliseconds.
SemiconductorLaser
Collimatinglens
Steering mirror
Figure 3.1: Active transmitter on dust mote with a semiconductor laser, a collimating lens and a beam-steering micro-mirror.
3.2.1.2 Passive Optical Communication
One of the most effective advantages in a passive optical communication system is that
the dust mote does not need to have an onboard light source to transmit desired sensor
information. The passive optical communication approach employs a microfabricated corner-
cube retroreflector (CCR). As shown in Figure 3.2, this CCR contains three mutually
perpendicular mirror fabricated of gold-coated polysilicon [8]. The CCR reflects any incident
ray of light within a certain range of angles centered about the cube’s diagonal back to the
source. This idea comes from the fifth century B.C., when the Greeks used reflected sunlight as

12
a beacon signal. When one of the mirrors in CCR is misaligned, the CCR would not be able to
reflect signal back to the source. An electrostatic actuator in the CCR deflects one of the mirrors,
and it leads to the modulation of the incident ray of light at kilohertz rates. Since the dust mote
does not need to emit any light, it consumes very little power. Therefore, passive optical
transmission can be performed in the smart dust system since dust motes can modulate the
optical signal without having to supply any optical power.
Free space passive optical communication at visible or near infrared wavelengths (400-
1600 nm) is one of the attractive communication system options for the downlink and uplink.
Figure 3.3 shows a design for a bidirectional free-space optical communication link. On the
downlink, the base station transceiver contains a single laser transmitter whose beam illuminates
an area containing a collection of dust motes. This beam is an on-off-keyed signal containing
downlink data, and commands to wake up and query the dust motes. The receiver of each dust
mote consists a bandpass optical filter, a photodiode, and a preamplifier. This would involve
only low-speed baseband electronics, making it far simpler that a comparable RF counterpart.
On the uplink, a special MEMS structure makes it possible for dust motes to use passive
optical transmission techniques by using the corner-cube retroreflector (CCR) approach. Each
dust mote can be equipped with a corner-cube retroreflector. When the illuminating beam from
the base-station transmitter is not modulated, the dust mote can use this illuminating beam to
transfer uplink data back to the base station by using the CCRs. The CCR reflectivity can
modulate the signal at bit rates up to 10 kbps by displacing one of the mirrors in the CCR. A
high frame-rate CMOS imaging system at the base-station transceiver captures these CCR
signals as light blinking on and off. It decodes these blinking images to yield the uplink data.
The base station receiver contains an imaging receiver with a lens and a CCD or CMOS
image sensor array. In order to synchronize the transmission from all dust motes to the frame
clock of the imaging array, the imaging receiver uses periodic pulsation of the downlink or
interrogating laser beam [1]. Passive optical communication using CCD has several advantages

13
over RF communication. The short optical wavelength uses a reasonable-sized camera in the
imaging receiver to obtain high spatial resolution. This enables smart dust easily to obtain
information on the location of each mote, and the uplink relies upon space-division multiplexing
(SDMA) [9]. The imaging receiver in the base station can obtain information via the
simultaneous transmission of the 1000 dust motes without any mutual coordination.
On the other hand, passive optical communication exhibits several limitations.
The communication between dust motes, so-called peer-to-peer communication, cannot be
performed by passive optical communication. Since dust motes rely only on the light source of
the central station to send and receive data, if a given mote does have a clear line of sight to the
base station, the mote would not be able to perform any communication and this would be
isolated from the system. Since each CCR can only reflect a small fraction of the illuminating
light beam, the rest of illuminated light is wasted.
3.2.2 Fiber-optic communication
Fiber-optical communication employs semiconductor laser, fiber cable and diode
receiver to generate, transfer and detect the optical signal. Since similar techniques to free-
space passive optical communication will be employed in fiber-optic communication, most
basic characteristics of the passive free-space optical communication remain the same. The
relatively small size of the optical transceiver is employed with low-power operation. Each dust
mote does not need to have an on board light source to transmit the data. By the using MEMS
technology, Corner cube retroreflector is employed on each dust mote to modulate uplink data
to base station.
Fiber-optic communication has advantages and disadvantages over a passive free-space
optical communication. Since optical fiber communication employs fiber cables to transfer and
receive optical signals, it does not require the unbroken line-of-sight, the link directionality, and
human eye safety on an interrogating laser. Each dust mote does not need to employ more than

14
one CCR, and the communication between dust motes and a base station can be guaranteed. In
addition, it has a longer range of communication link than that of a free space passive optical
communication. However, fiber-optic communication has a limitation on the application. The
optical fiber cables restrict the mobility of dust mote. Since a base station should employ
several optical components for fiber connection to each dust mote, it may complicate base
station design.
Figure 3.2: Microfabricated corner-cube retrofrflector with three gold-coated polysilicon mirrors.

15
LASER
CMOSImageSensor
CCR
Photo-detector
DownlinkData in
Signalprocessing
UplinkData Out
DownlinkData Out
UplinkData Out
Lens
Lens
Central Transceiver
Dust Mote
Figure 3.3: Design of a bidirectional free-space optical communication link in which a base-station transceiver communicates simultaneously with a collection of many dust motes (only one dust mote is shown in this Figure)
4. PASSIVE OPTICAL COMMUNICATION
The primary goal of the communication protocol for smart dust system is the data
transmission ability between a central transceiver and a collection of dust motes. Based on the
consideration in the previous section, the smart dust system favors free space passive optical
communication for both uplink and downlink [1]. Such passive communication is very suitable
for ultra-low-power communication between a central transceiver and dust motes using a low-
power corner-cube-retroreflector (CCR) modulation approach.

16
4.1 System requirements
In order to implement passive optical communication on a smart dust system, there are
some critical limitations. An unbroken line-of-sight path is required to transfer and receive
optical signals. And, the directional characteristics of the CCR and optical receiver should be
considered in system design.
4.1.1 Line-of-Sight Requirement
Free-space optical links for smart dust require an unbroken line-of-sight path, and rely
on reflections from one or more objects between the transmitter and receiver. In order to obtain
a high signal-to-noise ratio, the transmitted beam should have a small angular spread with
acceptable transmitter power [1]. In most cases, specular reflection increases a beam’s angular
spread. A properly aligned specular reflector would not have much effect on the beam’s angular
spread. Diffuse reflection, however, makes the energy of the beam scatter over a wide range of
angles, but usually insufficient energy toward is scattered the receiver. Diffuse, non-line-of-
sight transmission is feasible only for the active transmitter, and then over a very short distance.
Since diffuse, non-line-of-sight makes both the interrogating beam and the reflected beam
scatter over a wide range of angles, it cannot be used to advantage in passive optical
communication.
When a fixed dust mote does not have a line-of-sight path to the base station, it can
communicate with the base station via a suitable multihop path. Such suitable multihop routing
can be improved by higher dust mote density. However, such operation requires an active
transmitter on the dust mote and increases latency. Since smart dust has a limitation on power
consumption and size, low-complexity multihop routing algorithms are desired.
Depending on the application, a dust mote may be able to float in the air. In this case, an
otherwise not fixed, line-of-sight path to the base station may or may not become available.

17
When such a path become intermittently available, the base station can continuously transfer
signals to the dust mote. In such a case, the mote can also transmit a packet back to the base
station. When the average time between occurrences of the availability of line-of-sight paths is
longer than the packet duration, multihop routing could be used to minimize the latency.
4.1.2 Link Directionality
In most cases, the angular spread of the interrogating beam from the base station should
cover the same region as the field of view of the imaging receiver in the base station [7]. This
condition should be satisfied in the system using passive dust mote transmitters, and active dust
mote transmitters when the system performs bi-directional transmission between the base
station and dust motes. Depending on the application, using an active dust mote transmitter, the
angular spread of the base station transmitter beam could be smaller than the field of view of the
base station. In this case, the transmitter beam would be pointed to various locations within the
field of view of the receiver.
Since a dust mote has a limitation of size, the optical receiver of the dust mote cannot
employ an imaging or non-imaging optical concentrator in front of photodetector. As a result,
the dust mote receiver can receive input signals from most of the hemisphere in front of the dust
mote. Consequently, the transmitter beam does not have to aim at the dust mote receiver. The
passive dust mote transmitter uses the CCR and the interrogating beam from the base station.
The CCR reflects the interrogating beam back to the source within few tens of degrees of
itscube body diagonal. When a dust mote employs only one CCR, the probability of the ability
to transmit to the base station is about 10% since a dust mote should employ eight CCRs to
cover all directions [7]. When a dust mote employs additional CCRs, this probability would be
increased. Alternatively, MEMS aiming mechanisms can be employed with a single CCR. The
accuracy of MEMS aiming mechanisms is on the order of 10 or 20 degrees. For another
alternative solution, dust motes can be randomly distributed and dust motes whose CCRs

18
happen to aim at the base station can only be considered. Dust motes can just delay transmitting
until they move into an orientation that allows communication with the base station.
4.2 Link Component
As mentioned before, the passive optical communication system employs an
interrogating laser, corner-cube retroreflector, and imaging senor receiver. In this subsection,
the details of these major components are discussed.
4.3.1 Interrogating laser
In a passive optical communication system, the interrogating laser poses several
limitations on link performance and eye safety. Interrogating lasers at the wavelengths longer
than 1.4 µm are generally more suitable for human eye safety than those at shorter wavelengths
[1]. However, a typical silicon photodetector at the imaging receiver is not sensitive at
wavelengths beyond 1.1 µm. Since the photodetector is an important component of the optical
communication system, the laser should operate at a wavelength shorter than 1.1 µm. This
leads to improved eye safety by expanding the beam diameter. The diameter of the
interrogating beam should be expanded until the emitted irradiance is in the eye-safe region at
longer wavelengths, further in the infrared zone. Since the beam diameter of the interrogating
laser is expanded, the relatively wide-aperture optical system should be also employed in the
smart dust system.
In the next section, the signal-to-noise ratio (SNR) and link performance of the passive
optical system will be investigated. It will be shown that the required interrogating power with
a given SNR is proportional to λ3/2 [pbg(λ)]1/2 [η(λ)]-1/2 where pbg is a spectral irradiance of
ambient noise, η is the quantum efficiency of receiver and λ is a wavelength of the interrogating
laser. A laser at wavelength in the visible range has many advantages. When the human eye is

19
exposed to a high power level of optical radiation, it blinks or averts its gaze. This radiation in
the visible range is better for human eye-safety than radiation in the infrared range.
Furthermore, with shorter wavelength in the visible range, the factor λ3/2 which is proportional
to the required interrogating power can be minimized. And, the factor [η(λ)]-1/2 can be
minimized in a silicon photodetector with a thickness of a few µm. These minimizations lead to
decreasing the required interrogating power of the system. Unfortunately, with current laser
technology, the highest power visible laser is a 1200 mW device at a wavelength of 665 nm.
Therefore, for convenience, a laser diode of 10W at a wavelength of 830nm will be used in the
simulation.
4.3.2 Corner cube retroreflector
As mentioned before, the corner cube retroreflector has three mutually orthogonal planar
mirrors. Any incident light within a particular solid angle is reflected back in the direction of
the incident light. By moving one of the mirrors, the CCR can be used to modulate the incident
ray of light at kilohertz rates. To do this, an electrostatic force is used to pull a misaligned
mirror into the aligned position [10]. Then, a flexed polysilicon beam brings the mirror back to
the misaligned position. Non-orthogonal alignment and curvature during the fabrication can
degrade the ideal reflection efficiency. Since the reflected beam from the CCR spreads as it
propagates, this leads to a fundamental limit on the performance of the long-range passive
optical communication link.
As shown in Figure 4.1, a light ray along in− enters the CCR and changes its direction
as it propagates. in represents the incident direction where znynxn n iziyixi ++= with
1nnn 2iz
2iy
2ix =++ [8,11]. The incident ray strikes only one of the mirrors when an incident ray
is normal to one mirror. And, it strikes two of the mirrors when it is parallel to one mirror and
not normal to either of the other mirrors. Any other incident ray strikes all three mirrors. The
incident ray may not reflect back to the light source. This depends on both the incident

20
direction in− and where the ray first makes contact. The effective active area of the mirror is
the area where the incident rays that will be reflected back to the source make contact. Figure
4.2 shows how the effective area can be found in two possible cases: 2niy≥ niz≥ niy≥ nix and niz≥
2niy≥ 2nix.
The total scattering cross section or the effective area of the CCR can be found by
summing the effective areas of three mirrors [12]. The effective areas of y-z, x-z, and x-y plane
are A1, A2, and A3, respectively. The effective area of the entire CCR can then be expressed as
following vector from.
3iz2iy1ixi nnn)n( AAA ++=σ
In free space optical communication, the transmission path and receive path are
coincident. In order to separate the outgoing light and the incoming light, the optical
communication system uses orthogonal polarizations. As shown in Figure 4.3, this can be
achieved by employing a polarized beam splitter and a quarter-wave plate in the system. The
interrogating light generated by the laser is linearly polarized and passes through the polarized
beam splitter. After passing through a quarter-wave plate, the polarization state of the light
changes to become circularly polarized. The reflected light from the CCR then propagates with
the opposite circular polarization. After passing through the quarter-wave plate, it is changed to
linear polarization orthogonal to the original light from the laser. Then, the polarized beam
splitter will reflect it to the imaging receiver.

21
x
y
z
( )iziyix n- ,n- ,n-
( )iziyix n ,n- ,n-
( )iziyix n ,n ,n-
( )iziyix n ,n ,n
Figure 4.1: Raytrace through CCR
Figure 4.2: Effective areas of CCR surfaces: (a) 2niy≥ niz≥ niy≥ nix and (b) niz≥ 2niy≥ 2nix.

22
Laser
BeamExpander
PolarizedBeam Splitter
1/4 WaveplateCCR
ImagingReceiver
Figure 4.3: Diagram for Separating the interrogating light and received light
4.3.3 Imaging Receiver
A large entrance aperture of the receiver lens creates a large field of view to focus into
an image. By employing a large entrance aperture, the imaging receiver can obtain more
captured power from each CCR and this will improve the link SNR. The active optical image
stabilization of the imaging receiver helps the imaging receiver track jittering dust mote images.
CCD and CMOS are main technologies in the imaging system. CMOS imaging systems,
with active pixel sensors (APS) have many advantages over CCD imaging systems such as
lower cost, increased on-chip functionality, lower power requirements, and miniaturization.
Additionally, a CMOS imaging system has the ability to process incoming signals by on-
chip/on-pixel processing and this will make high-data-rate reception possible [1]. Since the
pulse of the interrogating laser can be synchronized with the image sensor frame clock, the
23
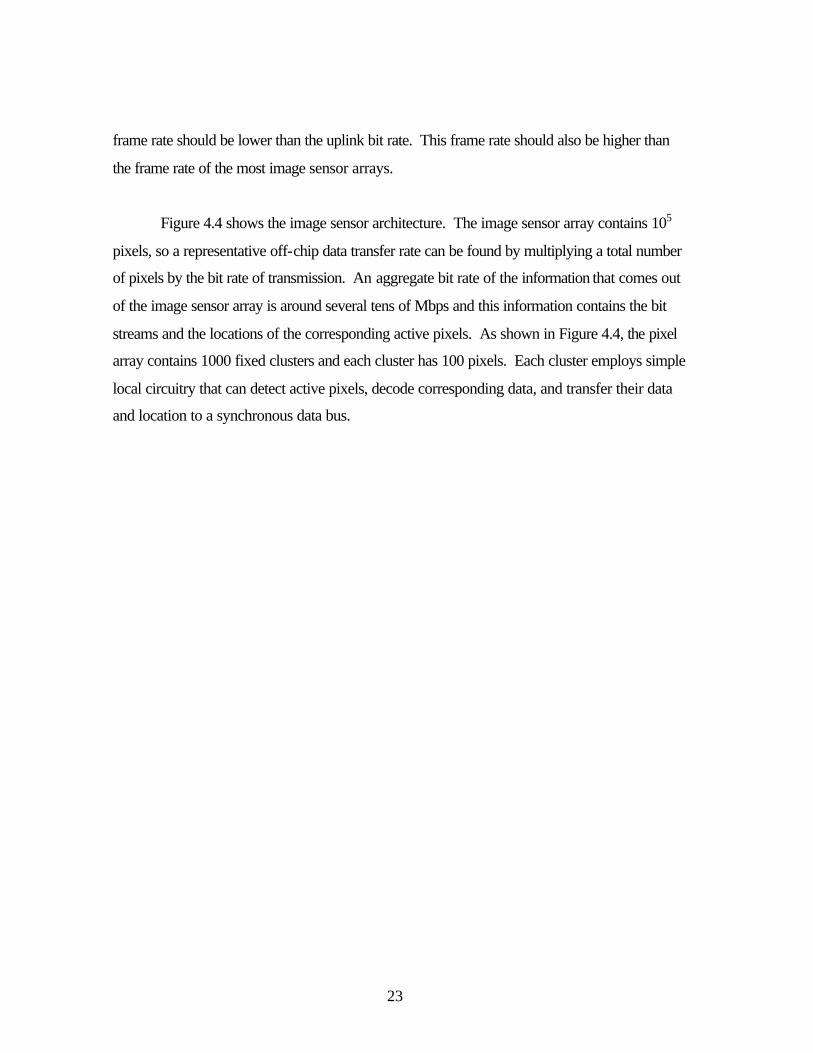
frame rate should be lower than the uplink bit rate. This frame rate should also be higher than
the frame rate of the most image sensor arrays.
Figure 4.4 shows the image sensor architecture. The image sensor array contains 105
pixels, so a representative off-chip data transfer rate can be found by multiplying a total number
of pixels by the bit rate of transmission. An aggregate bit rate of the information that comes out
of the image sensor array is around several tens of Mbps and this information contains the bit
streams and the locations of the corresponding active pixels. As shown in Figure 4.4, the pixel
array contains 1000 fixed clusters and each cluster has 100 pixels. Each cluster employs simple
local circuitry that can detect active pixels, decode corresponding data, and transfer their data
and location to a synchronous data bus.

24
Data andactive pixel locations
Detail of one cluster
Image sensor array
Aggregated data andactive pixel locations
Logical signal processingand interconnect plane
Figure 4.4: Imaging receiver based on CMOS image sensor system.
4.3 Analysis
In this section, a simplified mathematical approach to the analysis of the free-space
passive optical communication system using CCR and CMOS image sensor receiver will be
analyzed. The main object of the analysis is to determine the signal-to-noise ratio (SNR) of the

25
communication system. Using this analysis, we may be able to estimate the overall
performance of the system and critical design parameters.
4.2.1 Average received photocurrent
In this analysis, we neglect the imperfection in the CCR, atmospheric attenuation, and
ambient light from the atmosphere. Let us consider the interrogating laser light that emits a CW
beam at a central base station. Assume that the power of the interrogating beam is Pt and the
CW beam uniformly illuminates a field of semiangle θf as shown Figure 4.5.
LASER
r
df/2df
fθ
Figure 4.5: The propagation of the interrogating laser light at a base station.
When the distance from the interrogating laser is r, the illuminated field has a diameter df can be
found by
df = 2rtanθf.
The irradiance can be defined as the radian power incident per unit area upon a surface.
It is usually expressed in watts per square meter. The irradiance of the incident light Ir at a
distance r from the interrogating laser can be found by
26
fθππ
22t
2f
tr tanr
P
2d
PArea
beamCW ofPower )(I Irradiance =
== .
The interrogating light propagates to the CCR in the dust mote. The CCR has effective
diameter dc when it is not tilted with respect to the link axis. When the capture area tilted with
respect to incident axis, the corresponding irradiance is proportional to the cosine of the angle θc
between the incident axis and plane of the capture area, or the effective capture area is
decreased by a factor of fcap. In this case, the captured power on the CCR is
( ) ( )
( )ff
CC
θθθθπ
θπ22
cap2Ct
22
2Ct
2Cr
C
2C
r
cap
tanr4
fdP
tanr4cosdP
4cosdI
cos2
dI
aare capture effectiveIrradiance )Power(P
===
=
×=
,
where θC is an angle between the incident axis and the plane of the CCR.
The amount of light that is returned from the surface of the CCR is characterized by the
effective reflectivity RC. Since smart dust employs a CCR on the dust mote, the retroreflected
beam is returned in the same direction from which the incident beam came. The interrogating
beam is modulated by one of the CCR mirrors and this generates an on-off-keyed signal with a
non-return-to-zero pulse. By assuming that the probabilities of the ones and zeros are equal, the
average reflected power by the CCR can be found to be
( )ff
C
f
C
θθθ
θθ
22
cap2CCt
22
2CCtC
22
2CtCcap
CcapC tanr8
fdRP
tanr8cosdRP
2R
tanr4cosdP
2
RPR
21
PP ==
=== .
We now need to consider the diffraction of the light when the optical signal reflected by
the CCR propagates back to the base station. As shown below, the diffraction effect can be

27
modeled as a circular aperture with diameter dc using Fraunhofer diffraction theory when the
CCR is not tilted with respect to the link axis [1,13]. When the CCR is tilted, the diffracted
irradiance at the base station would be reduced by a factor fdif.
LASER
r
df
CCR
r
Imaging Receiver
dC
Figure 4.6: Fraunhofer diffraction at a circular aperture.
As investigating the Fraunhofer diffraction at a circular aperture as indicated in Figure 4.6, the
intensity is given by
0
21 I
)(2JI(P)
=
uu
,

28
15]. [14, 2
d D and
2d
a ,2
k ,ED
I and ,kasinu where2
CC220
===== π
λπ
λθ
r The angle θ is
the angle between the optical axis and the diverging wave, E is the total energy incident upon
the aperture, and λ is the wavelength of the interrogating beam. Since the range of the
communication link is much larger than the effective diameter of the CCR, we can treat the
incident light on the CCR as a plane wave. The 2
1 )(2J
uu
term in the above equation
represents the Airy pattern of the Fraunhofer diffraction distribution for a circular aperture
[16,17]. Since the diameter of CCR dC is much smaller than the distance r between a dust mote
and a base station, the intensity of the Fraunhofer diffraction can be approximated by
22
2C
C
r2
dP
Iλ
π
= .
Thus, when the CCR is tilted, the average irradiance at the lens of the imaging receiver can be
calculated as
difcap224
4CCt
dif22
2CC
dif22
2C
C
L fftan32r
dRPf
4rdP
fr
2d
PI
fθλπ
λπ
λ
π==
= .
The lens of the imaging receiver has an effective diameter dL and a transmission TL.
Then, the output power from the lens of the imaging receiver is IL TL 2
L
2d
π . Each pixel of
the imaging receiver has a non-light-sensitive region and the fraction fact expresses the
sensitivity of the camera pixel to the light intensity. Thus, the output power from the camera

29
pixel is IL TL 2
L
2d
π fact. The imaging receiver employs an optical bandpass filter to sort the
required bandwidth from the noise. This optical filter has a bandwidth ∆λ and a transmission Tf,
and the resulting output power is IL TL 2
L
2d
π fact Tf. The responsivity of the photodetector R
can be defined as the ratio between the photocurrent and the incident optical power. Thus, the
average received photocurrent at the imaging receiver is given by
isig = IL TL 2
L
2d
π fact Tf R =
fθλ
ππ224
actdifcapCfL2L
4Ct
2fact
2LLL
tan128r
fff RRTTddP
4RTfdTI
= . (4.1)
4.2.2 Ambient light noise
When we analyze the performance of the communication link, we must consider the
effects from the ambient noise. Ambient light comes from sunlight and other light sources. The
camera at the imaging receiver receives not only the optical signal but also the ambient light
noise from the CCR in the dust mote. The camera at the imaging receiver has a total of N pixels.
In order to receive the optical signal from the region where the interrogating beam covers, the
camera of the imaging receiver should have a field-of-view within a semiangle θf. The area of
the CCR where each camera pixel can be viewed is ( )
N
2fr tanθπ
.
Let us assume that the ambient light noise surrounding the CCR has a spectral irradiance
pbg and reflects the ambient light with reflectivity Rbg. Also assume that the optical bandpass
filter at the imaging receiver has a bandwidth ∆λ. The spectral irradiance or incident spectral
radiant flux density represents the flux density in a wavelength range. The irradiance within a
bandwidth ∆λ would be pbg ∆λ. Thus, the total power reflected from the area of the CCR where
each camera pixel covers is given by

30
( )NN
f22
bgbgbgbg
2f
bg
tanrR p R p
r tanP
θλπλ
θπ ∆=∆= .
A Lambertian reflector is a perfectly diffused reflector, which reflects electromagnetic
radiation equally in all directions. This spatial distribution is typical of a classical blackbody
source [13]. For such source, each part of the aperture has the same brightness as any other
part. In the smart dust system, the region surrounding the CCR is effectively a Lambertian
reflector [1]. So, the total power reflected from the area in the CCR diffuses out equally in all
directions. Thus, the reflected irradiance at the lens within the bandwidth ∆λ of the bandpass
filter in the optical receiver is given by
Nf
2bgbg
2
bgbg
tanR p
r
P I
θλ
π
∆== .
As shown in the previous subsection, the transmission of the optical bandpass filter Tf, and the
lens TL, the sensitivity of the camera pixel to the light fact, and the responsivity of the
photodetector R must be included in the calculation for the received photocurrent from the
ambient light. Thus, as done in previous section, the D.C. photocurrent per pixel due to the
ambient light is given by
ibg = IbgTL 2
L
2d
π fact Tf R
N4
R RfTTd tanp
4
RTfdTI bgactfL
2Lf
2bgfact
2LLbg θλππ ∆
== . (4.2)
The D.C. photocurrent generates a white shot noise. The shot noise is caused by random
fluctuation in the motion of charge carriers and leads to fluctuations in the current, even when
the incident optical signal has constant power. The one-sided spectral density of the shot noise
is given by S = 2qi where q is the electron charge and i is the current [18]. Thus, the power
spectral density of the shot noise per pixel can be calculated to be
31
Sbg = 2qibg.
Leakage current is the unwanted current that flows through the protective ground
conductor to ground. The leakage current induces a white shot noise. Thus, the power spectral
density per pixel due to the leakage current is given by
Sleak = 2qileak.
4.2.3 Average SNR
In this subsection, the average SNR based on the previous subsections will be derived.
We need to assume that the optical signal from CCR is incident upon only one pixel, which is
the best case. The imaging receiver is synchronized to the received signal. For analytical
convenience, the integrator is assumed to have a gain of G.
The bit rate B is defined as the number of bits occurring per unit time in a bit stream.
Each bit lasts for a certain period of time TB = 1/B, known as the bit period. The imaging
receiver integrates the received photocurrent for a fraction gint of each bit interval. At the end of
each interval, the output signal from the integrator is sampled, this sampled signal is compared
to a threshold, and the binary code is used to convert each sampled value into a string of “1” and
“0” bits. The average signal component of the sampled signal is isig gint.
The bit rate can be expressed as sf m B = where fs is the sampling frequency and m is the
number of bits needed to code each sample. The sampling frequency can be found from the
Nyquist criterion fs ≥ 2∆f, where ∆f is the effective noise bandwidth. Here, the number of bits
needed to code each sample can be expressed by intg1
. Using the above relations, the effective
noise bandwidth can be expressed in terms of the bit rate B and the fraction gint of each bit
interval as

32
2g B
f g
f2f m B int
ints =∆⇒
∆== .
The noise variance can be found by
( ) ∫∞
∞−
== df )f(Si 2tot
2tottot tσ ,
where itot(t) is the current fluctuation related to shot noise, and Stot(f) is the spectral density of
the shot noise. Thus, the noise component of the sampled signal has a variance
2
g B)SS(f )SS(df )f(S int2 leakbg
leakbgtottot
+=∆+== ∫
∞
∞−
σ .
Consequently, the average SNR is given by the ratio between the average signal component and
the variance of the noise component of the sample as
]1[ g B)SS(
g 2i)g (iSNR
int
int2sig
2tot
intsigbest
leakbg +==
σ. (4.3)
The average probability of bit error or average bit error rate (BER) for binary
modulation with a Gaussian-distributed noise source is given by
Pb = ( )SNRQ ,
where Q(x) is the Gaussian Q-function defined as
( ) 0 x [19]. 21
xQ 2/2
≥= ∫∞
∞−
− dte t
π

33
In the imaging receiver, the received optical signal from the CCR may overlap within
several pixels depending on the size of the CCR image spot, the pixel size of the image sensor,
and the position of the CCR. And, the image sensor has physical gaps between pixels and non-
light-sensitive region on each pixel.
There are two alternative design options to address this issue. First, in order to have a
large fraction of the image spot in the light-sensitive region on the pixel, the pixel size should be
comparable to the spot size. And, the shape of each pixel should be hexagonal in order to
minimize the number of pixels that the CCR image spot can cover, namely N0. When the image
sensor employs the hexagonal pixels, the range of N0 is from one to three.
For optimal performance, we can employ the maximal-ratio combining (MRC)
technique to process the signals [1]. Each signal comes from the pixel that the optical signal is
divided into is multiplied by the corresponding amplitude-to-noise variance ratio and from a
linear combination of these signals [19,20]. For the suboptimal technique, the pixel containing
the most confined signal or selecting the best of the pixels (SB) can be used. Either technique
has a corresponding SNR penalty. The receiver achieves the worst SNR when the optical signal
is equally divided into N0 pixels. In this case, the SNR of MRC and SB given by
20
BESTWORST
0
BESTWORST N
SNRSNR and ,
NSNR
SNR == SBMRC .
The MRC has much better performance than the SB. Nevertheless, MRC still has a large
penalty when the optical signal overlaps three or more pixels. Furthermore, to processing the
MRC, we need to determine the weight of each signal that comes from the pixels and combine
the signals with variable weight for the SNR estimation.
Secondly, we can just design the pixel size to be much larger than the spot size. This
would make the image spot fall on only one pixel. Since the receiver does not need to employ
34
the optimal technique, MRC or SB to perform SNR estimation, this simplifies the design of the
receiver. Also, there would be no SNR penalty due to the optimal technique. If the image spot
lies on the gap between pixels or non-light-sensitive region of the pixel, the receiver may not be
able to receive these signals. Additionally, we can neglect these cases since we use large
number of dust motes in most applications.
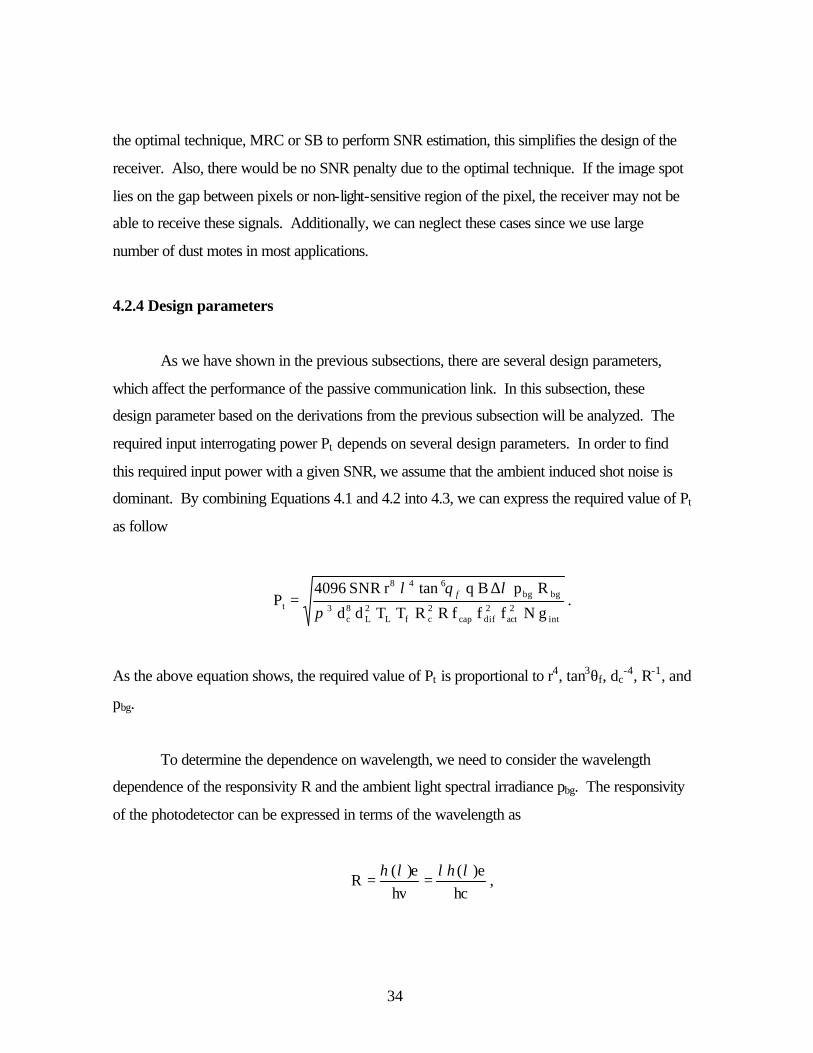
4.2.4 Design parameters
As we have shown in the previous subsections, there are several design parameters,
which affect the performance of the passive communication link. In this subsection, these
design parameter based on the derivations from the previous subsection will be analyzed. The
required input interrogating power Pt depends on several design parameters. In order to find
this required input power with a given SNR, we assume that the ambient induced shot noise is
dominant. By combining Equations 4.1 and 4.2 into 4.3, we can express the required value of Pt
as follow
int2
act2difcap
2cfL
2L
8c
3bgbg
648
t g N f f f R R T T d d
R p B q tan r SNR 4096 P
π
λθλ ∆= f .
As the above equation shows, the required value of Pt is proportional to r4, tan3θf, dc-4, R-1, and
pbg.
To determine the dependence on wavelength, we need to consider the wavelength
dependence of the responsivity R and the ambient light spectral irradiance pbg. The responsivity
of the photodetector can be expressed in terms of the wavelength as
hce)(
hve)(
Rλληλη
== ,

35
where η is the quantum efficiency that is the ratio between the electron generation rate and the
photon incidence rate, c is the speed of light in vacuum, and h is Planck’s constant. When the
ambient light is dominated by sunlight, the wavelength dependence of the ambient light spectral
irradiance pbg can be interpreted as approximating the light generated by blackbody radiation.
The blackbody is defined as a theoretical object that absorbs all incident radiation. Therefore, it
reflects no radiation and appears perfectly black. In practice, no material has been found to
absorb all incoming radiation. Furthermore, it is a perfect emitter of radiation. At a particular
temperature, the blackbody would emit the maximum amount of energy possible for the
particular temperature. This value is defined as the blackbody radiation. In order to determine
the blackbody radiation versus wavelength at a particular temperature, we use Planck’s energy
distribution formula given as
( )
−
=1e
ch 2 p
kThc5
2
bgλλ
πλ ,
where h is Planck’s constant, k is the Boltzmann constant, and T is temperature. The
wavelength range of interest in a smart dust system is from 400nm to 900nm and the
temperature is about 300 K. With these values, the ambient light spectral irradiance pbg(λ) is
approximately proportional to a factor of two. Therefore, from the above equations, the
required value of Pt is proportional to λ3/2 [pbg(λ)]1/2 [η(λ)]-1/2.
5. Fiber Optic Communication
Fiber-optic communication is one of alternative communication systems for smart dust.
The architecture of fiber-optic communication system is shown in Figure 5.1. For downlink, a
single laser transmitter in base station generates an on-off-keyed signal containing downlink

36
data and commands. The beam splitter divides the interrogating signals into the fibers that are
connected to each dust mote. After passing through optical isolator, the interrogating signals go
into directional coupler. Directional coupler divided them into two fibers. One of them will be
passed while the index-matching material blocks the other. Finally, after passing lens, the
interrogating signals reach to the receivers of each dust mote. On the uplink, each dust mote is
equipped with a CCR. CCR modulates interrogating beams from the base station and reflects
these signals back to fiber cable. The directional coupler divides the signals into two fibers.
The signals in the fiber that is connected to the optical isolator will be blocked, and the signals
in the other fiber will reach to the receiver in the base station.
Laser
Optical BeamSplitter
GRIN-rodLens
DirectionalCoupler
Indexing matchingMaterial Optical
Isolator
Photodetector
CCR
DUST MOTES
BASE STATION
OpticalConnector
Photodetector
Figure 5.1: Bidirectional fiber-optic communication link.

37
5.1 Optical Fiber
An optical fiber determines the information-carrying capacity of a fiber optic
communication system. The two most important characteristics of an optical fiber are pulse
dispersion and loss.
5.1.1 Fiber Dispersion
Dispersion in fiber is temporal spreading of pulse. It should be obvious how this will
limit bandwidth in a digital transmission system [21]. All the modes of a multimode fiber
propagate with different velocities and led to the use of single-mode fibers for almost all
communication application. Pulsed spread even in single-mode fibers because the spectral
components of the pulse have slightly properties of the fiber. Fiber dispersion has two
contributions, material dispersion and waveguide dispersion. The extent of pulse broadening for
fiber of length L is found as
λ∆=∆ L DT ,
where D is the dispersion parameter and is expresses in unit of ps/(km-nm) [18]. Dispersion D
can be written as the sum of the material dispersion DM and the waveguide dispersion DW.
D = DM + DW.
The material dispersion and waveguide dispersion are given by
[ ]2
2
W
M
D
1
D
dVVbdV
cn
d
dn
cg
λ
λ∆
−=
=.

38
where CLADCORE nna2
V −=λπ
, and CLADCORE
CLAD
nnn-n
b−
= [18]. V is a parameter, b is a
normalized propagation constant, a is a core radius, ng is a group index, n is an effective index,
and COREn , and CLADn are refractive indices in core and cladding respectively. The total
dispersion is zero near 1.31 µm and this wavelength refers to the zero-dispersion wavelength
λZD.
5.1.2 Fiber Loss
Fiber loss is one of the fundamental limiting factors. Since optical receiver requires a
certain minimum amount of power to obtain information from the sensor motes, the
transmission distance is limited by fiber loss. Fiber loss can be found as follow
( )
−=⇒=
−
in
outL
in
out
PP
LPP
1010 log
10dB/km 10 α
α
, (5.1)
where L is the length of fiber, and Pout and Pin are the output power and input power respectively.
5.1.2.1 Absorptive Losses
Absorptive losses can be divided into intrinsic and extrinsic losses. Intrinsic absorption
occurs when the propagating lightwave interacts with components of fiberglass’s material
component [21]. In the wavelength of interest to optical communication (0.8-0.9 µm and 1.2-
1.5µm), intrinsic absorption can be neglected.
Extrinsic absorption is caused by the presence of minute quantities of metal ion and OH-
ions in glass. Using the vapor-phase axial deposition technique, a wide low-loss window in the
silica based ultrapure fiber can be achieved.
39
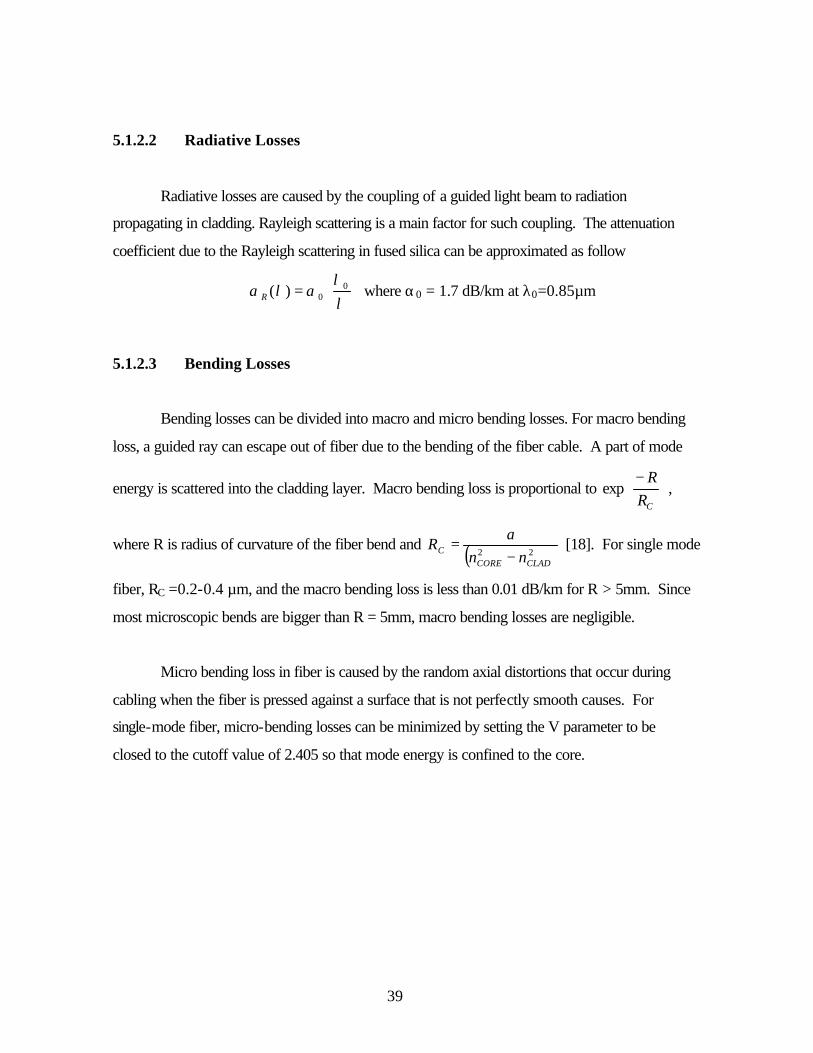
5.1.2.2 Radiative Losses
Radiative losses are caused by the coupling of a guided light beam to radiation
propagating in cladding. Rayleigh scattering is a main factor for such coupling. The attenuation
coefficient due to the Rayleigh scattering in fused silica can be approximated as follow
=
λλ
αλα 00)(R where α0 = 1.7 dB/km at λ0=0.85µm
5.1.2.3 Bending Losses
Bending losses can be divided into macro and micro bending losses. For macro bending
loss, a guided ray can escape out of fiber due to the bending of the fiber cable. A part of mode
energy is scattered into the cladding layer. Macro bending loss is proportional to
−
CRR
exp ,
where R is radius of curvature of the fiber bend and ( )22CLADCORE
C nna
R−
= [18]. For single mode
fiber, RC =0.2-0.4 µm, and the macro bending loss is less than 0.01 dB/km for R > 5mm. Since
most microscopic bends are bigger than R = 5mm, macro bending losses are negligible.
Micro bending loss in fiber is caused by the random axial distortions that occur during
cabling when the fiber is pressed against a surface that is not perfectly smooth causes. For
single-mode fiber, micro-bending losses can be minimized by setting the V parameter to be
closed to the cutoff value of 2.405 so that mode energy is confined to the core.

40
5.2 Link Components
Link components for optical fiber communication consist of the beam splitter, directional
coupler, and optical isolator. In this section, the characteristics of these components will be
discussed.
5.2.1 Directional Coupler
The optical fiber directional coupler is one of the most important fiber components.
Figure 5.2.shows the architecture of the directional coupler. When two fiber cores are closed to
each other, the modes of these two fibers become coupled and the input power divided into two
fibers [22]. The coupling between two guides can be described by coupled wave theory as
zsin)0(P)z(P
and , zsin1)0(P)z(P 2
2
2
1
222
2
1
1 γγκ
γγκ
=−= , (5.2)
where ( ) .[23] and 41
2122 ββββκγ −=∆∆+= κ is the coupling coefficient and can be
measured by the strength of interaction between the two fibers. β1 and β2 represent the
propagation constants of the modes of waveguides in two fibers. If β1 = β2, the power exchange
between the two fibers is complete. On the other hand, If β1 ≠ β2, the exchange of power is
incomplete. When a directional coupler employs two identical fibers, the 3-dB power splitter
can be achieved. Since β1 = β2, κ = β , and Equation 5.2 can be expressed as
( ) ( )Lsin)0(P)L(P and , Lsin1)0(P)L(P 212
211 κκ =−= ,
where L is a length of interaction. By setting L = π/4κ, two output power P1, and P2 can be
found as

41
)0(P21
P and , )0(P21
P 1211 == .
Therefore, a directional coupler acts as a 3-dB power splitter.
In a directional coupler, several characteristics can be defined as fellow [24].
Coupling ratio (dB) = 2
21
PPP
log 10+
Excess loss (dB) =21
1
PP(0)P
log 10+
Insertion loss (dB) = 2
1
P(0)P
log 10 = Coupling ratio + excess loss
P1(0) P1(z)
P2(z)L
Figure 5.2: Architecture of the directional coupler
5.2.2 Beam Splitter
The optical bema splitter is a basic element of the optical fiber communication systems.
It usually consists of the Y-junction branches. The Y-branch is a waveguide-type device and
divides the received power into two channels. By combining Y-branches, the 1×N beam splitter
can be achieved. A basic structure is shown in Figure 5.2 (a). Y–branch behaves as a power

42
divider according to the branching angle and the refractive-index difference [25]. As increasing
half angle θ, the power transmission of the Y-junction is decreased and the power would radiate
into the substrate. Hence, the total power transmission critically depends on the angle θ. The
junction should be much bigger than the width of the guide in order to achieve effective
separation of the output arms.
The loss of Y-branch is mainly comes from the radiation loss at the branching point.
The phase fronts of the incident waves before branching point are perpendicular to the
propagation direction of the incident waveguide. Then, the incident waves propagate into two
arms and they are oblique to the waveguide in the two arms. This phenomenon causes the
radiation loss.
One way to decrease the radiation loss is to employ the structure shown in Figure 5.2 (b)
called antenna-coupled Y-branch [26]. Since the refractive index in the n3 region smaller than
n1 and n2, the incident filed spreads into the n3 region. This filed spreading makes the phase
fronts of the waves to be perpendicular to the waveguide in two arms. Hence, a relatively small
radiation loss can be achieved.
θ
Output
Output
Input Light n3n1
n1
n1
n2
n2
n2
Figure 5.3: Y-junction beam splitter: (a) Y-branch (b) antenna-coupled Y-branch

43
5.2.3 Optical Isolator
Return beams are known to have a degrading effect on the performance of fiber optic
communication. To prevent such effect, optical isolators are usually employed in fiber optic
communication system. Optical isolator allows the transmission of forward light but blocks the
reflection of light in the reverse direction and prevents one system from disturbing another
while transmitting signals between them [23]. A fiber isolator minimizes back-scattering and
back-reflection of optical signals, thus maintaining a high signal-to-noise ratio.
The architecture of an optical isolator is shown in Figure 5.4. A polarizer makes the
incident light to be linearly polarized. A polarization rotator rotates the polarization angle of the
linearly polarized light by π/4. Then, the light comes out of the rotator would pass through an
analyzer. For reflected light, an analyzer makes the polarization angle of the reflected light to
be π/4, and the rotator with π/4 makes it to be π/2. A polarizer blocks the light with polarization
angle π/2. The insertion loss L and isolation I can be found as
t
i
t
i
PP
log 10 I and , PP
log 10 L == .
Incident Light
Reflected Light
PiPo
4π
4π
2π
Figure 5.4: Structure of optical isolators

44
5.2.4 Index-matching material
Index-matching material is a substance, which has an index of refraction that is pretty
closed to an index of refraction of an optical fiber. It is used to reduce Fresnel reflection at the
fiber endface. In optical fiber communication for smart dust, the index-matching materials are
employed at the end of directional coupler to avoid reflection from the fiber endface.
5.2.5 GRIN-rod Lens
The graded index (GRIN)-rod lens is a cylindrical glass rod that contains a parabolic
graded refractive index profile with a maximum at the centre [23]. This property of the lens
leads to developments on graded index fiber waveguide. GRIN-rod lens can be used to expend
and collimate an incoming light beam or focus an incoming light to a small area located at the
center of opposite lens face. Light propagation through the lens can be determined by the lens
dimension and wavelength of incident light.
By using the paraxial ray equation, the ray propagation through GRIN-rod lens can be
approximately described as
drdn
n1
dzrd2
2
= , (5.3)
where r is a radial coordinate, z is the optical axis coordinate and n is the refractive index of the
medium. The refractive index in a graded-index medium can be expressed by
−=
2Ar
1nn(r)2
1 , (5.4)
45
where A is a positive constant and n1 is a refractive index on the optical axis. By substituting
Equation 5.3 in Equation 5.4, the ray propagation is expressed as:
Ardz
rd2
2
−= . (5.5)
The general solution of Equation 5.5 can be found as:
( ) ( )zz AsinKAcosKr 21 += ,
where K1 and K2 are constants. Therefore, all the incoming rays propagate a sinusoidal path
through the GRIN-rod lens. The lens can be modified by changing the period (pitch) of the
sinusoidal path.
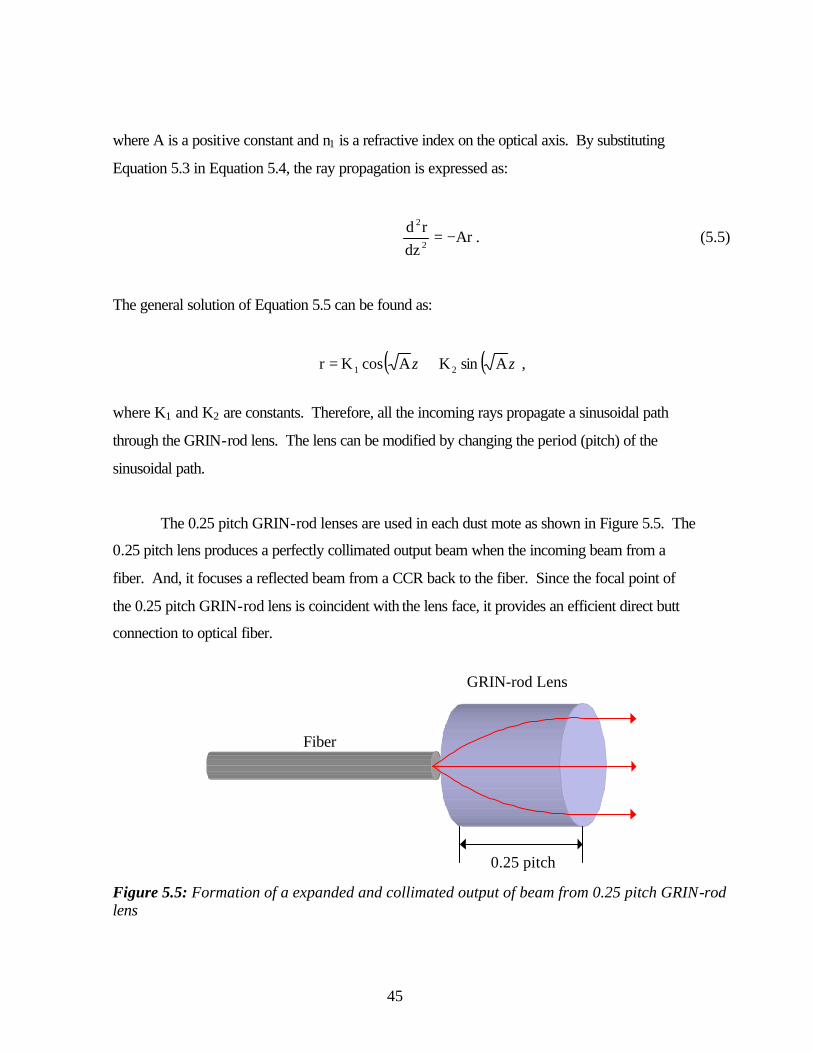
The 0.25 pitch GRIN-rod lenses are used in each dust mote as shown in Figure 5.5. The
0.25 pitch lens produces a perfectly collimated output beam when the incoming beam from a
fiber. And, it focuses a reflected beam from a CCR back to the fiber. Since the focal point of
the 0.25 pitch GRIN-rod lens is coincident with the lens face, it provides an efficient direct butt
connection to optical fiber.
GRIN-rod Lens
Fiber
0.25 pitch Figure 5.5: Formation of a expanded and collimated output of beam from 0.25 pitch GRIN-rod lens

46
5.2.6 Fiber connector
Fiber connector is one of the important components of fiber-optic communication
system. The connector is a mechanical device connected to the end of a fiber cable. This
device is designed to connect a fiber with another optical device [25]. In following subsection,
various types of the fiber connectors will be discussed [23,27].
• Traded connector
The threaded type of connector is used by a sub-multi assembly (SMA) connector. This
connector is a first generation connector. One problem associated with this connector is the
air-gap in a poor connection. This poor connection generates a change in the index of
refraction and it leads to a Fresnel reflection loss in fiber optic communication system.
• Bayonet connector
Bayonet connector is a more advanced type of connector than the threaded connector.
This device employs a twist-turn fastening operation that reduces the possibility of the
generating an air-gap. Two popular bayonet connectors are the straight tip (ST) and ST-II
connectors pioneered by AT&T.
• Push-pull connector
Push-pull connector uses a ceramic ferrule. The ferrule is functioned as an alignment
mechanism in this fiber connector. One popular push-pull connector is the stick and click
(SC) connector including a locking tab. This connector is used primarily with single-mode
fiber cable.

47
5.3 Analysis
In this section, a simplified mathematical approach to the fiber-optic communication will
be achieved. Based on the power budget of the link, the signal-to-noise ratio (SNR) of the
communication system can be determined. Using this analysis, the performance of the link and
critical design parameter can be estimated.
5.3.1 Downlink
Based on the simplified diagram of the fiber-optic link design in Figure 5.6, a simple
power budget of the link components can be achieved. A single laser transmitter in base station
generates an on-off-keyed signal with optical power PL at wavelength λ of 1310 nm. Using the
power budget of the link components, the output power of the base station PBSout can be found
by
10][
LBSout 10PPdBossInsertionl
−×= .
Since the optical fiber has a zero dispersion wavelength at 1312 nm, dispersion in single
mode fiber can be neglected. The optical fiber has an attenuation coefficient α and it is
expressed in units of dB/km. By using Equation5.1, the output power of the optical fiber PGRID
can be found as
L10
BSoutGRIN 10PPα
−×= ,
where L is a length of the optical fiber in units of km.
The 0.25-pitch GRID-rod lens has a diameter of the collimated output beam dG. Hence,
the irradiance incident upon the CCR IC is

48
2G
GRIN2
G
GRINC d
P4
2d
PI
ππ
=
= .
As done in section 4.2.1, the captured power on the CCR Pcap is
cap
2C
Ccap f 2
d IP
= π ,
and the average reflected power by the CCR PC can be found
2
RPP cap
C = .
5.3.2 Uplink
After reflecting by the CCR, the signal propagates into the optical fiber again. As done
in previous subsection, the average output power of the fiber PBsin is
L10
CBSin 10PPα
−×= ,
and the input average optical power to the photodetector PPIN can be found by
10][
BSinPIN 10PPdBossInsertionl
−×= .
The photodetector has a responsivity R, a dark current Id at 300K, a load resistance RL and a
bandwidth ∆λ. Thus, the average photocurrent of the receiver is

49
RPI PINS ×= . (5.6)
The shot noise power of the receiver can be found by
( )dS2SN II q 2I +∆= λ , (5.7)
where q is an electrical charge. The thermal noise power can be also found by
L
2TH R
TK 4I
λ∆= , (5.8)
where T is a temperature and K is the Boltzmann’s constant. Finally, The signal-to-noise ratio
can be found as
2TH
2SN
2S
III
SNR+
= . (5.9)

50
Fiber
Laser
CCR
Photodetector
OPTICAL COMPONENTSConnectors
Beam SplitterDirectional Coupler
L
Fiber
dG
OPTICAL COMPONENTSConnectors
Directional Coupler
PL
L
PBSout
PGRID
Pcap
Pc
PBSin PPIN
IS
DOWNLINK
UPLINK
GRIN-rodLens
Figure 5.6: A simplified diagram of the fiber-optic link design
6. NETWORK PERFORMANCE
In this section, the performances of the free-space passive optical communication system
and fiber-optic communication will be investigated. The typical values of design parameters are
used to analyze the performance of the links based on the previous link analysis [1]. The signal-
to-noise ratio (SNR), a minimum detectable power (MDP) and a maximum rage of link will be
derived based on the practical design parameters.

51
6.1 Free-space passive optical communication
Table 2 lists the typical values of design parameters for the free-space optical
communication. Based on these design parameters, the performance of the free-space passive
optical communication can be achieved by link analysis from Chapter 4.
The distance of the propagating signal versus corresponding signal-to-noise ratio and
average received photocurrent are shown in Figure 6.1 (a) and (b) when an interrogating power
is 10 W. As shown in Equation 4.1, an average received signal is proportional to 1/r4. Hence,
the average received signal is rapidly decreased as the signal propagates. The distance of the
propagating signal versus corresponding signal-to-noise ratio with various input power are
shown in Figure 6.2.
Figure 6.1: For the free-space passive optical communication, the distance of the propagating signal versus corresponding signal-to-noise ratio and average received photocurrent when an interrogating power is 10 W: (a) distance versus SNR and (b) distance versus average received photocurrent.
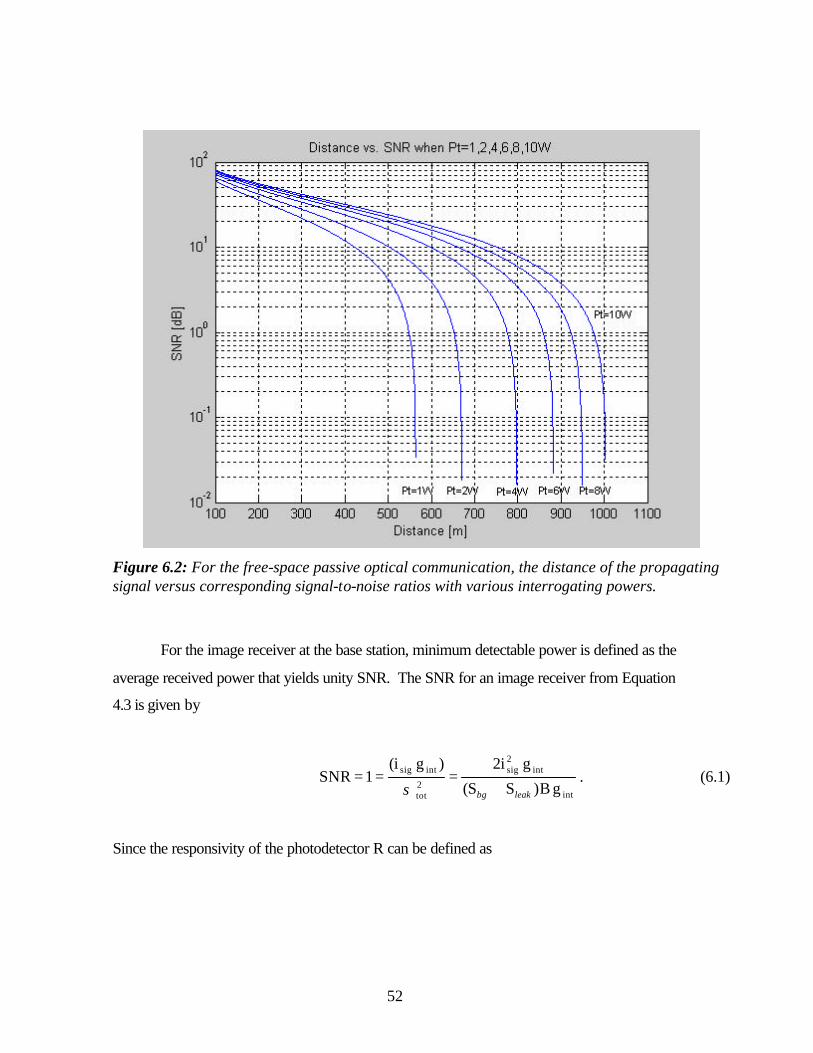
52
Figure 6.2: For the free-space passive optical communication, the distance of the propagating signal versus corresponding signal-to-noise ratios with various interrogating powers.
For the image receiver at the base station, minimum detectable power is defined as the
average received power that yields unity SNR. The SNR for an image receiver from Equation
4.3 is given by
int
int2sig
2tot
intsig
g B)SS(
g 2i)g (i1SNR
leakbg +===
σ. (6.1)
Since the responsivity of the photodetector R can be defined as

53
rPsigi
R = , (6.2)
where Pr is a minimum detectable power. By substituting Equation 6.1 into Equation 6.2, the
minimum detectable power can be found by
13
int
103058.2g 2
B)SS(1 −×=+
= leakbgr R
P . (6.3)
At a given wavelength, the noise-equivalent power (NEP) can be defined as the required
incident power to produce a photocurrent equal to the noise current within a unit bandwidth.
Hence, NEP can be obtained from Equation 6.3:
15
int
103058.2g 2
)SS(1 −×=+
= leakbg
RNEP .
From the calculation of a minimum detectable power, a maximum range of a free-space
passive optical link with a particular input power can be achieved. By substituting Equation 4.1
into Equation 6.1, a maximum range of the link rMAX can be found by
81
24
22act
2l
2f
2dif
2c
2cap
2t
4l
48cint
MAX )SS( tan 8192
R f T T f R f P d d gr
+=
leakbgfθλ
π.
The various input powers versus corresponding maximum ranges of the links are shown in
Figure 5.3.

54
Figure 6.3: The input powers versus corresponding maximum ranges of the free-space passive optical link.
Symbol Description Typical value Units
qf Semiangle of illuminated field 1 degrees
dc Effective diameter of CCR when not tilted 5×10⁻⁴ m
Rc Effective reflectivity of CCR 0.85 W/W
fcap Reduction of effective capture area when tiled 0.5 W/W
fdif Reduction of diffracted irradiance due to CCR
tilted 0.5 W/W
λ Interrogation wavelength 830 nm
∆λ Optical bandpass filter bandwidth 5 nm

55
Tf Optical filter transmission 0.8 W/W
Tl Effective transmission of camera lens 0.8 W/W
dl Effective diameter of camera lens 0.1 m
R Responsivity of photodetector 0.5 A/W
fact Fraction of camera pixel area that is sensitive to
light 0.75 m2/m2
pbg Ambient light spectral irradiance (bright sunlight) 0.8 W/m2-nm
Rbg Reflectivity of the region surrounding CCR 0.3 W/W
N Number of pixels in image sensor 105 -
ileak Leakage current per pixel 10-12 A
B Bit rate of on-off-keyed link 104 bps
gint Fraction of bit interval during which camera
integrates 0.95 s/s
Table 2: Typical values of design parameters for free-space optical communication
6.2 Fiber-optic communication
In this subsection, the performance of a fiber-optic communication will be analyzed base on
the practical optical fiber components with particular specifications. In this analysis, eight dust
motes are employed. Table 3 lists the typical values of design parameters for the practical
optical fiber components. Based on these design parameters, the performance of the fiber-optic
communication can be achieved by link analysis from Chapter 5.
The distance of the propagating signal versus corresponding signal-to-noise ratio and average
received photocurrent are shown in Figure 6.4 (a) and (b) when an interrogating power is 1 mW.
As shown in previous chapter, an average received signal is is proportional to L
102
10α
− and

56
linearly proportional to the insertion losses of the components. Hence, the average received
signal is relatively slowly decreased as the signal propagates. The distance of the propagating
signal versus corresponding signal-to-noise ratio with various input power are shown in Figure
6.5.
Figure 6.4: For the fiber-optic communication, the distance of the propagating signal versus corresponding signal-to-noise ratios and average received photocurrent when an interrogating power is 1 mW: (a) distance versus SNR and (b) distance versus average received photocurrent.

57
Figure 6.5: For the fiber-optic communication, the distance of the propagating signal versus corresponding signal-to-noise ratios with various interrogating powers.
As mentioned in previous subsection, for the photodetector at the base station, minimum
detectable power is defined as the average received power that yields unity SNR. The SNR for
an image receiver from Equation 5.9 is given by
2TH
2SN
2S
III
1SNR+
== . (6.4)
Since the responsivity of the photodetector R can be also defined as
rPSI
R = , (6.5)

58
where Pr is a minimum detectable power. The IS is assumed to be much smaller than Id. Then,
by substituting Equation 6.5, 5.6, 5.7 and 5.8 into Equation 6.4, the minimum detectable power
can be found by
9
Ld 105843.9
RTK 4
I q 2f1 −×=
+∆=
RPr . (6.6)
At a given wavelength, the noise-equivalent power (NEP) can be defined as the required
incident power to produce a photocurrent equal to the noise current within a unit bandwidth.
Hence, NEP can be obtained from Equation 6.6:
12
Ld 105154.1
RTK 4
I q 21 −×=+=R
NEP .
From the calculation of a minimum detectable power, a maximum range of a free-space
fiber-optic link with a particular input power can be achieved. By using Equation 5.6, 5.7 and
5.8 and 6.4 under the previous assumption, a maximum range of the link rMAX can be found by
( )
14.0
1.4 R R f d P
I I f q 2 d 4log
L22
C2cap
4C
2L
THd2G
10
MAX −
+
+∆
= .
The various input powers versus corresponding maximum ranges of the links are shown in
Figure 5.3.
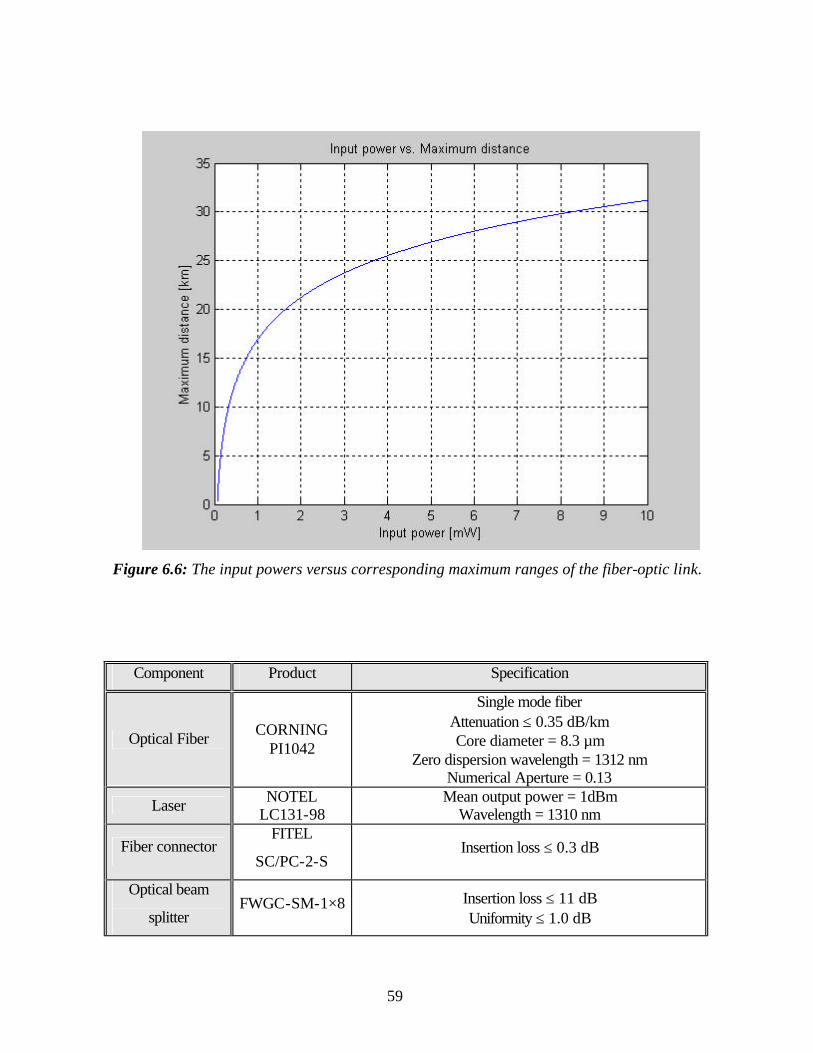
59
Figure 6.6: The input powers versus corresponding maximum ranges of the fiber-optic link.
Component Product Specification
Optical Fiber CORNING PI1042
Single mode fiber Attenuation ≤ 0.35 dB/km Core diameter = 8.3 µm
Zero dispersion wavelength = 1312 nm Numerical Aperture = 0.13
Laser NOTEL LC131-98
Mean output power = 1dBm Wavelength = 1310 nm
Fiber connector FITEL
SC/PC-2-S Insertion loss ≤ 0.3 dB
Optical beam
splitter FWGC-SM-1×8 Insertion loss ≤ 11 dB
Uniformity ≤ 1.0 dB

60
Optical isolator SUMITOMO
SE-13S Insertion loss ≤ 0.5 dB
Isolation ≥ 40 dB
Directional coupler
DELTA OPC-KA5A4-
33500
Coupling Ratio = 50/50 Insertion loss ≤ 3.6 dB
GRIN-rod lens
GRINTECH GT-LFRL-180-
025-50-CC (1310)
Diameter = 1.8 mm Reflection loss ≤ 0.5 %
Photodetector AGERE A2609C
PIN responsivity = 0.85 A/W Dark current = 10 nA @ 300K
Bandwith = 40 MHz Thermistor resisteance = 10kΩ
Table 3: The practical optical fiber components with specifications.
6.3 Future of smart dust
Smart dust is a devise in the order of a cubic millimeter, which contains four basic
components: power, computation, sensor and communication. There are a number of research
institutions that are currently working on centimeter-scale distributed sensor network. Several
research groups at UCLA are developing an entire radio on a single CMOS substrate and a low
power wireless MEMS.
The future of smart dust lies on both optical communication and fiber-optic
communication. The MEMS is one of the main technologies that can improve both
communication systems. There are several obstacles in the developing a communication system
for the cubic millimeter-scale distributed sensor network. Nevertheless, it stands in the way of
the future commercialization of smart dust. To improve performances of the free-space optical
and fiber-optic communication systems, it needs to achieve a high data rate. This can be
achieved by improving MEMS techniques and a data rate of the imaging receiver.
61
Power consumption is also one of the major components that play a key role in design of
the smart dust. While microcontroller consumes less power, battery energy densities have not
improved significantly over the years. In the future, a custom circuit design of the
microcontroller with the choice of electronics will allow to employ additional functionality.
The additional functionality will make future smart dust to be able to perform more complex
functions.
7. CONCLUSION
Smart dust is an ongoing research project whose main objective is to design a cubic
millimeter-scale sensing nodes capable of bidirectional communication. The applications of
miniature distributed sensor networks are numerous. Smart dust has four major components:
power, computation, sensors, and communication. With these four components, a number of
smart dust systems can be designed and modified depending on the applications. A
communication system for smart dust is also one of the design issues depending on the
applications.
The main objective of this thesis is to design a communication system that can minimize
smart mote power consumption and maximize link range and the number of dust motes that can
communicate simultaneously with the base station. Each dust mote is able to communicate with
a central transceiver, or communicate in mote-to-mote fashion among dust motes. In this thesis,
a free-space optical passive optical communication and fiber-optic communication are analyzed
and compared.
Both free-space passive optical communication and fiber-optic communication systems
have several advantages over other communication systems. One of the most effective
advantages is that each dust mote does not need to have an onboard light source to transmit
desired sensor information. This leads to the optical communication to have advantage on
62
power consumptions. In addition, optical transceivers require relatively simple baseband analog
and digital circuitry. Table 4 shows the comparison of the estimated performance of the fiber
and free-space passive optical communication systems.
Since free-space passive optical communication is a wireless communication system, it
will be advantageous over the wired communication systems. The number of dust motes in the
particular system can be easily increased without adding the additional components in base
station. In most application, the free-space passive optical communication using CCR-based
transmitter is favored. Nevertheless, this communication system comprises several limitations.
The communication between dust motes cannot be performed. If a given mote does have a clear
line of sight to the base station, the mote would not be able to perform any communication and
this would be isolated from the system. Since each CCR can only reflect a small fraction of the
illuminating light beam, the rest of illuminating light is wasted. As shown in table 4, the
maximum range of the free-space communication is relatively slowly increased as increasing
input power. Hence, the range of the smart dust system will not easily extend beyond 1
kilometer.
Fiber-optic communication has advantages and disadvantages over a passive free-space
optical communication. This communication system does not require the unbroken line-of-sight,
the link directionality, and human eye safety on an interrogating laser. Each dust mote does not
need to employ more than one CCR, and the communication between dust motes and a base
station can be guaranteed. In addition, the peer-to-peer communication among dust motes can
be performed when the application requires. As shown in table4, the maximum range of the
fiber-optic communication can be easily increased as increasing input power. Hence, it has a
longer range of communication link than that of a free space passive optical communication.
However, fiber-optic communication has a limitation on the application. The optical fiber
cables restrict the mobility of dust mote. In order to increase the number of dust motes in the
particular system, base station should employ additional optical components. Hence, using
fiber-optic communication, smart dust should employ the limited number of dust motes.

63
By using MEMS technology, the components required for these links can be improve in
the future. This will yield improvements on the performance and the optimal means to
manufacture of the smart dust. Depending on the application, several design options and
protocols can be considered to optimize the performance of these links.
Free-space passive optical communication Fiber-optic communication
# of dust motes 1-Hundreds 8
Probability of transmission ≤ 100% 100%
Peer-to-peer communication
No Yes
Wavelength 0.83 µm 1.31 µm
Minimum detectable power 0.23 pW 9.6 nW
Input power 1 W 5 W 10 W 0.5 mW 1 mW 2 mW
Maximum range 564.5 m 844.2 m 1003.9 m 12.6 km 16.9 km 21.2 km
Table 4: Comparison of the estimated performance of the fiber and free-space passive optical communication.

64
8. REFERENCES
[1] V. S. Hsu, J.M. Kahn, K. S. J. Pister, Wireless Communication for Smart Dust, 1998, http://robotics.eecs.berkeley.edu/~pister/SmartDust/. [2] K. S. J. Pister, J.M. Kahn, B. E. Boser, Wireless Networks of Millimeter-Scale Sensor Nodes, 1998, http://robotics.eecs.berkeley.edu/~pister/SmartDust/. [3] Kris Pister, Smart Dust: Autonomous sensing and communication in a cubic millimeter, http://robotics.eecs.berkeley.edu/~pister/SmartDust/. [4] B. Warneke, B. Atwood, K. S. J. Pister, Smart Dust Mote Forerunners, Proc. IEEE Inter. Conference on MEMS, 2001. [5] E. A. Hollar, COST Dust, M. S. Thesis in UC Berkeley, 2000. [6] B. Warneke, M. Last, B. Liebowitz, K. S. J. Pister, Smart Dust: Communicating With a Cubic Millimeter Computer, IEEE, 2001. [7] J.M. Kahn, R.H. Katz, K. S. J. Pister, Next Century Challenges: Mobile Networking for “Smart Dust”, http://robotics.eecs.berkeley.edu/~pister/SmartDust/. [8] P. B. Chu, N. R. Lo, E. C. Berg, K. S. J. Pister, Optical Communication Using Micro Corner Cube Relectors, IEEE workshop on MEMS, 1997. [9] J.M. Kahn and J.R. Barry, “Wireless Infrared Communications”, Proc. of the IEEE, pp. 265-298, February 1997 (Invited Paper). [10] V. S. Hsu, J. M. Kahn, S. J. Pister, MEMS Corner Cube Retroreflector for Free-Space Optical Communications, 1991, http://robotics.eecs.berkeley.edu/~pister/. [11] X. Zhu, V. S. Hsu, J.M. Kahn, Optical Modeling of MEMS Corner Cube Retroreflectors With Misalignment and Nonflatness, IEEE, 2002. [12] P. B. Chu, N. R. Lo, E. C. Berg, K. S. J. Pister, Optical Communication Using Micro Corner Cube Reflectors, IEEE Inter. Workshop on MEMS, 1997. [13] M. Born and E. Wolf, Principles of Optics, Sixth Edition, Pergamon Press, 1980. [14] P. P. Banerjee, T. C. Poon, Principles of Applied Optics, Irwin, 1991.

65
[15] P. P. Banerjee, T. C. Poon, Contemporary Optical Image Processing with MATLAB, Fist Edition, Elsevier, 2001. [16] F. L. Pedrotti, L. S. Pedrotti, Inrtoduction to Optics, Prentice-Hall, 1987. [17] M. V. Klein, T. E. Furtak, Optics, Second Edition, John Wiley & Sons, 1986. [18] G. P. Agrawal, Fiber-Optic Communication Systems, Second Edition, Wiley-Interscience, 1992. [19] J.G. Proakis, Digital Communications, Third Edition, Mc-Graw Hill, 1995. [20] J.B. Carruthers and J.M. Kahn, Angle Diversity for Nondirected Wireless Infrared Communication, subm. to IEEE Trans. on Commun., July 1997. [21] A. Ghatak, K. Thyagarajan, Inrtoduction to Fiber Optics, Second Edition, Cambridge University Press, 1997. [22] R. Ramaswami, K. N. Sivarajan, Optical Networks: A Practical Perspective, Morgan Kaufmann, 1998. [23] J. H. Frans, V. K. Jain, Optical Communications: Components and Systems, CRC Press, 2000. [24] G. Keiser, Optical Fiber Communications, Second Edition, McGraw-Hill, 1993. [25] G. Feld, Deploying Optical Networking Components, McGraw-Hill, 2001. [26] N. Kashima, Passive Optical Components for Optical Filter Transmission, Artech House, 1995. [27] D. J. H. Maclean, Optical Line Systems, John Wiley & Sons, 1996.

66
Vita
Yunbin Song was born in Seoul, Korea on May 20, 1974. He received B.S. degree in
Electronic Engineering from Virginia Polytechnic Institute and State University (Virginia Tech)
in 1999. He then joined the Electrical and Computer Engineering Department at Virginia Tech
as a graduate student. He joined the Fiber and Electro-Optics Research Center (FEORC) in 2001.
His research interests include optical sensors, optical communication and fiber optics.