Optical coherence tomography - Portale OCulistica Amedeo ... · Optical coherence tomography...
15
© 2017 Taiwan J Ophthalmol | Published by Wolters Kluwer - Medknow 115 Optical coherence tomography angiography: Technical principles and clinical applications in ophthalmology Ahmed M. Hagag, Simon S. Gao, Yali Jia, David Huang Abstract: Optical coherence tomography angiography (OCTA) is a functional extension of OCT that provides information on retinal and choroidal circulations without the need for dye injections. With the recent development of high-speed OCT systems and efficient algorithms, OCTA has become clinically feasible. In this review article, we discuss the technical principles of OCTA, including image processing and artifacts, and its clinical applications in ophthalmology. We summarize recent studies which qualitatively or quantitatively assess disease presentation, progression, and/or response to treatment. Keywords: Choroidal neovascularization, diabetic retinopathy, glaucoma, optic disc, optical coherence tomography angiography, retina Introduction S ince its invention in the early 1990s, optical coherence tomography (OCT) [1] has become one of the most important imaging modalities in ophthalmology. OCT is a noninvasive imaging technology based on low‑coherence interferometry. It generates high‑resolution, cross‑sectional images from backscattered light, enabling clinicians to assess structural changes in different retinal diseases. However, structural OCT cannot be used to monitor vascular changes because of the low contrast between capillaries and retinal tissue. Given that many ocular diseases are associated with vascular abnormalities, the ability to visualize and quantify blood flow in the eye is of high importance to the global ophthalmic community. Conventionally, fluorescein angiography (FA) and indocyanine green angiography (ICGA) are used for qualitative clinical assessment of retinal and choroidal circulations, respectively. They require intravenous injection of contrast agents, which is time‑consuming and can have potentially serious side effects. [2,3] Moreover, FA and ICGA provide two‑dimensional (2D) images of ocular circulations, limiting depth perception and detailed investigation of the retinal and choroidal vasculatures. Multiple noninvasive imaging technologies have been employed in the last few decades to visualize and quantify ocular circulations. Ultrasound color Doppler [4] and functional magnetic resonance imaging [5] have been previously used for research purposes. While they were able to provide good tissue penetration, they did not receive much clinical attention in ophthalmology due to poor resolution and measurement reproducibility. Other imaging modalities such as laser Doppler flowmetry and velocimetry, blue field entoptic technique, and laser speckle assessment have been used extensively to study vascular retinal physiology. [6] However, their clinical use has been limited by their complexity, poor reproducibility, and wide population variation. [7] Address for correspondence: Dr. David Huang, Casey Eye Institute, Oregon Health and Science University, Portland, OR 97239, USA. E-mail: davidhuang@ alum.mit.edu Submission: 22-11-2016 Accepted: 26-01-2017 Department of Ophthalmology, Casey Eye Institute, Oregon Health and Science University, Portland, OR, USA Review Article Access this article online Quick Response Code: Website: www.e-tjo.org DOI: 10.4103/tjo.tjo_31_17 How to cite this article: Hagag AM, Gao SS, Jia Y, Huang D. Optical coherence tomography angiography: Technical principles and clinical applications in ophthalmology. Taiwan J Ophthalmol 2017;7:115-29. Taiwan J Ophthalmol 2017;7:115‑129 This is an open access arcle distributed under the terms of the Creave Commons Aribuon-NonCommercial-ShareAlike 3.0 License, which allows others to remix, tweak, and build upon the work non-commercially, as long as the author is credited and the new creaons are licensed under the idencal terms. For reprints contact: [email protected] [Downloaded free from http://www.e-tjo.org on Thursday, May 9, 2019, IP: 79.2.66.129]
Transcript of Optical coherence tomography - Portale OCulistica Amedeo ... · Optical coherence tomography...

© 2017 Taiwan J Ophthalmol | Published by Wolters Kluwer - Medknow 115
Optical coherence tomography angiography: Technical principles and clinical applications in ophthalmologyAhmed M. Hagag, Simon S. Gao, Yali Jia, David Huang
Abstract:Optical coherence tomography angiography (OCTA) is a functional extension of OCT that provides information on retinal and choroidal circulations without the need for dye injections. With the recent development of high-speed OCT systems and efficient algorithms, OCTA has become clinically feasible. In this review article, we discuss the technical principles of OCTA, including image processing and artifacts, and its clinical applications in ophthalmology. We summarize recent studies which qualitatively or quantitatively assess disease presentation, progression, and/or response to treatment.Keywords:Choroidal neovascularization, diabetic retinopathy, glaucoma, optic disc, optical coherence tomography angiography, retina
Introduction
Since its invention in the early 1990s, optical coherence tomography (OCT)[1] has
become one of the most important imaging modalities in ophthalmology. OCT is a noninvasive imaging technology based on low‑coherence interferometry. It generates high‑resolution, cross‑sectional images from backscattered light, enabling clinicians to assess structural changes in different retinal diseases. However, structural OCT cannot be used to monitor vascular changes because of the low contrast between capillaries and retinal tissue.
Given that many ocular diseases are associated with vascular abnormalities, the ability to visualize and quantify blood flow in the eye is of high importance to the global ophthalmic community. Conventionally, f luorescein angiography (FA) and indocyanine green angiography (ICGA) are used for qualitative clinical assessment of retinal and choroidal circulations, respectively. They require intravenous
injection of contrast agents, which is time‑consuming and can have potentially serious side effects.[2,3] Moreover, FA and ICGA provide two‑dimensional (2D) images of ocular circulations, limiting depth perception and detailed investigation of the retinal and choroidal vasculatures.
Multiple noninvasive imaging technologies have been employed in the last few decades to visualize and quantify ocular circulations. Ultrasound color Doppler[4] and functional magnetic resonance imaging[5] have been previously used for research purposes. While they were able to provide good tissue penetration, they did not receive much clinical attention in ophthalmology due to poor resolution and measurement reproducibility. Other imaging modalities such as laser Doppler flowmetry and velocimetry, blue field entoptic technique, and laser speckle assessment have been used extensively to study vascular retinal physiology.[6] However, their clinical use has been limited by their complexity, poor reproducibility, and wide population variation.[7]
Address for correspondence: Dr. David Huang,
Casey Eye Institute, Oregon Health and Science University,
Portland, OR 97239, USA. E-mail: davidhuang@
alum.mit.edu
Submission: 22-11-2016Accepted: 26-01-2017
Department of Ophthalmology, Casey
Eye Institute, Oregon Health and Science
University, Portland, OR, USA
Review Article
Access this article onlineQuick Response Code:
Website:www.e-tjo.org
DOI:10.4103/tjo.tjo_31_17
How to cite this article: Hagag AM, Gao SS, Jia Y, Huang D. Optical coherence tomography angiography: Technical principles and clinical applications in ophthalmology. Taiwan J Ophthalmol 2017;7:115-29.
Taiwan J Ophthalmol 2017;7:115‑129
This is an open access article distributed under the terms of the Creative Commons Attribution-NonCommercial-ShareAlike 3.0 License, which allows others to remix, tweak, and build upon the work non-commercially, as long as the author is credited and the new creations are licensed under the identical terms.
For reprints contact: [email protected]
[Downloaded free from http://www.e-tjo.org on Thursday, May 9, 2019, IP: 79.2.66.129]
116 Taiwan J Ophthalmol - Volume 7, Issue 3, July-September 2017
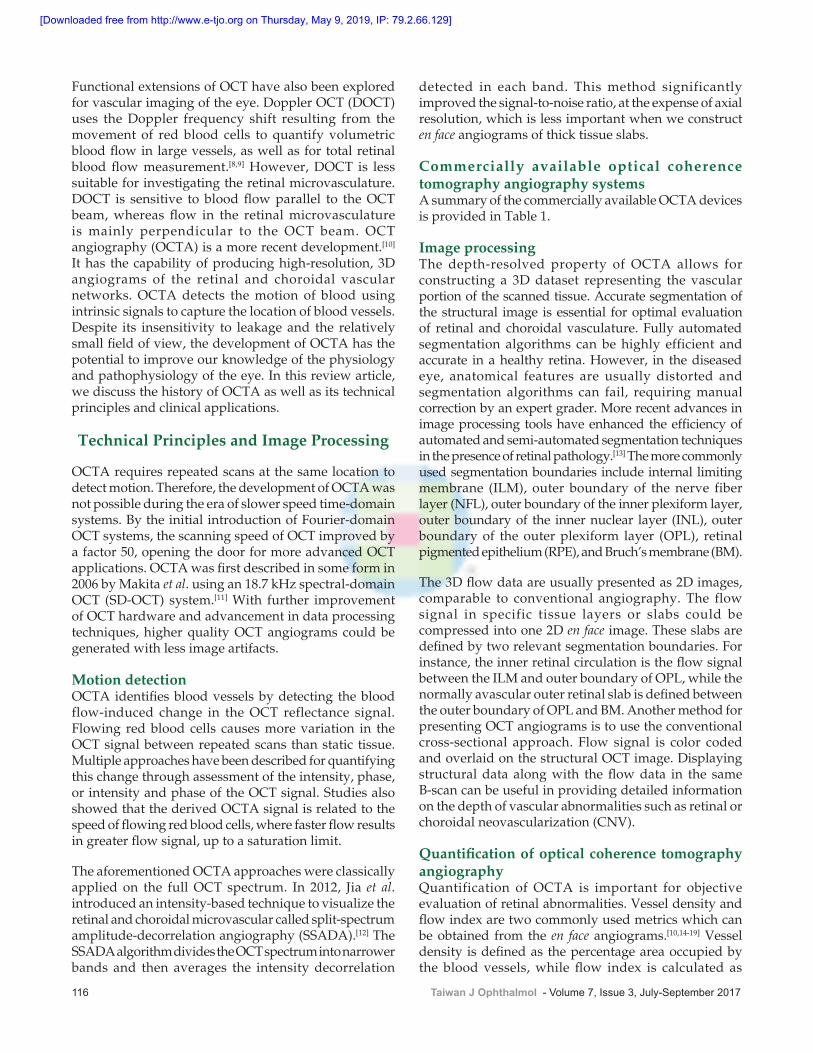
Functional extensions of OCT have also been explored for vascular imaging of the eye. Doppler OCT (DOCT) uses the Doppler frequency shift resulting from the movement of red blood cells to quantify volumetric blood flow in large vessels, as well as for total retinal blood flow measurement.[8,9] However, DOCT is less suitable for investigating the retinal microvasculature. DOCT is sensitive to blood flow parallel to the OCT beam, whereas flow in the retinal microvasculature is mainly perpendicular to the OCT beam. OCT angiography (OCTA) is a more recent development.[10] It has the capability of producing high‑resolution, 3D angiograms of the retinal and choroidal vascular networks. OCTA detects the motion of blood using intrinsic signals to capture the location of blood vessels. Despite its insensitivity to leakage and the relatively small field of view, the development of OCTA has the potential to improve our knowledge of the physiology and pathophysiology of the eye. In this review article, we discuss the history of OCTA as well as its technical principles and clinical applications.
Technical Principles and Image Processing
OCTA requires repeated scans at the same location to detect motion. Therefore, the development of OCTA was not possible during the era of slower speed time‑domain systems. By the initial introduction of Fourier‑domain OCT systems, the scanning speed of OCT improved by a factor 50, opening the door for more advanced OCT applications. OCTA was first described in some form in 2006 by Makita et al. using an 18.7 kHz spectral‑domain OCT (SD‑OCT) system.[11] With further improvement of OCT hardware and advancement in data processing techniques, higher quality OCT angiograms could be generated with less image artifacts.
Motion detectionOCTA identifies blood vessels by detecting the blood flow‑induced change in the OCT reflectance signal. Flowing red blood cells causes more variation in the OCT signal between repeated scans than static tissue. Multiple approaches have been described for quantifying this change through assessment of the intensity, phase, or intensity and phase of the OCT signal. Studies also showed that the derived OCTA signal is related to the speed of flowing red blood cells, where faster flow results in greater flow signal, up to a saturation limit.
The aforementioned OCTA approaches were classically applied on the full OCT spectrum. In 2012, Jia et al. introduced an intensity‑based technique to visualize the retinal and choroidal microvascular called split‑spectrum amplitude‑decorrelation angiography (SSADA).[12] The SSADA algorithm divides the OCT spectrum into narrower bands and then averages the intensity decorrelation
detected in each band. This method significantly improved the signal‑to‑noise ratio, at the expense of axial resolution, which is less important when we construct en face angiograms of thick tissue slabs.
Commercially available optical coherence tomography angiography systemsA summary of the commercially available OCTA devices is provided in Table 1.
Image processingThe depth‑resolved property of OCTA allows for constructing a 3D dataset representing the vascular portion of the scanned tissue. Accurate segmentation of the structural image is essential for optimal evaluation of retinal and choroidal vasculature. Fully automated segmentation algorithms can be highly efficient and accurate in a healthy retina. However, in the diseased eye, anatomical features are usually distorted and segmentation algorithms can fail, requiring manual correction by an expert grader. More recent advances in image processing tools have enhanced the efficiency of automated and semi‑automated segmentation techniques in the presence of retinal pathology.[13] The more commonly used segmentation boundaries include internal limiting membrane (ILM), outer boundary of the nerve fiber layer (NFL), outer boundary of the inner plexiform layer, outer boundary of the inner nuclear layer (INL), outer boundary of the outer plexiform layer (OPL), retinal pigmented epithelium (RPE), and Bruch’s membrane (BM).
The 3D flow data are usually presented as 2D images, comparable to conventional angiography. The flow signal in specific tissue layers or slabs could be compressed into one 2D en face image. These slabs are defined by two relevant segmentation boundaries. For instance, the inner retinal circulation is the flow signal between the ILM and outer boundary of OPL, while the normally avascular outer retinal slab is defined between the outer boundary of OPL and BM. Another method for presenting OCT angiograms is to use the conventional cross‑sectional approach. Flow signal is color coded and overlaid on the structural OCT image. Displaying structural data along with the flow data in the same B‑scan can be useful in providing detailed information on the depth of vascular abnormalities such as retinal or choroidal neovascularization (CNV).
Quantification of optical coherence tomography angiographyQuantification of OCTA is important for objective evaluation of retinal abnormalities. Vessel density and flow index are two commonly used metrics which can be obtained from the en face angiograms.[10,14‑19] Vessel density is defined as the percentage area occupied by the blood vessels, while flow index is calculated as
[Downloaded free from http://www.e-tjo.org on Thursday, May 9, 2019, IP: 79.2.66.129]
Taiwan J Ophthalmol - Volume 7, Issue 3, July-September 2017 117
the average flow signal in the area of interest. Flow index carries information on both vessel area and blood velocity. However, it cannot be considered as a volumetric measurement of blood flow because of the saturation effect of the flow signal value with high flow velocity. Flow index was found to be more sensitive in detecting the metabolic and physiologic changes in retinal tissue.[19] However, vessel density was more useful for the diagnosis and monitoring of vascular pathology. Initial studies reported good repeatability and reproducibility of these metrics.[20]
Other metrics have been explored for quantification of vascular abnormalities in different eye diseases. Measurement of avascular area can serve as a valuable metric for objective evaluation of diseases characterized by capillary loss such as diabetic retinopathy (DR) and glaucoma.[10,21‑23] Perfusion density mapping is another approach to assess abnormal flow regions.[24,25] It is a color‑coded map demonstrating the vascular density in different areas of the scanned region. Attempts have also been made to quantify neovascularization area,[26,27] which is calculated as the sum of pixel areas representing the retinal or choroidal neovascular vessels. It can be helpful in monitoring neovascularization along the course of the disease or as a result of treatment.[28,29]
Quantitative parameters have the potential to provide new objective biomarkers for eye diseases, facilitating diagnosis, monitoring, and treatment. However, further investigations are needed for validation and reliability assessment of the new metrics.
Optical coherence tomography angiography image artifactsOCTA, like any imaging technology, is affected by different types of artifacts [Figure 1].[30,31] Proper identification and understanding of these defects are essential to prevent inaccurate interpretation and wrong decision‑making.
Weak optical coherence tomography signalThe generation of structural OCT images depends on the backscattering of light from tissue structures. The
OCT signal can be reduced globally by media opacity, pupil vignetting, and defocusing of the light beam. In such cases, low‑quality images will be generated, obscuring inner eye components and producing unreliable flow information. Using light sources with longer wavelengths can theoretically overcome mild opacities. Proper OCT beam focusing and centering, as well as pupil dilation, can enhance the quality of an OCT scan. Focal OCT signal weakening or loss can also be encountered beneath large vessels or hyperreflective retinal lesions, obscuring flow signal and producing shadow artifacts [Figure 1b and c, white arrows].
Motion artifactsOCTA relies on intrinsic motion contrast as the basis for detecting flow. Bulk tissue and saccadic eye movements can produce noise and motion artifacts, resulting in overestimation of the flow signal. Multiple approaches have been introduced to overcome motion artifacts. Motion correction technology is a technique that has been used in commercial OCT systems. In this method, two OCT volumes are acquired with perpendicular scanning directions and then registered and merged.[32] Eye tracking
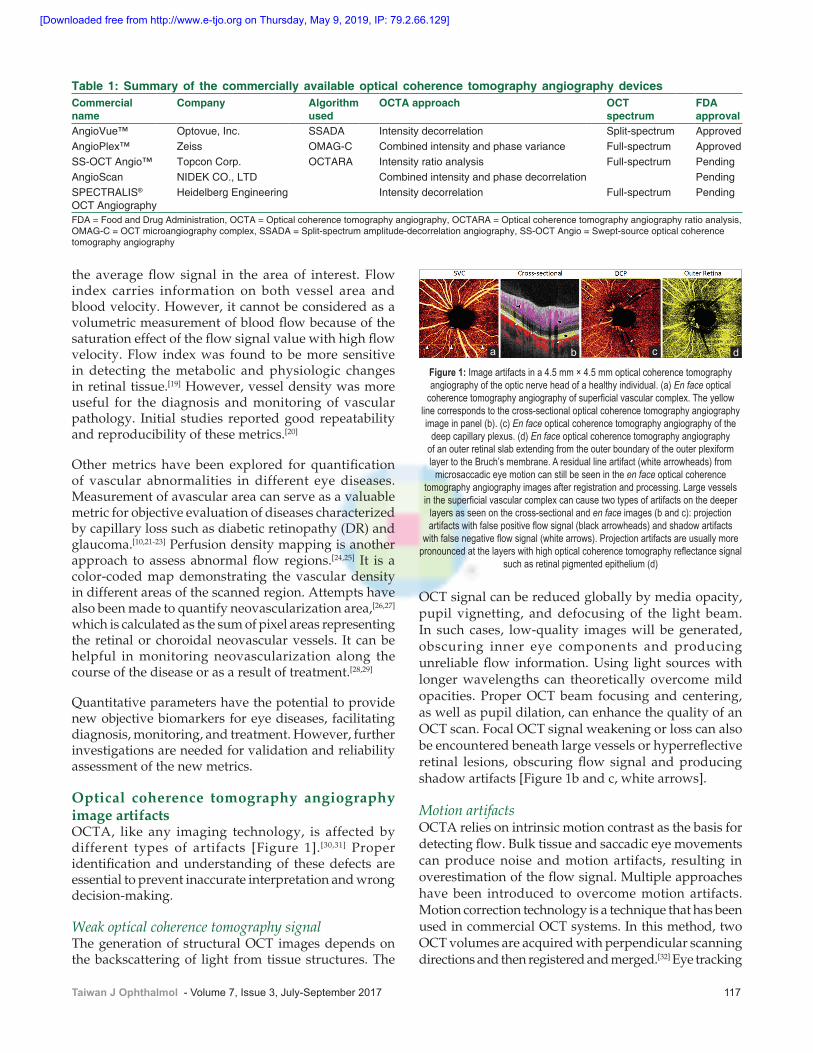
Figure 1: Image artifacts in a 4.5 mm × 4.5 mm optical coherence tomography angiography of the optic nerve head of a healthy individual. (a) En face optical
coherence tomography angiography of superficial vascular complex. The yellow line corresponds to the cross‑sectional optical coherence tomography angiography image in panel (b). (c) En face optical coherence tomography angiography of the
deep capillary plexus. (d) En face optical coherence tomography angiography of an outer retinal slab extending from the outer boundary of the outer plexiform layer to the Bruch’s membrane. A residual line artifact (white arrowheads) from
microsaccadic eye motion can still be seen in the en face optical coherence tomography angiography images after registration and processing. Large vessels in the superficial vascular complex can cause two types of artifacts on the deeper
layers as seen on the cross‑sectional and en face images (b and c): projection artifacts with false positive flow signal (black arrowheads) and shadow artifacts
with false negative flow signal (white arrows). Projection artifacts are usually more pronounced at the layers with high optical coherence tomography reflectance signal
such as retinal pigmented epithelium (d)
dcba
Table 1: Summary of the commercially available optical coherence tomography angiography devicesCommercial name
Company Algorithm used
OCTA approach OCT spectrum
FDA approval
AngioVue™ Optovue, Inc. SSADA Intensity decorrelation Split-spectrum ApprovedAngioPlex™ Zeiss OMAG-C Combined intensity and phase variance Full-spectrum ApprovedSS-OCT Angio™ Topcon Corp. OCTARA Intensity ratio analysis Full-spectrum PendingAngioScan NIDEK CO., LTD Combined intensity and phase decorrelation PendingSPECTRALIS® OCT Angiography
Heidelberg Engineering Intensity decorrelation Full-spectrum Pending
FDA = Food and Drug Administration, OCTA = Optical coherence tomography angiography, OCTARA = Optical coherence tomography angiography ratio analysis, OMAG-C = OCT microangiography complex, SSADA = Split-spectrum amplitude-decorrelation angiography, SS-OCT Angio = Swept-source optical coherence tomography angiography
[Downloaded free from http://www.e-tjo.org on Thursday, May 9, 2019, IP: 79.2.66.129]
118 Taiwan J Ophthalmol - Volume 7, Issue 3, July-September 2017
is another potential solution. Variants of eye tracking have also been adopted on commercial OCTA systems.[33,34] Eye tracking systems work by detecting eye movement for real‑time correction of motion artifacts. These methods can significantly reduce motion artifacts and improve the reliability of OCTA scans. However, residual defects can still be present as motion lines [Figure 1a, white arrowheads], vessel duplication, or vessel discontinuity. More advanced processing algorithms can help eliminate residual defects in OCTA images.[35,36]
Projection artifactsFlowing red blood cells in more superficial vasculature cast time‑varying shadows on the deeper retinal layers.[30] These flow projection artifacts lead to duplication of the superficial vascular pattern on deeper microcirculation, as well as the normally avascular outer retinal slab [Figure 1b‑d, black arrowheads]. OCTA projection artifacts can lead to inaccurate measurement of flow index and vessel density of deeper retinal vasculature. Moreover, they impede the identification and quantification of CNV in the outer retina[27] or can even be mistakenly recognized as CNV.
Several solutions have been proposed to overcome OCTA projection artifacts. One method is to subtract the more superficial flow signal from the deeper en face angiograms, called the “slab‑subtraction” method.[15,27,37] This approach can disrupt the continuity of vessels in the deeper vascular plexuses and potentially underestimate their vessel density. More recently, an algorithm called “projection‑resolved” OCTA (PR‑OCTA)[38] was developed to suppress the projected flow signal while preserving the natural continuity of ocular microvasculature, allowing for improved visualization and quantification of different retinal vascular layers in normal and diseased eyes [Figure 2].[23,38,39]
Clinical Applications
Normal vascular anatomy and physiologyFA and ICGA images are able to show 2D images of retinal and choroidal circulations, respectively.[40,41] However, no further details could be extracted because of their limited depth perception. With the introduction of OCTA, blood flow from different vascular beds within the retinal and choroidal circulations could be separately projected.[10,13,42] However, projection artifacts make it difficult to clearly visualize deeper retinal plexuses without the interference of projected flow from more superficial plexuses. Recently, the development of PR‑OCTA[38] has allowed for exceptional in vivo visualization of detailed ocular vascular anatomy which was not achievable using other imaging modalities [Figure 2]. Four vascular plexuses can be identified in OCT angiograms of the human
retina, as well as the interplexus spaces containing the interconnecting vessels. This arrangement is consistent with histological studies on primates and human cadavers.[43] The four plexuses can be grouped into two retinal vascular complexes: superficial vascular complex (SVC) and deep vascular complex (DVC).
The SVC consists of the superficial vascular plexus (SVP) in the ganglion cell layer and radial peripapillary capillary plexus (RPCP) in retinal NFL (RNFL). The SVP originates directly from large retinal arteries and drains into retinal veins. It includes both macro‑ and micro‑vessels. The SVP provides blood supply to the more superficial RPCP, as well as the deeper plexuses in DVC. The RPCP is a radially organized capillary plexus that runs parallel to NFL axons. It is believed that RPCP is responsible for blood supply to the dense NFL in the peripapillary region.
The DVC consists of the intermediate capillary plexus (ICP) above INL and deep capillary plexus (DCP) below INL. The ICP and DCP are relatively homogenous capillaries, responsible for nourishment of the deep layers of inner retina. Moreover, recent evidence suggests an overlap in function with the choroidal circulation to support the avascular outer retina.[44]
Visualization of choroidal circulation by OCTA is inherently more difficult than that of retinal circulation. Light scattering throughout the retinal layers and especially from the highly reflective RPE results in a decreased amount of light reaching the choriocapillaris (CC) and larger choroidal vessels. While commercially available SD‑OCTA systems with
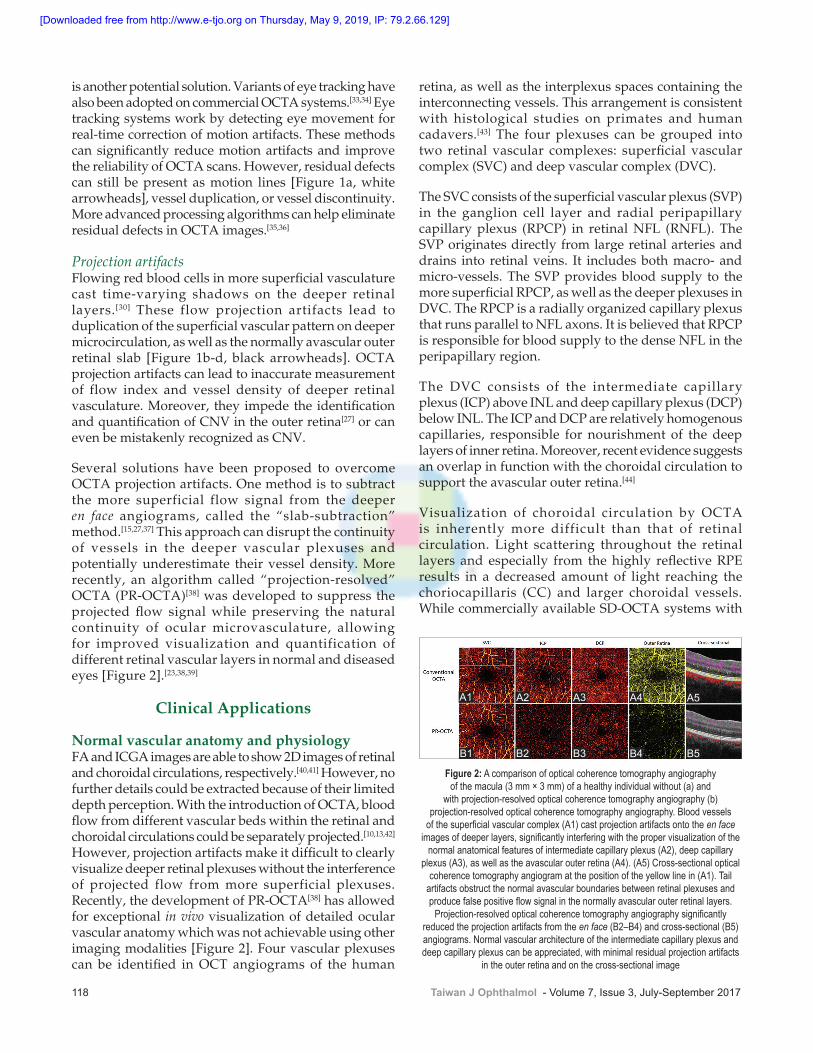
Figure 2: A comparison of optical coherence tomography angiography of the macula (3 mm × 3 mm) of a healthy individual without (a) and
with projection‑resolved optical coherence tomography angiography (b) projection‑resolved optical coherence tomography angiography. Blood vessels
of the superficial vascular complex (A1) cast projection artifacts onto the en face images of deeper layers, significantly interfering with the proper visualization of the
normal anatomical features of intermediate capillary plexus (A2), deep capillary plexus (A3), as well as the avascular outer retina (A4). (A5) Cross‑sectional optical
coherence tomography angiogram at the position of the yellow line in (A1). Tail artifacts obstruct the normal avascular boundaries between retinal plexuses and produce false positive flow signal in the normally avascular outer retinal layers.
Projection‑resolved optical coherence tomography angiography significantly reduced the projection artifacts from the en face (B2–B4) and cross‑sectional (B5) angiograms. Normal vascular architecture of the intermediate capillary plexus and deep capillary plexus can be appreciated, with minimal residual projection artifacts
in the outer retina and on the cross‑sectional image
B1 B2 B3 B4 B5
A1 A2 A3 A4 A5
[Downloaded free from http://www.e-tjo.org on Thursday, May 9, 2019, IP: 79.2.66.129]
Taiwan J Ophthalmol - Volume 7, Issue 3, July-September 2017 119
840 nm light sources are able to provide visualization at the level of the CC,[31,45] OCTA systems at longer wavelengths can achieve deeper penetration and theoretically improve choroidal imaging. Jia et al.[10] and Choi et al.[46] used swept source OCTA (SS‑OCTA) prototypes to image CC and choroidal vasculature. Their systems had central wavelengths of 1050–1060 nm. SS‑OCTA was able to provide en face angiograms of CC and the larger choroidal vessels in Sattler’s layer, which were consistent with the findings from histological and electron microscopic studies.[46]
The ability to reliably visualize and quantify flow in different retinal plexuses opens the door for a new era of in vivo investigation of vascular physiology. The vascular response to different physiologic changes has long been investigated in the retina of human and rats. OCTA has only recently been employed for noninvasive assessment of retinal vascular response to light stimulation[6] and increased blood oxygen content (systemic hyperoxia).[19] Wei et al.[18] observed retinal hyperemia in response to light stimulation using OCTA. Pechauer et al.[19] used a commercially available SD‑OCTA system to assess the retinal autoregulatory hemodynamic response to hyperoxia. A significant decrease in both flow index and vessel density of the peripapillary region was observed. However, further investigations using the recent advancements in OCTA technology are needed to characterize these responses in individual vascular layers.
Choroidal neovascularizationCNV is the growth of new pathological blood vessels from the choroid which break into the retina. These vessels tend to leak or bleed, leading to vision impairment. CNV is associated with several eye diseases such as neovascular age‑related macular degeneration (AMD), polypoidal choroidal vasculopathy (PCV), and central serous chorioretinopathy (CSC). CNV can be classified into three types depending on their extension. Type I CNV, the most common type, is located between BM and RPE. In Type II CNV, blood vessels cause disruption of RPE layer and extend into the subretinal space. Type III CNV or retinal angiomatous proliferation (RAP) is an advanced form of neovascularization, in which blood vessels extend all the way through retinal layers and form anastomosis between retinal and choroidal circulations.
Neovascular age‑related macular degenerationAMD is a leading cause of blindness in older patients in the developed world. Neovascular AMD is a less common but more devastating phenotype. It is characterized by CNV formation, leading to rapid and severe loss of central vision. Jia et al. first demonstrated the ability of OCTA to visualize and quantify Types I and II CNV in a small number of AMD patients.[15] En face OCT angiograms as well as composite B‑scans were used to display abnormal blood vessels in the outer retinal layers [Figures 3 and 4].[31] Moreover, they provided quantitative assessment of the CNV by measuring CNV membrane area and the flow index within the CNV lesion. In a larger study, Palejwala et al. reported the ability of OCTA to detect nonexudative CNV.[47] Roisman et al. also demonstrated the capability of SS‑OCTA to identify subclinical Type I CNV in intermediate AMD patients.[48] Automated CNV detection algorithms have been introduced with promising results in the efficient identification and quantification of abnormal vessels from outer retinal angiograms.[26,27]
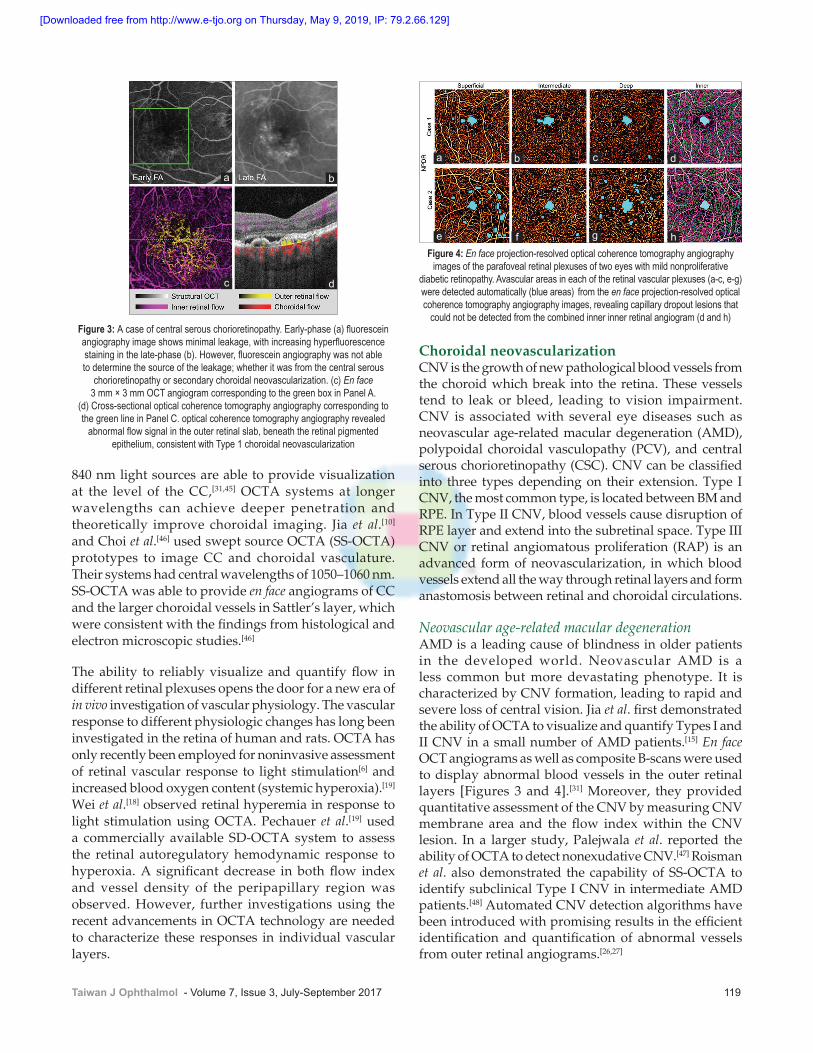
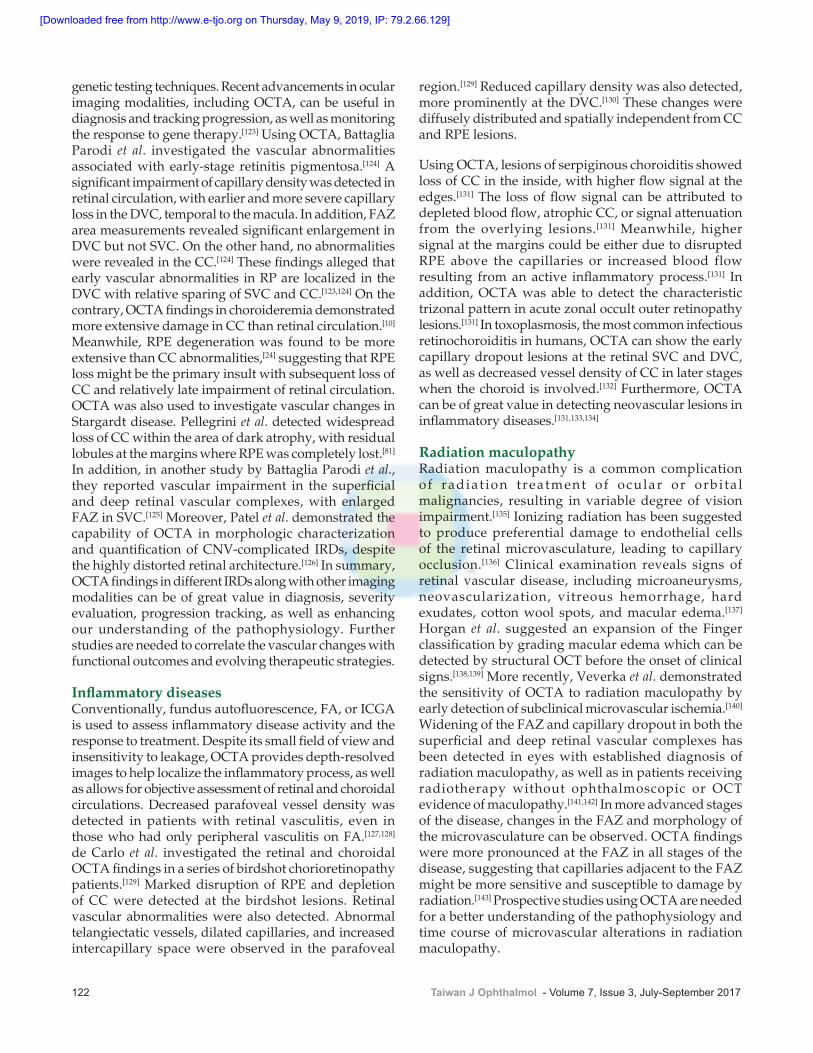
Figure 3: A case of central serous chorioretinopathy. Early‑phase (a) fluorescein angiography image shows minimal leakage, with increasing hyperfluorescence staining in the late‑phase (b). However, fluorescein angiography was not able to determine the source of the leakage; whether it was from the central serous
chorioretinopathy or secondary choroidal neovascularization. (c) En face 3 mm × 3 mm OCT angiogram corresponding to the green box in Panel A.
(d) Cross‑sectional optical coherence tomography angiography corresponding to the green line in Panel C. optical coherence tomography angiography revealed
abnormal flow signal in the outer retinal slab, beneath the retinal pigmented epithelium, consistent with Type 1 choroidal neovascularization
dc
ba
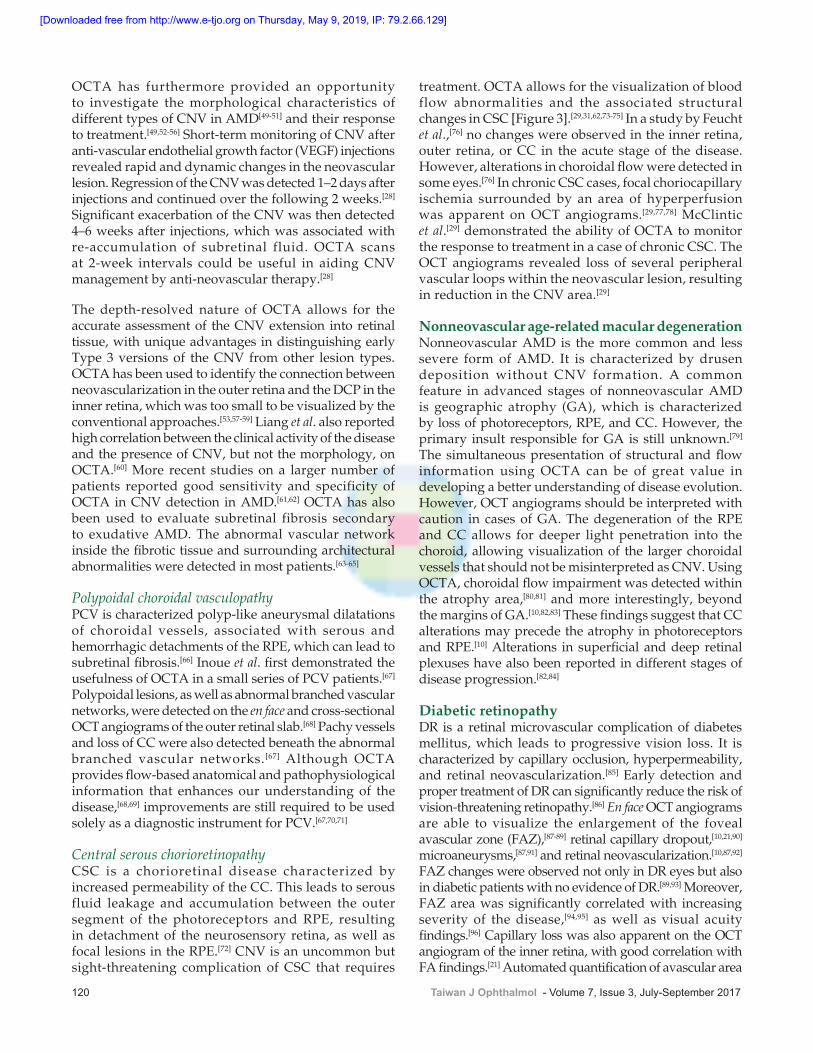
Figure 4: En face projection‑resolved optical coherence tomography angiography images of the parafoveal retinal plexuses of two eyes with mild nonproliferative
diabetic retinopathy. Avascular areas in each of the retinal vascular plexuses (a‑c, e‑g) were detected automatically (blue areas) from the en face projection‑resolved optical coherence tomography angiography images, revealing capillary dropout lesions that
could not be detected from the combined inner inner retinal angiogram (d and h)
d
h
c
g
b
f
a
e
[Downloaded free from http://www.e-tjo.org on Thursday, May 9, 2019, IP: 79.2.66.129]
120 Taiwan J Ophthalmol - Volume 7, Issue 3, July-September 2017
OCTA has furthermore provided an opportunity to investigate the morphological characteristics of different types of CNV in AMD[49‑51] and their response to treatment.[49,52‑56] Short‑term monitoring of CNV after anti‑vascular endothelial growth factor (VEGF) injections revealed rapid and dynamic changes in the neovascular lesion. Regression of the CNV was detected 1–2 days after injections and continued over the following 2 weeks.[28] Significant exacerbation of the CNV was then detected 4–6 weeks after injections, which was associated with re‑accumulation of subretinal fluid. OCTA scans at 2‑week intervals could be useful in aiding CNV management by anti‑neovascular therapy.[28]
The depth‑resolved nature of OCTA allows for the accurate assessment of the CNV extension into retinal tissue, with unique advantages in distinguishing early Type 3 versions of the CNV from other lesion types. OCTA has been used to identify the connection between neovascularization in the outer retina and the DCP in the inner retina, which was too small to be visualized by the conventional approaches.[53,57‑59] Liang et al. also reported high correlation between the clinical activity of the disease and the presence of CNV, but not the morphology, on OCTA.[60] More recent studies on a larger number of patients reported good sensitivity and specificity of OCTA in CNV detection in AMD.[61,62] OCTA has also been used to evaluate subretinal fibrosis secondary to exudative AMD. The abnormal vascular network inside the fibrotic tissue and surrounding architectural abnormalities were detected in most patients.[63‑65]
Polypoidal choroidal vasculopathyPCV is characterized polyp‑like aneurysmal dilatations of choroidal vessels, associated with serous and hemorrhagic detachments of the RPE, which can lead to subretinal fibrosis.[66] Inoue et al. first demonstrated the usefulness of OCTA in a small series of PCV patients.[67] Polypoidal lesions, as well as abnormal branched vascular networks, were detected on the en face and cross‑sectional OCT angiograms of the outer retinal slab.[68] Pachy vessels and loss of CC were also detected beneath the abnormal branched vascular networks.[67] Although OCTA provides flow‑based anatomical and pathophysiological information that enhances our understanding of the disease,[68,69] improvements are still required to be used solely as a diagnostic instrument for PCV.[67,70,71]
Central serous chorioretinopathyCSC is a chorioretinal disease characterized by increased permeability of the CC. This leads to serous fluid leakage and accumulation between the outer segment of the photoreceptors and RPE, resulting in detachment of the neurosensory retina, as well as focal lesions in the RPE.[72] CNV is an uncommon but sight‑threatening complication of CSC that requires
treatment. OCTA allows for the visualization of blood flow abnormalities and the associated structural changes in CSC [Figure 3].[29,31,62,73‑75] In a study by Feucht et al.,[76] no changes were observed in the inner retina, outer retina, or CC in the acute stage of the disease. However, alterations in choroidal flow were detected in some eyes.[76] In chronic CSC cases, focal choriocapillary ischemia surrounded by an area of hyperperfusion was apparent on OCT angiograms.[29,77,78] McClintic et al.[29] demonstrated the ability of OCTA to monitor the response to treatment in a case of chronic CSC. The OCT angiograms revealed loss of several peripheral vascular loops within the neovascular lesion, resulting in reduction in the CNV area.[29]
Nonneovascular age‑related macular degenerationNonneovascular AMD is the more common and less severe form of AMD. It is characterized by drusen deposition without CNV formation. A common feature in advanced stages of nonneovascular AMD is geographic atrophy (GA), which is characterized by loss of photoreceptors, RPE, and CC. However, the primary insult responsible for GA is still unknown.[79] The simultaneous presentation of structural and flow information using OCTA can be of great value in developing a better understanding of disease evolution. However, OCT angiograms should be interpreted with caution in cases of GA. The degeneration of the RPE and CC allows for deeper light penetration into the choroid, allowing visualization of the larger choroidal vessels that should not be misinterpreted as CNV. Using OCTA, choroidal flow impairment was detected within the atrophy area,[80,81] and more interestingly, beyond the margins of GA.[10,82,83] These findings suggest that CC alterations may precede the atrophy in photoreceptors and RPE.[10] Alterations in superficial and deep retinal plexuses have also been reported in different stages of disease progression.[82,84]
Diabetic retinopathyDR is a retinal microvascular complication of diabetes mellitus, which leads to progressive vision loss. It is characterized by capillary occlusion, hyperpermeability, and retinal neovascularization.[85] Early detection and proper treatment of DR can significantly reduce the risk of vision‑threatening retinopathy.[86] En face OCT angiograms are able to visualize the enlargement of the foveal avascular zone (FAZ),[87‑89] retinal capillary dropout,[10,21,90] microaneurysms,[87,91] and retinal neovascularization.[10,87,92] FAZ changes were observed not only in DR eyes but also in diabetic patients with no evidence of DR.[89,93] Moreover, FAZ area was significantly correlated with increasing severity of the disease,[94,95] as well as visual acuity findings.[96] Capillary loss was also apparent on the OCT angiogram of the inner retina, with good correlation with FA findings.[21] Automated quantification of avascular area
[Downloaded free from http://www.e-tjo.org on Thursday, May 9, 2019, IP: 79.2.66.129]
Taiwan J Ophthalmol - Volume 7, Issue 3, July-September 2017 121
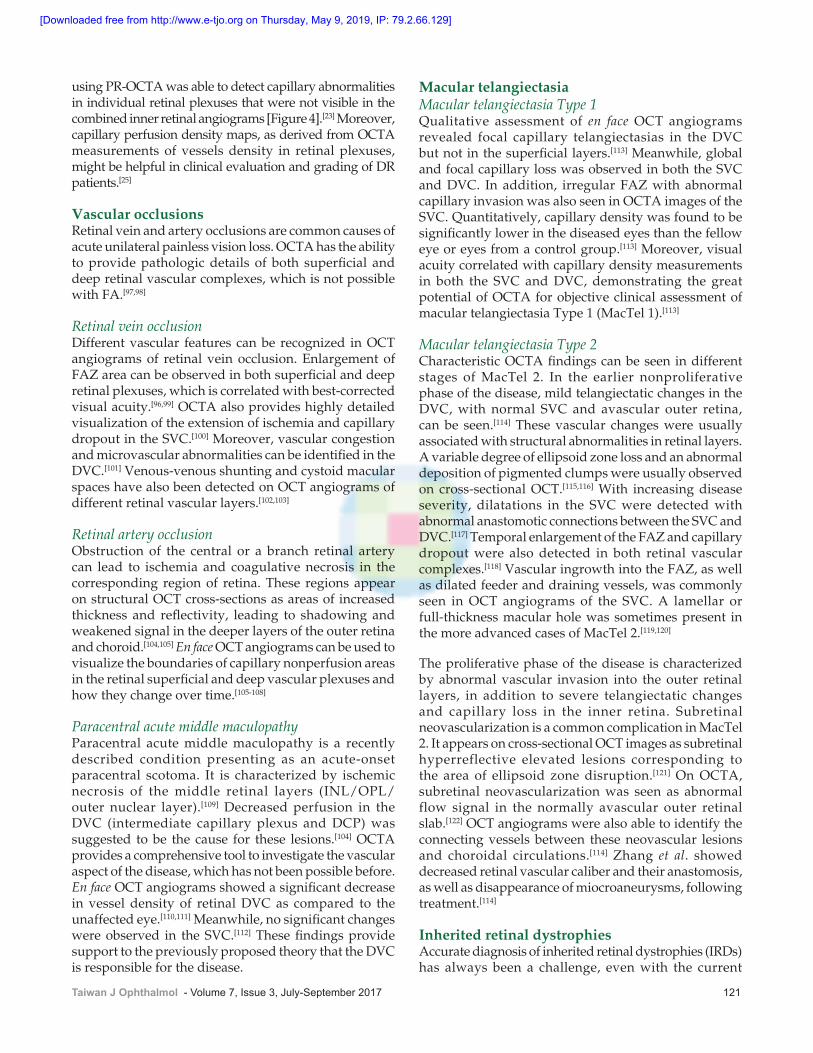
using PR‑OCTA was able to detect capillary abnormalities in individual retinal plexuses that were not visible in the combined inner retinal angiograms [Figure 4].[23] Moreover, capillary perfusion density maps, as derived from OCTA measurements of vessels density in retinal plexuses, might be helpful in clinical evaluation and grading of DR patients.[25]
Vascular occlusionsRetinal vein and artery occlusions are common causes of acute unilateral painless vision loss. OCTA has the ability to provide pathologic details of both superficial and deep retinal vascular complexes, which is not possible with FA.[97,98]
Retinal vein occlusionDifferent vascular features can be recognized in OCT angiograms of retinal vein occlusion. Enlargement of FAZ area can be observed in both superficial and deep retinal plexuses, which is correlated with best‑corrected visual acuity.[96,99] OCTA also provides highly detailed visualization of the extension of ischemia and capillary dropout in the SVC.[100] Moreover, vascular congestion and microvascular abnormalities can be identified in the DVC.[101] Venous‑venous shunting and cystoid macular spaces have also been detected on OCT angiograms of different retinal vascular layers.[102,103]
Retinal artery occlusionObstruction of the central or a branch retinal artery can lead to ischemia and coagulative necrosis in the corresponding region of retina. These regions appear on structural OCT cross‑sections as areas of increased thickness and reflectivity, leading to shadowing and weakened signal in the deeper layers of the outer retina and choroid.[104,105] En face OCT angiograms can be used to visualize the boundaries of capillary nonperfusion areas in the retinal superficial and deep vascular plexuses and how they change over time.[105‑108]
Paracentral acute middle maculopathyParacentral acute middle maculopathy is a recently described condition presenting as an acute‑onset paracentral scotoma. It is characterized by ischemic necrosis of the middle retinal layers (INL/OPL/outer nuclear layer).[109] Decreased perfusion in the DVC (intermediate capillary plexus and DCP) was suggested to be the cause for these lesions.[104] OCTA provides a comprehensive tool to investigate the vascular aspect of the disease, which has not been possible before. En face OCT angiograms showed a significant decrease in vessel density of retinal DVC as compared to the unaffected eye.[110,111] Meanwhile, no significant changes were observed in the SVC.[112] These findings provide support to the previously proposed theory that the DVC is responsible for the disease.
Macular telangiectasiaMacular telangiectasia Type 1Qualitative assessment of en face OCT angiograms revealed focal capillary telangiectasias in the DVC but not in the superficial layers.[113] Meanwhile, global and focal capillary loss was observed in both the SVC and DVC. In addition, irregular FAZ with abnormal capillary invasion was also seen in OCTA images of the SVC. Quantitatively, capillary density was found to be significantly lower in the diseased eyes than the fellow eye or eyes from a control group.[113] Moreover, visual acuity correlated with capillary density measurements in both the SVC and DVC, demonstrating the great potential of OCTA for objective clinical assessment of macular telangiectasia Type 1 (MacTel 1).[113]
Macular telangiectasia Type 2Characteristic OCTA findings can be seen in different stages of MacTel 2. In the earlier nonproliferative phase of the disease, mild telangiectatic changes in the DVC, with normal SVC and avascular outer retina, can be seen.[114] These vascular changes were usually associated with structural abnormalities in retinal layers. A variable degree of ellipsoid zone loss and an abnormal deposition of pigmented clumps were usually observed on cross‑sectional OCT.[115,116] With increasing disease severity, dilatations in the SVC were detected with abnormal anastomotic connections between the SVC and DVC.[117] Temporal enlargement of the FAZ and capillary dropout were also detected in both retinal vascular complexes.[118] Vascular ingrowth into the FAZ, as well as dilated feeder and draining vessels, was commonly seen in OCT angiograms of the SVC. A lamellar or full‑thickness macular hole was sometimes present in the more advanced cases of MacTel 2.[119,120]
The proliferative phase of the disease is characterized by abnormal vascular invasion into the outer retinal layers, in addition to severe telangiectatic changes and capillary loss in the inner retina. Subretinal neovascularization is a common complication in MacTel 2. It appears on cross‑sectional OCT images as subretinal hyperreflective elevated lesions corresponding to the area of ellipsoid zone disruption.[121] On OCTA, subretinal neovascularization was seen as abnormal flow signal in the normally avascular outer retinal slab.[122] OCT angiograms were also able to identify the connecting vessels between these neovascular lesions and choroidal circulations.[114] Zhang et al. showed decreased retinal vascular caliber and their anastomosis, as well as disappearance of miocroaneurysms, following treatment.[114]
Inherited retinal dystrophiesAccurate diagnosis of inherited retinal dystrophies (IRDs) has always been a challenge, even with the current
[Downloaded free from http://www.e-tjo.org on Thursday, May 9, 2019, IP: 79.2.66.129]
122 Taiwan J Ophthalmol - Volume 7, Issue 3, July-September 2017
genetic testing techniques. Recent advancements in ocular imaging modalities, including OCTA, can be useful in diagnosis and tracking progression, as well as monitoring the response to gene therapy.[123] Using OCTA, Battaglia Parodi et al. investigated the vascular abnormalities associated with early‑stage retinitis pigmentosa.[124] A significant impairment of capillary density was detected in retinal circulation, with earlier and more severe capillary loss in the DVC, temporal to the macula. In addition, FAZ area measurements revealed significant enlargement in DVC but not SVC. On the other hand, no abnormalities were revealed in the CC.[124] These findings alleged that early vascular abnormalities in RP are localized in the DVC with relative sparing of SVC and CC.[123,124] On the contrary, OCTA findings in choroideremia demonstrated more extensive damage in CC than retinal circulation.[10] Meanwhile, RPE degeneration was found to be more extensive than CC abnormalities,[24] suggesting that RPE loss might be the primary insult with subsequent loss of CC and relatively late impairment of retinal circulation. OCTA was also used to investigate vascular changes in Stargardt disease. Pellegrini et al. detected widespread loss of CC within the area of dark atrophy, with residual lobules at the margins where RPE was completely lost.[81] In addition, in another study by Battaglia Parodi et al., they reported vascular impairment in the superficial and deep retinal vascular complexes, with enlarged FAZ in SVC.[125] Moreover, Patel et al. demonstrated the capability of OCTA in morphologic characterization and quantification of CNV‑complicated IRDs, despite the highly distorted retinal architecture.[126] In summary, OCTA findings in different IRDs along with other imaging modalities can be of great value in diagnosis, severity evaluation, progression tracking, as well as enhancing our understanding of the pathophysiology. Further studies are needed to correlate the vascular changes with functional outcomes and evolving therapeutic strategies.
Inflammatory diseasesConventionally, fundus autofluorescence, FA, or ICGA is used to assess inflammatory disease activity and the response to treatment. Despite its small field of view and insensitivity to leakage, OCTA provides depth‑resolved images to help localize the inflammatory process, as well as allows for objective assessment of retinal and choroidal circulations. Decreased parafoveal vessel density was detected in patients with retinal vasculitis, even in those who had only peripheral vasculitis on FA.[127,128] de Carlo et al. investigated the retinal and choroidal OCTA findings in a series of birdshot chorioretinopathy patients.[129] Marked disruption of RPE and depletion of CC were detected at the birdshot lesions. Retinal vascular abnormalities were also detected. Abnormal telangiectatic vessels, dilated capillaries, and increased intercapillary space were observed in the parafoveal
region.[129] Reduced capillary density was also detected, more prominently at the DVC.[130] These changes were diffusely distributed and spatially independent from CC and RPE lesions.
Using OCTA, lesions of serpiginous choroiditis showed loss of CC in the inside, with higher flow signal at the edges.[131] The loss of flow signal can be attributed to depleted blood flow, atrophic CC, or signal attenuation from the overlying lesions.[131] Meanwhile, higher signal at the margins could be either due to disrupted RPE above the capillaries or increased blood flow resulting from an active inflammatory process.[131] In addition, OCTA was able to detect the characteristic trizonal pattern in acute zonal occult outer retinopathy lesions.[131] In toxoplasmosis, the most common infectious retinochoroiditis in humans, OCTA can show the early capillary dropout lesions at the retinal SVC and DVC, as well as decreased vessel density of CC in later stages when the choroid is involved.[132] Furthermore, OCTA can be of great value in detecting neovascular lesions in inflammatory diseases.[131,133,134]
Radiation maculopathyRadiation maculopathy is a common complication of radiat ion t reatment of ocular or orbi ta l malignancies, resulting in variable degree of vision impairment.[135] Ionizing radiation has been suggested to produce preferential damage to endothelial cells of the retinal microvasculature, leading to capillary occlusion.[136] Clinical examination reveals signs of retinal vascular disease, including microaneurysms, neovascularization, vitreous hemorrhage, hard exudates, cotton wool spots, and macular edema.[137] Horgan et al. suggested an expansion of the Finger classification by grading macular edema which can be detected by structural OCT before the onset of clinical signs.[138,139] More recently, Veverka et al. demonstrated the sensitivity of OCTA to radiation maculopathy by early detection of subclinical microvascular ischemia.[140] Widening of the FAZ and capillary dropout in both the superficial and deep retinal vascular complexes has been detected in eyes with established diagnosis of radiation maculopathy, as well as in patients receiving radiotherapy without ophthalmoscopic or OCT evidence of maculopathy.[141,142] In more advanced stages of the disease, changes in the FAZ and morphology of the microvasculature can be observed. OCTA findings were more pronounced at the FAZ in all stages of the disease, suggesting that capillaries adjacent to the FAZ might be more sensitive and susceptible to damage by radiation.[143] Prospective studies using OCTA are needed for a better understanding of the pathophysiology and time course of microvascular alterations in radiation maculopathy.
[Downloaded free from http://www.e-tjo.org on Thursday, May 9, 2019, IP: 79.2.66.129]
Taiwan J Ophthalmol - Volume 7, Issue 3, July-September 2017 123
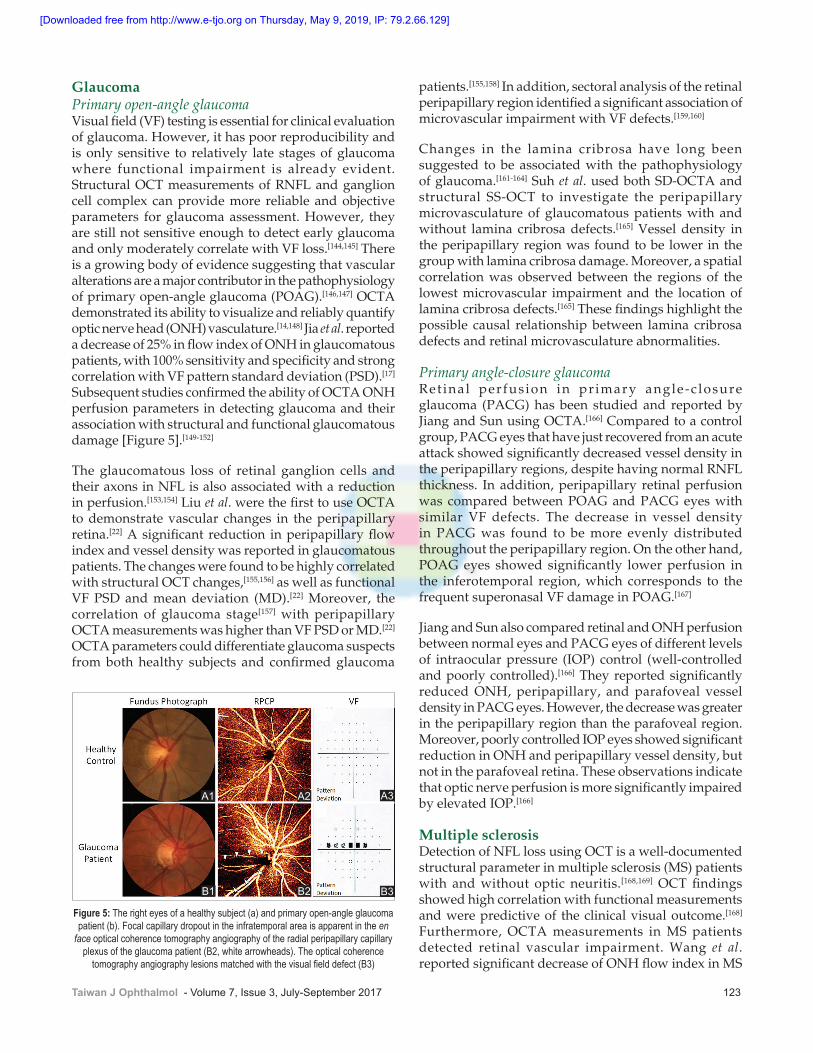
GlaucomaPrimary open‑angle glaucomaVisual field (VF) testing is essential for clinical evaluation of glaucoma. However, it has poor reproducibility and is only sensitive to relatively late stages of glaucoma where functional impairment is already evident. Structural OCT measurements of RNFL and ganglion cell complex can provide more reliable and objective parameters for glaucoma assessment. However, they are still not sensitive enough to detect early glaucoma and only moderately correlate with VF loss.[144,145] There is a growing body of evidence suggesting that vascular alterations are a major contributor in the pathophysiology of primary open‑angle glaucoma (POAG).[146,147] OCTA demonstrated its ability to visualize and reliably quantify optic nerve head (ONH) vasculature.[14,148] Jia et al. reported a decrease of 25% in flow index of ONH in glaucomatous patients, with 100% sensitivity and specificity and strong correlation with VF pattern standard deviation (PSD).[17] Subsequent studies confirmed the ability of OCTA ONH perfusion parameters in detecting glaucoma and their association with structural and functional glaucomatous damage [Figure 5].[149‑152]
The glaucomatous loss of retinal ganglion cells and their axons in NFL is also associated with a reduction in perfusion.[153,154] Liu et al. were the first to use OCTA to demonstrate vascular changes in the peripapillary retina.[22] A significant reduction in peripapillary flow index and vessel density was reported in glaucomatous patients. The changes were found to be highly correlated with structural OCT changes,[155,156] as well as functional VF PSD and mean deviation (MD).[22] Moreover, the correlation of glaucoma stage[157] with peripapillary OCTA measurements was higher than VF PSD or MD.[22] OCTA parameters could differentiate glaucoma suspects from both healthy subjects and confirmed glaucoma
patients.[155,158] In addition, sectoral analysis of the retinal peripapillary region identified a significant association of microvascular impairment with VF defects.[159,160]
Changes in the lamina cribrosa have long been suggested to be associated with the pathophysiology of glaucoma.[161‑164] Suh et al. used both SD‑OCTA and structural SS‑OCT to investigate the peripapillary microvasculature of glaucomatous patients with and without lamina cribrosa defects.[165] Vessel density in the peripapillary region was found to be lower in the group with lamina cribrosa damage. Moreover, a spatial correlation was observed between the regions of the lowest microvascular impairment and the location of lamina cribrosa defects.[165] These findings highlight the possible causal relationship between lamina cribrosa defects and retinal microvasculature abnormalities.
Primary angle‑closure glaucomaRet inal perfusion in pr imary angle‑c losure glaucoma (PACG) has been studied and reported by Jiang and Sun using OCTA.[166] Compared to a control group, PACG eyes that have just recovered from an acute attack showed significantly decreased vessel density in the peripapillary regions, despite having normal RNFL thickness. In addition, peripapillary retinal perfusion was compared between POAG and PACG eyes with similar VF defects. The decrease in vessel density in PACG was found to be more evenly distributed throughout the peripapillary region. On the other hand, POAG eyes showed significantly lower perfusion in the inferotemporal region, which corresponds to the frequent superonasal VF damage in POAG.[167]
Jiang and Sun also compared retinal and ONH perfusion between normal eyes and PACG eyes of different levels of intraocular pressure (IOP) control (well‑controlled and poorly controlled).[166] They reported significantly reduced ONH, peripapillary, and parafoveal vessel density in PACG eyes. However, the decrease was greater in the peripapillary region than the parafoveal region. Moreover, poorly controlled IOP eyes showed significant reduction in ONH and peripapillary vessel density, but not in the parafoveal retina. These observations indicate that optic nerve perfusion is more significantly impaired by elevated IOP.[166]
Multiple sclerosisDetection of NFL loss using OCT is a well‑documented structural parameter in multiple sclerosis (MS) patients with and without optic neuritis.[168,169] OCT findings showed high correlation with functional measurements and were predictive of the clinical visual outcome.[168] Furthermore, OCTA measurements in MS patients detected retinal vascular impairment. Wang et al. reported significant decrease of ONH flow index in MS
Figure 5: The right eyes of a healthy subject (a) and primary open‑angle glaucoma patient (b). Focal capillary dropout in the infratemporal area is apparent in the en
face optical coherence tomography angiography of the radial peripapillary capillary plexus of the glaucoma patient (B2, white arrowheads). The optical coherence
tomography angiography lesions matched with the visual field defect (B3)
B1 B2 B3
A1 A2 A3
[Downloaded free from http://www.e-tjo.org on Thursday, May 9, 2019, IP: 79.2.66.129]
124 Taiwan J Ophthalmol - Volume 7, Issue 3, July-September 2017
patients with a history of optic neuritis compared to healthy controls or MS patients without ON.[16] On the other hand, no significant changes were observed in the parafoveal region.[16] These findings demonstrate the usefulness of OCTA in studying vascular abnormalities associated with MS.
Current Limitations and Potential Solutions
OCTA has many advantages over the traditional angiography techniques. However, it has certain technical restrictions. One limitation is the relatively small field of view of current commercial OCTA systems, which restricts imaging to the posterior pole. This limits its usefulness in diseases such as DR, which can affect the peripheral retina more severely in some patients. The field of view limitation will ease with the development of higher speed OCT systems capable of wide‑field OCTA scans without sacrificing sampling density. The development of automated image stitching algorithms will allow for more efficient montaging of multiple scans of adjacent areas to produce even wider OCT angiograms of the retina. Other limitations include artifacts that interfere with image interpretation–flow projection, shadow, motion, and signal strength variation. Improvement of processing algorithms will be needed to reduce these artifacts and improve the reliability of vessel density, vessel area, and flow measurements.
The 3D nature of OCTA allows for more comprehensive v i sua l iza t ion and quant i f i ca t ion o f ocu lar microvasculature. However, accurate segmentation is required for proper interpretation of ocular pathologies. Improvements in the accuracy of automated segmentation, as well as detection and quantification of pathologies, will make OCTA easier and more efficient to use in clinical settings.
Conclusion
OCTA has distinct advantages over FA and ICGA in the evaluation of retinal and optic nerve diseases. It provides noninvasive simultaneous 3D structural and blood flow information, allowing for comprehensive evaluation of disease presentation and progression. In addition, the ability to quantify angiographic information allows for objective monitoring of treatment response. Because OCTA is a novel imaging modality, it is still unclear how we should use it in the disease management. However, it has already improved the visualization of pathologies that were previously difficult to assess, such as capillary dropout in different retinal plexuses in glaucoma and DR, occult and nonexudative CNV, and the rapid dynamics of CNV flow response to anti‑VEGF therapy. More clinical experience and research are needed to establish the use of OCTA findings for clinical decision‑making. With the expected
technological improvements in the near future, we believe OCTA will become an important tool in standard eye care.
Financial support and sponsorshipThis work was supported by NIH grants DP3 DK104397; R01 EY024544, R01 EY023285, P30 EY010572, and an unrestricted grant from Research to Prevent Blindness.
Conflicts of interestOregon Health & Science University (OHSU), Yali Jia and David Huang have a significant financial interest in Optovue, Inc., a company that may have a commercial interest in this technology. These potential conflicts of interest have been reviewed and managed by OHSU. David Huang receives patent royalties from Carl Zeiss Meditec, Inc. Other authors do not have financial interest in the subject of this article.
References
1. Huang D, Swanson EA, Lin CP, Schuman JS, Stinson WG, Chang W, et al. Optical coherence tomography. Science 1991;254:1178‑81.
2. López‑Sáez MP, Ordoqui E, Tornero P, Baeza A, Sainza T, Zubeldia JM, et al. Fluorescein‑induced allergic reaction. Ann Allergy Asthma Immunol 1998;81:428‑30.
3. Hope‑Ross M, Yannuzzi LA, Gragoudas ES, Guyer DR, Slakter JS, Sorenson JA, et al. Adverse reactions due to indocyanine green. Ophthalmology 1994;101:529‑33.
4. Williamson TH, Harris A. Color Doppler ultrasound imaging of the eye and orbit. Surv Ophthalmol 1996;40:255‑67.
5. Maleki N, Dai W, Alsop DC. Blood flow quantification of the human retina with MRI. NMR Biomed 2011;24:104‑11.
6. Pechauer AD, Huang D, Jia Y. Detecting blood flow response to stimulation of the human eye. Biomed Res Int 2015;2015:121973.
7. Schmetterer L, Garhofer G. How can blood flow be measured? Surv Ophthalmol 2007;52 Suppl 2:S134‑8.
8. Chen Z, Milner TE, Srinivas S, Wang X, Malekafzali A, van Gemert MJ, et al. Noninvasive imaging of in vivo blood flow velocity using optical Doppler tomography. Opt Lett 1997;22:1119‑21.
9. Tan O, Liu G, Liang L, Gao SS, Pechauer AD, Jia Y, et al. En face Doppler total retinal blood flow measurement with 70 kHz spectral optical coherence tomography. J Biomed Opt 2015;20:066004.
10. Jia Y, Bailey ST, Hwang TS, McClintic SM, Gao SS, Pennesi ME, et al. Quantitative optical coherence tomography angiography of vascular abnormalities in the living human eye. Proc Natl Acad Sci U S A 2015;112:E2395‑402.
11. Makita S, Hong Y, Yamanari M, Yatagai T, Yasuno Y. Optical coherence angiography. Opt Express 2006;14:7821‑40.
12. Jia Y, Tan O, Tokayer J, Potsaid B, Wang Y, Liu JJ, et al. Split‑spectrum amplitude‑decorrelation angiography with optical coherence tomography. Opt Express 2012;20:4710‑25.
13. Zhang M, Wang J, Pechauer AD, Hwang TS, Gao SS, Liu L, et al. Advanced image processing for optical coherence tomographic angiography of macular diseases. Biomed Opt Express 2015;6:4661‑75.
14. Jia Y, Morrison JC, Tokayer J, Tan O, Lombardi L, Baumann B, et al. Quantitative OCT angiography of optic nerve head blood flow. Biomed Opt Express 2012;3:3127‑37.
15. Jia Y, Bailey ST, Wilson DJ, Tan O, Klein ML, Flaxel CJ, et al. Quantitative optical coherence tomography angiography of
[Downloaded free from http://www.e-tjo.org on Thursday, May 9, 2019, IP: 79.2.66.129]

Taiwan J Ophthalmol - Volume 7, Issue 3, July-September 2017 125
choroidal neovascularization in age‑related macular degeneration. Ophthalmology 2014;121:1435‑44.
16. Wang X, Jia Y, Spain R, Potsaid B, Liu JJ, Baumann B, et al. Optical coherence tomography angiography of optic nerve head and parafovea in multiple sclerosis. Br J Ophthalmol 2014;98:1368‑73.
17. Jia Y, Wei E, Wang X, Zhang X, Morrison JC, Parikh M, et al. Optical coherence tomography angiography of optic disc perfusion in glaucoma. Ophthalmology 2014;121:1322‑32.
18. Wei E, Jia Y, Tan O, Potsaid B, Liu JJ, Choi W, et al. Parafoveal retinal vascular response to pattern visual stimulation assessed with OCT angiography. PLoS One 2013;8:e81343.
19. Pechauer AD, Jia Y, Liu L, Gao SS, Jiang C, Huang D. Optical coherence tomography angiography of peripapillary retinal blood flow response to hyperoxia. Invest Ophthalmol Vis Sci 2015;56:3287‑91.
20. Al‑Sheikh M, Tepelus TC, Nazikyan T, Sadda SR. Repeatability of automated vessel density measurements using optical coherence tomography angiography. Br J Ophthalmol 2017;101:449‑52.
21. Hwang TS, Gao SS, Liu L, Lauer AK, Bailey ST, Flaxel CJ, et al. Automated quantification of capillary nonperfusion using optical coherence tomography angiography in diabetic retinopathy. JAMA Ophthalmol 2016;134:367‑73.
22. Liu L, Jia Y, Takusagawa HL, Pechauer AD, Edmunds B, Lombardi L, et al. Optical coherence tomography angiography of the peripapillary retina in glaucoma. JAMA Ophthalmol 2015;133:1045‑52.
23. Zhang M, Hwang TS, Dongye C, Wilson DJ, Huang D, Jia Y. Automated quantification of nonperfusion in three retinal plexuses using projection‑resolved optical coherence tomography angiography in diabetic retinopathy. Invest Ophthalmol Vis Sci 2016;57:5101‑6.
24. Jain N, Jia Y, Gao SS, Zhang X, Weleber RG, Huang D, et al. Optical coherence tomography angiography in choroideremia: Correlating choriocapillaris loss with overlying degeneration. JAMA Ophthalmol 2016;134:697‑702.
25. Agemy SA, Scripsema NK, Shah CM, Chui T, Garcia PM, Lee JG, et al. Retinal vascular perfusion density mapping using optical coherence tomography angiography in normals and diabetic retinopathy patients. Retina 2015;35:2353‑63.
26. Gao SS, Liu L, Bailey ST, Flaxel CJ, Huang D, Li D, et al. Quantification of choroidal neovascularization vessel length using optical coherence tomography angiography. J Biomed Opt 2016;21:76010.
27. Liu L, Gao SS, Bailey ST, Huang D, Li D, Jia Y. Automated choroidal neovascularization detection algorithm for optical coherence tomography angiography. Biomed Opt Express 2015;6:3564‑76.
28. Huang D, Jia Y, Rispoli M, Tan O, Lumbroso B. Optical coherence tomography angiography of time course of choroidal neovascularization in response to anti‑angiogenic treatment. Retina 2015;35:2260‑4.
29. McClintic SM, Jia Y, Huang D, Bailey ST. Optical coherence tomographic angiography of choroidal neovascularization associated with central serous chorioretinopathy. JAMA Ophthalmol 2015;133:1212‑4.
30. Huang D, Jia Y, Gao SS. Principles of optical coherence tomography angiography. In: Lumbroso B, Huang D, Chen CJ, Jia Y, Rispoli M, Romano A, et al, editors. Clinical OCT Angiography Atlas. New Delhi: Jaypee Brothers Medical Publishers; 2015.
31. Gao SS, Jia Y, Zhang M, Su JP, Liu G, Hwang TS, et al. Optical coherence tomography angiography. Invest Ophthalmol Vis Sci 2016;57:OCT27‑36.
32. Kraus MF, Potsaid B, Mayer MA, Bock R, Baumann B, Liu JJ, et al. Motion correction in optical coherence tomography volumes on a per A‑scan basis using orthogonal scan patterns. Biomed Opt Express 2012;3:1182‑99.
33. Huang D, Jia Y, Gao SS, Lumbroso B, Rispoli M. Optical coherence tomography angiography using the optovue device. Dev Ophthalmol 2016;56:6‑12.
34. Rosenfeld PJ, Durbin MK, Roisman L, Zheng F, Miller A, Robbins G, et al. ZEISS angioplex spectral domain optical coherence tomography angiography: Technical aspects. Dev Ophthalmol 2016;56:18‑29.
35. Camino A, Zhang M, Dongye C, Pechauer AD, Hwang TS, Bailey ST, et al. Automated registration and enhanced processing of clinical optical coherence tomography angiography. Quant Imaging Med Surg 2016;6:391‑401.
36. Gadde SG, Anegondi N, Bhanushali D, Chidambara L, Yadav NK, Khurana A, et al. Quantification of vessel density in retinal optical coherence tomography angiography images using local fractal dimension. Invest Ophthalmol Vis Sci 2016;57:246‑52.
37. Zhang A, Zhang Q, Wang RK. Minimizing projection artifacts for accurate presentation of choroidal neovascularization in OCT micro‑angiography. Biomed Opt Express 2015;6:4130‑43.
38. Zhang M, Hwang TS, Campbell JP, Bailey ST, Wilson DJ, Huang D, et al. Projection‑resolved optical coherence tomographic angiography. Biomed Opt Express 2016;7:816‑28.
39. Hwang TS, Zhang M, Bhavsar K, Zhang X, Campbell JP, Lin P, et al. Visualization of 3 distinct retinal plexuses by projection‑resolved optical coherence tomography angiography in diabetic retinopathy. JAMA Ophthalmol 2016;134:1411‑9.
40. Novotny HR, Alvis DL. A method of photographing fluorescence in circulating blood in the human retina. Circulation 1961;24:82‑6.
41. Flower RW, Hochheimer BF. Indocyanine green dye fluorescence and infrared absorption choroidal angiography performed simultaneously with fluorescein angiography. Johns Hopkins Med J 1976;138:33‑42.
42. Lumbroso B, Huang D, Chen CJ, Jia Y, Rispoli M, Romano A, et al. Clinical OCT Angiography Atlas. New Delhi, India: Jaypee Brothers Medical Publishers, Ltd.; 2015.
43. Snodderly DM, Weinhaus RS. Retinal vasculature of the fovea of the squirrel monkey, Saimiri sciureus: Three‑dimensional architecture, visual screening, and relationships to the neuronal layers. J Comp Neurol 1990;297:145‑63.
44. Yi J, Liu W, Chen S, Backman V, Sheibani N, Sorenson CM, et al. Visible light optical coherence tomography measures retinal oxygen metabolic response to systemic oxygenation. Light Sci Appl 2015;4. pii: e334.
45. Ferrara D, Waheed NK, Duker JS. Investigating the choriocapillaris and choroidal vasculature with new optical coherence tomography technologies. Prog Retin Eye Res 2016;52:130‑55.
46. Choi W, Mohler KJ, Potsaid B, Lu CD, Liu JJ, Jayaraman V, et al. Choriocapillaris and choroidal microvasculature imaging with ultrahigh speed OCT angiography. PLoS One 2013;8:e81499.
47. Palejwala NV, Jia Y, Gao SS, Liu L, Flaxel CJ, Hwang TS, et al. Detection of nonexudative choroidal neovascularization in age‑related macular degeneration with optical coherence tomography angiography. Retina 2015;35:2204‑11.
48. Roisman L, Zhang Q, Wang RK, Gregori G, Zhang A, Chen CL, et al. Optical coherence tomography angiography of asymptomatic neovascularization in intermediate age‑related macular degeneration. Ophthalmology 2016;123:1309‑19.
49. Kuehlewein L, Bansal M, Lenis TL, Iafe NA, Sadda SR, Bonini Filho MA, et al. Optical coherence tomography angiography of type 1 neovascularization in age‑related macular degeneration. Am J Ophthalmol 2015;160:739‑48.e2.
50. Liang MC, Witkin AJ. Optical coherence tomography angiography of mixed neovascularizations in age‑related macular degeneration. Dev Ophthalmol 2016;56:62‑70.
51. El Ameen A, Cohen SY, Semoun O, Miere A, Srour M, Quaranta‑El Maftouhi M, et al. Type 2 neovascularization secondary to age‑related macular degeneration imaged by optical coherence tomography angiography. Retina 2015;35:2212‑8.
[Downloaded free from http://www.e-tjo.org on Thursday, May 9, 2019, IP: 79.2.66.129]
126 Taiwan J Ophthalmol - Volume 7, Issue 3, July-September 2017
52. Dansingani KK, Freund KB. Optical coherence tomography angiography reveals mature, tangled vascular networks in eyes with neovascular age‑related macular degeneration showing resistance to geographic atrophy. Ophthalmic Surg Lasers Imaging Retina 2015;46:907‑12.
53. Phasukkijwatana N, Tan AC, Chen X, Freund KB, Sarraf D. Optical coherence tomography angiography of type 3 neovascularisation in age‑related macular degeneration after antiangiogenic therapy. Br J Ophthalmol 2016. pii: bjophthalmol‑2016‑308815.
54. Muakkassa NW, Chin AT, de Carlo T, Klein KA, Baumal CR, Witkin AJ, et al. Characterizing the effect of anti‑vascular endothelial growth factor therapy on treatment‑naive choroidal neovascularization using optical coherence tomography angiography. Retina 2015;35:2252‑9.
55. Kuehlewein L, Sadda SR, Sarraf D. OCT angiography and sequential quantitative analysis of type 2 neovascularization after ranibizumab therapy. Eye (Lond) 2015;29:932‑5.
56. Coscas G, Lupidi M, Coscas F, Français C, Cagini C, Souied EH. Optical coherence tomography angiography during follow‑up: Qualitative and quantitative analysis of mixed type I and II choroidal neovascularization after vascular endothelial growth factor trap therapy. Ophthalmic Res 2015;54:57‑63.
57. Kuehlewein L, Dansingani KK, de Carlo TE, Bonini Filho MA, Iafe NA, Lenis TL, et al. Optical coherence tomography angiography of type 3 neovascularization secondary to age‑related macular degeneration. Retina 2015;35:2229‑35.
58. Miere A, Querques G, Semoun O, El Ameen A, Capuano V, Souied EH. Optical coherence tomography angiography in early type 3 neovascularization. Retina 2015;35:2236‑41.
59. Querques G, Miere A, Souied EH. Optical coherence tomography angiography features of type 3 neovascularization in age‑related macular degeneration. Dev Ophthalmol 2016;56:57‑61.
60. Liang MC, de Carlo TE, Baumal CR, Reichel E, Waheed NK, Duker JS, et al. Correlation of spectral domain optical coherence tomography angiography and clinical activity in neovascular age‑related macular degeneration. Retina 2016;36:2265‑73.
61. Gong J, Yu S, Gong Y, Wang F, Sun X. The diagnostic accuracy of optical coherence tomography angiography for neovascular age‑related macular degeneration: A comparison with fundus fluorescein angiography. J Ophthalmol 2016;2016:7521478.
62. de Carlo TE, Bonini Filho MA, Chin AT, Adhi M, Ferrara D, Baumal CR, et al. Spectral‑domain optical coherence tomography angiography of choroidal neovascularization. Ophthalmology 2015;122:1228‑38.
63. Miere A, Semoun O, Cohen SY, El Ameen A, Srour M, Jung C, et al. Optical coherence tomography angiography features of subretinal fibrosis in age‑related macular degeneration. Retina 2015;35:2275‑84.
64. Souied EH, Miere A, Cohen SY, Semoun O, Querques G. Optical coherence tomography angiography of fibrosis in age‑related macular degeneration. Dev Ophthalmol 2016;56:86‑90.
65. Dansingani KK, Tan AC, Gilani F, Phasukkijwatana N, Novais E, Querques L, et al. Subretinal hyperreflective material imaged with optical coherence tomography angiography. Am J Ophthalmol 2016;169:235‑48.
66. Yannuzzi LA, Sorenson J, Spaide RF, Lipson B. Idiopathic polypoidal choroidal vasculopathy (IPCV). Retina 1990;10:1‑8.
67. Inoue M, Balaratnasingam C, Freund KB. Optical coherence tomography angiography of polypoidal choroidal vasculopathy and polypoidal choroidal neovascularization. Retina 2015;35:2265‑74.
68. Wang M, Zhou Y, Gao SS, Liu W, Huang Y, Huang D, et al. Evaluating polypoidal choroidal vasculopathy with optical coherence tomography angiography. Invest Ophthalmol Vis Sci 2016;57:OCT526‑32.
69. Tomiyasu T, Nozaki M, Yoshida M, Ogura Y. Characteristics
of polypoidal choroidal vasculopathy evaluated by optical coherence tomography angiography. Invest Ophthalmol Vis Sci 2016;57:OCT324‑30.
70. Kim JY, Kwon OW, Oh HS, Kim SH, You YS. Optical coherence tomography angiography in patients with polypoidal choroidal vasculopathy. Graefes Arch Clin Exp Ophthalmol 2016;254:1505‑10.
71. Srour M, Querques G, Semoun O, El Ameen A, Miere A, Sikorav A, et al. Optical coherence tomography angiography characteristics of polypoidal choroidal vasculopathy. Br J Ophthalmol 2016;100:1489‑93.
72. Wang M, Munch IC, Hasler PW, Prünte C, Larsen M. Central serous chorioretinopathy. Acta Ophthalmol 2008;86:126‑45.
73. Bonini Filho MA, de Carlo TE, Ferrara D, Adhi M, Baumal CR, Witkin AJ, et al. Association of choroidal neovascularization and central serous chorioretinopathy with optical coherence tomography angiography. JAMA Ophthalmol 2015;133:899‑906.
74. de Carlo TE, Rosenblatt A, Goldstein M, Baumal CR, Loewenstein A, Duker JS. Vascularization of irregular retinal pigment epithelial detachments in chronic central serous chorioretinopathy evaluated with OCT angiography. Ophthalmic Surg Lasers Imaging Retina 2016;47:128‑33.
75. Quaranta‑El Maftouhi M, El Maftouhi A, Eandi CM. Chronic central serous chorioretinopathy imaged by optical coherence tomographic angiography. Am J Ophthalmol 2015;160:581‑7.e1.
76. Feucht N, Maier M, Lohmann CP, Reznicek L. OCT angiography findings in acute central serous chorioretinopathy. Ophthalmic Surg Lasers Imaging Retina 2016;47:322‑7.
77. Costanzo E, Cohen SY, Miere A, Querques G, Capuano V, Semoun O, et al. Optical coherence tomography angiography in central serous chorioretinopathy. J Ophthalmol 2015;2015:134783.
78. Wang Y, Chen ZQ, Wang W, Fang XY. Multimodal imaging evaluations of focal choroidal excavations in eyes with central serous chorioretinopathy. J Ophthalmol 2016;2016:7073083.
79. Bhutto I, Lutty G. Understanding age‑related macular degeneration (AMD): Relationships between the photoreceptor/retinal pigment epithelium/Bruch’s membrane/choriocapillaris complex. Mol Aspects Med 2012;33:295‑317.
80. Kim DY, Fingler J, Zawadzki RJ, Park SS, Morse LS, Schwartz DM, et al. Optical imaging of the chorioretinal vasculature in the living human eye. Proc Natl Acad Sci U S A 2013;110:14354‑9.
81. Pellegrini M, Acquistapace A, Oldani M, Cereda MG, Giani A, Cozzi M, et al. Dark atrophy: An optical coherence tomography angiography study. Ophthalmology 2016;123:1879‑86.
82. Kvanta A, de Salles MC, Amrén U, Bartuma H. Optical coherence tomography angiography of the foveal microvasculature in geographic atrophy. Retina 2017;37:936‑42.
83. Choi W, Moult EM, Waheed NK, Adhi M, Lee B, Lu CD, et al. Ultrahigh‑speed, swept‑source optical coherence tomography angiography in nonexudative age‑related macular degeneration with geographic atrophy. Ophthalmology 2015;122:2532‑44.
84. Toto L, Borrelli E, Di Antonio L, Carpineto P, Mastropasqua R. Retinal vascular plexuses’ changes in dry age‑related macular degeneration, evaluated by means of optical coherence tomography angiography. Retina 2016;36:1566‑72.
85. Frank RN. Diabetic retinopathy. N Engl J Med 2004;350:48‑58.86. Tapp RJ, Shaw JE, Harper CA, de Courten MP, Balkau B,
McCarty DJ, et al. The prevalence of and factors associated with diabetic retinopathy in the Australian population. Diabetes Care 2003;26:1731‑7.
87. Hwang TS, Jia Y, Gao SS, Bailey ST, Lauer AK, Flaxel CJ, et al. Optical coherence tomography angiography features of diabetic retinopathy. Retina 2015;35:2371‑6.
88. Freiberg FJ, Pfau M, Wons J, Wirth MA, Becker MD, Michels S. Optical coherence tomography angiography of the foveal avascular zone in diabetic retinopathy. Graefes Arch Clin Exp Ophthalmol 2016;254:1051‑8.
[Downloaded free from http://www.e-tjo.org on Thursday, May 9, 2019, IP: 79.2.66.129]
Taiwan J Ophthalmol - Volume 7, Issue 3, July-September 2017 127
89. Di G, Weihong Y, Xiao Z, Zhikun Y, Xuan Z, Yi Q, et al. A morphological study of the foveal avascular zone in patients with diabetes mellitus using optical coherence tomography angiography. Graefes Arch Clin Exp Ophthalmol 2016;254:873‑9.
90. Schwartz DM, Fingler J, Kim DY, Zawadzki RJ, Morse LS, Park SS, et al. Phase‑variance optical coherence tomography: A technique for noninvasive angiography. Ophthalmology 2014;121:180‑7.
91. Ishibazawa A, Nagaoka T, Takahashi A, Omae T, Tani T, Sogawa K, et al. Optical coherence tomography angiography in diabetic retinopathy: A prospective pilot study. Am J Ophthalmol 2015;160:35‑44.e1.
92. de Carlo TE, Bonini Filho MA, Baumal CR, Reichel E, Rogers A, Witkin AJ, et al. Evaluation of preretinal neovascularization in proliferative diabetic retinopathy using optical coherence tomography angiography. Ophthalmic Surg Lasers Imaging Retina 2016;47:115‑9.
93. de Carlo TE, Chin AT, Bonini Filho MA, Adhi M, Branchini L, Salz DA, et al. Detection of microvascular changes in eyes of patients with diabetes but not clinical diabetic retinopathy using optical coherence tomography angiography. Retina 2015;35:2364‑70.
94. Salz DA, de Carlo TE, Adhi M, Moult E, Choi W, Baumal CR, et al. Select features of diabetic retinopathy on swept‑source optical coherence tomographic angiography compared with fluorescein angiography and normal eyes. JAMA Ophthalmol 2016;134:644‑50.
95. Al‑Sheikh M, Akil H, Pfau M, Sadda SR. Swept‑source OCT angiography imaging of the foveal avascular zone and macular capillary network density in diabetic retinopathy. Invest Ophthalmol Vis Sci 2016;57:3907‑13.
96. Balaratnasingam C, Inoue M, Ahn S, McCann J, Dhrami‑Gavazi E, Yannuzzi LA, et al. Visual acuity is correlated with the area of the foveal avascular zone in diabetic retinopathy and retinal vein occlusion. Ophthalmology 2016;123:2352‑67.
97. Cugati S, Varma DD, Chen CS, Lee AW. Treatment options for central retinal artery occlusion. Curr Treat Options Neurol 2013;15:63‑77.
98. Dahrling BE 2nd. The histopathology of early central retinal artery occlusion. Arch Ophthalmol 1965;73:506‑10.
99. Casselholmde Salles M, Kvanta A, Amrén U, Epstein D. Optical coherence tomography angiography in central retinal vein occlusion: Correlation between the foveal avascular zone and visual acuity. Invest Ophthalmol Vis Sci 2016;57:OCT242‑6.
100. Kuehlewein L, An L, Durbin MK, Sadda SR. Imaging areas of retinal nonperfusion in ischemic branch retinal vein occlusion with swept‑source OCT microangiography. Ophthalmic Surg Lasers Imaging Retina 2015;46:249‑52.
101. Rispoli M, Savastano MC, Lumbroso B. Capillary network anomalies in branch retinal vein occlusion on optical coherence tomography angiography. Retina 2015;35:2332‑8.
102. Kashani AH, Lee SY, Moshfeghi A, Durbin MK, Puliafito CA. Optical coherence tomography angiography of retinal venous occlusion. Retina 2015;35:2323‑31.
103. Coscas F, Glacet‑Bernard A, Miere A, Caillaux V, Uzzan J, Lupidi M, et al. Optical coherence tomography angiography in retinal vein occlusion: Evaluation of superficial and deep capillary plexa. Am J Ophthalmol 2016;161:160‑71.e1‑2.
104. Yu S, Pang CE, Gong Y, Freund KB, Yannuzzi LA, Rahimy E, et al. The spectrum of superficial and deep capillary ischemia in retinal artery occlusion. Am J Ophthalmol 2015;159:53‑63.e1‑2.
105. Mastropasqua R, Di Antonio L, Di Staso S, Agnifili L, Di Gregorio A, Ciancaglini M, et al. Optical coherence tomography angiography in retinal vascular diseases and choroidal neovascularization. J Ophthalmol 2015;2015:343515.
106. Bonini Filho MA, Adhi M, de Carlo TE, Ferrara D, Baumal CR, Witkin AJ, et al. Optical coherence tomography angiography in retinal artery occlusion. Retina 2015;35:2339‑46.
107. de Castro‑Abeger AH, de Carlo TE, Duker JS, Baumal CR. Optical coherence tomography angiography compared to fluorescein angiography in branch retinal artery occlusion. Ophthalmic Surg Lasers Imaging Retina 2015;46:1052‑4.
108. Damento G, Chen MH, Leng T. Spectral‑domain optical coherence tomography angiography of central retinal artery occlusion. Ophthalmic Surg Lasers Imaging Retina 2016;47:467‑70.
109. Sarraf D, Rahimy E, Fawzi AA, Sohn E, Barbazetto I, Zacks DN, et al. Paracentral acute middle maculopathy: A new variant of acute macular neuroretinopathy associated with retinal capillary ischemia. JAMA Ophthalmol 2013;131:1275‑87.
110. Sridhar J, Shahlaee A, Rahimy E, Hong BK, Khan MA, Maguire JI, et al. Optical coherence tomography angiography and en face optical coherence tomography features of paracentral acute middle maculopathy. Am J Ophthalmol 2015;160:1259‑68.e2.
111. Khan MA, Rahimy E, Shahlaee A, Hsu J, Ho AC. En face optical coherence tomography imaging of deep capillary plexus abnormalities in paracentral acute middle maculopathy. Ophthalmic Surg Lasers Imaging Retina 2015;46:972‑5.
112. Nemiroff J, Kuehlewein L, Rahimy E, Tsui I, Doshi R, Gaudric A, et al. Assessing deep retinal capillary ischemia in paracentral acute middle maculopathy by optical coherence tomography angiography. Am J Ophthalmol 2016;162:121‑32.e1.
113. Matet A, Daruich A, Dirani A, Ambresin A, Behar‑Cohen F. Macular telangiectasia type 1: Capillary density and microvascular abnormalities assessed by optical coherence tomography angiography. Am J Ophthalmol 2016;167:18‑30.
114. Zhang Q, Wang RK, Chen CL, Legarreta AD, Durbin MK, An L, et al. Swept source optical coherence tomography angiography of neovascular macular telangiectasia type 2. Retina 2015;35:2285‑99.
115. Gaudric A, Krivosic V, Tadayoni R. Outer retina capillary invasion and ellipsoid zone loss in macular telangiectasia type 2 imaged by optical coherence tomography angiography. Retina 2015;35:2300‑6.
116. Zeimer M, Gutfleisch M, Heimes B, Spital G, Lommatzsch A, Pauleikhoff D. Association between changes in macular vasculature in optical coherence tomography‑ and fluorescein‑ angiography and distribution of macular pigment in type 2 idiopathic macular telangiectasia. Retina 2015;35:2307‑16.
117. Spaide RF, Klancnik JM Jr., Cooney MJ. Retinal vascular layers in macular telangiectasia type 2 imaged by optical coherence tomographic angiography. JAMA Ophthalmol 2015;133:66‑73.
118. Chidambara L, Gadde SG, Yadav NK, Jayadev C, Bhanushali D, Appaji AM, et al. Characteristics and quantification of vascular changes in macular telangiectasia type 2 on optical coherence tomography angiography. Br J Ophthalmol 2016;100:1482‑8.
119. Olson JL, Mandava N. Macular hole formation associated with idiopathic parafoveal telangiectasia. Graefes Arch Clin Exp Ophthalmol 2006;244:411‑2.
120. Koizumi H, Slakter JS, Spaide RF. Full‑thickness macular hole formation in idiopathic parafoveal telangiectasis. Retina 2007;27:473‑6.
121. Toto L, Di Antonio L, Mastropasqua R, Mattei PA, Carpineto P, Borrelli E, et al. Multimodal imaging of macular telangiectasia type 2: Focus on vascular changes using optical coherence tomography angiography. Invest Ophthalmol Vis Sci 2016;57:OCT268‑76.
122. Balaratnasingam C, Yannuzzi LA, Spaide RF. Possible choroidal neovascularization in macular telangiectasia type 2. Retina 2015;35:2317‑22.
123. Patel R, Gao S, Pennesi M, Yang P, Weleber R, Wilson DJ. Inherited retinal degenerations. In: Huang D, Lumbroso B, Jia Y, Waheed NK, editors. Optical Coherence Tomography Angiography of the Eye. Thorofare, NJ, USA: Slack; 2017.
124. Battaglia Parodi M, Cicinelli MV, Rabiolo A, Pierro L, Gagliardi M, Bolognesi G, et al. Vessel density analysis in patients with
[Downloaded free from http://www.e-tjo.org on Thursday, May 9, 2019, IP: 79.2.66.129]
128 Taiwan J Ophthalmol - Volume 7, Issue 3, July-September 2017
retinitis pigmentosa by means of optical coherence tomography angiography. Br J Ophthalmol 2017;101:428‑32.
125. Battaglia Parodi M, Cicinelli MV, Rabiolo A, Pierro L, Bolognesi G, Bandello F. Vascular abnormalities in patients with Stargardt disease assessed with optical coherence tomography angiography. Br J Ophthalmol 2016. pii: bjophthalmol‑2016‑308869.
126. Patel RC, Gao SS, Zhang M, Alabduljalil T, Al‑Qahtani A, Weleber RG, et al. Optical coherence tomography angiography of choroidal neovascularization in four inherited retinal dystrophies. Retina 2016;36:2339‑47.
127. Sandhu R, Jia Y, Liu L, Palejwala NV, Suhler EB, Hwang TS, et al. Assessment of Macular Circulation in Patients With Retinal Vasculitis using OCT Angiography. Investigative Ophthalmology & Visual Science 2015;56:3359.
128. Lin P, Liu L, Zhang M. Optical coherence tomography angiography in retinal vasculitis. In: Huang D, Lumbroso B, Jia Y, Waheed NK, editors. Optical Coherence Tomography Angiography of the Eye. Thorofare, NJ, USA: Slack; 2017.
129. de Carlo TE, Bonini Filho MA, Adhi M, Duker JS. Retinal and choroidal vasculature in birdshot chorioretinopathy analyzed using spectral domain optical coherence tomography angiography. Retina 2015;35:2392‑9.
130. Phasukkijwatana N, Iafe N, Sarraf D. Optical coherence tomography angiography of A29 birdshot chorioretinopathy complicated by retinal neovascularization. Retin Cases Brief Rep 2017;11 Suppl 1:S68‑72.
131. Roberts P, Fawzi AA, Jampol LM. White spot syndromes. In: Huang D, Lumbroso B, Jia Y, Waheed NK, editors. Optical Coherence Tomography Angiography of the Eye. Thorofare, NJ, USA: Slack; 2017.
132. Romano A, Ferrara D, Belfort R Jr. Choroiditis, retinitis and vasculitis. In: Huang D, Lumbroso B, Jia Y, Waheed NK, editors. Optical Coherence Tomography Angiography of the Eye. Thorofare, NJ, USA: Slack; 2017.
133. Levison AL, Baynes K, Lowder CY, Srivastava SK. OCT angiography identification of choroidal neovascularization secondary to acute zonal occult outer retinopathy. Ophthalmic Surg Lasers Imaging Retina 2016;47:73‑5.
134. Spaide RF. Volume rendering of optical coherence tomography angiography reveals extensive retinal vascular contributions to neovascularization in ocular toxoplasmosis. Retina 2015;35:2421‑2.
135. Shields CL, Shields JA, Cater J, Gündüz K, Miyamoto C, Micaily B, et al. Plaque radiotherapy for uveal melanoma: Long‑term visual outcome in 1106 consecutive patients. Arch Ophthalmol 2000;118:1219‑28.
136. Archer DB, Amoaku WM, Gardiner TA. Radiat ion retinopathy‑clinical, histopathological, ultrastructural and experimental correlations. Eye (Lond) 1991;5(Pt 2):239‑51.
137. Gündüz K, Shields CL, Shields JA, Cater J, Freire JE, Brady LW. Radiation retinopathy following plaque radiotherapy for posterior uveal melanoma. Arch Ophthalmol 1999;117:609‑14.
138. Finger PT, Kurli M. Laser photocoagulation for radiation retinopathy after ophthalmic plaque radiation therapy. Br J Ophthalmol 2005;89:730‑8.
139. Horgan N, Shields CL, Mashayekhi A, Teixeira LF, Materin MA, Shields JA. Early macular morphological changes following plaque radiotherapy for uveal melanoma. Retina 2008;28:263‑73.
140. Veverka KK, AbouChehade JE, Iezzi R Jr., Pulido JS. Noninvasive grading of radiation retinopathy: The use of optical coherence tomography angiography. Retina 2015;35:2400‑10.
141. Shields CL, Say EA, Samara WA, Khoo CT, Mashayekhi A, Shields JA. Optical coherence tomography angiography of the macula after plaque radiotherapy of choroidal melanoma: Comparison of irradiated versus nonirradiated eyes in 65 patients. Retina 2016;36:1493‑505.
142. Say EA, Samara WA, Khoo CT, Magrath GN, Sharma P,
Ferenczy S, et al. Parafoveal capillary density after plaque radiotherapy for choroidal melanoma: Analysis of eyes without radiation maculopathy. Retina 2016;36:1670‑8.
143. Matet A, Ambresin A, Cennamo G, Zografos L. Radiation maculopathy. In: Huang D, Lumbroso B, Jia Y, Waheed NK, editors. Optical Coherence Tomography Angiography of the Eye. Thorofare, NJ, USA: Slack; 2017.
144. El Beltagi TA, Bowd C, Boden C, Amini P, Sample PA, Zangwill LM, et al. Retinal nerve fiber layer thickness measured with optical coherence tomography is related to visual function in glaucomatous eyes. Ophthalmology 2003;110:2185‑91.
145. Yalvac IS, Altunsoy M, Cansever S, Satana B, Eksioglu U, Duman S. The correlation between visual field defects and focal nerve fiber layer thickness measured with optical coherence tomography in the evaluation of glaucoma. J Glaucoma 2009;18:53‑61.
146. Bonomi L, Marchini G, Marraffa M, Bernardi P, Morbio R, Varotto A. Vascular risk factors for primary open angle glaucoma: The Egna‑Neumarkt Study. Ophthalmology 2000;107:1287‑93.
147. Flammer J. The vascular concept of glaucoma. Survey of Ophthalmology 1994 May 1;38:S3‑6.
148. An L, Johnstone M, Wang RK. Optical microangiography provides correlation between microstructure and microvasculature of optic nerve head in human subjects. J Biomed Opt 2012;17:116018.
149. Wang X, Jiang C, Ko T, Kong X, Yu X, Min W, et al. Correlation between optic disc perfusion and glaucomatous severity in patients with open‑angle glaucoma: An optical coherence tomography angiography study. Graefes Arch Clin Exp Ophthalmol 2015;253:1557‑64.
150. Lévêque PM, Zéboulon P, Brasnu E, Baudouin C, Labbé A. Optic disc vascularization in glaucoma: Value of spectral‑domain optical coherence tomography angiography. J Ophthalmol 2016;2016:6956717.
151. Bojikian KD, Chen CL, Wen JC, Zhang Q, Xin C, Gupta D, et al. Optic disc perfusion in primary open angle and normal tension glaucoma eyes using optical coherence tomography‑based microangiography. PLoS One 2016;11:e0154691.
152. Chen CL, Bojikian KD, Gupta D, Wen JC, Zhang Q, Xin C, et al. Optic nerve head perfusion in normal eyes and eyes with glaucoma using optical coherence tomography‑based microangiography. Quant Imaging Med Surg 2016;6:125‑33.
153. Michelson G, Langhans MJ, Groh MJ. Perfusion of the juxtapapillary retina and the neuroretinal rim area in primary open angle glaucoma. J Glaucoma 1996;5:91‑8.
154. Michelson G, Langhans MJ, Harazny J, Dichtl A. Visual field defect and perfusion of the juxtapapillary retina and the neuroretinal rim area in primary open‑angle glaucoma. Graefes Arch Clin Exp Ophthalmol 1998;236:80‑5.
155. Chen CL, Zhang A, Bojikian KD, Wen JC, Zhang Q, Xin C, et al. Peripapillary retinal nerve fiber layer vascular microcirculation in glaucoma using optical coherence tomography‑based microangiography. Invest Ophthalmol Vis Sci 2016;57:OCT475‑85.
156. Mammo Z, Heisler M, Balaratnasingam C, Lee S, Yu DY, Mackenzie P, et al. Quantitative optical coherence tomography angiography of radial peripapillary capillaries in glaucoma, glaucoma suspect, and normal eyes. Am J Ophthalmol 2016;170:41‑9.
157. Brusini P, Filacorda S. Enhanced Glaucoma Staging System (GSS 2) for classifying functional damage in glaucoma. J Glaucoma 2006;15:40‑6.
158. Yarmohammadi A, Zangwill LM, Diniz‑Filho A, Suh MH, Manalastas PI, Fatehee N, et al. Optical coherence tomography angiography vessel density in healthy, glaucoma suspect, and glaucoma eyes. Invest Ophthalmol Vis Sci 2016;57:OCT451‑9.
159. Akagi T, Iida Y, Nakanishi H, Terada N, Morooka S, Yamada H, et al. Microvascular density in glaucomatous eyes with hemifield visual field defects: An optical coherence tomography angiography study. Am J Ophthalmol 2016;168:237‑49.
[Downloaded free from http://www.e-tjo.org on Thursday, May 9, 2019, IP: 79.2.66.129]
Taiwan J Ophthalmol - Volume 7, Issue 3, July-September 2017 129
160. Ichiyama Y, Minamikawa T, Niwa Y, Ohji M. Capillary dropout at the retinal nerve fiber layer defect in glaucoma: An optical coherence tomography angiography study. J Glaucoma 2017;26:e142‑5.
161. Park SC, Hsu AT, Su D, Simonson JL, Al‑Jumayli M, Liu Y, et al. Factors associated with focal lamina cribrosa defects in glaucoma. Invest Ophthalmol Vis Sci 2013;54:8401‑7.
162. Faridi OS, Park SC, Kabadi R, Su D, De Moraes CG, Liebmann JM, et al. Effect of focal lamina cribrosa defect on glaucomatous visual field progression. Ophthalmology 2014;121:1524‑30.
163. Weinreb RN, Aung T, Medeiros FA. The pathophysiology and treatment of glaucoma: A review. JAMA 2014;311:1901‑11.
164. Tatham AJ, Miki A, Weinreb RN, Zangwill LM, Medeiros FA. Defects of the lamina cribrosa in eyes with localized retinal nerve fiber layer loss. Ophthalmology 2014;121:110‑8.
165. Suh MH, Zangwill LM, Manalastas PI, Belghith A, Yarmohammadi A, Medeiros FA, et al. Optical coherence tomography angiography vessel density in glaucomatous
eyes with focal lamina cribrosa defects. Ophthalmology 2016;123:2309‑17.
166. Jiang C, Sun X. Primary angle‑closure glaucoma. In: Huang D, Lumbroso B, Jia Y, Waheed NK, editors. Optical Coherence Tomography Angiography of the Eye. Thorofare, NJ, USA: Slack; 2017.
167. Hayreh SS. Blood supply of the optic nerve head and its role in optic atrophy, glaucoma, and oedema of the optic disc. Br J Ophthalmol 1969;53:721‑48.
168. Petzold A, de Boer JF, Schippling S, Vermersch P, Kardon R, Green A, et al. Optical coherence tomography in multiple sclerosis: A systematic review and meta‑analysis. Lancet Neurol 2010;9:921‑32.
169. Martinez‑Lapiscina EH, Arnow S, Wilson JA, Saidha S, Preiningerova JL, Oberwahrenbrock T, et al. Retinal thickness measured with optical coherence tomography and risk of disability worsening in multiple sclerosis: A cohort study. Lancet Neurol 2016;15:574‑84.
[Downloaded free from http://www.e-tjo.org on Thursday, May 9, 2019, IP: 79.2.66.129]