Optical Coherence Tomography Grading Reproducibility ... · Optical Coherence Tomography Grading...
9
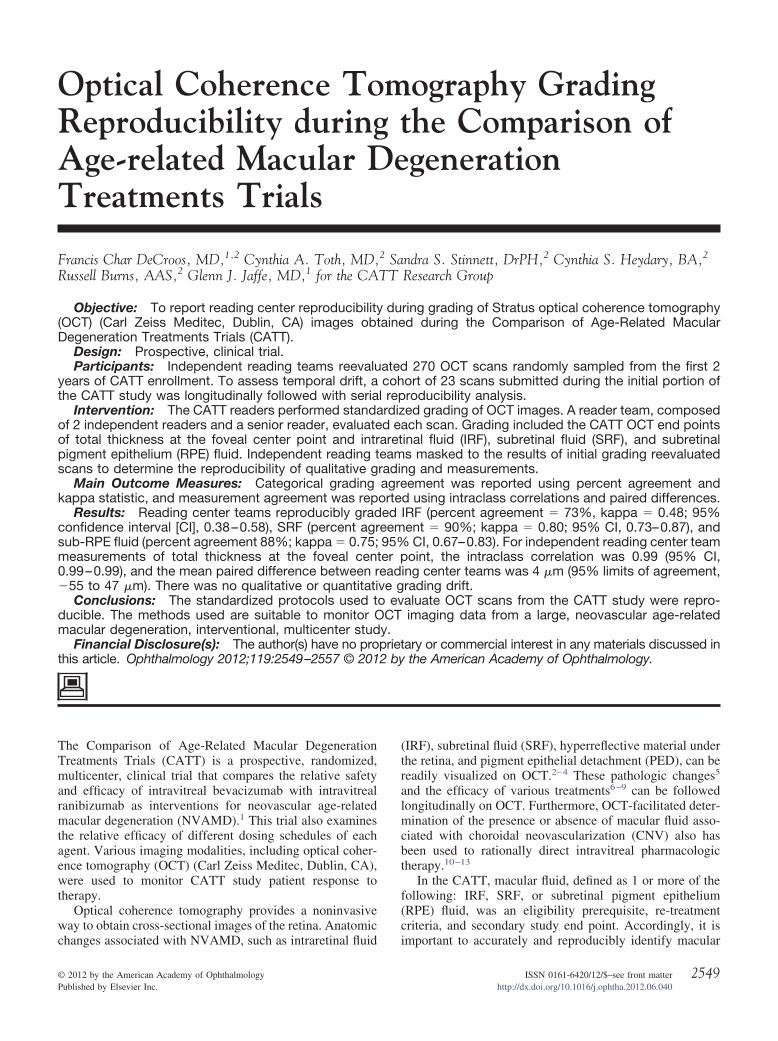
Optical Coherence Tomography Grading Reproducibility during the Comparison of Age-related Macular Degeneration Treatments Trials Francis Char DeCroos, MD, 1,2 Cynthia A. Toth, MD, 2 Sandra S. Stinnett, DrPH, 2 Cynthia S. Heydary, BA, 2 Russell Burns, AAS, 2 Glenn J. Jaffe, MD, 1 for the CATT Research Group Objective: To report reading center reproducibility during grading of Stratus optical coherence tomography (OCT) (Carl Zeiss Meditec, Dublin, CA) images obtained during the Comparison of Age-Related Macular Degeneration Treatments Trials (CATT). Design: Prospective, clinical trial. Participants: Independent reading teams reevaluated 270 OCT scans randomly sampled from the first 2 years of CATT enrollment. To assess temporal drift, a cohort of 23 scans submitted during the initial portion of the CATT study was longitudinally followed with serial reproducibility analysis. Intervention: The CATT readers performed standardized grading of OCT images. A reader team, composed of 2 independent readers and a senior reader, evaluated each scan. Grading included the CATT OCT end points of total thickness at the foveal center point and intraretinal fluid (IRF), subretinal fluid (SRF), and subretinal pigment epithelium (RPE) fluid. Independent reading teams masked to the results of initial grading reevaluated scans to determine the reproducibility of qualitative grading and measurements. Main Outcome Measures: Categorical grading agreement was reported using percent agreement and kappa statistic, and measurement agreement was reported using intraclass correlations and paired differences. Results: Reading center teams reproducibly graded IRF (percent agreement 73%, kappa 0.48; 95% confidence interval [CI], 0.38 – 0.58), SRF (percent agreement 90%; kappa 0.80; 95% CI, 0.73– 0.87), and sub-RPE fluid (percent agreement 88%; kappa 0.75; 95% CI, 0.67– 0.83). For independent reading center team measurements of total thickness at the foveal center point, the intraclass correlation was 0.99 (95% CI, 0.99 – 0.99), and the mean paired difference between reading center teams was 4 m (95% limits of agreement, 55 to 47 m). There was no qualitative or quantitative grading drift. Conclusions: The standardized protocols used to evaluate OCT scans from the CATT study were repro- ducible. The methods used are suitable to monitor OCT imaging data from a large, neovascular age-related macular degeneration, interventional, multicenter study. Financial Disclosure(s): The author(s) have no proprietary or commercial interest in any materials discussed in this article. Ophthalmology 2012;119:2549 –2557 © 2012 by the American Academy of Ophthalmology. The Comparison of Age-Related Macular Degeneration Treatments Trials (CATT) is a prospective, randomized, multicenter, clinical trial that compares the relative safety and efficacy of intravitreal bevacizumab with intravitreal ranibizumab as interventions for neovascular age-related macular degeneration (NVAMD). 1 This trial also examines the relative efficacy of different dosing schedules of each agent. Various imaging modalities, including optical coher- ence tomography (OCT) (Carl Zeiss Meditec, Dublin, CA), were used to monitor CATT study patient response to therapy. Optical coherence tomography provides a noninvasive way to obtain cross-sectional images of the retina. Anatomic changes associated with NVAMD, such as intraretinal fluid (IRF), subretinal fluid (SRF), hyperreflective material under the retina, and pigment epithelial detachment (PED), can be readily visualized on OCT. 2–4 These pathologic changes 5 and the efficacy of various treatments 6–9 can be followed longitudinally on OCT. Furthermore, OCT-facilitated deter- mination of the presence or absence of macular fluid asso- ciated with choroidal neovascularization (CNV) also has been used to rationally direct intravitreal pharmacologic therapy. 10 –13 In the CATT, macular fluid, defined as 1 or more of the following: IRF, SRF, or subretinal pigment epithelium (RPE) fluid, was an eligibility prerequisite, re-treatment criteria, and secondary study end point. Accordingly, it is important to accurately and reproducibly identify macular 2549 © 2012 by the American Academy of Ophthalmology ISSN 0161-6420/12/$–see front matter Published by Elsevier Inc. http://dx.doi.org/10.1016/j.ophtha.2012.06.040
Transcript of Optical Coherence Tomography Grading Reproducibility ... · Optical Coherence Tomography Grading...
Optical Coherence Tomography GradingReproducibility during the Comparison ofAge-related Macular DegenerationTreatments Trials
Francis Char DeCroos, MD,1,2 Cynthia A. Toth, MD,2 Sandra S. Stinnett, DrPH,2 Cynthia S. Heydary, BA,2
Russell Burns, AAS,2 Glenn J. Jaffe, MD,1 for the CATT Research Group
Objective: To report reading center reproducibility during grading of Stratus optical coherence tomography(OCT) (Carl Zeiss Meditec, Dublin, CA) images obtained during the Comparison of Age-Related MacularDegeneration Treatments Trials (CATT).
Design: Prospective, clinical trial.Participants: Independent reading teams reevaluated 270 OCT scans randomly sampled from the first 2
years of CATT enrollment. To assess temporal drift, a cohort of 23 scans submitted during the initial portion ofthe CATT study was longitudinally followed with serial reproducibility analysis.
Intervention: The CATT readers performed standardized grading of OCT images. A reader team, composedof 2 independent readers and a senior reader, evaluated each scan. Grading included the CATT OCT end pointsof total thickness at the foveal center point and intraretinal fluid (IRF), subretinal fluid (SRF), and subretinalpigment epithelium (RPE) fluid. Independent reading teams masked to the results of initial grading reevaluatedscans to determine the reproducibility of qualitative grading and measurements.
Main Outcome Measures: Categorical grading agreement was reported using percent agreement andkappa statistic, and measurement agreement was reported using intraclass correlations and paired differences.
Results: Reading center teams reproducibly graded IRF (percent agreement � 73%, kappa � 0.48; 95%confidence interval [CI], 0.38–0.58), SRF (percent agreement � 90%; kappa � 0.80; 95% CI, 0.73–0.87), andsub-RPE fluid (percent agreement 88%; kappa � 0.75; 95% CI, 0.67–0.83). For independent reading center teammeasurements of total thickness at the foveal center point, the intraclass correlation was 0.99 (95% CI,0.99–0.99), and the mean paired difference between reading center teams was 4 �m (95% limits of agreement,�55 to 47 �m). There was no qualitative or quantitative grading drift.
Conclusions: The standardized protocols used to evaluate OCT scans from the CATT study were repro-ducible. The methods used are suitable to monitor OCT imaging data from a large, neovascular age-relatedmacular degeneration, interventional, multicenter study.
Financial Disclosure(s): The author(s) have no proprietary or commercial interest in any materials discussed inthis article. Ophthalmology 2012;119:2549–2557 © 2012 by the American Academy of Ophthalmology.
(tralmcbt
f(c
The Comparison of Age-Related Macular DegenerationTreatments Trials (CATT) is a prospective, randomized,multicenter, clinical trial that compares the relative safetyand efficacy of intravitreal bevacizumab with intravitrealranibizumab as interventions for neovascular age-relatedmacular degeneration (NVAMD).1 This trial also examinesthe relative efficacy of different dosing schedules of eachagent. Various imaging modalities, including optical coher-ence tomography (OCT) (Carl Zeiss Meditec, Dublin, CA),were used to monitor CATT study patient response totherapy.
Optical coherence tomography provides a noninvasiveway to obtain cross-sectional images of the retina. Anatomic
changes associated with NVAMD, such as intraretinal fluid i© 2012 by the American Academy of OphthalmologyPublished by Elsevier Inc.
IRF), subretinal fluid (SRF), hyperreflective material underhe retina, and pigment epithelial detachment (PED), can beeadily visualized on OCT.2–4 These pathologic changes5
nd the efficacy of various treatments6–9 can be followedongitudinally on OCT. Furthermore, OCT-facilitated deter-ination of the presence or absence of macular fluid asso-
iated with choroidal neovascularization (CNV) also haseen used to rationally direct intravitreal pharmacologicherapy.10–13
In the CATT, macular fluid, defined as 1 or more of theollowing: IRF, SRF, or subretinal pigment epitheliumRPE) fluid, was an eligibility prerequisite, re-treatmentriteria, and secondary study end point. Accordingly, it is
mportant to accurately and reproducibly identify macular2549ISSN 0161-6420/12/$–see front matterhttp://dx.doi.org/10.1016/j.ophtha.2012.06.040
O
Eifmflaa3rm
gtorm
otgdRpgmOcat
ymincsasfRspl
arnSdrto
PuvtaaCmnu
Ophthalmology Volume 119, Number 12, December 2012
fluid to ensure appropriate study enrollment and treatmentand to correctly interpret study results.
To evaluate CATT OCT images, we adopted a novelteam-based grading approach: a pool of CATT readers waschosen, and 2 readers selected from this pool independentlygraded each scan. Any discrepancies between the 2 readerswere arbitrated by a senior reader. We report the reproduc-ibility of the CATT OCT grading protocol and whether thegrading changed over time.
Materials and Methods
Approval for this study was obtained from the Duke InstitutionalReview Board. All experimental procedures adhered to the tenetsof the Declaration of Helsinki, and all participants engaged in aninformed consent process and signed a written consent documentbefore enrollment in the CATT (ClinicalTrials.gov Identifier:NCT00593450). For the CATT, the qualitative OCT end point wasthe presence of macular fluid, and the quantitative end point wasthickness at the foveal center. A description of OCT acquisitionprocedures, site technician and reader certification, and gradingmethodology can be found in Chapter 18 of the CATT Manual ofProcedures (available at: http://www.med.upenn.edu/cpob/studies/CATT.shtml; accessed May 26, 2012).
Reader Certification
Certified readers reviewed all scans. To become certified, readerswere required to review an OCT grading manual, complete atraining curriculum, pass an OCT reader knowledge assessmenttest, and be closely supervised by a senior reader until grading wasdetermined to be accurate. When the CATT was initiated, a pool of2 senior readers (readers who have fulfilled all of the trainingrequirements of a reader and have completed additional prespeci-fied advanced training activities) and 3 readers were designated asCATT readers. As the study scan volume increased, these numberswere expanded to include a pool of 4 senior readers and 8 readers.At any 1 time, 3 to 8 readers and senior readers concurrentlyanalyzed study scans.
Optical Coherence Tomography Scan Acquisition
All study scans were acquired by CATT-certified OCT techniciansusing Stratus OCT machines (Carl Zeiss Meditec, Dublin, CA). Tobecome CATT certified, a technician successfully completed aknowledge assessment test and received image acquisition trainingthat emphasized appropriate focus, scan saturation, line length, andline placement. The technician submitted 16 certification scans toreading center imaging specialists who evaluated the scans to verifythat the scans were of high quality and were obtained according to thestudy scan protocol. Certification was awarded once the technicianhad successfully completed these requirements. An automated e-mailfeedback system reported scan quality, placement, and individuallyidentified scans of concern to OCT technicians for all scans submittedto the reading center during the CATT.
Before submission of OCT scans to the reading center, allpatient-identifying data were removed in compliance with HealthInsurance Portability and Accountability Act guidelines. All eyeswere imaged with both the fast macular thickness map (FMTM)and the macular thickness map (MTM) scan protocols. Less than1% of scans submitted to the reading center did not adhere to this
submission protocol. v2550
ptical Coherence Tomography Scan Grading
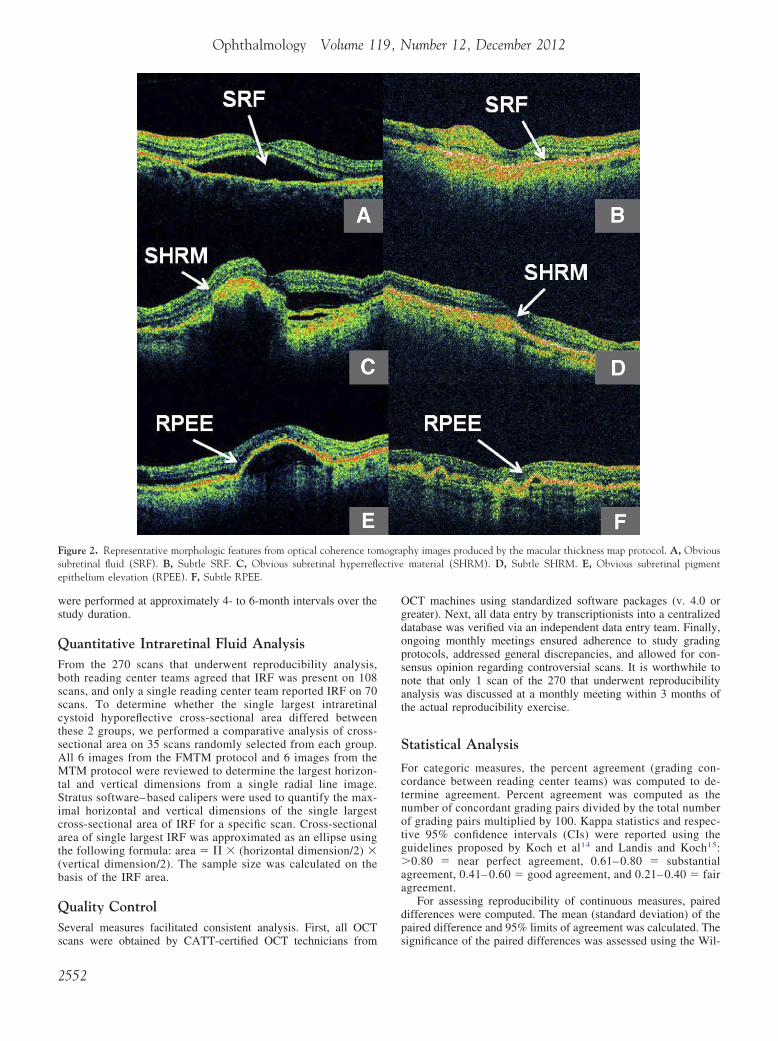
ach of 12 (6 from the FMTM and 6 from the MTM) radial linemages was assessed during grading. All OCT scans were analyzedor the presence of the following parameters: vitreomacular attach-ent, epiretinal membrane (ERM), IRF, SRF, subretinal hyperre-ective material (SHRM), and RPE elevation (RPEE) (Figs 1A–Fnd 2A–F). Vitreomacular attachment was defined as vitreousttachment and focal separation from the inner retina within a-mm diameter centered at the middle of the fovea. Standardizedeference images were compiled to illustrate examples of eachorphologic feature and were made available to all CATT readers.
For each morphologic feature evaluated, 1 of the followingrades was assigned: feature present, feature absent, not interpre-able (because of incorrect scan placement or poor scan saturation),r absent scan. The OCT morphologic features graded as presentanged from subtle to obvious. Examples of obvious and subtleorphologic findings are shown in Figure 1A–F and Figure 2A–F.
If a particular OCT morphologic feature was graded as presentn a scan, a reader was always required to further subcategorizehe feature. For example, if ERM or vitreomacular attachment wasraded present, a reader recorded the presence of any associatedeformation of the central 1 mm of the retina (Fig 3A and B). IfPEE was present, a reader recorded whether sub-RPE fluid wasresent. If macular fluid (�1 of IRF, SRF, or sub-RPE fluid) wasraded as present, a reader determined whether that specific type ofacular fluid was present anywhere within the central 1 mm of theCT scan and whether any macular fluid was present at the foveal
enter point (Fig 3C–H). Finally, if SHRM was graded as present,reader determined whether SHRM was present anywhere within
he central 1 mm of the retina (Fig 3I).After morphologic grading was completed, morphometric anal-
sis was performed on each scan. Quantitative values for morpho-etric variables were preferentially recorded from the 6 radial line
mages produced by the MTM protocol, although if these were ofot acceptable quality, individual images from the FMTM protocolould be substituted. The largest horizontal and vertical dimen-ions for RPEE were measured from each of the 6 radial line scans,nd the maximum value on a single radial scan for both dimen-ions was reported. We defined RPEE height (vertical dimension)rom Bruch’s membrane to the basal RPE surface of the RPE andPEE width (horizontal dimension) from the point where the RPE
tarted to separate from the choroid and become elevated to theoint where the RPE was flat against Bruch’s membrane and noonger elevated.
For each radial line scan evaluated, thickness (vertical dimension)t the foveal center point was reported for each of the following:etina, SRF, and CNV-PED complex. The CNV-PED complex thick-ess was defined as the sum of RPE thickness, RPEE thickness, andHRM thickness because individual borders of these features wereifficult to consistently delineate with accuracy (Fig 4). The sum ofetinal thickness, SRF thickness, and CNV-PED complex thickness athe foveal center point defined the CATT quantitative OCT end pointf total thickness at the foveal center point.
Vertical dimension measurements of retinal, SRF, and CNV-ED complex thickness were performed on all 6 radial line scansntil April 2009. From April 2009 onward, measurements ofertical dimension of the retina, SRF, and CNV-PED complexhickness were performed on all 6 radial line scans for study visitst weeks 0, 4, 8, 12, 24, and 52. The mean thickness measurementsveraged from scans 1 and 4 were determined by the CATToordinating Center to be approximately equal to mean thicknesseasurements derived from the average of 6 radial line scans (data
ot shown). Thus, to increase grading efficiency and minimizennecessary measurements for the remaining year 1 CATT study
isits submitted after April 2009, vertical dimensions were mea-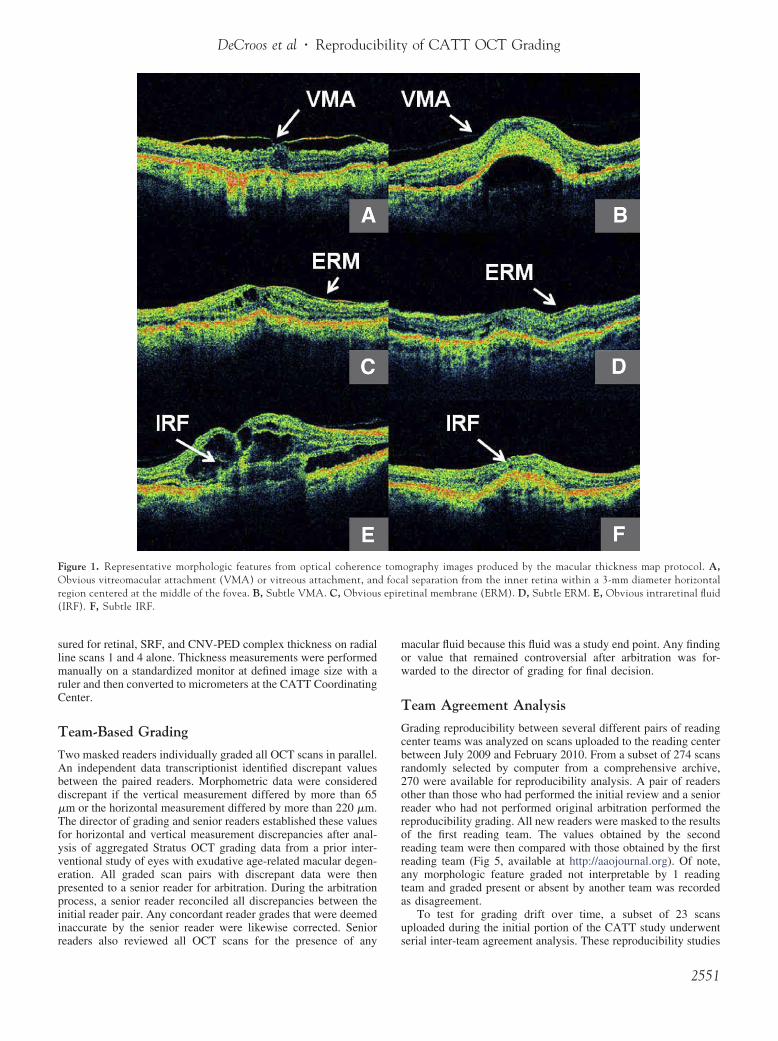
mow
T
Gcbr2orrorrata
u
DeCroos et al � Reproducibility of CATT OCT Grading
sured for retinal, SRF, and CNV-PED complex thickness on radialline scans 1 and 4 alone. Thickness measurements were performedmanually on a standardized monitor at defined image size with aruler and then converted to micrometers at the CATT CoordinatingCenter.
Team-Based Grading
Two masked readers individually graded all OCT scans in parallel.An independent data transcriptionist identified discrepant valuesbetween the paired readers. Morphometric data were considereddiscrepant if the vertical measurement differed by more than 65�m or the horizontal measurement differed by more than 220 �m.The director of grading and senior readers established these valuesfor horizontal and vertical measurement discrepancies after anal-ysis of aggregated Stratus OCT grading data from a prior inter-ventional study of eyes with exudative age-related macular degen-eration. All graded scan pairs with discrepant data were thenpresented to a senior reader for arbitration. During the arbitrationprocess, a senior reader reconciled all discrepancies between theinitial reader pair. Any concordant reader grades that were deemedinaccurate by the senior reader were likewise corrected. Senior
Figure 1. Representative morphologic features from optical coherenceObvious vitreomacular attachment (VMA) or vitreous attachment, anregion centered at the middle of the fovea. B, Subtle VMA. C, Obvious(IRF). F, Subtle IRF.
readers also reviewed all OCT scans for the presence of any s
acular fluid because this fluid was a study end point. Any findingr value that remained controversial after arbitration was for-arded to the director of grading for final decision.
eam Agreement Analysis
rading reproducibility between several different pairs of readingenter teams was analyzed on scans uploaded to the reading centeretween July 2009 and February 2010. From a subset of 274 scansandomly selected by computer from a comprehensive archive,70 were available for reproducibility analysis. A pair of readersther than those who had performed the initial review and a senioreader who had not performed original arbitration performed theeproducibility grading. All new readers were masked to the resultsf the first reading team. The values obtained by the secondeading team were then compared with those obtained by the firsteading team (Fig 5, available at http://aaojournal.org). Of note,ny morphologic feature graded not interpretable by 1 readingeam and graded present or absent by another team was recordeds disagreement.
To test for grading drift over time, a subset of 23 scansploaded during the initial portion of the CATT study underwent
ography images produced by the macular thickness map protocol. A,l separation from the inner retina within a 3-mm diameter horizontaltinal membrane (ERM). D, Subtle ERM. E, Obvious intraretinal fluid
tomd foca
epire
erial inter-team agreement analysis. These reproducibility studies
2551
Ogdopsnat
S
Fctnotg�aa
dp
Ophthalmology Volume 119, Number 12, December 2012
were performed at approximately 4- to 6-month intervals over thestudy duration.
Quantitative Intraretinal Fluid AnalysisFrom the 270 scans that underwent reproducibility analysis,both reading center teams agreed that IRF was present on 108scans, and only a single reading center team reported IRF on 70scans. To determine whether the single largest intraretinalcystoid hyporeflective cross-sectional area differed betweenthese 2 groups, we performed a comparative analysis of cross-sectional area on 35 scans randomly selected from each group.All 6 images from the FMTM protocol and 6 images from theMTM protocol were reviewed to determine the largest horizon-tal and vertical dimensions from a single radial line image.Stratus software– based calipers were used to quantify the max-imal horizontal and vertical dimensions of the single largestcross-sectional area of IRF for a specific scan. Cross-sectionalarea of single largest IRF was approximated as an ellipse usingthe following formula: area � � � (horizontal dimension/2) �(vertical dimension/2). The sample size was calculated on thebasis of the IRF area.
Quality ControlSeveral measures facilitated consistent analysis. First, all OCT
Figure 2. Representative morphologic features from optical coherence tomsubretinal fluid (SRF). B, Subtle SRF. C, Obvious subretinal hyperreflepithelium elevation (RPEE). F, Subtle RPEE.
scans were obtained by CATT-certified OCT technicians from s
2552
CT machines using standardized software packages (v. 4.0 orreater). Next, all data entry by transcriptionists into a centralizedatabase was verified via an independent data entry team. Finally,ngoing monthly meetings ensured adherence to study gradingrotocols, addressed general discrepancies, and allowed for con-ensus opinion regarding controversial scans. It is worthwhile toote that only 1 scan of the 270 that underwent reproducibilitynalysis was discussed at a monthly meeting within 3 months ofhe actual reproducibility exercise.
tatistical Analysis
or categoric measures, the percent agreement (grading con-ordance between reading center teams) was computed to de-ermine agreement. Percent agreement was computed as theumber of concordant grading pairs divided by the total numberf grading pairs multiplied by 100. Kappa statistics and respec-ive 95% confidence intervals (CIs) were reported using theuidelines proposed by Koch et al14 and Landis and Koch15:0.80 � near perfect agreement, 0.61– 0.80 � substantial
greement, 0.41– 0.60 � good agreement, and 0.21– 0.40 � fairgreement.
For assessing reproducibility of continuous measures, pairedifferences were computed. The mean (standard deviation) of theaired difference and 95% limits of agreement was calculated. The
phy images produced by the macular thickness map protocol. A, Obviousmaterial (SHRM). D, Subtle SHRM. E, Obvious subretinal pigment
ograective
ignificance of the paired differences was assessed using the Wil-

FtMa(t
DeCroos et al � Reproducibility of CATT OCT Grading
coxon signed-rank test of median difference equal to zero, andintraclass correlations were used to summarize the agreement ofcontinuous measures.
A Wilcoxon rank-sum test of difference in medians was used tocompare the difference in IRF area for eyes with concordant IRFgrades with those with discordant grades. All analyses were per-formed with SAS 9.2 software (SAS Inc., Cary, NC).
Figure 3. Examples of grading subcategories for morphologic features notemap protocol. A, Epiretinal membrane (ERM) present (white arrow) withVitreomacular attachment present (white arrow) with any deformation ofarrow) within central 1 mm of the retina. D, IRF present (white arrow) a1 mm of the retina. F, SRF present (white arrow) at the foveal center powithin central 1 mm of the retina. H, Sub-RPE fluid present (white arrow(white arrow) within central 1 mm of the retina.
Figure 4. Representative scan demonstrating choroidal neovascularization(CNV)–pigment epithelial detachment (PED) thickness measurement at thefoveal center point. The measurement was performed from the outer boundary
aof Bruch’s membrane to the inner boundary of the CNV.
igure 6. Comparison of the single largest intraretinal cystoid hyporeflec-ive cross-sectional area from optical coherence tomography scans. A,
edian single largest intraretinal cystoid hyporeflective cross-sectionalrea (white arrow) where only 1 reading team reported intraretinal fluidIRF) as present. B, Median single largest intraretinal cystoid hyporeflec-ive cross-sectional area (white arrow) for scans where both reading teams
d on optical coherence tomography images produced by the macular thicknessany deformation of the central 1 mm (horizontal dimension) of the retina. B,the central 1 mm of the retina. C, Any intraretinal fluid (IRF) present (whitet the foveal center point. E, Any subretinal fluid (SRF) present within centralint. G, Any subretinal pigment epithelium (RPE) fluid present (white arrow)) at the foveal center point. I, Any subretinal hyperreflective material present
greed on the presence of IRF.
2553
matsmtdtat
D
IiqrCwwrrda
1isf8Stwtitds
amcoriaip
tSgcibwwma
Ophthalmology Volume 119, Number 12, December 2012
Results
Reading Center Team AgreementTable 1 (available at http://aaojournal.org) summarizes the gradingagreement between reading center teams for evaluation of all OCTmorphologic features in 270 OCT scans. Percent agreement be-tween grading teams for macular fluid was 84%. Percent agree-ment for IRF, SRF, and sub-RPE fluid was 73%, 90%, and 88%,respectively. Independent reading center teams demonstrated goodor better levels of agreement, based on kappa statistics, for gradingof morphologic features. For IRF, SRF, and sub-RPE fluid, kappastatistics were 0.48, 0.80, and 0.75, respectively. The kappa sta-tistic for macular fluid was 0.55.
Table 2 (available at http://aaojournal.org) details the agree-ment between reading center teams for all OCT quantitative mea-surements. For mean total thickness at the foveal center point, theintraclass correlation between reading center teams was 0.99 (95%CI, 0.99–0.99). For mean retinal thickness at the foveal centerpoint, mean SRF thickness at the foveal center point, and meanCNV-PED complex (RPE � RPEE � SHRM) thickness at thefoveal center point, the intraclass correlations between readingcenter teams were 0.93, 0.90, and 0.98, respectively. For totalthickness at the foveal center point, the mean paired differencebetween reading center teams was �4 �m (95% limits of agree-ment, �55 to 47 �m). For mean retinal, SRF, and CNV-PEDcomplex (RPE � RPEE � SHRM) thickness at the foveal centerpoint, paired differences (95% limits of agreement in micrometers)between reading center teams were �3 �m (�62 to 56 �m), 0.6�m (�27 to 28 �m), and �2 �m (�61 to 57 �m), respectively.The mean paired differences between reading center teams for allOCT measurements are shown in Table 2 (available at http://aaojournal.org).
Analysis of Temporal Drift GradingSerial grading of a cohort of scans demonstrated comparable levelsof inter-team agreement over time (Table 3, available at http://aaojournal.org). For macular fluid, percent agreement ranged from78% to 83%. For IRF, SRF, and sub-RPE fluid, percent agreementwas 57% to 70%, 83% to 100%, and 78% to 91%, and respectively.
For mean total thickness at the foveal center point, intraclasscorrelations between reading center teams over time were 0.97 atall 3 time points. For mean retinal thickness at the foveal centerpoint, mean SRF thickness at the foveal center point, and meanCNV-PED complex (RPE � RPEE � SHRM) thickness, theintraclass correlations between reading center teams over timeranged between 0.95 and 0.97, 0.98 and 1.00, and 0.97 and 0.98,respectively. The agreement for each morphometric feature under-going longitudinal analysis is shown in Table 4 (available athttp://aaojournal.org). For mean total thickness at the foveal centerpoint, the mean paired differences between reading center teamsover time ranged between �10 and �3 �m. For mean retinalthickness at the foveal center point, mean SRF thickness at the fovealcenter point, and mean CNV-PED complex (RPE � RPEE �SHRM) thickness at the foveal center point, the mean paireddifferences between reading center teams over time ranged be-tween �1 and �0.2 �m, 0 and 0 �m, and �9 and �1 �m,respectively. The mean paired measurement differences for allOCT measurements undergoing longitudinal analysis are shown inTable 4 (available at http://aaojournal.org).
Quantitative Intraretinal Fluid AnalysisThe median single largest intraretinal cystoid hyporeflective cross-
sectional area (median, 11.7�10�3 mm2; range, 1.9–135.0�10�3 e2554
m2) on 35 randomly sampled scans where reading center teamsgreed on IRF presence was larger (P � 0.001) when compared withhe median single largest intraretinal cystoid hyporeflective cross-ectional area (median, 5.5�10�3 mm2; range, 1.3 – 570.8�10�3
m2) on 35 randomly sampled scans where only 1 reading centeream graded IRF as present. Figure 6 shows representative imagesepicting the median single largest intraretinal cystoid hyporeflec-ive cross-sectional area for scans where both reading center teamgreed on the presence of IRF and where only 1 reading centeream reported fluid.
iscussion
n this study, we have shown that well-trained reader teamsn a reading center setting can reproducibly grade OCTualitative and quantitative features in a large multicenter,andomized, interventional NVAMD treatment trial. Of theATT OCT end point macular fluid variables, agreementas best for subretinal and sub-RPE fluid. Reproducibilityas generally excellent for quantitative parameters. The
eproducible results that we obtained resulted from rigorouseader certification requirements, collectively understoodefinitions of morphologic characteristics, and consistentlypplied quantitative measurement protocols.
We previously showed that OCT images generated from32 eyes in an interventional NVAMD trial were reproduc-bly interpreted in a reading center setting.16 In the presenttudy, we observed 73% and 90% team grading agreementor IRF and SRF, respectively, comparable to the 84% to5% and 90% to 91% inter-reader agreement for IRF andRF, respectively, that we reported previously.16 For total
hickness measurement at the foveal center in the currentork, we noted a median paired difference of 0 �m between
eams, which was less than the 21 to 64 �m range ofnter-reader median measurement differences reported inhe previous study. These modest disparities may be due toifferences in the trial enrollment criteria, OCT scan acqui-ition protocol, and grading methodology.
Our reading center has established a team-based gradingpproach that includes arbitration by a senior reader toaximize grading consistency during the study. This pro-
ess also allows a senior reader to review a higher volumef scans and to establish a closed feedback loop with newereaders to enhance grading consistency. Prior series detail-ng OCT grading protocols have used individual readers17,18
nd paired readers in parallel,16,19 whereas other large clin-cal trials using OCT grading by a reading center have notublished detailed grading protocols.20–22
The “double grading” protocol for baseline fundus pho-ographs used in the Early Treatment Diabetic Retinopathytudy (ETDRS) most resembles our team-based OCT scanrading protocol. During the ETDRS study, only baselineolor fundus photographs underwent review by a pair ofndependent readers. One step of disagreement (of 3 possi-le steps in the ETDRS fundus photograph grading scale)as averaged together, and 2 steps or more of disagreementere returned to the initial graders for repeat evaluation. Aasked ETDRS senior grader resolved any persistent dis-
greements. For subsequent study visits, a single reader alone
valuated follow-up fundus photographs, and grading was
at
mcm0sfwmsBsttevo
sttfr
S
TfiroogPgprSCgtAasbrFuimslstiFt
DeCroos et al � Reproducibility of CATT OCT Grading
monitored using “haphazardly selected reading lists” of 10eyes each.23 Our image grading protocol differed in that anindependent grading team evaluated both baseline and fol-low-up images, senior readers arbitrated all grading inconsis-tencies, and reproducibility studies were systematically per-formed on reading center teams. Although the ETDRS “doublegrading” has similarities to our team-based grading protocol,our evaluation methods more stringently address grading dis-crepancies and reproducibility.
Reading center grading was reproducible for morpho-logic features. Agreement was highest for SRF and less forIRF and ERM. Cystoid hyporeflective areas within theretina on OCT represent IRF from NVAMD.24,25 However,a variety of factors may compromise IRF identification.There may be increased hyporeflective pixels within theretina, which in hyporeflective layers of the retina may havethe appearance of small cystoid changes when none areactually present on scans with low signal intensity due tomedia opacity, low signal strength, or other factors. Wehave termed this finding a pixel void. Even the normalfoveal center often appears slightly hyporeflective on OCTand can mimic subtle IRF, especially when coupled withdecreased scan signal intensity. Finally, underlying activechoroidal neovascular membranes may result in SRF at theCNV–retinal interface, making it difficult to discriminateIRF from SRF.
We found that the single largest cystoid hyporeflectivearea was smaller when only 1 reading center team reportedfluid. It is not surprising that smaller true cystoid spaces aremore challenging to grade consistently. These smaller areasof fluid are more difficult to differentiate from pixel voidsthan those with a larger cross-sectional area.
Epiretinal membranes can be difficult to visualize onStratus OCT, especially when tractional changes are notvisualized at the inner retina. In addition, a jagged, discon-tinuous inner retinal boundary that mimics an ERM can beseen when OCT image saturation is decreased. Hallmarks ofERM, such as focal points of attachment, optical reflectivitydifference, and visible tufts or edges,26 may not be visibleon Stratus OCT during grading. One group reported a 30%increase in ERM detection rate when using ultrahigh reso-lution spectral domain (SD) OCT compared with StratusOCT.27
Reading center teams demonstrated high levels of quan-titative grading agreement. For all thickness measurementsat the foveal center point, we observed relatively smallmean paired thickness measurement differences less than 5�m and high intraclass correlations between 0.90 and 0.99.For the trial end point, total thickness at the foveal centerpoint, the mean (� standard deviation) of the paired differ-ence was 3.9�25.7 �m (P � 0.025). Although this differ-ence was statistically significant, a reading team measure-ment difference of less than 4 �m is likely not clinicallysignificant. These minimal differences and high levels ofmeasurement agreement are especially notable in light ofBruch’s membrane obscuration by overlying CNV or dis-ruption of the RPE layer by CNV. These pathologic changescommon to NVAMD can make accurate segmentation ofthe outer retina more difficult. To minimize these segmen-
tation difficulties, our protocol aggregated RPE thickness, mny RPEE, and SHRM thickness as a single measurementermed CNV-PED complex thickness.
Reading center teams also demonstrated excellent agree-ent when measuring maximal RPEE height (intraclass
orrelation � 0.97) and lower agreement when gradingaximal RPE elevation width (intraclass correlation �
.81). The heterogeneous changes induced by CNV in theubretinal space as visualized on OCT may partly accountor the reduced reproducibility in grading RPE elevationidth. For example, within an area of RPE elevation, CNV-ediated RPE fragmentation can make it difficult to con-
istently identify the exact separation point of the RPE fromruch’s membrane. In addition, overlying SHRM can
ometimes obscure the borders of underlying RPE eleva-ion. Finally, in scans with multiple adjacent RPE eleva-ions, it can be challenging to confirm whether a single RPElevation is discrete or contiguous with adjacent RPE ele-ations because of difficulty visualizing each potential pointf RPE attachment to Bruch’s membrane.
We evaluated reader agreement over time in a cohort ofubjects followed from the initiation of CATT to monitoremporal grading drift. No obvious temporal drift was iden-ified. We hypothesize that ongoing reader training andeedback during the study helped to minimize variations ineader grading over time.
tudy Limitations
here are limitations to this study. The data were derivedrom a single reading center. Accordingly, reader reproduc-bility reported may not be readily generalized to othereading centers. Nonetheless, we believe that readers inther settings could adopt our team-based approach, withngoing reader training and feedback and standardizedrading protocols to produce reproducible grading data.rior work demonstrated generally high levels of OCTrading agreement between independently trained readerairs at 2 different reading centers.19 Next, a senior readereviewed all scans analyzed by primary readers for IRF,RF, and sub-RPE fluid, key morphologic variables in theATT. However, for other morphologic variables, if therade assigned by the 2 primary readers was not discrepant,he senior reader did not necessarily review the scans.ccordingly, it is conceivable that if a variable was ascribed
n identical inaccurate value by both primary readers, theenior reader might not correct the inaccuracy. However, weelieve that these instances are likely rare and, for severaleasons, would have minimal impact on the study results.irst, a reader was not consistently matched with a partic-lar second reader. Although 2 individuals may make sim-lar grading errors, the likelihood of several readers allaking an identical error for the same grading variable is
mall. Next, independent reading center teams showed highevels of agreement with one another. By discounting wide-pread and systematic biases across the entire reading cen-er, the chances of 4 to 6 independent readers obtainingdentical erroneous values for a particular finding is low.inally, senior readers corrected erroneous values consis-
ently reported by a reader pair if these values were deter-
ined to be inaccurate during arbitration. These scans were2555
1
1
1
1
1
1
1
1
1
1
2
2
2
Ophthalmology Volume 119, Number 12, December 2012
then returned to the reader pair for mandatory review tomaintain grading consistency across readers.
During categoric grading analysis of all OCT morpho-logic features, we reported both percent agreement andkappa statistic in consideration of the innate limitations ofthis second analysis method. In particular, case distributioncould result in high percent agreement but low values forkappa statistic. In the event that cases are common or rare,the kappa statistic can differ widely from percent agree-ment.28,29 This phenomenon was apparent in this study forless commonly observed morphologic features, such as vit-reomacular adhesion (94% agreement; kappa � 0.74) andERM (95% agreement; kappa 0.53). The disparity betweenpercent agreement and kappa statistic was more pronouncedfor the even less frequently observed grading variablesvitreomacular adhesion with foveal deformation (82%agreement; kappa � 0.49) and ERM with foveal deforma-tion (90% agreement; kappa � 0.46).
Future investigations will capitalize on the numerousadvantages offered by SD-OCT technology. Compared withconventional time domain OCT, such as Stratus OCT usedfor this study, SD-OCT offers increased image resolution,improved registration, and faster data acquisition, resultingin decreased motion artifact.30,31 These advantages mayresult in increased detection of important retinal features,such as IRF, SRF, and sub-RPE fluid.32,33 If so, readerreproducibility may have been even higher than that re-ported in this study. An SD-OCT substudy has been initi-ated in CATT, and definitive answers to questions regardingreader reproducibility with SD-OCT when compared withtime domain OCT will be forthcoming when the substudyhas been completed.
In conclusion, because clinical studies for retinal dis-eases increasingly incorporate OCT to better understandtreatment effect, reproducible analysis of imaging data iscrucial to understand the efficacy of an intervention and toconsistently evaluate an individual’s response to therapy.This study demonstrates that reading center teams can re-producibly grade OCT images to facilitate monitoring oftherapeutic effect in a large, prospective, multicenter, inter-ventional treatment trial for NVAMD. A standardized train-ing, grading, and feedback protocol can employ readerswith differing levels of experience and obtain consistentresults while maintaining quality over time.
References
1. Martin DF, Maguire MG, Ying GS, et al. Ranibizumab andbevacizumab for neovascular age-related macular degenera-tion. N Engl J Med 2011;364:1897–908.
2. Hee MR, Baumal CR, Puliafito CA, et al. Optical coherencetomography of age-related macular degeneration and choroi-dal neovascularization. Ophthalmology 1996;103:1260–70.
3. Jaffe GJ, Caprioli J. Optical coherence tomography to detectand manage retinal disease and glaucoma. Am J Ophthalmol2004;137:156–69.
4. Ting TD, Oh M, Cox TA, et al. Decreased visual acuityassociated with cystoid macular edema in neovascular age-related macular degeneration. Arch Ophthalmol 2002;120:
731–7.2556
5. Hee MR, Puliafito CA, Wong C, et al. Quantitative assessmentof macular edema with optical coherence tomography. ArchOphthalmol 1995;113:1019–29.
6. Rogers AH, Martidis A, Greenberg PB, Puliafito CA. Opticalcoherence tomography findings following photodynamic ther-apy of choroidal neovascularization. Am J Ophthalmol 2002;134:566–76.
7. Kaiser PK, Blodi BA, Shapiro H, Acharya NR. Angiographicand optical coherence tomographic results of the MARINAstudy of ranibizumab in neovascular age-related macular de-generation. Ophthalmology 2007;114:1868–75.
8. Avery RL, Pieramici DJ, Rabena MD, et al. Intravitreal bev-acizumab (Avastin) for neovascular age-related macular de-generation. Ophthalmology 2006;113:363–72 e5.
9. Rich RM, Rosenfeld PJ, Puliafito CA, et al. Short-term safetyand efficacy of intravitreal bevacizumab (Avastin) for neovas-cular age-related macular degeneration. Retina 2006;26:495–511.
0. Gupta OP, Shienbaum G, Patel AH, et al. A treat and extendregimen using ranibizumab for neovascular age-related mac-ular degeneration clinical and economic impact. Ophthalmol-ogy 2010;117:2134–40.
1. Dadgostar H, Ventura AA, Chung JY, et al. Evaluation ofinjection frequency and visual acuity outcomes for ranibi-zumab monotherapy in exudative age-related macular degen-eration. Ophthalmology 2009;116:1740–7.
2. Rothenbuehler SP, Waeber D, Brinkmann CK, et al. Effects ofranibizumab in patients with subfoveal choroidal neovascular-ization attributable to age-related macular degeneration. Am JOphthalmol 2009;147:831–7.
3. Fung AE, Lalwani GA, Rosenfeld PJ, et al. An optical coher-ence tomography-guided, variable dosing regimen with intra-vitreal ranibizumab (Lucentis) for neovascular age-relatedmacular degeneration. Am J Ophthalmol 2007;143:566–83.
4. Koch GG, Landis JR, Freeman JL, et al. A general method-ology for the analysis of experiments with repeated measure-ment of categorical data. Biometrics 1977;33:133–58.
5. Landis JR, Koch GG. The measurement of observer agree-ment for categorical data. Biometrics 1977;33:159–74.
6. Zhang N, Hoffmeyer GC, Young ES, et al. Optical coherencetomography reader agreement in neovascular age-related mac-ular degeneration. Am J Ophthalmol 2007;144:37–44.
7. Krebs I, Hagen S, Brannath W, et al. Repeatability and repro-ducibility of retinal thickness measurements by optical coher-ence tomography in age-related macular degeneration. Oph-thalmology 2010;117:1577–84.
8. Domalpally A, Blodi BA, Scott IU, et al. The Standard Carevs Corticosteroid for Retinal Vein Occlusion (SCORE) studysystem for evaluation of optical coherence tomograms:SCORE study report 4. Arch Ophthalmol 2009;127:1461–7.
9. Ritter M, Elledge J, Simader C, et al. Evaluation of opticalcoherence tomography findings in age-related maculardegeneration: a reproducibility study of two independent read-ing centres. Br J Ophthalmol 2011;95:381–5.
0. Glassman AR, Beck RW, Browning DJ, et al. Comparison ofoptical coherence tomography in diabetic macular edema,with and without reading center manual grading from a clin-ical trials perspective. Invest Ophthalmol Vis Sci 2009;50:560–6.
1. Haller JA, Bandello F, Belfort R Jr, et al. Randomized, sham-controlled trial of dexamethasone intravitreal implant in pa-tients with macular edema due to retinal vein occlusion. Oph-thalmology 2010;117:1134–46 e3.
2. Brown DM, Campochiaro PA, Singh RP, et al. Ranibizumab
for macular edema following central retinal vein occlusion:
2
2
3
3
3
3
DeCroos et al � Reproducibility of CATT OCT Grading
six-month primary end point results of a phase III study.Ophthalmology 2010;117:1124–33 e1.
23. Grading diabetic retinopathy from stereoscopic color fundusphotographs—an extension of the modified Airlie House clas-sification. ETDRS report number 10. Early Treatment Dia-betic Retinopathy Study Research Group. Ophthalmology1991;98:786–806.
24. Ahlers C, Michels S, Elsner H, et al. Topographic angiographyand optical coherence tomography: a correlation of imagingcharacteristics. Eur J Ophthalmol 2005;15:774–81.
25. Coscas F, Coscas G, Souied E, et al. Optical coherence to-mography identification of occult choroidal neovasculariza-tion in age-related macular degeneration. Am J Ophthalmol2007;144:592–9.
26. Wilkins JR, Puliafito CA, Hee MR, et al. Characterization ofepiretinal membranes using optical coherence tomography.Ophthalmology 1996;103:2142–51.
27. Falkner-Radler CI, Glittenberg C, Hagen S, et al. Spectral-domain optical coherence tomography for monitoring epireti-
nal membrane surgery. Ophthalmology 2010;117:798–805.Footnotes and Financial Disclosures
discussed in this article.
Fw
P6
CGD
8. Feinstein AR, Cicchetti DV. High agreement but low kappa: I.The problems of two paradoxes. J Clin Epidemiol 1990;43:543–9.
9. Crewson PE. Reader agreement studies. AJR Am J Roent-genol 2005;184:1391–7.
0. Srinivasan VJ, Wojtkowski M, Witkin AJ, et al. High-defini-tion and 3-dimensional imaging of macular pathologies withhigh-speed ultrahigh-resolution optical coherence tomogra-phy. Ophthalmology 2006;113:2054 e1–14.
1. Wojtkowski M, Bajraszewski T, Gorczynska I, et al. Ophthal-mic imaging by spectral optical coherence tomography. Am JOphthalmol 2004;138:412–9.
2. Keane PA, Bhatti RA, Brubaker JW, et al. Comparison ofclinically relevant findings from high-speed Fourier-domainand conventional time-domain optical coherence tomography.Am J Ophthalmol 2009;148:242–8 e1.
3. Sayanagi K, Sharma S, Yamamoto T, Kaiser PK. Comparisonof spectral-domain versus time-domain optical coherence to-mography in management of age-related macular degeneration
with ranibizumab. Ophthalmology 2009;116:947–55.Originally received: March 28, 2012.Final revision: May 26, 2012.Accepted: June 25, 2012.Available online: August 28, 2012. Manuscript no. 2012-447.1 Wills Eye Institute (Mid Atlantic Retina), Philadelphia, Pennsylvania.2 Duke University Eye Center, Durham, North Carolina.
Financial Disclosure(s):The author(s) have no proprietary or commercial interest in any materials
unding: National Institutes of Health 5U10EYO17825. This work alsoas supported in part by the Heed Foundation.
resented at: Association for Research in Vision and Ophthalmology, May–10, 2012, Ft. Lauderdale, Florida.
orrespondence:lenn J. Jaffe, MD, Duke Eye Center, Director of Duke Reading Center,
UMC Box 3802, Durham, NC 27710. E-mail: [email protected].2557