Optical Coherence Tomography Angiography Vessel Density … · Optical Coherence Tomography...
9
Optical Coherence Tomography Angiography Vessel Density in Glaucomatous Eyes with Focal Lamina Cribrosa Defects Min Hee Suh, MD, 1,2 Linda M. Zangwill, PhD, 1 Patricia Isabel C. Manalastas, MD, 1 Akram Belghith, PhD, 1 Adeleh Yarmohammadi, MD, 1 Felipe A. Medeiros, MD, PhD, 1 Alberto Diniz-Filho, MD, PhD, 1 Luke J. Saunders, PhD, 1 Siamak Yousefi, PhD, 1 Robert N. Weinreb, MD 1 Purpose: To investigate whether vessel density assessed by optical coherence tomography angiography (OCT-A) is reduced in glaucomatous eyes with focal lamina cribrosa (LC) defects. Design: Cross-sectional, case-control study. Participants: A total of 82 patients with primary open-angle glaucoma (POAG) from the Diagnostic Innovations in Glaucoma Study (DIGS) with and without focal LC defects (41 eyes of 41 patients in each group) matched by severity of visual field (VF) damage. Methods: Optical coherence tomography (OCT) angiographyederived circumpapillary vessel density (cpVD) was calculated as the percentage area occupied by vessels in the measured region extracted from the retinal nerve fiber layer (RNFL) in a 750-mm-wide elliptical annulus around the disc. Focal LC defects were detected using swept-source OCT images. Main Outcome Measures: Comparison of global and sectoral (eight 45-degree sectors) cpVDs and circumpapillary RNFL (cpRNFL) thicknesses in eyes with and without LC defects. Results: Age, global, and sectoral cpRNFL thicknesses, VF mean deviation (MD) and pattern standard deviation, presence of optic disc hemorrhage, and mean ocular perfusion pressure did not differ between patients with and without LC defects (P > 0.05 for all comparisons). Mean cpVDs of eyes with LC defects were signifi- cantly lower than in eyes without a defect globally (52.9%5.6% vs. 56.8%7.7%; P ¼ 0.013) and in the infe- rotemporal (IT) (49.5%10.3% vs. 56.8%12.2%; P ¼ 0.004), superotemporal (ST) (54.3%8.8% vs. 58.8% 9.6%; P ¼ 0.030), and inferonasal (IN) (52.4%9.0% vs. 57.6%9.1%; P ¼ 0.009) sectors. Eyes with LC defects in the IT sector (n ¼ 33) had significantly lower cpVDs than eyes without a defect in the corresponding IT and IN sectors (P < 0.05 for all). Eyes with LC defects in the ST sector (n ¼ 19) had lower cpVDs in the ST, IT, and IN sectors (P < 0.05 for all). Conclusions: In eyes with similar severity of glaucoma, OCT-A-measured vessel density was significantly lower in POAG eyes with focal LC defects than in eyes without an LC defect. Moreover, reduction of vessel density was spatially correlated with the location of the LC defect. Ophthalmology 2016;-:1e9 ª 2016 by the American Academy of Ophthalmology. Although the pathogenesis of glaucoma is not fully un- derstood, the lamina cribrosa (LC) is a putative site of retinal ganglion cell axonal injury. 1e4 Focal LC defects, areas of localized loss of laminar tissue, recently have been reported to be an important structural feature asso- ciated with glaucomatous visual field (VF) loss. 5e7 Furthermore, there is increasing evidence that focal LC defects may be related to vascular changes of the optic nerve head (ONH), including optic disc hemorrhage, 7e9 as well as other ophthalmoscopic structural changes such as neuroretinal rim loss, acquired pits of the ONH, and retinal nerve fiber layer (RNFL) defects. 10,11 However, little is known about the association between the retinal microvasculature and the presence of focal LC defects, an issue relevant to the pathogenesis of glaucomatous optic neuropathy. 12,13 Optical coherence tomography angiography (OCT-A) is now available to provide qualitative and quantitative infor- mation of the perfused microvasculature of various retinal layers. It has advantages over other techniques, such as fluorescein angiography, laser speckle flowgraphy, and laser Doppler flowmetry by its noninvasiveness and better reproducibility. 14e20 Furthermore, OCT-A-derived quantification of the peripapillary vasculature has been shown to be related to the presence and severity of the glaucoma. 14e16,21 1 Ó 2016 by the American Academy of Ophthalmology Published by Elsevier Inc. http://dx.doi.org/10.1016/j.ophtha.2016.07.023 ISSN 0161-6420/16
Transcript of Optical Coherence Tomography Angiography Vessel Density … · Optical Coherence Tomography...
Optical Coherence TomographyAngiography Vessel Density inGlaucomatous Eyes with Focal LaminaCribrosa Defects
Min Hee Suh, MD,1,2 Linda M. Zangwill, PhD,1 Patricia Isabel C. Manalastas, MD,1 Akram Belghith, PhD,1
Adeleh Yarmohammadi, MD,1 Felipe A. Medeiros, MD, PhD,1 Alberto Diniz-Filho, MD, PhD,1
Luke J. Saunders, PhD,1 Siamak Yousefi, PhD,1 Robert N. Weinreb, MD1
Purpose: To investigate whether vessel density assessed by optical coherence tomography angiography(OCT-A) is reduced in glaucomatous eyes with focal lamina cribrosa (LC) defects.
Design: Cross-sectional, case-control study.Participants: A total of 82 patients with primary open-angle glaucoma (POAG) from the Diagnostic
Innovations in Glaucoma Study (DIGS) with and without focal LC defects (41 eyes of 41 patients in each group)matched by severity of visual field (VF) damage.
Methods: Optical coherence tomography (OCT) angiographyederived circumpapillary vessel density (cpVD)was calculated as the percentage area occupied by vessels in the measured region extracted from the retinalnerve fiber layer (RNFL) in a 750-mm-wide elliptical annulus around the disc. Focal LC defects were detectedusing swept-source OCT images.
Main Outcome Measures: Comparison of global and sectoral (eight 45-degree sectors) cpVDs andcircumpapillary RNFL (cpRNFL) thicknesses in eyes with and without LC defects.
Results: Age, global, and sectoral cpRNFL thicknesses, VF mean deviation (MD) and pattern standarddeviation, presence of optic disc hemorrhage, and mean ocular perfusion pressure did not differ between patientswith and without LC defects (P > 0.05 for all comparisons). Mean cpVDs of eyes with LC defects were signifi-cantly lower than in eyes without a defect globally (52.9%�5.6% vs. 56.8%�7.7%; P ¼ 0.013) and in the infe-rotemporal (IT) (49.5%�10.3% vs. 56.8%�12.2%; P ¼ 0.004), superotemporal (ST) (54.3%�8.8% vs. 58.8%�9.6%; P ¼ 0.030), and inferonasal (IN) (52.4%�9.0% vs. 57.6%�9.1%; P ¼ 0.009) sectors. Eyes with LC defectsin the IT sector (n ¼ 33) had significantly lower cpVDs than eyes without a defect in the corresponding IT and INsectors (P < 0.05 for all). Eyes with LC defects in the ST sector (n ¼ 19) had lower cpVDs in the ST, IT, and INsectors (P < 0.05 for all).
Conclusions: In eyes with similar severity of glaucoma, OCT-A-measured vessel density was significantlylower in POAG eyes with focal LC defects than in eyes without an LC defect. Moreover, reduction of vesseldensity was spatially correlated with the location of the LC defect. Ophthalmology 2016;-:1e9 ª 2016 by theAmerican Academy of Ophthalmology.
Although the pathogenesis of glaucoma is not fully un-derstood, the lamina cribrosa (LC) is a putative site ofretinal ganglion cell axonal injury.1e4 Focal LC defects,areas of localized loss of laminar tissue, recently havebeen reported to be an important structural feature asso-ciated with glaucomatous visual field (VF) loss.5e7
Furthermore, there is increasing evidence that focal LCdefects may be related to vascular changes of the opticnerve head (ONH), including optic disc hemorrhage,7e9 aswell as other ophthalmoscopic structural changes suchas neuroretinal rim loss, acquired pits of the ONH, andretinal nerve fiber layer (RNFL) defects.10,11 However,little is known about the association between the retinal
� 2016 by the American Academy of OphthalmologyPublished by Elsevier Inc.
microvasculature and the presence of focal LC defects, anissue relevant to the pathogenesis of glaucomatous opticneuropathy.12,13
Optical coherence tomography angiography (OCT-A) isnow available to provide qualitative and quantitative infor-mation of the perfused microvasculature of various retinallayers. It has advantages over other techniques, such asfluorescein angiography, laser speckle flowgraphy, andlaser Doppler flowmetry by its noninvasiveness andbetter reproducibility.14e20 Furthermore, OCT-A-derivedquantification of the peripapillary vasculature has beenshown to be related to the presence and severity of theglaucoma.14e16,21
1http://dx.doi.org/10.1016/j.ophtha.2016.07.023ISSN 0161-6420/16

Ophthalmology Volume -, Number -, Month 2016
The purpose of this study was to compare the OCT-A-derived peripapillary RNFL vessel density between glau-comatous eyes with and without a focal LC defect.
Methods
Study Subjects
This was a cross-sectional study involving patients with primaryopen-angle glaucoma (POAG) from the Diagnostic Innovations inGlaucoma Study (DIGS) (ClinicalTrials.gov identifier:NCT00221897). The DIGS is an ongoing prospective, longitudinalstudy at the Hamilton Glaucoma Center, University of California,San Diego, designed to evaluate optic nerve structure and visualfunction in glaucoma. Details of the DIGS protocol have beendescribed.22 All methods adhered to the tenets of the Declaration ofHelsinki and the Health Insurance Portability and AccountabilityAct and were approved by the institutional review boards at theUniversity of California, San Diego. Informed consent wasobtained from all participants.
Patients with established POAG who completed OCT-Aimaging and ONH imaging using both spectral-domain OCT (SDOCT) and swept-source OCT (SS-OCT) were included. Allparticipants underwent an ophthalmological examination,including assessment of best-corrected visual acuity (BCVA), slit-lamp biomicroscopy, intraocular pressure (IOP) measurement withGoldmann applanation tonometry, gonioscopy, central cornealthickness measured with ultrasound pachymetry (DGH Technol-ogy Inc., Exton, PA), dilated fundus examination, simultaneousstereophotography of the optic disc, standard automated perimetry(Humphrey Field Analyzer; 24-2 Swedish interactive thresholdalgorithm; Carl Zeiss Meditec, Dublin, CA), SD OCT, OCT-A, andSS-OCT. Perimetry and all imaging tests were conducted within a6-month period.
To be included, patients were required to have been diagnosedwith POAG, to be aged >18 years, to have BVCA �20/40, and tohave an open angle on gonioscopy. Patients with a history of ocularintervention (except for uncomplicated cataract or glaucomasurgery), intraocular disease (e.g., diabetic retinopathy or non-glaucomatous optic neuropathy), or systemic disease (e.g., strokeor pituitary tumor) that could influence the study results wereexcluded from the study. Those with systemic hypertension anddiabetes mellitus were included unless they were diagnosed withdiabetic or hypertensive retinopathy. Eyes with unreliable VF orpoor quality imaging tests also were excluded.
Primary open-angle glaucoma was defined as the presence ofglaucomatous optic nerve damage (i.e., the presence of focalthinning, notching, or localized or diffuse atrophy of the RNFL)and associated repeatable VF damage. Glaucomatous VF damagewas defined as a glaucoma hemifield test outside normal limits or apattern standard deviation outside 95% normal limits confirmed on2 consecutive, reliable (fixation losses and false-negatives �33%and �15% false-positives) tests.
Systemic measurements included systolic and diastolic bloodpressure and pulse rate measured at the height of the heart with anOmron Automatic blood pressure instrument (model BP791IT;Omron Healthcare, Inc., Lake Forest, IL). Mean arterial pressurewas calculated as 1/3 systolic blood pressure þ 2/3 diastolic bloodpressure. Mean ocular perfusion pressure was defined as the dif-ference between 2/3 of mean arterial pressure and IOP.
Presence of the disc hemorrhage was determined on the basisof stereophotography that had been obtained previously at in-tervals of 12 months. Glaucomatous disc hemorrhage was definedas an isolated splinter or flame-shaped hemorrhage on optic disctissue or crossing the optic disc.23 Two independent graders who
2
were masked to patient information and test results independentlyevaluated each image. Discrepancies between the 2 graders wereresolved by consensus.
Spectral-Domain Optical CoherenceTomography Imaging
All subjects underwent ONH imaging with a commercial SD OCTsystem (Avanti; Optovue, Inc., Fremont, CA). Avanti SD OCT hasan A-scan rate of 70 kHz and a light source with a center wave-length of 840 nm. The ONH map protocol calculates circum-papillary RNFL (cpRNFL) thicknesses in a 10-pixel-wide bandalong a 3.45-mm-diameter circle centered on the ONH based onthe 360-degree global area and eight 45-degree sectors. Only good-quality images, defined as scans with a signal strength index �37and without segmentation failure or artifacts, were included.
Optical Coherence Tomography AngiographyImaging
The OCT AngioVue system (Optovue, Inc.) incorporated in theAvanti SD OCT system provides noninvasive visualization of theretinal microvasculature. Details have been described by Jiaet al.14 Briefly, the OCT-A image is directly derived from SDOCT B-scans. Specifically, the SD OCT image consists of a seriesof B-scans with 2 rapid repeats at each B-scan location, and theaverage of the 2 repeated B-scans forms the conventional SDOCT intensity image. The amplitude decorrelation between these2 B-scans forms the OCT-A image. Because the OCT-A imageand SD OCT intensity image are based on the same B-scans, thereis pixel-to-pixel co-localization between the OCT-A imagevolume and the SD OCT intensity image, and no needfor alignment. In addition, the AngioVue system uses asplit-spectrum amplitude-decorrelation angiography (SSADA)method to capture the dynamic motion of the red blood cells andprovide a high-resolution 3-dimensional visualization of perfusedretinal microvasculature14,21,24,25 (Figs 1 and 2A-3 and B-3).The microvascular information is characterized at various user-defined retinal layers as a vessel density map. Then, vesseldensity (percentage) is calculated as the proportion of themeasured area occupied by flowing blood vessels (defined aspixels having decorrelation values acquired by the SSADAalgorithm above the threshold level)21 (Figs 1 and 2A-3 and B-3).
In this study, circumpapillary vessel density (cpVD) wascalculated in the RNFL and measured in a region defined as a 750-mm-wide elliptical annulus extending from the optic disc boundarybased on the 360-degree global area and eight 45-degree sectors21
(Figs 1 and 2A-3 and B-3).Image quality of all scans was reviewed according to a stan-
dard protocol established by the Imaging Data Evaluation andAnalysis reading center at the Hamilton Glaucoma Center.Trained graders reviewed scans, and those with poor imagequality, as defined by the following criteria, were excluded: (1) asignal strength index <48 (1 ¼ minimum, 100 ¼ maximum), (2)poor clarity, (3) residual motion artifacts visible as an irregularvessel pattern or disc boundary on the en face angiogram, (4) alocal weak signal, and (5) RNFL segmentation errors. Thedelineation of the disc margin was reviewed for accuracy andadjusted manually, if required.21
Swept-Source Optical Coherence TomographyImaging
For detecting focal LC defects, the optic disc was imaged withSS-OCT (DRI-OCT; Topcon, Tokyo, Japan). This device has animage-acquisition rate of 100 000 A-scans/second using a light

Figure 1. Analysis of circumpapillary retinal nerve fiber layer vessel density (cpVD) based on optic nerve head (ONH) optical coherence tomographyangiography (OCT-A) images. A, En face (A-1) and horizontal (A-2) images of the radial peripapillary capillaries within the retinal nerve fiber layer(RNFL). B-1, Same en face image as A-1 but annotated to indicate a 750-mm-wide elliptical annulus (red circles) extending from the optic disc boundarythat forms the region of analysis for cpVD and the location of the B-scan shown in B-2 (sky blue lines). B-2, B-scan view of the vessel density analysis regionlocated within the elliptical annulus (orange arrows) and within the depth range of the RNFL layer (yellow outlines). C, Same en face image as A-1 and B-1,but annotated to indicate eight 45-degree sectors for cpVD.
Figure 2. An optical coherence tomography angiography (OCT-A)ederived vessel density map in subjects with primary open-angle glaucoma (POAG)with (A) and without (B) a focal lamina cribrosa (LC) defect. A-1 and B-1, Visual field (VF) (top) and circumpapillary retinal nerve fiber layer (RNFL)thickness on the spectral-domain optical coherence tomography (SD OCT) image (bottom) of the right eye with a focal LC defect (A-1) and the left eyewithout an LC defect (B-1). Note that the eye with an LC defect did not show RNFL thinning (all RNFL sectors were within normal limits) on the circulardiagram (black arrow) (A-1 bottom), whereas the eye without an LC defect showed an RNFL defect (outside normal limit) in the inferotemporal (IT) sector(black arrowhead) (B-1 bottom). A-2 and B-2, En face (left) and horizontal (right) B-scan images of the swept source (SS)-OCT from eyes with (A-2) andwithout (B-2) an LC defect. Bottom images are the same as top images without labels and contain an 8-sector face circle, with orange lines delineating theanterior LC surface and large sky blue arrows indicating the horizontal scan direction. A focal LC defect was located in the IT sector (red arrows) on SS-OCT(A-2). A-3 and B-3, The circumpapillary RNFL vessel density map of eyes with (A-3) and without (B-3) an LC defect. Center images are the same as thoseon the left but are annotated to include the 8-sector circle with vessel density values for each sector. Right images show color-coded maps. The eye with anLC defect showed notable vessel density reduction (black-outlined red arrows) in the corresponding IT sector (A-3), whereas the eye without a defect showedno evidence of focal vessel density reduction in the IT sector (black-outlined red arrowheads) (B-3). MD ¼ mean deviation; PSD ¼ pattern standarddeviation.
Suh et al � Focal LC Defect and OCT-A Vessel Density
3
Ophthalmology Volume -, Number -, Month 2016
source with a center wavelength of 1050 nm. Details on the devicehave been described by other investigators.26e28
A 3-dimensional raster scan consisting of 256 serial horizontalB-scans over 12�9-mm cube centered on the posterior pole (wide-field protocol) was acquired,28 and serial en face images wereobtained from the 3-dimensional data set.
Poor-quality images (quality score <50, clipped or poorlyfocused scans) due to media opacity, irregular tear film, or inade-quate patient cooperation were excluded.28 Eyes with poorvisibility of the LC, defined as <70% visibility of the anteriorlaminar surface within the Bruch’s membrane opening, also wereexcluded from analysis.9 Two independent observers (M.H.S.and P.I.C.M.) masked to the clinical information of the studysubjects carefully reviewed the obtained horizontal and en faceSS-OCT images for the presence of focal LC defects. Discrep-ancies between the 2 observers were resolved by consensus. Ifconsensus could not be reached, the subject was excluded from theanalysis. A focal LC defect was defined as a laminar hole orlaminar disinsertions violating the normal U- or W-shaped contourof the anterior laminar surface.6e11,29 To avoid false-positives,focal LC defects were required to be �100 mm in diameter and>30 mm in depth, and to be present on at least 2 consecutivescans.6,7,10,11,29 Observers also confirmed that the candidate LCdefects did not correspond with the hyporeflectivity due to vascularshadowing by comparing the en face images with the discphotographs.
Location of the LC defect was described in terms of eight45-degree sectors corresponding to the sectors on the SD OCTAvanti and AngioVue instruments (Fig 2A-2, -3 and B-2, -3). An8-sector face circle was placed around the ONH on the SS-OCT enface image after matching its location with that of the AngioVuecpVD circular diagram registering the images by matching thelocation of the vessels. Then, a sector in which the defect waslocated was assigned. If the subject had an LC defect located over 2neighboring sectors, only 1 sector that involved the larger portionof a defect was assigned.
If both eyes of each patient with POAG had focal LC defects orwere free of focal LC defects, 1 eye from the patient was randomlyselected for analysis. If a patient had 1 eye with and 1 eye without afocal LC defect, the eye with the focal LC defect was included.Subjects with POAG without a focal LC defect were matched tothose with defects for VF mean deviation (MD) to minimize theinfluence of the glaucoma severity on LC defect, cpRNFL thick-ness, and vessel density. Specifically, patients with focal LCdefects were matched to patients without LC defect in 3 groupsbased on the severity of their VF damage: 27 with early POAG(MD >�6 decibels [dB]), 8 with moderate POAG (�12 dB � MD��6 dB), and 6 with advanced POAG (MD <�12 dB) using thefrequency matching method.30
Data Analysis
Clinical characteristics, OCT-derived cpRNFL thicknesses, andOCT-A-derived vessel densities were compared between glau-comatous eyes with and without focal LC defects. Normalityassumption was assessed by inspecting histograms and usingShapiroeWilk tests. An independent samples Student t test wasused for group comparison for normally distributed variables, theManneWhitney test was used for continuous non-normal vari-ables, and the chi-square test was used for categoric variables. Toevaluate interobserver agreement for the presence of focal LCdefects, the kappa coefficient was calculated.11,31,32 All statisticalanalyses were performed with JMP version 11.2.0 (SAS InstituteInc., Cary, NC) and MedCalc (MedCalc, Inc., Mariakerke,Belgium). The a level (type I error) was set at 0.05.
4
Results
Among 180 eyes of 138 patients with POAG who were initiallyenrolled, 36 eyes of 21 patients were excluded because of poor-quality OCT-A (34 eyes of 19 patients) or SD OCT ONH (2eyes of 2 patients) images. Among the remaining 144 eyes of the117 patients, 6 eyes (4.2%) of 3 patients were excluded because ofnot having SSOCT images, 13 eyes (9.0%) of 11 patients wereexcluded because of poor-quality SS-OCT images, and 1 eye(0.69%) of 1 patient was excluded because the 2 observers failed toreach a consensus in determining the presence of an LC defect.There remained 55 eyes of 42 patients with LC defects and 69 eyesof 60 patients without an LC defect. After frequency matching VFMD between patients with and without LC defects, 41 eyes of 41patients with POAG were included in each group. There was anexcellent interobserver agreement in determining the presence ofthe LC defect in these 82 eyes (kappa ¼ 0.84; 95% confidenceinterval, 0.76e0.91; P < 0.001).32,33
Demographics and characteristics of ophthalmic measurementsare summarized in Table 1. There were no significant differencesbetween patients with and without LC defects in the baselineclinical and ocular characteristics, including age, diabetesmellitus, systemic hypertension, systemic antihypertensive anddiabetes medications, number and type of topical glaucomamedications, IOP, mean ocular perfusion pressure, presence ofdisc hemorrhage, VF MD, and global and sectoral RNFLthicknesses (P > 0.05) (Table 1).
Among 41 eyes with focal LC defects, 33 eyes (80%) haddefects located in the inferotemporal (IT) sector, 19 eyes (46%) haddefects located in the superotemporal (ST) sector, 1 eye (2%)had defects located in the inferonasal (IN) sector, and 1 eye (2%)had defects located in the superonasal sector. The LC defects weredetected in both ST and IT sectors in 12 eyes (29%) and in both INand IT sectors in 1 eye (2%).
Table 2 presents the OCT-A-derived vessel densities accordingto the presence of LC defects. Eyes with focal LC defects hadsignificantly lower cpVDs than eyes without a defect in theglobal area (52.9%�5.6% vs. 56.8%�7.7%; P ¼ 0.013) and inthe IT (49.5%�10.3% vs. 56.8%�12.2%; P ¼ 0.004), ST(54.3%�8.8% vs. 58.8%�9.6%; P ¼ 0.030), and IN (52.4%�9.0% vs. 57.6%�9.1%; P ¼ 0.009) sectors. The 2 groups didnot differ significantly with respect to the cpVDs of all othersectors (P > 0.05) (Table 2).
Subgroup analysis of 33 eyes with LC defects in the IT sectorshowed significantly lower cpVDs than eyes without a defect in theIT and IN sectors, with sectoral differences highest in the IT(49.1%�10.3% vs. 56.8%�12.2%; P ¼ 0.005) followed by the IN(53.0%�9.00% vs. 57.6%�9.1%; P ¼ 0.035) sectors (Figs 2 and3A). The subset of 19 eyes with LC defects in the ST sector hadlower cpVDs in the ST, IT, and IN sectors, and sectordifferences were highest in the ST sector (50.8%�9.4% vs.58.8%�9.6%; P ¼ 0.004), followed by the IT (49.1%�11.9%vs. 56.8%�12.2%; P ¼ 0.026) and IN (51.4%�10.4% vs.57.9%�9.1%; P ¼ 0.023) sectors (Fig 3B). Mean global andsectoral cpRNFL thicknesses of the 2 subgroups with LC defectsin the ST and IT sectors did not differ from those without adefect (P > 0.05).
Discussion
In this study, OCT-A-based cpVDs measured in the RNFLwere significantly lower in glaucomatous eyes with focal LCdefects compared with eyes without LC defects, whereasglaucoma severity did not differ between the 2 groups.
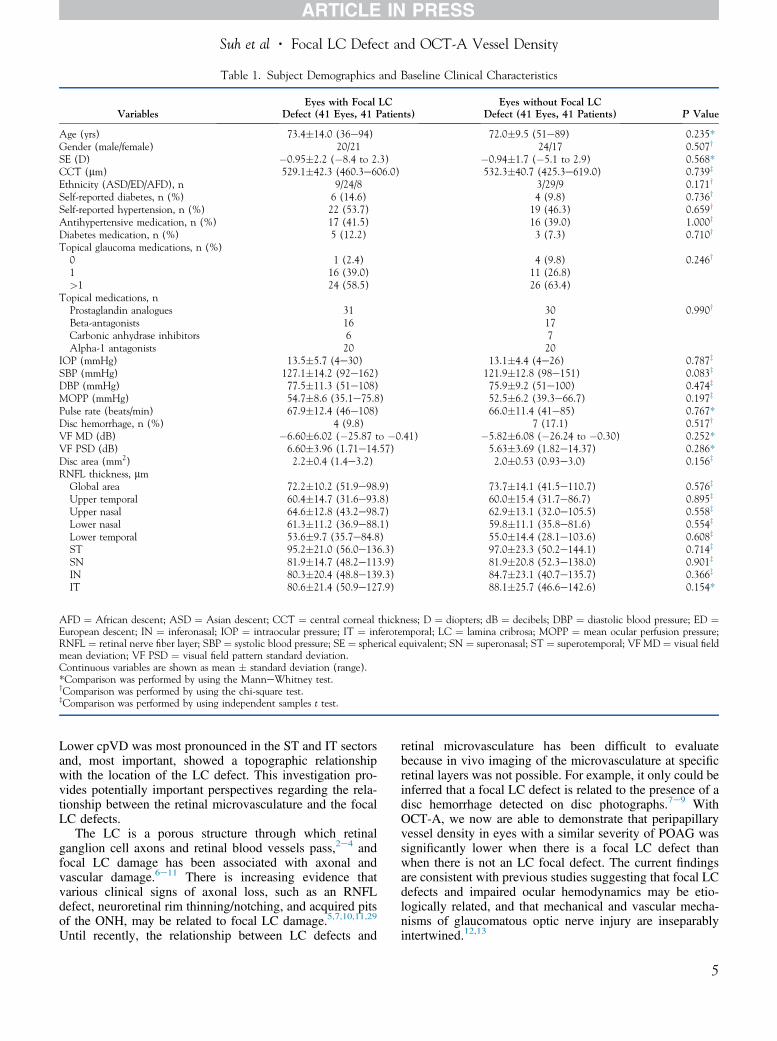
Table 1. Subject Demographics and Baseline Clinical Characteristics
VariablesEyes with Focal LC
Defect (41 Eyes, 41 Patients)Eyes without Focal LC
Defect (41 Eyes, 41 Patients) P Value
Age (yrs) 73.4�14.0 (36e94) 72.0�9.5 (51e89) 0.235*Gender (male/female) 20/21 24/17 0.507y
SE (D) �0.95�2.2 (�8.4 to 2.3) �0.94�1.7 (�5.1 to 2.9) 0.568*CCT (mm) 529.1�42.3 (460.3e606.0) 532.3�40.7 (425.3e619.0) 0.739z
Ethnicity (ASD/ED/AFD), n 9/24/8 3/29/9 0.171y
Self-reported diabetes, n (%) 6 (14.6) 4 (9.8) 0.736y
Self-reported hypertension, n (%) 22 (53.7) 19 (46.3) 0.659y
Antihypertensive medication, n (%) 17 (41.5) 16 (39.0) 1.000y
Diabetes medication, n (%) 5 (12.2) 3 (7.3) 0.710y
Topical glaucoma medications, n (%)0 1 (2.4) 4 (9.8) 0.246y
1 16 (39.0) 11 (26.8)>1 24 (58.5) 26 (63.4)
Topical medications, nProstaglandin analogues 31 30 0.990y
Beta-antagonists 16 17Carbonic anhydrase inhibitors 6 7Alpha-1 antagonists 20 20
IOP (mmHg) 13.5�5.7 (4e30) 13.1�4.4 (4e26) 0.787z
SBP (mmHg) 127.1�14.2 (92e162) 121.9�12.8 (98e151) 0.083z
DBP (mmHg) 77.5�11.3 (51e108) 75.9�9.2 (51e100) 0.474z
MOPP (mmHg) 54.7�8.6 (35.1e75.8) 52.5�6.2 (39.3e66.7) 0.197z
Pulse rate (beats/min) 67.9�12.4 (46e108) 66.0�11.4 (41e85) 0.767*Disc hemorrhage, n (%) 4 (9.8) 7 (17.1) 0.517y
VF MD (dB) �6.60�6.02 (�25.87 to �0.41) �5.82�6.08 (�26.24 to �0.30) 0.252*VF PSD (dB) 6.60�3.96 (1.71e14.57) 5.63�3.69 (1.82e14.37) 0.286*Disc area (mm2) 2.2�0.4 (1.4e3.2) 2.0�0.53 (0.93e3.0) 0.156z
RNFL thickness, mmGlobal area 72.2�10.2 (51.9e98.9) 73.7�14.1 (41.5e110.7) 0.576z
Upper temporal 60.4�14.7 (31.6e93.8) 60.0�15.4 (31.7e86.7) 0.895z
Upper nasal 64.6�12.8 (43.2e98.7) 62.9�13.1 (32.0e105.5) 0.558z
Lower nasal 61.3�11.2 (36.9e88.1) 59.8�11.1 (35.8e81.6) 0.554z
Lower temporal 53.6�9.7 (35.7e84.8) 55.0�14.4 (28.1e103.6) 0.608z
ST 95.2�21.0 (56.0e136.3) 97.0�23.3 (50.2e144.1) 0.714z
SN 81.9�14.7 (48.2e113.9) 81.9�20.8 (52.3e138.0) 0.901z
IN 80.3�20.4 (48.8e139.3) 84.7�23.1 (40.7e135.7) 0.366z
IT 80.6�21.4 (50.9e127.9) 88.1�25.7 (46.6e142.6) 0.154*
AFD ¼ African descent; ASD ¼ Asian descent; CCT ¼ central corneal thickness; D ¼ diopters; dB ¼ decibels; DBP ¼ diastolic blood pressure; ED ¼European descent; IN ¼ inferonasal; IOP ¼ intraocular pressure; IT ¼ inferotemporal; LC ¼ lamina cribrosa; MOPP ¼ mean ocular perfusion pressure;RNFL ¼ retinal nerve fiber layer; SBP ¼ systolic blood pressure; SE ¼ spherical equivalent; SN ¼ superonasal; ST ¼ superotemporal; VF MD ¼ visual fieldmean deviation; VF PSD ¼ visual field pattern standard deviation.Continuous variables are shown as mean � standard deviation (range).*Comparison was performed by using the ManneWhitney test.yComparison was performed by using the chi-square test.zComparison was performed by using independent samples t test.
Suh et al � Focal LC Defect and OCT-A Vessel Density
Lower cpVD was most pronounced in the ST and IT sectorsand, most important, showed a topographic relationshipwith the location of the LC defect. This investigation pro-vides potentially important perspectives regarding the rela-tionship between the retinal microvasculature and the focalLC defects.
The LC is a porous structure through which retinalganglion cell axons and retinal blood vessels pass,2e4 andfocal LC damage has been associated with axonal andvascular damage.6e11 There is increasing evidence thatvarious clinical signs of axonal loss, such as an RNFLdefect, neuroretinal rim thinning/notching, and acquired pitsof the ONH, may be related to focal LC damage.5,7,10,11,29
Until recently, the relationship between LC defects and
retinal microvasculature has been difficult to evaluatebecause in vivo imaging of the microvasculature at specificretinal layers was not possible. For example, it only could beinferred that a focal LC defect is related to the presence of adisc hemorrhage detected on disc photographs.7e9 WithOCT-A, we now are able to demonstrate that peripapillaryvessel density in eyes with a similar severity of POAG wassignificantly lower when there is a focal LC defect thanwhen there is not an LC focal defect. The current findingsare consistent with previous studies suggesting that focal LCdefects and impaired ocular hemodynamics may be etio-logically related, and that mechanical and vascular mecha-nisms of glaucomatous optic nerve injury are inseparablyintertwined.12,13
5
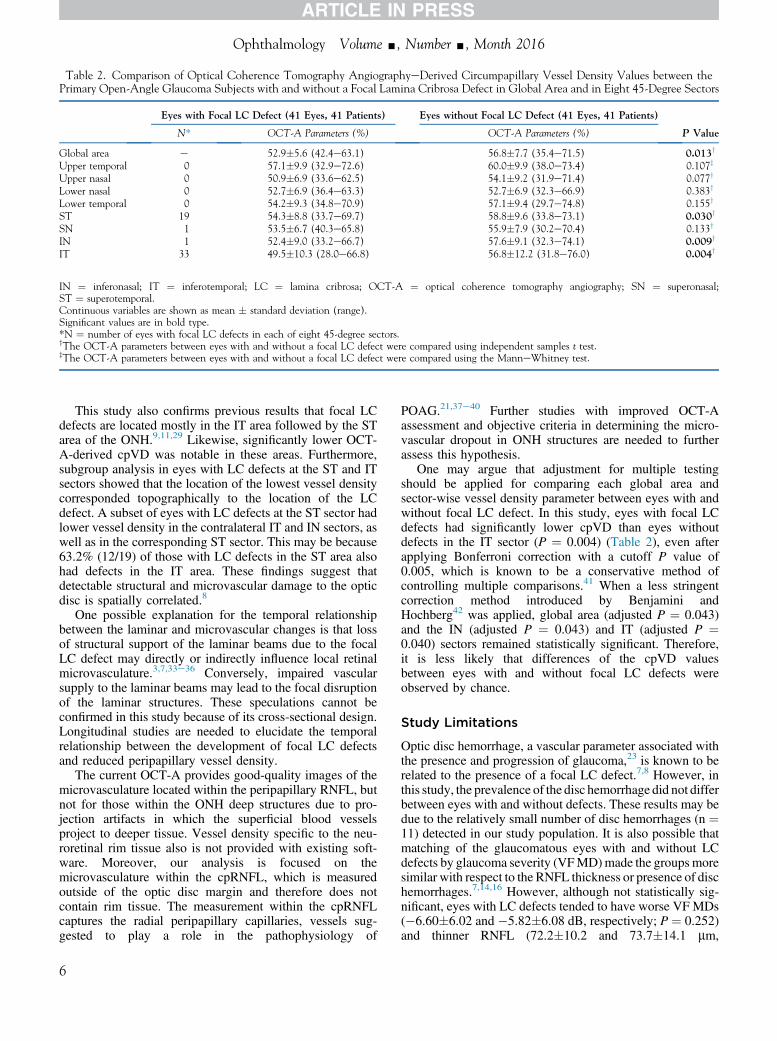
Table 2. Comparison of Optical Coherence Tomography AngiographyeDerived Circumpapillary Vessel Density Values between thePrimary Open-Angle Glaucoma Subjects with and without a Focal Lamina Cribrosa Defect in Global Area and in Eight 45-Degree Sectors
Eyes with Focal LC Defect (41 Eyes, 41 Patients) Eyes without Focal LC Defect (41 Eyes, 41 Patients)
P ValueN* OCT-A Parameters (%) OCT-A Parameters (%)
Global area e 52.9�5.6 (42.4e63.1) 56.8�7.7 (35.4e71.5) 0.013y
Upper temporal 0 57.1�9.9 (32.9e72.6) 60.0�9.9 (38.0e73.4) 0.107z
Upper nasal 0 50.9�6.9 (33.6e62.5) 54.1�9.2 (31.9e71.4) 0.077y
Lower nasal 0 52.7�6.9 (36.4e63.3) 52.7�6.9 (32.3e66.9) 0.383y
Lower temporal 0 54.2�9.3 (34.8e70.9) 57.1�9.4 (29.7e74.8) 0.155y
ST 19 54.3�8.8 (33.7e69.7) 58.8�9.6 (33.8e73.1) 0.030y
SN 1 53.5�6.7 (40.3e65.8) 55.9�7.9 (30.2e70.4) 0.133y
IN 1 52.4�9.0 (33.2e66.7) 57.6�9.1 (32.3e74.1) 0.009y
IT 33 49.5�10.3 (28.0e66.8) 56.8�12.2 (31.8e76.0) 0.004y
IN ¼ inferonasal; IT ¼ inferotemporal; LC ¼ lamina cribrosa; OCT-A ¼ optical coherence tomography angiography; SN ¼ superonasal;ST ¼ superotemporal.Continuous variables are shown as mean � standard deviation (range).Significant values are in bold type.*N ¼ number of eyes with focal LC defects in each of eight 45-degree sectors.yThe OCT-A parameters between eyes with and without a focal LC defect were compared using independent samples t test.zThe OCT-A parameters between eyes with and without a focal LC defect were compared using the ManneWhitney test.
Ophthalmology Volume -, Number -, Month 2016
This study also confirms previous results that focal LCdefects are located mostly in the IT area followed by the STarea of the ONH.9,11,29 Likewise, significantly lower OCT-A-derived cpVD was notable in these areas. Furthermore,subgroup analysis in eyes with LC defects at the ST and ITsectors showed that the location of the lowest vessel densitycorresponded topographically to the location of the LCdefect. A subset of eyes with LC defects at the ST sector hadlower vessel density in the contralateral IT and IN sectors, aswell as in the corresponding ST sector. This may be because63.2% (12/19) of those with LC defects in the ST area alsohad defects in the IT area. These findings suggest thatdetectable structural and microvascular damage to the opticdisc is spatially correlated.8
One possible explanation for the temporal relationshipbetween the laminar and microvascular changes is that lossof structural support of the laminar beams due to the focalLC defect may directly or indirectly influence local retinalmicrovasculature.3,7,33e36 Conversely, impaired vascularsupply to the laminar beams may lead to the focal disruptionof the laminar structures. These speculations cannot beconfirmed in this study because of its cross-sectional design.Longitudinal studies are needed to elucidate the temporalrelationship between the development of focal LC defectsand reduced peripapillary vessel density.
The current OCT-A provides good-quality images of themicrovasculature located within the peripapillary RNFL, butnot for those within the ONH deep structures due to pro-jection artifacts in which the superficial blood vesselsproject to deeper tissue. Vessel density specific to the neu-roretinal rim tissue also is not provided with existing soft-ware. Moreover, our analysis is focused on themicrovasculature within the cpRNFL, which is measuredoutside of the optic disc margin and therefore does notcontain rim tissue. The measurement within the cpRNFLcaptures the radial peripapillary capillaries, vessels sug-gested to play a role in the pathophysiology of
6
POAG.21,37e40 Further studies with improved OCT-Aassessment and objective criteria in determining the micro-vascular dropout in ONH structures are needed to furtherassess this hypothesis.
One may argue that adjustment for multiple testingshould be applied for comparing each global area andsector-wise vessel density parameter between eyes with andwithout focal LC defect. In this study, eyes with focal LCdefects had significantly lower cpVD than eyes withoutdefects in the IT sector (P ¼ 0.004) (Table 2), even afterapplying Bonferroni correction with a cutoff P value of0.005, which is known to be a conservative method ofcontrolling multiple comparisons.41 When a less stringentcorrection method introduced by Benjamini andHochberg42 was applied, global area (adjusted P ¼ 0.043)and the IN (adjusted P ¼ 0.043) and IT (adjusted P ¼0.040) sectors remained statistically significant. Therefore,it is less likely that differences of the cpVD valuesbetween eyes with and without focal LC defects wereobserved by chance.
Study Limitations
Optic disc hemorrhage, a vascular parameter associated withthe presence and progression of glaucoma,23 is known to berelated to the presence of a focal LC defect.7,8 However, inthis study, the prevalence of the disc hemorrhage did not differbetween eyes with and without defects. These results may bedue to the relatively small number of disc hemorrhages (n ¼11) detected in our study population. It is also possible thatmatching of the glaucomatous eyes with and without LCdefects by glaucoma severity (VFMD)made the groupsmoresimilar with respect to the RNFL thickness or presence of dischemorrhages.7,14,16 However, although not statistically sig-nificant, eyes with LC defects tended to have worse VF MDs(�6.60�6.02 and �5.82�6.08 dB, respectively; P ¼ 0.252)and thinner RNFL (72.2�10.2 and 73.7�14.1 mm,

Figure 3. Comparison of optical coherence tomography angiography(OCT-A) circumpapillary vessel density (cpVD) profiles between glau-comatous eyes with and without a focal lamina cribrosa (LC) defect. A,Subset of 33 eyes with an LC defect located in the inferotemporal sector(IT) sector had significantly lower cpVDs in the IT and inferonasal (IN)sectors compared with those without a defect. Sector differences werehighest in the IT sector. B, Subset of 19 eyes with an LC defect in thesuperotemporal (ST) sector had significantly lower cpVDs in the ST, IN,and IT sectors compared with those without a defect. Sector differenceswere highest in the ST sector. NL ¼ lower nasal sector; NU ¼ upper nasal;SN ¼ superonasal; TL ¼ lower temporal; TU ¼ upper temporal.
Suh et al � Focal LC Defect and OCT-A Vessel Density
respectively, for global cpRNFL thickness; P ¼ 0.576) thaneyes without a defect, suggesting that the influence of axonalloss on vessel density cannot be completely ruled out.Moreover,matching the glaucoma severity between eyeswithand without focal LC defects resulted in an overlap in thedistribution of the VF MDs, RNFL thickness, and vesseldensity values between the 2 groups. The VFMDs and RNFLthicknesses were not significantly different between the 2groups (by design). However, despite a large overlap in thecpVD values in eyes with and without LC defects, there was asignificant difference between the 2 groups. The clinicalutility of the difference is not clear. Longitudinal studies areneeded to determine the temporal relationship betweenmicrovascular dropout and LC defects. Patient matching alsoled to a relatively small sample size and thus may limit the
generalizability of the current results to the general populationwith glaucoma. Another limitation is that focal LC defectswere based on subjective observation, and even with SSOCTit is sometimes challenging to visualize the deep ONHstructures. However, this limitation was addressed at least inpart by having 2 graders determine the presence of LC defects,by the excellent interobserver agreement in determining thepresence of the LC defect (kappa ¼ 0.84), and by the lowerexclusion rate of the poor-quality SS-OCT images (9.0%)compared with previous studies ranging between 20.0% and25.7%.8,10,11 The use of the en face SS-OCT images, whichprovided clearer visualization of the LC, may have contrib-uted to the high interobserver agreement and low exclusionrate of the current study.9 Third, this study had a relativelyhigh number of poor-quality OCT-A images (34/180[18.9%]). The current OCT-A is a newly introduced tech-nique and does not have an eye-tracking system. Approxi-mately 13.3% (24/180) of scans in this study were excludedbecause of excessive movement. Further application of theeye tracking system may help obtain better-quality OCT-Aimages. Fourth, the current OCT-A technique generates abinary image of the vessels based on the amplitude decorre-lation between rapidly repeated B-scans. Therefore, vesselswithout flowmay not be visualized because of lack of motioncontrast. Finally, the use of 2 different devices and 8 relativelylarge sectors may not facilitate accurate registration betweenthe location of the focal LC defect and the vessel densityreduction. The current OCT-A software only providescpRNFL vessel density globally and in 8 fixed 45-degreesectors. Moreover, the current SD OCT (Avanti) in whichOCT-A (AngioVue) software is incorporated does not havean enhanced depth imaging technique that allows detailedanalysis of the laminar structure; therefore, we used SS-OCTfor the lamina analysis. However, the OCT-A image isdirectly derived from SD OCT B-scans. Moreover, becauseSSOCT and SD OCT images were aligned by matching thelarge vessels, it is unlikely that there is a significant error inevaluating the topographic relationship between vessel den-sity and focal LC defects. Further development of OCT-Asoftware that allows for location-specific vessel densitymeasures and enhanced depth imaging is needed to moreprecisely map the location of microvasculature dropout tolamina defects.
In conclusion, cpVD was significantly lower in glau-comatous eyes with focal LC defects than in eyes withoutfocal LC defects, especially in the ST and IT sectors.Moreover, lower vessel density was spatially correlated withthe location of the LC defect. Longitudinal studies are neededto determine the temporal relationship between the structuralalteration of the LC and the retinal microvasculature.
References
1. Weinreb RN, Aung T, Medeiros FA. The pathophysiology andtreatment of glaucoma: a review. JAMA 2014;311:1901–11.
2. Fechtner RD, Weinreb RN. Mechanisms of optic nerve dam-age in primary open angle glaucoma. Surv Ophthalmol1994;39:23–42.
7

Ophthalmology Volume -, Number -, Month 2016
3. Anderson DR. Ultrastructure of human and monkey laminacribrosa and optic nerve head. Arch Ophthalmol 1969;82:800–14.
4. Wilczek M. The lamina cribrosa and its nature. Br JOphthalmol 1947;31:551–65.
5. Quigley HA, Addicks EM. Regional differences in the struc-ture of the lamina cribrosa and their relation to glaucomatousoptic nerve damage. Arch Ophthalmol 1981;99:137–43.
6. Faridi OS, Park SC, Kabadi R, et al. Effect of focal laminacribrosa defect on glaucomatous visual field progression.Ophthalmology 2014;121:1524–30.
7. Park SC, Hsu AT, Su D, et al. Factors associated with focallamina cribrosa defects in glaucoma. Invest Ophthalmol VisSci 2013;54:8401.
8. Lee EJ, Kim TW, Kim M, et al. Recent structural alteration ofthe peripheral lamina cribrosa near the location of disc hem-orrhage in glaucoma. Invest Ophthalmol Vis Sci 2014;55:2805–15.
9. Kim YK, Park KH. Lamina cribrosa defects in eyes withglaucomatous disc haemorrhage. Acta Ophthalmologica2015 Nov 2. http://dx.doi.org/10.1111/aos.12903 [Epubahead of print].
10. You JY, Park SC, Su D, et al. Focal lamina cribrosa defectsassociated with glaucomatous rim thinning and acquired pits.JAMA Ophthalmol 2013;131:314.
11. Tatham AJ, Miki A, Weinreb RN, et al. Defects of the laminacribrosa in eyes with localized retinal nerve fiber layer loss.Ophthalmology 2014;121:110–8.
12. Burgoyne CF, Crawford Downs J, Bellezza AJ, et al. The opticnerve head as a biomechanical structure: a new paradigm forunderstanding the role of IOP-related stress and strain in thepathophysiology of glaucomatous optic nerve head damage.Prog Retin Eye Res 2005;24:39–73.
13. Downs C, Roberts MD, Burgoyne CF. Mechanical strain andrestructuring of the optic nerve head. In: Shaarawy TM,Sherwood MB, Hitchings RA, Crowston JG, eds. GlaucomaMedical Diagnosis and Therapy. Vol. 1. Philadelphia, PA:Saunders Elsevier; 2009.
14. Jia Y, Wei E, Wang X, et al. Optical coherence tomographyangiography of optic disc perfusion in glaucoma. Ophthal-mology 2014;121:1322–32.
15. Liu L, Jia Y, Takusagawa HL, et al. Optical coherencetomography angiography of the peripapillary retina in glau-coma. JAMA Ophthalmol 2015;133:1045.
16. Wang X, Jiang C, Ko T, et al. Correlation between optic discperfusion and glaucomatous severity in patients with open-angle glaucoma: an optical coherence tomography angiog-raphy study. Graefes Arch Clin Exp Ophthalmol 2015;253:1557–64.
17. Aizawa N, Yokoyama Y, Chiba N, et al. Reproducibility ofretinal circulation measurements obtained using laser speckleflowgraphy-NAVI in patients with glaucoma. Clin Ophthalmol2011;5:1171–6.
18. Nicolela MT, Hnik P, Schulzer M, Drance SM. Reproduc-ibility of retinal and optic nerve head blood flow measure-ments with scanning laser Doppler flowmetry. J Glaucoma1997;6:157–64.
19. Iester M, Altieri M, Michelson G, et al. Intraobserver repro-ducibility of a two-dimensional mapping of the optic nervehead perfusion. J Glaucoma 2002;11:488–92.
20. Hitchings RA, Spaeth GL. Fluorescein angiography in chronicsimple and low-tension glaucoma. Br J Ophthalmol 1977;61:126–32.
21. Yarmohammadi A, Zangwill LM, Diniz-Filho A, et al. Opticalcoherence tomography angiography vessel density in healthy,
8
glaucoma suspects, and glaucoma. Invest Ophthalmol Vis Sci2016;57:OCT451–9.
22. Sample PA, Girkin CA, Zangwill LM, et al. The AfricanDescent and Glaucoma Evaluation Study (ADAGES): designand baseline data. Arch Ophthalmol 2009;127:1136–45.
23. SuhMH,ParkKH.Pathogenesis and clinical implications of opticdisk hemorrhage in glaucoma. Surv Ophthalmol 2014;59:19–29.
24. Jia Y, Tan O, Tokayer J, et al. Split-spectrum amplitude-decorrelation angiography with optical coherence tomogra-phy. Opt Express 2012;20:4710–25.
25. Jia Y, Morrison JC, Tokayer J, et al. Quantitative OCT angi-ography of optic nerve head blood flow. Biomed Opt Express2012;3:3127–37.
26. Mansouri K, Medeiros FA, Marchase N, et al. Assessment ofchoroidal thickness and volume during the water drinkingtest by swept-source optical coherence tomography.Ophthalmology 2013;120:2508–16.
27. Yasuno Y, Hong Y, Makita S, et al. In vivo high-contrastimaging of deep posterior eye by 1-microm swept sourceoptical coherence tomography and scattering optical coherenceangiography. Opt Express 2007;15:6121–39.
28. Zhang C, Tatham AJ, Medeiros FA, et al. Assessment ofchoroidal thickness in healthy and glaucomatous eyes usingswept source optical coherence tomography. PLoS One2014;9:e109683.
29. Kiumehr S, Park SC, Syril D, et al. In vivo evaluation of focallamina cribrosa defects in glaucoma. Arch Ophthalmol2012;130:552–9.
30. Hodapp E, Parrish RK II, Anderson DR. Clinical decisions inglaucoma. St Louis: The CV Mosby Co; 1993:52–61.
31. Cohen J. Weighted kappa: nominal scale agreement withprovision for scaled disagreement or partial credit. PsycholBull 1968;70:213–20.
32. Landis JR, Koch GG. An application of hierarchical kappa-type statistics in the assessment of majority agreementamong multiple observers. Biometrics 1977;33:363–74.
33. Burgoyne CF. A biomechanical paradigm for axonal insultwithin the optic nerve head in aging and glaucoma. Exp EyeRes 2011;93:120–32.
34. Mackenzie PJ, Cioffi GA. Vascular anatomy of the optic nervehead. Can J Ophthalmol 2008;43:308–12.
35. Guidoboni G, Harris A, Carichino L, et al. Effect of intraocularpressure on the hemodynamics of the central retinal artery: amathematical model. Math Biosci Eng 2014;11:523–46.
36. Guidoboni G, Harris A, Cassani S, et al. Intraocular pressure,blood pressure, and retinal blood flow autoregulation: amathematical model to clarify their relationship and clinicalrelevance. Invest Ophthalmol Vis Sci 2014;55:4105–18.
37. Henkind P. Radial peripapillary capillaries of the retina. I.Anatomy: human and comparative. Br J Ophthalmol 1967;51:115–23.
38. Henkind P, Bellhorn RW, Poll D. Radial peripapillary capil-laries. 3. Their development in the cat. Br J Ophthalmol1973;57:595–9.
39. Kornzweig AL, Eliasoph I, Feldstein M. Selective atrophy ofthe radial peripapillary capillaries in chronic glaucoma. ArchOphthalmol 1968;80:696–702.
40. Yu PK, Cringle SJ, Yu DY. Correlation between the radialperipapillary capillaries and the retinal nerve fibre layer in thenormal human retina. Exp Eye Res 2014;129:83–92.
41. Perneger TV. What’s wrong with Bonferroni adjustments.BMJ 1998;316:1236–8.
42. Benjamini Y, Hochberg Y. Controlling the false discoveryrate: a practical and powerful approach in multiple testing. J RStat Soc Series B Stat Methodol 1995;57:289–300.

Suh et al � Focal LC Defect and OCT-A Vessel Density
Footnotes and Financial Disclosures
Originally received: March 15, 2016.Final revision: July 5, 2016.Accepted: July 12, 2016.Available online: ---. Manuscript no. 2016-553.1 Hamilton Glaucoma Center, Shiley Eye Institute, and the Department ofOphthalmology, University of California San Diego, La Jolla, California.2 Department of Ophthalmology, Haeundae Paik Hospital, Inje UniversityCollege of Medicine, Busan, South Korea.
Financial Disclosure(s):The author(s) have made the following disclosure(s): L.M.Z.: Researchsupport e Carl Zeiss Meditec, Heidelberg Engineering, National EyeInstitute, and Topcon.
F.A.M.: Financial support e Alcon, Allergan, Bausch & Lomb, Carl ZeissMeditec, Heidelberg Engineering, Merck, Reichert, Sensimed, and Topcon;Research support e Alcon, Allergan, Carl Zeiss Meditec, National EyeInstitute, and Reichert; Consultant e Allergan, Carl Zeiss Meditec, andNovartis.
R.N.W.: Research support e Carl Zeiss Meditec, Genentech, HeidelbergEngineering, National Eye Institute, Optovue, and Topcon; Consultant eAlcon, Allergan, Bausch & Lomb, Carl Zeiss Meditec, Sensimed, andTopcon.
Supported in part by National Institutes of Health/Nation Eye Institutegrants P30EY022589, EY11008, EY019869, and EY021818; a grant fromresearch year of Inje University in 2015; and an unrestricted grant fromResearch to Prevent Blindness (New York, NY). The funding organizationshad no role in the design or conduct of this research.
All in-text references underlined in blue are linked to publications on Re
Author Contributions:
Conception and design: Suh, Zangwill, Weinreb
Data collection: Suh, Zangwill, Manalastas, Belghith, Yarmohammadi,Medeiros, Diniz-Filho, Saunders, Yousefi, Weinreb
Analysis and interpretation: Suh, Zangwill, Manalastas, Belghith, Yarmo-hammadi, Medeiros, Diniz-Filho, Saunders, Yousefi, Weinreb
Obtained funding: Not applicable
Overall responsibility: Suh, Zangwill, Manalastas, Belghith, Yarmo-hammadi, Medeiros, Diniz-Filho, Saunders, Yousefi, Weinreb
Abbreviations and Acronyms:cpRNFL ¼ circumpapillary retinal nerve fiber layer;cpVD ¼ circumpapillary vessel density; dB ¼ decibels;DIGS ¼ Diagnostic Innovations in Glaucoma Study; IN ¼ inferonasal;IOP ¼ intraocular pressure; IT ¼ inferotemporal; LC ¼ lamina cribrosa;MD ¼ mean deviation; OCT-A ¼ optical coherence tomography angiog-raphy; ONH ¼ optic nerve head; POAG ¼ primary open-angle glaucoma;RNFL ¼ retinal nerve fiber layer; SD OCT ¼ spectral-domain opticalcoherence tomography; SSADA ¼ split-spectrum amplitude-decorrelationangiography; SS-OCT ¼ swept-source optical coherence tomography;ST ¼ superotemporal; VF ¼ visual field.
Correspondence:Robert N. Weinreb, MD, University of California San Diego, 9500 GilmanDrive, MC 0946, La Jolla, CA 92093. E-mail: [email protected].
9
searchGate, letting you access and read them immediately.