
Optical Air Flow Measurements in Flight - NASA · NASA/TP-2004-210735 Optical Air Flow Measurements...
101
NASA/TP-2004-210735 Optical Air Flow Measurements in Flight Rodney K. Bogue NASA Dryden Flight Research Center Edwards, California Henk W. Jentink National Aerospace Laboratory Amsterdam, The Netherlands December 2004 https://ntrs.nasa.gov/search.jsp?R=20050169215 2018-10-14T01:44:25+00:00Z
Transcript of Optical Air Flow Measurements in Flight - NASA · NASA/TP-2004-210735 Optical Air Flow Measurements...
NASA/TP-2004-210735
Optical Air Flow Measurements in Flight
Rodney K. BogueNASA Dryden Flight Research CenterEdwards, California
Henk W. JentinkNational Aerospace LaboratoryAmsterdam, The Netherlands
December 2004
https://ntrs.nasa.gov/search.jsp?R=20050169215 2018-10-14T01:44:25+00:00Z

The NASA STI Program Office…in Profile
Since its founding, NASA has been dedicatedto the advancement of aeronautics and space science. The NASA Scientific and Technical Information (STI) Program Office plays a keypart in helping NASA maintain thisimportant role.
The NASA STI Program Office is operated byLangley Research Center, the lead center forNASA’s scientific and technical information.The NASA STI Program Office provides access to the NASA STI Database, the largest collectionof aeronautical and space science STI in theworld. The Program Office is also NASA’s institutional mechanism for disseminating theresults of its research and development activities. These results are published by NASA in theNASA STI Report Series, which includes the following report types:
• TECHNICAL PUBLICATION. Reports of completed research or a major significantphase of research that present the results of NASA programs and include extensive dataor theoretical analysis. Includes compilations of significant scientific and technical data and information deemed to be of continuing reference value. NASA’s counterpart of peer-reviewed formal professional papers but has less stringent limitations on manuscriptlength and extent of graphic presentations.
• TECHNICAL MEMORANDUM. Scientificand technical findings that are preliminary orof specialized interest, e.g., quick releasereports, working papers, and bibliographiesthat contain minimal annotation. Does notcontain extensive analysis.
• CONTRACTOR REPORT. Scientific and technical findings by NASA-sponsored contractors and grantees.
• CONFERENCE PUBLICATION. Collected papers from scientific andtechnical conferences, symposia, seminars,or other meetings sponsored or cosponsoredby NASA.
• SPECIAL PUBLICATION. Scientific,technical, or historical information fromNASA programs, projects, and missions,often concerned with subjects havingsubstantial public interest.
• TECHNICAL TRANSLATION. English- language translations of foreign scientific and technical material pertinent toNASA’s mission.
Specialized services that complement the STIProgram Office’s diverse offerings include creating custom thesauri, building customizeddatabases, organizing and publishing researchresults…even providing videos.
For more information about the NASA STIProgram Office, see the following:
• Access the NASA STI Program Home Pageat
http://www.sti.nasa.gov
• E-mail your question via the Internet to [email protected]
• Fax your question to the NASA STI HelpDesk at (301) 621-0134
• Telephone the NASA STI Help Desk at(301) 621-0390
• Write to:NASA STI Help DeskNASA Center for AeroSpace Information7121 Standard DriveHanover, MD 21076-1320
NASA/TP-2004-210735
Optical Air Flow Measurements in Flight
Rodney K. BogueNASA Dryden Flight Research CenterEdwards, California
Henk W. JentinkNational Aerospace LaboratoryAmsterdam, The Netherlands
December 2004
National Aeronautics andSpace Administration
Dryden Flight Research CenterEdwards, California 93523-0273

NOTICE
Use of trade names or names of manufacturers in this document does not constitute an official endorsementof such products or manufacturers, either expressed or implied, by the National Aeronautics andSpace Administration.
Available from:
NASA Center for AeroSpace Information (CASI) National Technical Information Service (NTIS)7121 Standard Drive 5285 Port Royal RoadHanover, MD 21076-1320 Springfield, VA 22161-2171(301) 621-0390 (703) 605-6000
iii
CONTENTS
Page
ACKNOWLEDGMENTS . . . . . . . . . . . . . . . . . . . . . . . . . . . . . . . . . . . . . . . . . . . . . . . . . . . . . . . . . . viii
ABSTRACT . . . . . . . . . . . . . . . . . . . . . . . . . . . . . . . . . . . . . . . . . . . . . . . . . . . . . . . . . . . . . . . . . . . . . . . 1
NOMENCLATURE . . . . . . . . . . . . . . . . . . . . . . . . . . . . . . . . . . . . . . . . . . . . . . . . . . . . . . . . . . . . . . . . . 1Acronyms . . . . . . . . . . . . . . . . . . . . . . . . . . . . . . . . . . . . . . . . . . . . . . . . . . . . . . . . . . . . . . . . . . . . . . 1Symbols . . . . . . . . . . . . . . . . . . . . . . . . . . . . . . . . . . . . . . . . . . . . . . . . . . . . . . . . . . . . . . . . . . . . . . . 3
INTRODUCTION . . . . . . . . . . . . . . . . . . . . . . . . . . . . . . . . . . . . . . . . . . . . . . . . . . . . . . . . . . . . . . . . . . 4Background . . . . . . . . . . . . . . . . . . . . . . . . . . . . . . . . . . . . . . . . . . . . . . . . . . . . . . . . . . . . . . . . . . . . . 4
History . . . . . . . . . . . . . . . . . . . . . . . . . . . . . . . . . . . . . . . . . . . . . . . . . . . . . . . . . . . . . . . . . . . . . 4Challenges for Flight Applications . . . . . . . . . . . . . . . . . . . . . . . . . . . . . . . . . . . . . . . . . . . . . . . . 6
Natural aerosol backscattering . . . . . . . . . . . . . . . . . . . . . . . . . . . . . . . . . . . . . . . . . . . . . . . . 6Low signal-to-noise ratio (SNR). . . . . . . . . . . . . . . . . . . . . . . . . . . . . . . . . . . . . . . . . . . . . . . 6Eye and skin hazards. . . . . . . . . . . . . . . . . . . . . . . . . . . . . . . . . . . . . . . . . . . . . . . . . . . . . . . . 6
Component Technology Developments . . . . . . . . . . . . . . . . . . . . . . . . . . . . . . . . . . . . . . . . . . . . 7Optical state-of-the-art technology . . . . . . . . . . . . . . . . . . . . . . . . . . . . . . . . . . . . . . . . . . . . . 8Signal processing . . . . . . . . . . . . . . . . . . . . . . . . . . . . . . . . . . . . . . . . . . . . . . . . . . . . . . . . . . 8Spin-off developments . . . . . . . . . . . . . . . . . . . . . . . . . . . . . . . . . . . . . . . . . . . . . . . . . . . . . . 8
Objective . . . . . . . . . . . . . . . . . . . . . . . . . . . . . . . . . . . . . . . . . . . . . . . . . . . . . . . . . . . . . . . . . . . . . . . 8Organization . . . . . . . . . . . . . . . . . . . . . . . . . . . . . . . . . . . . . . . . . . . . . . . . . . . . . . . . . . . . . . . . . . . . 9
Introduction. . . . . . . . . . . . . . . . . . . . . . . . . . . . . . . . . . . . . . . . . . . . . . . . . . . . . . . . . . . . . . . . . . 9Terminology and Definitions . . . . . . . . . . . . . . . . . . . . . . . . . . . . . . . . . . . . . . . . . . . . . . . . . . . . 9Basic Principles. . . . . . . . . . . . . . . . . . . . . . . . . . . . . . . . . . . . . . . . . . . . . . . . . . . . . . . . . . . . . . 10System Components . . . . . . . . . . . . . . . . . . . . . . . . . . . . . . . . . . . . . . . . . . . . . . . . . . . . . . . . . . 10Types of Laser Anemometers . . . . . . . . . . . . . . . . . . . . . . . . . . . . . . . . . . . . . . . . . . . . . . . . . . . 10Applications . . . . . . . . . . . . . . . . . . . . . . . . . . . . . . . . . . . . . . . . . . . . . . . . . . . . . . . . . . . . . . . . 11Existing Systems. . . . . . . . . . . . . . . . . . . . . . . . . . . . . . . . . . . . . . . . . . . . . . . . . . . . . . . . . . . . . 11Future Prospects and Directions . . . . . . . . . . . . . . . . . . . . . . . . . . . . . . . . . . . . . . . . . . . . . . . . . 12
TERMINOLOGY AND DEFINITIONS . . . . . . . . . . . . . . . . . . . . . . . . . . . . . . . . . . . . . . . . . . . . . . . . 13
BASIC PRINCIPLES . . . . . . . . . . . . . . . . . . . . . . . . . . . . . . . . . . . . . . . . . . . . . . . . . . . . . . . . . . . . . . . 19Introduction. . . . . . . . . . . . . . . . . . . . . . . . . . . . . . . . . . . . . . . . . . . . . . . . . . . . . . . . . . . . . . . . . . . . 19Light Source . . . . . . . . . . . . . . . . . . . . . . . . . . . . . . . . . . . . . . . . . . . . . . . . . . . . . . . . . . . . . . . . . . . 20
Continuous Wave and Pulse Light Sources . . . . . . . . . . . . . . . . . . . . . . . . . . . . . . . . . . . . . . . . 20Power Effects . . . . . . . . . . . . . . . . . . . . . . . . . . . . . . . . . . . . . . . . . . . . . . . . . . . . . . . . . . . . . . . 21
Measurement Volume Discrimination . . . . . . . . . . . . . . . . . . . . . . . . . . . . . . . . . . . . . . . . . . . . . . . 21

iv
Masking . . . . . . . . . . . . . . . . . . . . . . . . . . . . . . . . . . . . . . . . . . . . . . . . . . . . . . . . . . . . . . . . . . . 21Focusing . . . . . . . . . . . . . . . . . . . . . . . . . . . . . . . . . . . . . . . . . . . . . . . . . . . . . . . . . . . . . . . . . . . 22Range Gating . . . . . . . . . . . . . . . . . . . . . . . . . . . . . . . . . . . . . . . . . . . . . . . . . . . . . . . . . . . . . . . 23
Light Scattering. . . . . . . . . . . . . . . . . . . . . . . . . . . . . . . . . . . . . . . . . . . . . . . . . . . . . . . . . . . . . . . . . 25Molecular Scattering. . . . . . . . . . . . . . . . . . . . . . . . . . . . . . . . . . . . . . . . . . . . . . . . . . . . . . . . . . 25
Characteristics of molecular scattered light . . . . . . . . . . . . . . . . . . . . . . . . . . . . . . . . . . . . . 26Molecular density variation in the atmosphere. . . . . . . . . . . . . . . . . . . . . . . . . . . . . . . . . . . 27
Aerosol Scattering. . . . . . . . . . . . . . . . . . . . . . . . . . . . . . . . . . . . . . . . . . . . . . . . . . . . . . . . . . . . 27Scattering from aerosols much smaller than the wavelength . . . . . . . . . . . . . . . . . . . . . . . . 28Scattering from particles with sizes on the order of the wavelength . . . . . . . . . . . . . . . . . . 28Scattering from aerosols with sizes larger than the wavelength . . . . . . . . . . . . . . . . . . . . . . 29
Characteristics of Scattered Light From an Ensemble of Aerosols . . . . . . . . . . . . . . . . . . . . . . 30Aerosol Distribution in the Atmosphere. . . . . . . . . . . . . . . . . . . . . . . . . . . . . . . . . . . . . . . . . . . 30
Detection . . . . . . . . . . . . . . . . . . . . . . . . . . . . . . . . . . . . . . . . . . . . . . . . . . . . . . . . . . . . . . . . . . . . . . 31Signal Processing . . . . . . . . . . . . . . . . . . . . . . . . . . . . . . . . . . . . . . . . . . . . . . . . . . . . . . . . . . . . . . . 32
Coherent Processing . . . . . . . . . . . . . . . . . . . . . . . . . . . . . . . . . . . . . . . . . . . . . . . . . . . . . . . . . . 33Direct Processing of Doppler Shifts . . . . . . . . . . . . . . . . . . . . . . . . . . . . . . . . . . . . . . . . . . . . . . 34Pulsed Operation Signal Processing . . . . . . . . . . . . . . . . . . . . . . . . . . . . . . . . . . . . . . . . . . . . . . 35Reduction of Effects of Sun Light . . . . . . . . . . . . . . . . . . . . . . . . . . . . . . . . . . . . . . . . . . . . . . . 35Signal Processing and Detection Challenges . . . . . . . . . . . . . . . . . . . . . . . . . . . . . . . . . . . . . . . 35
Summary . . . . . . . . . . . . . . . . . . . . . . . . . . . . . . . . . . . . . . . . . . . . . . . . . . . . . . . . . . . . . . . . . . . . . . 36
SYSTEM COMPONENTS. . . . . . . . . . . . . . . . . . . . . . . . . . . . . . . . . . . . . . . . . . . . . . . . . . . . . . . . . . . 37Introduction. . . . . . . . . . . . . . . . . . . . . . . . . . . . . . . . . . . . . . . . . . . . . . . . . . . . . . . . . . . . . . . . . . . . 37Optical Components . . . . . . . . . . . . . . . . . . . . . . . . . . . . . . . . . . . . . . . . . . . . . . . . . . . . . . . . . . . . . 37
Laser . . . . . . . . . . . . . . . . . . . . . . . . . . . . . . . . . . . . . . . . . . . . . . . . . . . . . . . . . . . . . . . . . . . . . . 37Detector. . . . . . . . . . . . . . . . . . . . . . . . . . . . . . . . . . . . . . . . . . . . . . . . . . . . . . . . . . . . . . . . . . . . 39Lenses . . . . . . . . . . . . . . . . . . . . . . . . . . . . . . . . . . . . . . . . . . . . . . . . . . . . . . . . . . . . . . . . . . . . . 40Windows . . . . . . . . . . . . . . . . . . . . . . . . . . . . . . . . . . . . . . . . . . . . . . . . . . . . . . . . . . . . . . . . . . . 40Filters . . . . . . . . . . . . . . . . . . . . . . . . . . . . . . . . . . . . . . . . . . . . . . . . . . . . . . . . . . . . . . . . . . . . . 40Optical Frequency Shifter . . . . . . . . . . . . . . . . . . . . . . . . . . . . . . . . . . . . . . . . . . . . . . . . . . . . . . 40
Mechanical Construction . . . . . . . . . . . . . . . . . . . . . . . . . . . . . . . . . . . . . . . . . . . . . . . . . . . . . . . . . 41Signal Processors . . . . . . . . . . . . . . . . . . . . . . . . . . . . . . . . . . . . . . . . . . . . . . . . . . . . . . . . . . . . . . . 41
Coherent Detection Signal Processors . . . . . . . . . . . . . . . . . . . . . . . . . . . . . . . . . . . . . . . . . . . . 41Burst Frequency Signal Processors. . . . . . . . . . . . . . . . . . . . . . . . . . . . . . . . . . . . . . . . . . . . . . . 42
LASER ANEMOMETER CONFIGURATIONS. . . . . . . . . . . . . . . . . . . . . . . . . . . . . . . . . . . . . . . . . . 43Introduction. . . . . . . . . . . . . . . . . . . . . . . . . . . . . . . . . . . . . . . . . . . . . . . . . . . . . . . . . . . . . . . . . . . . 43Doppler Anemometry . . . . . . . . . . . . . . . . . . . . . . . . . . . . . . . . . . . . . . . . . . . . . . . . . . . . . . . . . . . . 44
Reference-Beam Anemometer . . . . . . . . . . . . . . . . . . . . . . . . . . . . . . . . . . . . . . . . . . . . . . . . . . 45Dual-Beam Laser Doppler Anemometer . . . . . . . . . . . . . . . . . . . . . . . . . . . . . . . . . . . . . . . . . . 48

v
Spectrometric Velocimetry . . . . . . . . . . . . . . . . . . . . . . . . . . . . . . . . . . . . . . . . . . . . . . . . . . . . . 49Doppler Global Velocimetry . . . . . . . . . . . . . . . . . . . . . . . . . . . . . . . . . . . . . . . . . . . . . . . . . . . 50
Laser Transit Anemometry . . . . . . . . . . . . . . . . . . . . . . . . . . . . . . . . . . . . . . . . . . . . . . . . . . . . . . . . 52Laser Two-Focus Anemometer (L2F) . . . . . . . . . . . . . . . . . . . . . . . . . . . . . . . . . . . . . . . . . . . . 52Sheet-Pair Anemometer . . . . . . . . . . . . . . . . . . . . . . . . . . . . . . . . . . . . . . . . . . . . . . . . . . . . . . . 53
Detecting aerosol presence . . . . . . . . . . . . . . . . . . . . . . . . . . . . . . . . . . . . . . . . . . . . . . . . . . 54Correlating events to establish time-of-flight . . . . . . . . . . . . . . . . . . . . . . . . . . . . . . . . . . . . 54
Particle Image Velocimetry (PIV) . . . . . . . . . . . . . . . . . . . . . . . . . . . . . . . . . . . . . . . . . . . . . . . 55
APPLICATIONS . . . . . . . . . . . . . . . . . . . . . . . . . . . . . . . . . . . . . . . . . . . . . . . . . . . . . . . . . . . . . . . . . . 56Introduction. . . . . . . . . . . . . . . . . . . . . . . . . . . . . . . . . . . . . . . . . . . . . . . . . . . . . . . . . . . . . . . . . . . . 56Air Data Systems . . . . . . . . . . . . . . . . . . . . . . . . . . . . . . . . . . . . . . . . . . . . . . . . . . . . . . . . . . . . . . . 56Safety Systems . . . . . . . . . . . . . . . . . . . . . . . . . . . . . . . . . . . . . . . . . . . . . . . . . . . . . . . . . . . . . . . . . 57Aerodynamic Investigations . . . . . . . . . . . . . . . . . . . . . . . . . . . . . . . . . . . . . . . . . . . . . . . . . . . . . . . 58Atmospheric Research . . . . . . . . . . . . . . . . . . . . . . . . . . . . . . . . . . . . . . . . . . . . . . . . . . . . . . . . . . . 58Parachute Drop Accuracy Improvement. . . . . . . . . . . . . . . . . . . . . . . . . . . . . . . . . . . . . . . . . . . . . . 58
EXISTING SYSTEMS . . . . . . . . . . . . . . . . . . . . . . . . . . . . . . . . . . . . . . . . . . . . . . . . . . . . . . . . . . . . . . 59Introduction. . . . . . . . . . . . . . . . . . . . . . . . . . . . . . . . . . . . . . . . . . . . . . . . . . . . . . . . . . . . . . . . . . . . 59Air Data System Calibration and Air Data Operational Measurement. . . . . . . . . . . . . . . . . . . . . . . 59
Thales Air Data Calibration System . . . . . . . . . . . . . . . . . . . . . . . . . . . . . . . . . . . . . . . . . . . . . . 59Boeing Doppler Lidar Airspeed System. . . . . . . . . . . . . . . . . . . . . . . . . . . . . . . . . . . . . . . . . . . 61Michigan Aerospace Molecular Optical Air Data System (MOADS) . . . . . . . . . . . . . . . . . . . . 64
Warning System for Atmospheric Threat . . . . . . . . . . . . . . . . . . . . . . . . . . . . . . . . . . . . . . . . . . . . . 67Thales Wake Vortex System. . . . . . . . . . . . . . . . . . . . . . . . . . . . . . . . . . . . . . . . . . . . . . . . . . . . 67ACLAIM Airborne Forward-Looking Turbulence Warning System. . . . . . . . . . . . . . . . . . . . . 69
Near Flow Field Investigation . . . . . . . . . . . . . . . . . . . . . . . . . . . . . . . . . . . . . . . . . . . . . . . . . . . . . 71
FUTURE PROSPECTS AND DIRECTIONS . . . . . . . . . . . . . . . . . . . . . . . . . . . . . . . . . . . . . . . . . . . . 74Introduction. . . . . . . . . . . . . . . . . . . . . . . . . . . . . . . . . . . . . . . . . . . . . . . . . . . . . . . . . . . . . . . . . . . . 74The Need Perspective . . . . . . . . . . . . . . . . . . . . . . . . . . . . . . . . . . . . . . . . . . . . . . . . . . . . . . . . . . . . 74The New Technology Perspective . . . . . . . . . . . . . . . . . . . . . . . . . . . . . . . . . . . . . . . . . . . . . . . . . . 75Concluding Remark . . . . . . . . . . . . . . . . . . . . . . . . . . . . . . . . . . . . . . . . . . . . . . . . . . . . . . . . . . . . . 75
REFERENCES . . . . . . . . . . . . . . . . . . . . . . . . . . . . . . . . . . . . . . . . . . . . . . . . . . . . . . . . . . . . . . . . . . . . 76References Cited in Text. . . . . . . . . . . . . . . . . . . . . . . . . . . . . . . . . . . . . . . . . . . . . . . . . . . . . . . . . . 76Bibliography . . . . . . . . . . . . . . . . . . . . . . . . . . . . . . . . . . . . . . . . . . . . . . . . . . . . . . . . . . . . . . . . . . . 81Section-Specific Breakdown for Further Reading . . . . . . . . . . . . . . . . . . . . . . . . . . . . . . . . . . . . . . 88
Introduction. . . . . . . . . . . . . . . . . . . . . . . . . . . . . . . . . . . . . . . . . . . . . . . . . . . . . . . . . . . . . . . . . 88Basic Principles. . . . . . . . . . . . . . . . . . . . . . . . . . . . . . . . . . . . . . . . . . . . . . . . . . . . . . . . . . . . . . 89System Components . . . . . . . . . . . . . . . . . . . . . . . . . . . . . . . . . . . . . . . . . . . . . . . . . . . . . . . . . . 89Laser Anemometer Configurations. . . . . . . . . . . . . . . . . . . . . . . . . . . . . . . . . . . . . . . . . . . . . . . 89

vi
Applications . . . . . . . . . . . . . . . . . . . . . . . . . . . . . . . . . . . . . . . . . . . . . . . . . . . . . . . . . . . . . . . . 89Existing Systems. . . . . . . . . . . . . . . . . . . . . . . . . . . . . . . . . . . . . . . . . . . . . . . . . . . . . . . . . . . . . 89
TABLES
1. Early optical-based flight flow measurement systems . . . . . . . . . . . . . . . . . . . . . . . . . . . . . . . . . . . . . 5
2. Compilation of laser materials . . . . . . . . . . . . . . . . . . . . . . . . . . . . . . . . . . . . . . . . . . . . . . . . . . . . . . 38
3. Compilation of light detectors . . . . . . . . . . . . . . . . . . . . . . . . . . . . . . . . . . . . . . . . . . . . . . . . . . . . . . 39
4. Anemometer configurations . . . . . . . . . . . . . . . . . . . . . . . . . . . . . . . . . . . . . . . . . . . . . . . . . . . . . . . . 44
5. Overview of applications and measurement techniques applied . . . . . . . . . . . . . . . . . . . . . . . . . . . . 56
6. Characteristics of the ALEV 3 system . . . . . . . . . . . . . . . . . . . . . . . . . . . . . . . . . . . . . . . . . . . . . . . . 61
7. Characteristics of the Boeing Doppler lidar airspeed system . . . . . . . . . . . . . . . . . . . . . . . . . . . . . . . 62
8. Characteristics of the Michigan Aerospace Molecular Optical Air Data Sensor (MOADS) . . . . . . . 65
9. Characteristics of the ACLAIM forward-looking turbulence warning system . . . . . . . . . . . . . . . . . 69
10. Characteristics of the dual-beam laser Doppler anemometer . . . . . . . . . . . . . . . . . . . . . . . . . . . . . . 72
FIGURES
1. Generic block diagram of an in-flight flow measurement system . . . . . . . . . . . . . . . . . . . . . . . . . . . 19
2. Masking used to define measurement volume . . . . . . . . . . . . . . . . . . . . . . . . . . . . . . . . . . . . . . . . . . 22
3. Range-gated measurement volume . . . . . . . . . . . . . . . . . . . . . . . . . . . . . . . . . . . . . . . . . . . . . . . . . . . 24
4. UV atmospheric scattering with both molecular and aerosol scattering. . . . . . . . . . . . . . . . . . . . . . . 27
5. Mie scattering . . . . . . . . . . . . . . . . . . . . . . . . . . . . . . . . . . . . . . . . . . . . . . . . . . . . . . . . . . . . . . . . . . . 28
6. Variation of backscatter values in the natural atmosphere . . . . . . . . . . . . . . . . . . . . . . . . . . . . . . . . . 31
7. Flight-qualified real-time advanced signal processor (RASP) and display . . . . . . . . . . . . . . . . . . . . 42
8. Digital signal processing block diagram. . . . . . . . . . . . . . . . . . . . . . . . . . . . . . . . . . . . . . . . . . . . . . . 42
9. The monostatic reference-beam configuration in backscatter . . . . . . . . . . . . . . . . . . . . . . . . . . . . . . 45
10. Bistatic reference-beam laser velocimeter system . . . . . . . . . . . . . . . . . . . . . . . . . . . . . . . . . . . . . . 47
11. The dual-beam laser Doppler configuration . . . . . . . . . . . . . . . . . . . . . . . . . . . . . . . . . . . . . . . . . . . 48
12. Transfer function of the iodine vapor cell. . . . . . . . . . . . . . . . . . . . . . . . . . . . . . . . . . . . . . . . . . . . . 51
13. Doppler global velocimeter layout . . . . . . . . . . . . . . . . . . . . . . . . . . . . . . . . . . . . . . . . . . . . . . . . . . 52
14. The laser two-focus configuration . . . . . . . . . . . . . . . . . . . . . . . . . . . . . . . . . . . . . . . . . . . . . . . . . . 53
15. The sheet-pair anemometer configuration . . . . . . . . . . . . . . . . . . . . . . . . . . . . . . . . . . . . . . . . . . . . 54
16. Typical location of measurement volumes . . . . . . . . . . . . . . . . . . . . . . . . . . . . . . . . . . . . . . . . . . . . 60
17. Installation of ALEV 3 system in the Airbus A340 . . . . . . . . . . . . . . . . . . . . . . . . . . . . . . . . . . . . . 60

vii
18. Detection volume geometry . . . . . . . . . . . . . . . . . . . . . . . . . . . . . . . . . . . . . . . . . . . . . . . . . . . . . . . 63
19. Continuous-wave Doppler lidar brass board configuration . . . . . . . . . . . . . . . . . . . . . . . . . . . . . . . 63
20. MOADS prototype optical head and signal processor and detector . . . . . . . . . . . . . . . . . . . . . . . . . 67
21. Images of vortices obtained with the ground-based demonstrator . . . . . . . . . . . . . . . . . . . . . . . . . . 68
22. Folding mirror housing on the Electra test bed aircraft . . . . . . . . . . . . . . . . . . . . . . . . . . . . . . . . . . 71
23. Aircraft normal acceleration and lidar velocity standard deviation . . . . . . . . . . . . . . . . . . . . . . . . . 71
24. Normalized air velocities measured with dual-beam LDA in the boundary layer . . . . . . . . . . . . . . 73

viii
ACKNOWLEDGMENTS
The authors are indebted to the many researchers in the field of optical measurements who hostedfact-finding visits, willingly sharing their experience, and provided comments on the narrative text toimprove the technical accuracy and the readability of the final product. Although there are manyreference publications on optical theory, applying this theory in the flight environment requiresknowledge from many other disciplines, most notably aeronautics, meteorology, atmospheric science,aerodynamics, signal processing, and mechanical design. A store of experience (in many casesexperience in what did NOT work) is very valuable to the researcher in avoiding unproductive activitiesthat do not yield useful results. The authors have incorporated comments reflecting the experience ofmany contributing researchers to provide guidance for the design of new systems that can acquire reliableoptically based measurement in flight. Mr. James Meyers from NASA Langley Research Center,Hampton, Virginia was particularly helpful in providing information and feedback on the text. Othersproviding information and comments were:
Mr. Guy Destarac, Mr. Franck Innarelli – Airbus Industry, Toulouse, France
Mr. Rick McGann, Dr. David Soreide – The Boeing Company, Seattle, WA, US
Dr. Stephan Damp and Dr. Hans Pfeifer – French-German Research Institute ISL, Saint-Louis, France
Dr. Steven Hannon – Coherent Technologies Inc., Lafayette, CO, US
Mr. Friedrich Köpp – DLR, Oberpfaffenhofen, Germany
Mr. Wolfgang Förster, Dr. Chris Willert, Mr. Manfred Beversdorff – DLR, Cologne, Germany
Mr. Richard Richmond – US Air Force, Wright-Patterson Air Force Base, Ohio, US
Mr. Hubert Combe – Thales, Valence, France
Mr. Peter Tchoryk – Michigan Aerospace Corporation, Ann Arbor, MI, US
ABSTRACT
This document has been written to assist the flight-test engineer and researcher in using optical flowmeasurements in flight applications. The emphasis is on describing tradeoffs in system design to providedesired measurement performance as currently understood. Optical system components are discussedwith examples that illustrate the issues. The document concludes with descriptions of opticalmeasurement systems designed for a variety of applications including aeronautics research, airspeedmeasurement, and turbulence hazard detection. Theoretical discussion is minimized, but numerousreferences are provided to supply ample opportunity for the reader to understand the theoreticalunderpinning of optical concepts.
NOMENCLATURE
Acronyms and Abbreviations
A/D analog to digital
ACLAIM airborne coherent lidar for advanced in-flight measurements
AGARDographAdvanced Guidance for Alliance Research and Development volume
ALEV Anémomètre Laser en Vol (Airborne Laser Velocimeter)
ANSI American National Standards Institute, District of Columbia, U. S.
AoA angle of attack
AoS angle of sideslip
ATADS Advanced Technology Air Data System
CLIO circle-to-line image optic
CLR coherent laser radar
CTI Coherent Technologies, Inc., Lafayette, CO, US
CW continuous-wave
DGV Doppler global velocimetry
DLR German Aerospace Center DLR, Germany
DSP digital signal processor
EADS European Aeronautic Defence and Space Company
EML enhanced mode lidar
FFT fast Fourier transform
FL flight level
IR infrared
ISL Institut Saint-Louis (French-German Research Institute), France

2
JOADS joint optical air data system
L2F laser two-focus anemometer
ladar laser detection and ranging
laser light amplification through stimulated emission of radiation
LDA laser Doppler anemometry (a type of dual-beam Doppler)
LDV laser Doppler velocimetry (a type of dual-beam Doppler)
LED light emitting diode
lidar light detection and ranging
LIF laser induced fluorescence
LTA laser transit anemometry
MEMS microelectromechanical systems
MFLAME multifunction future laser atmospheric measurement equipment
MOADS molecular optical air data sensor
MPE maximum permissible exposure
NASA National Aeronautics and Space Administration, US
NCAR National Center for Atmospheric Research, Boulder, Colorado, US
NLR National Aerospace Laboratory, NLR, The Netherlands
PDV planar Doppler velocimetry
PIV particle image velocimetry
PMT photomultiplier tube
RASP real-time advanced signal processor
RTO Research and Technology Organization
SCI Systems Concepts and Integration, one of eight RTO panels
SL sea level
SNR signal-to-noise ratio
TAS true airspeed
UN United Nations
US United States of America
USAF United States Air Force
UV ultraviolet
VFO variable frequency oscillator
W watt
3
Symbols
B system bandwidth, Hz
c speed of light, electromagnetic constant, m/sec
d
distance between light sheets, m
D
effective optical diameter of lens or telescope, m
e energy, J
f frequency, Hz
f
focal distance of collecting optic, m
f
D
frequency of intensity fluctuations on a detector that result from the Doppler effect, Hz
h
Planck’s constant,
I scattered light intensity, W/m
2
I
0
light beam intensity, W/m
2
illumination direction, unit vector
wave number, vector, m
–1
scattered wave number, vector component in direction s, m
–1
L
range, m
observation direction, unit vector
P
T
transmitted light power, W
r
distance, m
R effective optical radius of lens or telescope, m
s distance between fringes, m
velocity vector, m/sec
v
los
velocity component in the line-of-sight direction (parallel to the light beam), m/sec
v
⊥
velocity component in the direction perpendicular to the line-of-sight, m/sec
w
0
beam waist diameter, m
α
angle between beams in dual beam laser Doppler configuration, rad
polarizability
βπ
atmospheric backscatter coefficient, m
–1
sr
–1
δ
f frequency change of light, Hz
wave vector change of light, caused by scattering, m
–1
∆
L measurement volume length, m
∆
t time interval, sec
η
detector quantum efficiency
6.55 1027–× erg/sec
i
k
ks
o
v
α
δk
4
ν
frequency, Hz
λ
wavelength of light, m
θ
angle between laser beam axis and axis of light collection optics in DGV systems, rad
INTRODUCTION
Background
The goal of this report is to provide an introductory practical overview of in-flight optical flowmeasurement techniques. This document is written to aid an instrumentation engineer or researchscientist in making non-intrusive flow measurements on an aircraft. It is hoped that this document will beparticularly useful for the technologist with a limited background in optical theory and limited experiencein applying optical technology. The experience of the authors and numerous other contributors has beeninfused here to provide guidance in avoiding expensive non-productive diversions that can occur whenapplying optical technology for the first time in the flight environment. This report provides basicknowledge and techniques necessary for assessing the applicability of optical measurements andaddressing effective optical measurement techniques in flight. Key aspects of optical measurements arediscussed and the tradeoffs are identified, as they are currently understood. Basic components of opticalmeasurement systems are discussed and key requirements are identified. Specific systems designed for avariety of applications are discussed to provide insight for the reader.
History
For many years, optical methods have been extensively used to perform detailed flow velocitymeasurements in wind tunnels. Non-intrusive optically based measurements have given researchersinsight into the details of fluid dynamics that could not be obtained with any other technique. Withoptical methods, the researcher can be confident that the measurement process has not disturbed thecondition being measured, and can therefore concentrate on results assessment instead of on developingcalibrations or corrections for measurement-induced flow disturbances. The wind tunnel environment,being ground-based, affords ample space and power for equipment operation. Laser beams can be safelycontrolled in a ground situation. The air in a wind tunnel, unlike the free atmosphere in-flight, is confinedso special operations (like seeding the flow with optical tracer particles) can be utilized. The enclosuresof wind tunnels restrict the entry of light radiation from extraneous natural or artificial sources, therebypreserving the signal-to-noise ratio in the ground situation. For many of these reasons, the use of opticalmethods has become routine and one or more laser-based velocimetry systems have become standardfixtures for most production wind tunnels, on a worldwide basis. As conditions are often less favorablefor aircraft in-flight testing, optical techniques have been less practical for flight applications.
Notwithstanding the difficulties in applying optical velocity measurements in flight testing, severalsystems were developed and operated, beginning in the early 1970s. About this time, carbon dioxide gaslasers (operating in the far infrared, at a wavelength near 10
µ
m) were developed that had the necessarycoherence length to be able to generate a reliable Doppler frequency shift from aerosol backscatterthrough a coherent detector. These reference-beam systems measure flow velocity along the axis of thelaser beam. Efficient systems at this wavelength require cryogenically cooled detectors, a limiting factor
5
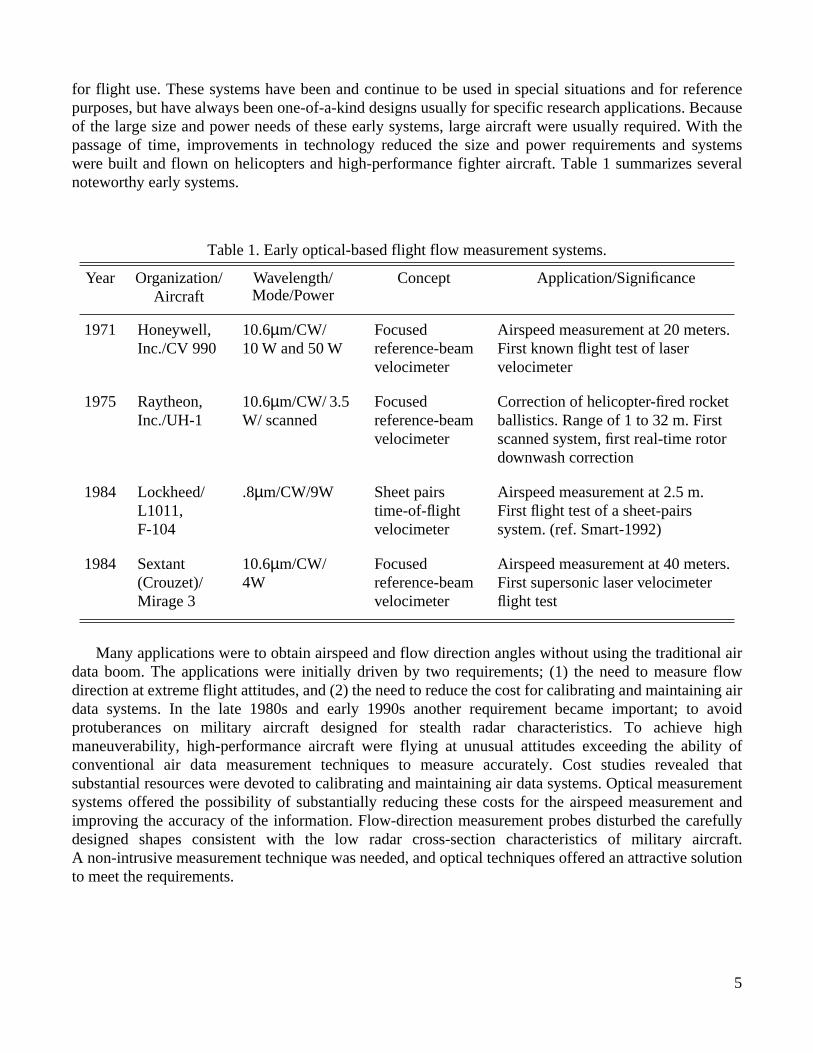
for flight use. These systems have been and continue to be used in special situations and for referencepurposes, but have always been one-of-a-kind designs usually for specific research applications. Becauseof the large size and power needs of these early systems, large aircraft were usually required. With thepassage of time, improvements in technology reduced the size and power requirements and systemswere built and flown on helicopters and high-performance fighter aircraft. Table 1 summarizes severalnoteworthy early systems.
Many applications were to obtain airspeed and flow direction angles without using the traditional airdata boom. The applications were initially driven by two requirements; (1) the need to measure flowdirection at extreme flight attitudes, and (2) the need to reduce the cost for calibrating and maintaining airdata systems. In the late 1980s and early 1990s another requirement became important; to avoidprotuberances on military aircraft designed for stealth radar characteristics. To achieve highmaneuverability, high-performance aircraft were flying at unusual attitudes exceeding the ability ofconventional air data measurement techniques to measure accurately. Cost studies revealed thatsubstantial resources were devoted to calibrating and maintaining air data systems. Optical measurementsystems offered the possibility of substantially reducing these costs for the airspeed measurement andimproving the accuracy of the information. Flow-direction measurement probes disturbed the carefullydesigned shapes consistent with the low radar cross-section characteristics of military aircraft.A non-intrusive measurement technique was needed, and optical techniques offered an attractive solutionto meet the requirements.
Table 1. Early optical-based flight flow measurement systems.
Year Organization/Aircraft
Wavelength/Mode/Power
Concept Application/Significance
1971 Honeywell, Inc./CV 990
10.6
µ
m/CW/10 W and 50 W
Focused reference-beam velocimeter
Airspeed measurement at 20 meters. First known flight test of laser velocimeter
1975 Raytheon, Inc./UH-1
10.6
µ
m/CW/ 3.5 W/ scanned
Focused reference-beam velocimeter
Correction of helicopter-fired rocket ballistics. Range of 1 to 32 m. First scanned system, first real-time rotor downwash correction
1984 Lockheed/ L1011, F-104
.8
µ
m/CW/9W Sheet pairs time-of-flight velocimeter
Airspeed measurement at 2.5 m. First flight test of a sheet-pairs system. (ref. Smart-1992)
1984 Sextant (Crouzet)/ Mirage 3
10.6
µ
m/CW/4W
Focused reference-beam velocimeter
Airspeed measurement at 40 meters. First supersonic laser velocimeter flight test
6
Challenges for Flight Applications
Moving from a controlled environment in a wind tunnel to a less-controlled setting in flight bringsadditional challenges, not all of which are addressed by improvements in technology. Some of thechallenges in the flight applications are described below.
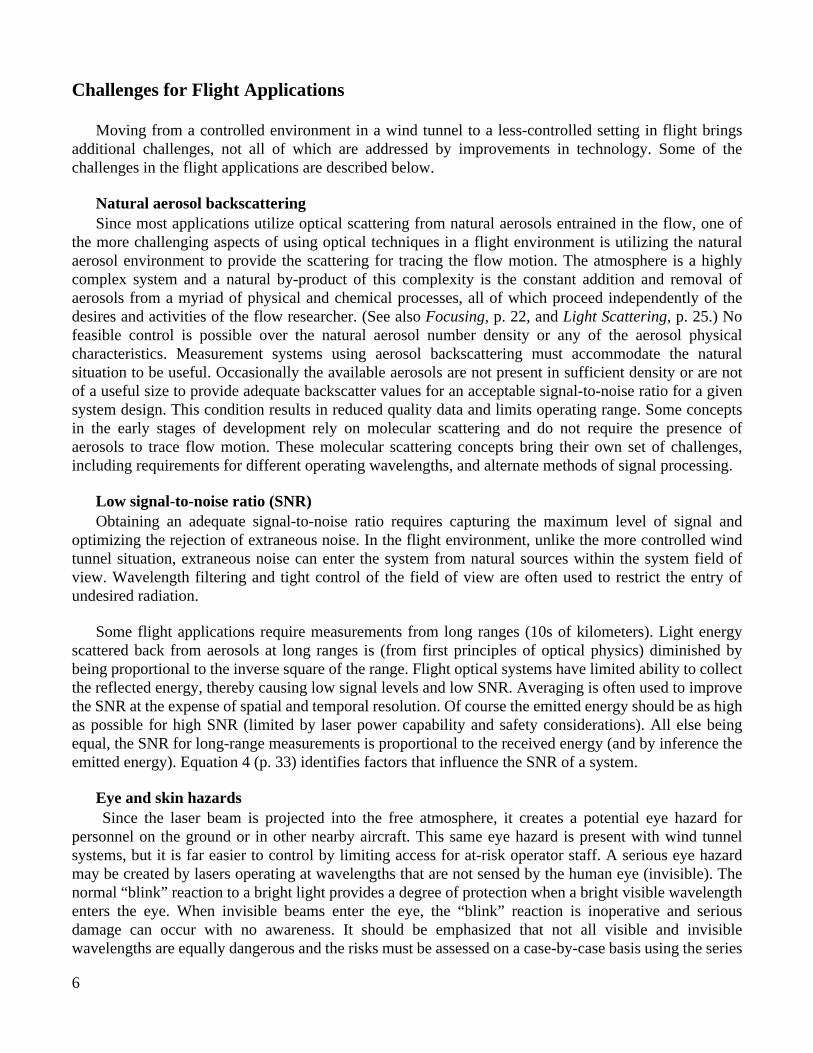
Natural aerosol backscattering
Since most applications utilize optical scattering from natural aerosols entrained in the flow, one ofthe more challenging aspects of using optical techniques in a flight environment is utilizing the naturalaerosol environment to provide the scattering for tracing the flow motion. The atmosphere is a highlycomplex system and a natural by-product of this complexity is the constant addition and removal ofaerosols from a myriad of physical and chemical processes, all of which proceed independently of thedesires and activities of the flow researcher. (See also
Focusing
, p. 22, and
Light Scattering
, p. 25.) Nofeasible control is possible over the natural aerosol number density or any of the aerosol physicalcharacteristics. Measurement systems using aerosol backscattering must accommodate the naturalsituation to be useful. Occasionally the available aerosols are not present in sufficient density or are notof a useful size to provide adequate backscatter values for an acceptable signal-to-noise ratio for a givensystem design. This condition results in reduced quality data and limits operating range. Some conceptsin the early stages of development rely on molecular scattering and do not require the presence ofaerosols to trace flow motion. These molecular scattering concepts bring their own set of challenges,including requirements for different operating wavelengths, and alternate methods of signal processing.
Low signal-to-noise ratio (SNR)
Obtaining an adequate signal-to-noise ratio requires capturing the maximum level of signal andoptimizing the rejection of extraneous noise. In the flight environment, unlike the more controlled windtunnel situation, extraneous noise can enter the system from natural sources within the system field ofview. Wavelength filtering and tight control of the field of view are often used to restrict the entry ofundesired radiation.
Some flight applications require measurements from long ranges (10s of kilometers). Light energyscattered back from aerosols at long ranges is (from first principles of optical physics) diminished bybeing proportional to the inverse square of the range. Flight optical systems have limited ability to collectthe reflected energy, thereby causing low signal levels and low SNR. Averaging is often used to improvethe SNR at the expense of spatial and temporal resolution. Of course the emitted energy should be as highas possible for high SNR (limited by laser power capability and safety considerations). All else beingequal, the SNR for long-range measurements is proportional to the received energy (and by inference theemitted energy). Equation 4 (p. 33) identifies factors that influence the SNR of a system.
Eye and skin hazards
Since the laser beam is projected into the free atmosphere, it creates a potential eye hazard forpersonnel on the ground or in other nearby aircraft. This same eye hazard is present with wind tunnelsystems, but it is far easier to control by limiting access for at-risk operator staff. A serious eye hazardmay be created by lasers operating at wavelengths that are not sensed by the human eye (invisible). Thenormal “blink” reaction to a bright light provides a degree of protection when a bright visible wavelengthenters the eye. When invisible beams enter the eye, the “blink” reaction is inoperative and seriousdamage can occur with no awareness. It should be emphasized that not all visible and invisiblewavelengths are equally dangerous and the risks must be assessed on a case-by-case basis using the series

7
Z136 of ANSI standards or other applicable national standards. The subject of eye hazards is an evolvingarea and the series Z136 standards are updated on a regular basis. For example, flash blindness, glare, andstartle reactions associated with low levels of laser energy are covered in a US Government publicationANSI Z136.6
Standard for the Safe Use of Lasers Outdoors
,
1
a particularly applicable reference. Anotherreference is the publication standard ANSI Z136.1
Safe Use of Lasers
2
for readers involved in the designand operation of laser-based flow measurement systems for flight use.
It is important that the most recent version of the appropriate standard be used during a designproject and for developing safety procedures to protect system operators. If system developershave limited expertise in laser technology it is advisable to seek the services of a consultant toassure that laser safety matters are properly addressed.
Assessing the hazard for a laser measurement system is a complex process that involves severalfactors, including power output, wavelength, mode of operation (continuous wave or pulse), pulseduration, and aperture (or cone angle). This process involves the use of a wavelength-based maximumirradiance, which is termed the maximum permissible exposure (MPE). For minimum risk, the lasershould qualify as a Class I, which causes no damage to either vision or skin under continuous exposure.Lasers in Class II may often be applied with limited restrictions as a result of the natural blink reaction.Laser system operators are required to undergo eye examinations prior to initial service as an operator,and periodically as long as the service continues.
Most in-flight measurements have used infrared laser sources. There is some safety advantage tousing wavelengths longer than 1.4 micrometers since the cornea and the vitreous humor in the eye absorba substantial fraction of the incident energy prior to its reaching the retina. Irradiances at wavelengthsbeyond 1.4 micrometers result in MPE levels on the order of 15 times the levels in the visible range. Thismeans that about 15 times the power level at visible wavelengths can be used and the laser source canstill qualify as a Class I. The term “eye-safe” is sometimes applied for laser radiation with wavelengthsbeyond 1.4 micrometers, but as explained, this is a simplification because both the power level andwavelength must be specified to qualify as “eye-safe.” Although it is theoretically possible to cause eyedamage from radiated laser light from an aircraft in flight, the authors know of no injuries caused byaccidental in-flight laser radiation. For class III and class IV lasers, overall system safety is moreeffective with an emphasis on development of safe system maintenance procedures and disabling thelaser against accidental activation on the ground.
Newer systems using molecular backscatter require shorter wavelengths in the ultraviolet (UV) range.Compared to visible wavelengths, the eye is much less tolerant of shortwave ultraviolet radiation(especially below about .3 micrometers). For ultraviolet light (and to a lesser degree for all radiation) theeffects of radiation effects on the skin should also be taken into account. (See the ANSI standards notedearlier in this section.)
Component Technology Developments
As suggested in the prior section, the practicality of using optical measurements in flight is stronglylimited by the available technology of the system components. Therefore, improvement in componenttechnology often paces flight applications. Improvement in optics and signal processing technology aswell as the widespread availability of powerful, rugged, and compact computer technology has openeddoors to many flight applications not previously feasible.
8
Optical state-of-the-art technology
State-of-the-art developments in optical technology, primarily in the area of solid-state lasers,detectors, and integrated optics make possible small, power-efficient systems that can be used in flight.Solid-state lasers that operate at near-infrared wavelengths are much less dangerous to the eye than otherswith visible outputs and are rapidly becoming available, spurred on by requirements from thecommunications industry for components and systems optimized for these wavelengths. Wavelengthslonger than 1.3 micrometers have received relatively more attention, at least for long-rangemeasurements. Most solid-state lasers are substantially more efficient and more compact than earlier gasor dye lasers; therefore, less power is required for operation and the resulting smaller systems can beinstalled within the restricted space and power constraints typical of most aircraft. An often overlookedside benefit to more efficient systems is the reduced heat that must be dissipated. The more effectivesystems enable flow measurement with optical techniques in flight, thereby introducing to flightapplications the advantages previously only experienced in the wind tunnel. In addition to the advantagesfor fluid dynamics research, optical flow measurement gives the potential for less disturbance to air datameasurements and to measurements of the atmosphere in the vicinity of the aircraft. Examples of theseapplications are turbulence and wind shear detection systems under development. 1-micrometer Nd:YAGlasers using non-linear quadrupling crystals operate at .25 micrometers in the ultraviolet spectrum andmake use of the increased molecular scattering at the shorter wavelength. While posing a risk of eyedamage, these UV systems can provide non-intrusive measures of ambient air temperature and density.These measurements round out the full suite of “air data” parameters that are needed by most flightvehicles. Conventional temperature and pressure probes introduce errors resulting from the flight vehiclemotion in the atmosphere, while the UV-based measurement approach avoids this particular source oferror.
Signal processing
Improved high-speed signal processing capability, primarily from electronic digital signal processors,provides detailed test results in real time. This allows applications in operational flight settings whereresults must be rapidly analyzed to support operational decisions. This capability strongly supports theresearch application by providing results to the investigator, so that an inefficient experiment protocolmay be altered quickly to obtain more effective use of expensive flight time.
Spin-off developments
In most cases, improved technology has resulted in reductions in size, and increases in efficiency forsystem components. Reductions in size usually imply reductions in weight as well. All of thesecharacteristics associated with improved technology make the application of optical measurements muchmore feasible in the flight environment. Smaller components mean smaller systems, systems that can bemore fully integrated into robust designs capable of operating in the sometimes harsh vibration andtemperature extremes encountered in flight.
Objective
The general objective of this report is to provide an introductory overview of in-flight optical flowmeasurement techniques. The focus of this report is to identify the basic knowledge and techniques thatsystem designers need to assess the applicability of optical measurements and to address effective opticalmeasurement techniques in flight. Key aspects of optical measurements in flight are discussed andtradeoffs are identified, as they are currently understood. Examples of specific applications are provided.
9
Instrumentation design engineers usually have an educational background including a major in somebranch of engineering. Understanding the principles of making optical measurements in flight requiresknowledge of basic optical concepts, electronic concepts, optoelectronic interfaces, and someunderstanding of atmospheric processes associated with natural aerosols. It is not often that an engineerwill have the necessary background knowledge in all these areas to begin effective work in acquiringoptical measurements in the flight environment immediately after an assignment has been made. Thisreport is intended to provide the initial information that will be useful in understanding the basicconcepts.
Because this is an introductory document, theoretical treatment is not emphasized and the reader isencouraged to use the references provided at the end of the document for more comprehensive anddetailed treatment of various aspects of optical flow measurements. Equations are occasionally used toillustrate relationships, but the majority of the discussion is focused on describing processes in a way thatis physically understandable for a reader with a limited background in optical theory and technology.
Organization
The volume is organized, in keeping with the objective of providing an introductory overview of thesubject, to provide a basic vocabulary and understanding of fundamental principles governing theoperation of optical flow measurement in the Introduction, Terminology and Definitions, and BasicPrinciples sections. The sections on System Components and Laser Anemometer Configurations treat theindividual components of typical optical flow measurement systems and discuss how these componentsmay be combined into operating systems. The Applications and Existing Systems sections describe howsystems may be designed for specific applications and highlight the basic requirements for theseapplications. Also reviewed are several examples of systems that have been designed for flightapplications. The Future Prospects and Directions section identifies trends in the technology for opticalmeasurements in flight and speculates on the effects this may have on future systems capabilities. Anoutline of the volume follows.
Introduction
A brief historical background of optical flow measurements in flight is reviewed for reader insight.Examples of past systems are included to provide an understanding of optical systems development overthe past 30 years as technology has progressed, in both optics and in many of the supporting disciplinesfor flight-based optical flow measurements.
Terminology and Definitions
The terminology used for the different optical flow measurement techniques in literature is notuniform. Therefore a clear definition of the terms to be used in this volume is provided. The authors haveattempted to define the terminology to conform to the definitions of the majority of authors in theliterature.

10
Basic Principles
The physical principles of optics and their implications for optical flow measurement in flight arereviewed.
Light source – Light source properties that bear on the performance of an optical measurementsystem are discussed. Factors considered include coherence, pulsing, and power effects.
Measurement volume discrimination – Several methods are considered for selecting the volume fromwhich the optical measurement is obtained. Optical methods, including focusing and masking, areconsidered as well as timing techniques that rely on pulsed sources and detector gating.
Scattering from seeded flow – All optical flow measurements being applied in flight depend on lightscattering. Basic theory concerning the light scattering is summarized. The requirements on aerosols inthe flow or molecules that comprise the flow are reviewed. Also considered are the characteristics ofscattering from an ensemble of scatterers and the effects upon the detected signal.
Detection – Detector requirements are reviewed for optical flow measurement systems. Factorsconsidered include sensitivity, frequency response, and noise characteristics.
Signal processing – Most aspects of signal processing are discussed because of the importance inoptical system performance. Signal processing before detection and after detection is reviewed. Tradeoffsfor many optical configurations and measurement applications are also discussed.
System Components
In this section an overview is provided of the essential system components encountered in opticalflow meters. The principles identified for system components in the Basic Principles section aretranslated into practical specifications.
Optical components – Optical components are reviewed, together with the interactions that occurbetween the light source, the focusing elements, the pulsing characteristics, and the detector in theseoptical systems.
Mechanical construction – For flight applications, the mechanical construction of flight systems takeson an overriding importance. Small size and stiffness of the flight system are critical for reliable in-flightoptical system operation.
Signal processor – The electrical signal from a detector must be processed to derive the flowinformation. Different signal processors are compared in order to identify tradeoffs for optimal systemperformance.
Types of Laser Anemometers
The basic forms of different laser anemometers are categorized and described. Some implicitcharacteristics are mentioned.

11
Laser Doppler anemometers – This category includes dual-beam laser Doppler anemometers,reference-beam Doppler anemometers (homodyne and heterodyne) and Doppler global velocimeters.These anemometers are based on the measurement of the frequency-shift of light being scattered on amoving particle.
Time-of-flight anemometers – The laser two-focus anemometer and the sheet-pair anemometer aredistinct members of this category. These anemometers are based on the measurement of time intervalsbetween successive scattering events on one particle.
Applications
Optical flow measurements in flight are used in several applications that set various requirements onthe anemometers. A structured overview of the various application fields follows.
Air Data Systems – Velocities derived from light scattering, just outside the range of the flowdisturbance from the aircraft, enable the calibration of air data sensors. The airspeed of the aircraft inthree components, the angle of attack, and the angle of sideslip can be determined by using this method,with a high degree of accuracy and without the use of other sensors. This is particularly useful underconditions of dynamic maneuvering and unusual flight attitudes.
Safety Hazard Detection and Atmospheric Research – By measuring the airspeed at a considerabledistance in front of the aircraft, a wind shear or turbulence hazard detection system can be created. Thisdetection can trigger procedures for protecting the aircraft occupants or a change in the setting of asupersonic aircraft engine to prevent engine inlet unstart. Clear air turbulence as well as wake vorticesnear runways can also be detected with far field anemometers. Improved passenger comfort and safetyare expected as a result of this capability.
Aerodynamic Investigations – To determine the air flow very close to the aircraft is to learn about theaerodynamics at this range. Subjects of interest in this area include flow around wing-body junctions andflow around nacelles.
Atmospheric research – To determine the wind velocity field without flying through the air massunder investigation is possible with this technology.
Parachute drop accuracy improvement – To measure wind velocity fields for the accuratedetermination of high-altitude release points for parachutes (and similarly for release points of ballisticmunitions) is another possible application of this technology.
Existing Systems
An overview of existing systems is provided, based on a literature survey and the findings fromtravels by the authors through the USA and Europe. Some examples of existing optical anemometers aredescribed in detail. Since the science (and art) of obtaining optical flow measurements in flight has notreached a mature state, some systems are included in the Existing Systems section that are designed forflight applications, but have not yet reached flight status.

12
Future Prospects and Directions
Future potential of optical flow measurements is shown in a variety of application areas. Prospects ofin-flight flow measurements may be advanced considerably by the development of suitable componentsof anemometers. The authors’ viewpoint on future trends in optical air flow measurement in flight isincluded in this section.

13
TERMINOLOGY AND DEFINITIONS
The terminology used for different optical flow measurement techniques is not uniform in theexisting literature. Therefore it is necessary to provide a clear definition of the terms used in this volume.The definitions included here attempt to conform to terminology in common use by the majority ofauthors in the literature available on this subject.
aerosol
— a microscopic solid or liquid particle in the atmosphere. Examples of natural atmosphericaerosols are; water droplets, stratospheric sulfuric acid droplets from volcanic eruptions, wind-borne dustparticles from surface sources, natural or man-made by-products of incomplete combustion, and solidby-products of natural atmospheric chemical reactions. Natural aerosols of the appropriate size and withuseful optical properties are used in optical measurements as flow tracers to determine the flow motion.Some aerosols absorb optical energy at specific wavelengths and under some circumstances these mayattenuate the optical signal strength.
backscatter coefficient
— the ratio of transmitted optical energy to energy scattered directly back tothe transmitter, normalized by length and by the collected solid-angle field of view. This parameter is theresult of optical energy scattering by molecules and an ensemble of particles entrained in an illuminatedregion of the atmosphere. This coefficient is affected by the particle number density and the particle sizerelative to the wavelength of the transmitted optical energy.
bistatic optical configuration
— an optical configuration using different optics to shape the outputpulse-beam and to collect the scattered light. Bistatic optics receive scattered light from an axis notaligned with the transmitted energy and thus provide information on flow motion along a different axis.Multiple receivers can measure several velocity components from the same region of interest and therebyprovide three velocity components.
coherence length
— the length, in the direction of the propagation of a light beam, over which thephase of light is correlated (the correlation function larger than 1/e). The coherence length is oftenspecified for a light source. Adequate coherence length is an important factor for anemometers based oninterference of light for detection. The coherence length of the light source is therefore often an importantparameter in the design of such a meter.
coherent detection
— a process that provides improved detection sensitivity to weak signal returnsin low signal-to-noise ratio (SNR) environments. The received signal is mixed with the single-frequencyreference signal from a local oscillator on the surface of a “square-law” detector to derive a beat signalwith a frequency equal to the difference frequency between the reference and the received signal. Thisprocess provides a substantial effective signal gain and a derived signal with a frequency distributionequal to the difference between the signal of interest and the reference. This difference signal isparticularly interesting (since it includes the information of interest) and effectively represents a signaltranslation from an extremely high frequency to a range much lower than the original that is moreamenable to further signal processing. An example is noise reduction through low-pass filtering. Thisprocess provides the ability to detect a narrow band of frequencies with very high Doppler frequencyresolution. Optical systems using coherent detection require precise optical alignment to transmit andreceive planar waves for optimal sensitivity and are more complex than systems using direct detection. Inthe electronic disciplines, the term “product detection” is used to describe the coherent detection process(see heterodyne and homodyne).

14
coherent laser radar (CLR)
— a term increasingly used to describe a reference beam laseranemometer; see reference beam laser anemometer (for air flow measurement applications).
continuous wave
— is a mode of system operation wherein the optical system radiates continuouslyas opposed to the pulsed mode of operation where radiation is intermittent. The continuous-wave mode ofoperation is often abbreviated “CW.”
detection
— is the process of converting the optical signal into an electrical form, so that the flowinformation can be electronically processed and extracted for analysis.
detector
— is the device that reacts to the impingement of optical energy on its surface by producingan electrical output signal. Detectors play a key role in all optical measurement systems. Importantparameters for detectors include: quantum efficiency, dark current, sensitivity, and frequency response.
differential laser Doppler anemometer
— See dual-beam laser Doppler anemometer.
digital signal processor (DSP)
— a specialized digital processor technology configured toefficiently perform algorithms commonly encountered in signal processing applications. Typicalprocesses include averaging, correlating, and time-to-frequency domain conversions. DSP technology isoften used to process flowmeter signals.
direct detection
— a process that discriminates a frequency shift (Doppler) in scattered light byoptically filtering signals before they impinge on the detector surface. A very narrow-band filter is usedto convert the scattered signal frequency into an amplitude variation. Thus the detector output amplitudebecomes a representation of the frequency shift. Optical filters that are commonly used for directdetection include optical etalons and molecular vapor cells, iodine being one of the more popular choices.
discriminator signal processing
— a signal processing technique modeled on conventionalfrequency-modulated telemetry techniques that convert frequency variations into amplitude variations.Optical discriminator signal processing relies on narrow-band filtering (usually accomplished with anetalon or a molecular filter) to provide a sharp and stable amplitude-to-frequency characteristic. (Seedirect detection.)
Doppler global velocimetry (DGV)
— (also called planar Doppler velocimetry (PDV)) a flowvelocimetry technique applying direct detection of frequency shifts of light scattered from aerosols in alight sheet. The three components of the velocity vectors can be determined by illuminating the plane inwhich the measurements are taken from three directions or by detecting frequency shifts in threedirections on three different sets of detectors.
Doppler shift
— is the key parameter used in nearly all optical flow velocity measurement conceptsto measure velocity by comparing the scattered light frequency with transmitted frequency. Thedifference in these two frequencies, scaled by the inverse wavelength, is a direct measure of the velocityalong the laser beam.
dual-beam laser Doppler anemometer
— is an anemometer using intersecting laser beams tomeasure the difference in Doppler shift of light scattered from these beams by particles traversing theintersection volume. A simplified explanation of the anemometer operation considers the interferencepattern often called “fringes” created in this beam intersection volume. As entrained particles in the focal

15
region traverse the fringe pattern, bursts of light are returned to the detector. Frequency analysis of thefringe-crossing frequency defines the particle velocity component perpendicular to the fringe orientation.Other fringe patterns at other locations must be used to provide two additional flow velocity componentsfor the three-dimensional flow field at one point in space. The single measured velocity component isperpendicular to the angle bisector of the crossed beams.
etalon
— is a device using two parallel partially transparent mirrors providing a frequency anddirectionally dependent optical transfer function to incident light. Spectrometers with very high spectralresolutions can be realized with an etalon. Etalons are used to determine the light spectrum generated bya laser.
far field
— is the region of the atmosphere about a moving aircraft that is at such a large distancefrom the aircraft so as to be uninfluenced by flow disturbances created by the aircraft motion. As used inthis volume, far field is the region remote from the local flow field.
finesse
— is the ability of an etalon to resolve closely spaced frequency components of incident light.Finesse increases proportionally with the etalon plate reflectivity while the signal throughput decreases.In a typical Fabry-Perot lidar application, there is an optimal finesse that results in adequate spectralresolution to measure the Doppler shift, but that also achieves sufficient light throughput to the detector.Finesse and frequency stability are affected by other factors, including plate flatness, parallelism, andspacing, range of angles that can be transmitted, and in some cases, the diffraction limit of the system.Fabrication of the plates, and mounting of the etalon must be done with care to avoid environmentaleffects of temperature and pressure gradients.
flow following
— is the ability of a light scattering aerosol to follow the motion of the fluid in whichit is entrained, particularly under conditions of high flow-acceleration. Factors that enhance this abilityinclude small size, aerosol and fluid density matching, high fluid viscosity, and fluid motion with lowlevels of acceleration. Flow following is more important for measurements in the local flow field, as flowat greater distances (free-stream and far field) is subject to relatively lower accelerations originating fromnormal atmospheric processes.
free stream
— is, in essence, similar to “far field,” except as used in this volume it implies thatregion of the atmosphere about a moving aircraft that is just beyond the outer boundary of the localdisturbed flow field.
fringe anemometer
— See dual-beam laser Doppler anemometer.
heterodyne
— is a coherent detection technique using a reference signal that is offset from thetransmitted signal to provide advantages over a simple homodyne technique. Typical advantages are:(1) reducing the Doppler signal frequency to accommodate the limitations of the signal detectorbandwidth, and (2) providing the capability to easily differentiate changes in flow direction in areference-beam anemometer.
homodyne
— is a coherent detection technique that uses the transmitted signal as a reference for thecoherent detection process. Homodyne systems are used in cases where the Doppler signal is well withinthe detector bandwidth capability and where detection of flow velocity reversal is not required.

16
ladar
— is an acronym from the words LAser Detection And Ranging. Through common usage, theterm “ladar” has come to refer to the optical analog of radar (which is used to measure position andmotion of large hard objects such as aircraft or automobiles).
laser
— is an acronym from the words Light Amplification through Stimulated Emission ofRadiation. The laser is a light source utilizing the quantum effect called “stimulated emission ofradiation” to provide light characterized by a narrow bandwidth, coherence, focusing ability, high power,and pulse capability.
LDA
— is an acronym from the words Laser Doppler Anemometry. A technique for measuring thevelocity of wind (anemos is Greek for wind) from the frequency shift occurring when laser light isscattered from moving particles in the air. Through common usage, the term LDA (synonymous withLDV, laser Doppler velocimetry) refers to the dual-beam laser Doppler anemometer.
lidar
— is an acronym from the words LIght Detection And Ranging. Through common usage, theterm lidar has come to refer to a measuring process that provides information on the motion of theatmosphere and the atmospheric aerosol loading that is manifested in the scattering of light back to adetector (the so-called monostatic system). The process relies on scattering from an ensemble of naturalaerosols from an illuminated region of the atmosphere and does not track single aerosol motion.
LTA
— is an acronym from the words Laser Transit Anemometry. A technique for measuring thetime it takes for a particle to move from one intense light area to another intense light area. The velocityof the particle can be derived from the distance between the locations where the light was scattered andthe time interval between scatterings. Through common usage, the term LTA refers to the two-spot laseranemometer.
L2F
— is an acronym for laser two-focus anemometer or two-spot laser anemometer. See two-spotlaser anemometer.
masking
— is a technique that uses the intersection of a projected light beam and a detector opticalfield of view to define a measurement volume.
maximum permissible exposure (MPE)
— is the maximum irradiance permissible from a lasersource into the human eye or onto exposed skin that will not cause damage. Such irradiance may beaccumulated under continuous exposure or through the effects of many pulses over a short period of time.
Mie scattering
— is the optical scattering from aerosols having diameters with the same order ofmagnitude as the optical wavelength. Mie scattering is characterized by highly variable peaks and nulls inscattering as the scattering angle is varied and as small changes occur in the ratio of aerosol diameter tooptical wavelength.
measurement volume
— is the region of the flow field in question from which the flowmeasurement is obtained. For bistatic systems, the overlap of the projected beam and the detectorfield-of-view defines the measurement volume. With CW systems using a single beam such as thereference beam laser anemometer, the optical focal region determines the measurement volume. For CWintersection-beam systems such as the dual-beam laser Doppler anemometer, the region of beamintersection determines the measurement volume. For pulsed systems, either the optical focal region(mostly for near-field measurements) or the optical pulse spatial length dimension and beam diameter
17
determine the measurement volume. Often both types of volume selection are used when optimalperformance is required for a specific application.
monostatic optical configuration
— a laser anemometer optical embodiment that uses the sameoptics to shape the output pulse beam and to collect the scattered light. By virtue of its configuration, thisoptical arrangement captures scattered light directed exactly opposite from the transmitted beam, hencethe term “backscatter” which is applied to the received signal. Monostatic systems lend themselves torobust and compact designs for flight applications. With a monostatic system, it is difficult to adjustreceiving parameters independently from transmitting factors. Pulsed monostatic configurations requirespecial control over pulse timing to avoid capturing scattered energy from the transmitted pulse onto thedetector.
near field
— is the region of the atmosphere close to a moving aircraft that is disturbed by the aircraftmotion. Examples of disturbances include pressure fields, boundary layers, shock waves, and wakes shedfrom lifting surfaces.
number density
— is the number of aerosols per unit volume of the atmosphere. This is a parameteroften used in the measurement of aerosols.
particle
— a microscopic solid or liquid object providing optical scattering. In the natural atmospherethe scattering objects are termed aerosols.
particle image velocimetry (PIV)
— is a flow velocity measurement technique utilizing two imagesof particles, slightly offset in time, in a plane defined by a laser light sheet to measure individual particledisplacement during the time interval. Flow velocity at the location of each particle is obtained bydividing the particle displacement by the time interval.
phase-locked loop signal processing
— is a signal detection technique that uses the output from aproduct detector to slave (lock) a variable frequency oscillator (VFO) (serving as the reference for theproduct detector) in a feedback control loop to the highest amplitude frequency component in thereceived signal of interest. The frequency of the VFO is then a duplicate of the frequency component ofinterest (Doppler shifted frequency) and the VFO then provides a noise-free duplicate of this signal. Thistechnique has been largely supplanted by the digital signal technology.
range gating
— is a technique for distance discrimination by the capturing of scattered signals, attimes corresponding to the round-trip period from the transceiver to the measurement volume on thetransmitted beam axis. This technique restricts the signal reception to only the scattering originating inthe region of interest. Pulse length limits the distance resolution possible from this technique.
Rayleigh scattering
— is optical scattering from molecules or aerosols having diameters generallymore than an order of magnitude smaller than the optical wavelength. Unlike Mie scattering, Rayleighscattering has a smooth angular variation and the amplitude is proportional to the 4th power ratio ofscattering cross-section to optical wavelength for individual scatterers.
reference-beam laser anemometer
— is an anemometer that applies interference between lightscattered by aerosols and light from a reference beam, to derive the flow velocity in a laser-illuminatedmeasurement volume. This reference beam has the light frequency of the laser illuminating the aerosolsor a known offset frequency where the modification is known. The technique is commonly applied in a

18
backscatter configuration that requires that the receiver and transmitter be collocated. The component offluid motion measured by the reference-beam laser anemometer in the backscatter configuration is alongthe beam axis.
scattering
— is the changing of the propagation of light as it encounters scattering objects in its path(aerosols or molecules). The distribution and strength of this re-direction is dependent upon the objectsize relative to the optical wavelength, the object shape, and the optical properties of the object.(See
Molecular Scattering,
p. 25, and
Aerosol Scattering,
p. 27.)
seeding
— is the process of adding artificial optical scattering material (particles or aerosols) to aflow to assist in tracing the flow motion. Common examples of seeding particles are hollow Teflonspheres or olive oil droplets created from a special atomizer.
sheet-pair laser anemometer
— a flow velocity measurement technique using the aerosol transittime between laser beams shaped into the form of light sheets. This approach is an extension of thetwo-spot anemometer concept, designed to measure one component of the flow velocity. Systems of thistype have been fabricated using 3 sheet-pairs converging at a point to provide three-component flowvelocity measurement.
signal processing
— is the process of analyzing the optical and electrical signal from a flowmeter todetermine the flow motion.
signal-to-noise ratio
— is the ratio of signal power to noise power. This ratio limits the ability of asystem to extract a reliable measurement. The lower the SNR, the more difficult the extraction processand the more averaging required to obtain a reliable signal estimate.
size distribution
— is the distribution of aerosols sizes in a specific volume of the atmosphere.Rayleigh scattering governs the backscatter coefficient for aerosols substantially smaller than the probeoptical wavelength. Mie scattering is the dominant effect when the aerosols are of the same general orderof magnitude as the wavelength. Refraction, reflection, diffraction and interference play important rolesfor those aerosols much larger than the wavelength.
spatial filtering
— is a special type of mask (pinhole) placed at the focus of a light beam. This maskhas the property of limiting the depth of field of the viewing optics.
stimulated emission
— is a process whereby a photon physically passes close to an excited atominducing that atom to release a photon. This photon is the same wavelength as the stimulating photon, isemitted in the same direction, and has the same phase. This process leads to coherent light emission.
two-spot laser anemometer
— is a flow velocity measurement technique using the aerosol transittime between laser beams shaped into highly focused spots as a means of determining the flow velocityvector along the axis parallel to a line connecting the spots. Flow direction is determined by rotating thesespots about the midpoint until the autocorrelation function of the backscattered signals has reached amaximum. When this condition is achieved, the flow is deemed to be along the axis parallel to the lineconnecting the spots.

19
BASIC PRINCIPLES
Material covered in this section is limited to only that necessary for describing underlying principlesnecessary for an engineering understanding of flight optical flow measurement. These principles are toassist in identifying the capabilities of the various techniques and associated tradeoffs between alternativemethods of research. More complete theoretical treatment of these principles is covered in the referencesprovided.
Introduction
All in-flight optical airflow velocity measurements use light scattering. Light is scattered oninhomogeneities in the optical refractive index of a medium from both air molecules and aerosolsentrained in the air. The characteristics of molecular scattering and aerosol scattering are quite differentand are reviewed in this section. Furthermore, some other physical topics are introduced when suchtopics are necessary for understanding the physics behind laser anemometry.
The basic principles of in-flight optical airflow velocity measurements are utilized differently for thevarious anemometry systems and a wide variety of anemometer types have been developed. The basiclayout of an anemometer is (1) a light source, (2) optical elements, (3) a detector, and (4) signalprocessing electronics (although generally not considered a part of the anemometer, scattering mediaentrained in the flow field of interest are required for operation). As an introduction, components in thislayout are discussed in the order noted above.
The following block diagram (fig. 1) illustrates how the system components are interconnected in avariety of airborne flow-measurement systems. Most systems contain all of the components shown,however, all of the electronic connecting links may not be required for all systems.
Figure 1. Generic block diagram of an in-flight flow measurement system.
Light scattering inmeasurement volume
Optics
Lightsource
Optical link
Electronic link
Pre-detectionsignal processing
Post-detectionsignal
processing
Control
DetectorOutput
020133

20
Light Source
In many optical instruments the laser is introduced as the ideal light source for velocitymeasurements. Advantages of the laser compared with classical light sources are the coherence of light,the light beam shape, the high intensity of light produced, and the potential for very short pulses of light.In principle, classical light sources such as lamps can also be used for anemometry, but in practice thelaser advantages prevail. Therefore, some words about the laser.
The laser (Light Amplification through Stimulated Emission of Radiation) is a light source in which aquantum effect of atoms (or molecules) is utilized. A large number of excited atoms is created in theoptical cavity of a laser by optical excitation. For solid state lasers (i.e. ruby, NdYAG, sapphire,alexandrite) flash lamps or IR laser diodes provide the excitation. High-voltage is used to form a plasmaexcitation arc in gas lasers, such as HeNe, Argon-ion, Krypton, or CO
2
. When excited atoms return to alower energy state, a photon is produced. The emission of photons happens spontaneously at randommoments and directions. A physical process called “stimulated emission” induces the return of excitedatoms to a lower energy state, thereby producing a photon when a photon passes the exited atom. Thephotons created by stimulated emission are traveling in the same direction with the same wavelength,polarization, and phase as the photons stimulating the emission. All these factors together are whatproduce the so-called “coherence” and low angular dispersion associated with laser radiation. Lowdispersion results from the optical cavity redirecting the light back through the laser medium along theoptical axis. Spontaneous light emission will happen in all directions, as it is the process for lightgeneration in a classical light source, such as a lamp or LED. Spontaneous light emission in a laser is notenhanced in directions away from the optical axis defined by the cavity mirrors, whereas the photonsalong the optical axis are redirected back and forth through the medium to stimulate more atoms tophoton emission. This action produces the laser beam with its coherent light and low dispersion. The lowangular dispersion of the beam allows for very narrow beams and very highly defined and localizedregions of beam focus. The narrow light beams can be used for systems operating over long distances.Both the coherence and beam characteristics are very useful for optical velocimetry. Phase relationsbetween photons generated in the stimulated emission process result in coherent light in whichinterference effects are much more pronounced than in light from classical light sources. Importantfactors of the light source include: wavelength, coherence, focusing ability, power, and pulse capability.(For further reading see Silfvast 1996,
3
Loudon 1983
4
.)
Continuous Wave and Pulse Light Sources
Continuous-wave (CW) light sources are the most straightforward and the obvious choice for manylaser anemometer systems. This light source was available and was the first to be used in earlier systems;it is still commonly used in many applications today.
Pulsed light sources are often selected when power efficiency is a major consideration, or when therange must be determined using range gating techniques. Both of these issues become paramountwith long-range systems, although pulsed lasers may be used simply because that is the mode ofoperation for the available laser. The power relationships related to pulsed systems are discussed in thefollowing section (
Power Effects
, p. 21). With practical lens sizes for airborne applications,(~10 cm. diameter) at ranges beyond approximately 150 m, focusing is not effective as a

21
range-discriminating technique. Therefore, range gating must be used to discriminate atmosphericvelocity at long range. Narrow time windows of the scattered signal are sequentially processed to providea range-discriminated velocity measurement along the axis of the laser beam. It should be noted thatwhen measurements from a specific range are to be emphasized, focusing the beam optics at that samerange will provide improved SNR.
Power Effects
When long-range (1s to 10s of kilometers) operation is required, the signal-to-noise ratio (SNR) ofthe backscattered signal determines the effective range of the device. All other factors being equal, theSNR of the backscattered signal is proportional to the strength (power) of the received signal. To increasethe efficiency of operation, pulsing the laser is often used to increase the instantaneous transmitted powerand thereby also the peak received power. The signal is acquired and processed during the short pulseduration when the SNR is higher than it would be if the energy were radiated on a continuous basis.Low-duty cycle pulses can improve the effectiveness of the radiated power; however, ever shorter andshorter pulses limit the velocity resolution attainable with a single pulse.
As the distance of operation increases, most systems revert to collimated beams, and the receivedpower varies as the inverse square of the distance to the scattering source. Thus, to double the range of asystem under the same atmospheric conditions with the same SNR, on average it requires four times thetransmitted power.
When increased power levels (or high-pulse energy levels) are used, the risk of eye damage isincreased. Eye safety is regulated in national standards (Ref. ANSI Z136.1 2000).
2
Some pulsed laserpower limits are higher than CW power limits, which may be another reason for choosing a pulsedsystem.
Measurement Volume Discrimination
All optical velocimeters are required to obtain flow velocity from a known and well-defined region ofthe flow field, called the measurement volume. Several techniques are used to delineate the measurementvolume depending on spatial resolution and range requirements.
Masking
For very short ranges (up to approximately 20 meters), masking is a technique sometimes used todefine the measurement volume. This technique projects the light into a region of the surroundingatmosphere (the “illuminated” volume). The field-of-view volume from which the receiver accepts inputsis a separate volume from the illuminated volume, but the two volumes have a common region where thevolumes intersect (the intersection region). It is from this intersecting region that the scattered receivedsignal reaches the detector, as shown in figure 2. Masking is a measurement volume discriminatortechnique used in bistatic reference-beam anemometer systems.

22
Figure 2. Masking used to define measurement volume.
Focusing
For short range applications (less than 150 meters) focusing is another technique used to define themeasurement volume. By concentrating the optical energy in a small focal region, the vast majority ofdetected light is scattered from the aerosols within the measurement volume and propagates from thisregion back to the detector. Although not commonly applied, the optics used to concentrate scatteredlight on the detector can put an additional limit on the size of the measurement volume. Light is alsoscattered from aerosols located in regions of low energy density outside the focal region. When this lightreaches the detector it adds small amounts of noise to the signal.
For focused systems, the measurement volume is delineated by the focal region of the light source,combined with phase effects of scattered light and reference-beam light for coherent systems (Vaughanand Forrester 1989).
5
The focal region is defined as the volume bounded by the surface where opticalenergy density has decreased to 1/e
2
of the maximum intensity level encountered at the center of thevolume. For a laser beam in the fundamental transverse mode the intensity profiles can be approximatedas a Gaussian distribution. The focal region is an ellipsoid with the long axis coaxial with the axis of thefocusing lens. The beam waist diameter w
0
, for a light beam focused at distance r, with a lens or telescopewith diameter D, is under ideal conditions:
(1)
Projected beam"Illuminated volume"
Receiver fieldof view
Intersectionregion
020134
w0 4λr πD⁄=
23
and the measurement volume length
∆
L is (Vaughan and Forrester 1989
5
) at 50 percent of maximumintensity:
(2)
Optical principles dictate that for a fixed lens diameter, the focal region increases as the distance tothe focal point increases (Kogelnik -1966,
6
Silfvast - 1996,
3
Vaughan and Forrester 1989
5
). Note thatideal conditions are never encountered in practice. The focal region is larger when the laser is not in thefundamental transverse mode, when the Gaussian beam diameter does not match with the telescopediameter, and when the energy beam radiated is from a distributed light source (rather than from a point)or departs from a collimated condition. A larger lens diameter can be used to decrease the size of thefocal region at a given range; however, flight applications usually limit the size of lens that is practical touse. In the case of very small focal volumes and low aerosol densities, the situation may arise where onlyone aerosol is illuminated. At first, this may appear to be an unfavorable situation, but when only oneaerosol is illuminated, as opposed to an ensemble of aerosols, the SNR is improved, as no coherentcancellation is possible since no other scatterers are in the focal volume. Furthermore, the concentrated“burst” signal for single particles, instead of the more evenly distributed signal for multiple aerosols,allows other signal processing schemes to be used to achieve higher SNR (Harris - 2001)
7
. This singleaerosol concept is practical only at short range because of the rapid signal strength fall-off with distance(as the inverse fourth-power of the distance from the radiating source). This single aerosol condition isclosely related to that which exists in the dual-beam laser Doppler anemometer.
Range Gating
As ranges increase beyond 150 meters where focusing is increasingly ineffective, range gating mustbe used to discriminate the measurement volume. A range-gated system transmits a short-duration lightpulse (physical pulse length nominally from 3 to 500 meters) that scatters light back to the detector fromaerosols as it moves through the flow field of interest. The detector is time-gated to capture thebackscattered signal emanating only from a specific measurement region along the beam. Thismeasurement region is defined as that cylindrical volume of space illuminated by the transmitted pulseduring the time the detector gate is open. The cylindrical measurement volume diameter is the diameterof the collimated beam and the volume length is the sum of the transmitted pulse length plus the distancethe pulse travels during the time that the detector window is open. For example, a 300-nanosecond pulse(90 meters long) traveling 150 meters during the 500-nanosecond detector gate window defines ameasurement volume 240 meters long. Because the light pulse is present during the gate window for alonger time in the middle of the measurement volume, the velocity of the middle aerosols is weightedmore heavily than those on the ends of the measurement volume. Figure 3(a) illustrates the situationdescribed above, where the gate length is longer than the pulse length. The graph below the pulseillustration shows the measurement weighting as a function of the pulse length. The length of the regionin the center of the measurement volume (with constant 100 percent weighting) is defined by the excessof the gate length over the pulse length. A region with a high measurement weighting factor contributesmore heavily to the Doppler velocity spectral average obtained during the gate time. This means that flowmotion in the more heavily weighted regions of the measurement volume is emphasized in the spectralaverage. Figure 3(b) shows the condition where the gate length is shorter than the pulse length, and thegraph illustrates the weighting for this configuration. The weighting distribution shown is the same asthat for the prior situation where the pulse length is longer than the gate length.
∆L 8λr2 πD
2⁄=

24
(a) With pulse-to-gate length ratio more than 1.
(b) With pulse-to-gate length ratio less than 1.
Figure 3. Range-gated measurement volume.
It is important to recognize the measurement effects of measurement volume for both size andweighting where range gating is used. For pulse systems using range gating, the measurement volumecan be quite large (especially when long gating times or long pulse durations are used) and the resultingspectral measurement represents a weighted spatial average. In practical terms this means that for singlepulse measurements using a nominal pulse length of 500 nanoseconds (150 meters long), measuredatmospheric velocity conditions are a weighted average over what may be a large measurement volume.Furthermore, the weighting is not uniform and the velocity in the center of the measurement volume willbe more heavily represented in the velocity average. Weighting of the measurement does not usuallycause difficulty; however, using a short pulse relative to a long detector window length or a long pulserelative to a short detector window length can minimize any non-uniform weighting effects.
Pulse length
Gate length
Pulse travelduring gate
Beam axis anddirection of pulse motion
Measurement volume weighting
100percent
0percent
020156
Gate length
Pulse length
Pulse travelduring gate
Measurement volume weighting
100percent
0percent
Beam axis anddirection of pulse motion
020157
25
The volume weighting discussion and analysis presumes a uniform distribution of aerosols in thevolume. Should aerosol density not be uniform within the measurement volume, the aerosol densitydistribution will overlay the above volume weighting functions. The always-present vertical atmospherictemperature gradient may create concentrated horizontal strata of aerosols as a result of condensation.Visible clouds are an obvious example of this effect and sub-visual cirrus ice-crystal clouds may alsoresult from this process. Atmospheric temperature inversion may suppress normal vertical mixingactivity to preserve horizontal aerosol stratification over extended periods of time and over large areas.Thus, non-uniform aerosol distributions may skew volume weights in range-gated measurementvolumes. Stratification in vertical aerosol distribution is more prevalent and thus vertically oriented beamdirections are more susceptible to the effects of non-uniform aerosol distribution.
The averaging effects described above do not influence range-gated measurements obtained from anatmosphere without velocity gradients. For situations where turbulence exists and when the purpose ofthe measurement is to identify not only the presence of turbulence, but also the characteristic length(s) ofturbulence structures, the measurement volume is an important factor.
Light Scattering
All optical flow measurements being applied in flight depend on light scattering, the basic theory ofwhich is discussed in the following sections. The wavelength of the light has a dramatic effect on how thelight is scattered. Although molecular and aerosol scattering is discussed separately, it should beremembered that the effects of the separate scattering sources are cumulative and the received signal isthe total of the two. At the current time, most systems operate only through aerosol scattering. Somemolecular-scattering-based systems use aerosol-based signals to enhance performance.
Light traveling through a medium with refractive index gradients is deviated (scattered) from theoriginal direction in all directions. Both molecules and aerosols cause the light to be scattered, withmolecules having only a small effect (per molecule) and aerosols having a relatively much larger effect(per aerosol). Partly compensating this imbalance between the relative scattering effects of molecules andaerosols is the fact that there is always a large supply of molecules in the atmosphere, but there may notalways a be large supply of appropriate scattering aerosols. Atmospheric aerosol distribution is discussedin the Molecular Scattering section below.
Molecular Scattering
Air molecules scatter light from an original direction in all directions. At visible wavelengths, theamount of light being scattered is low. Therefore the visibility in clear air is high. The scattering is muchhigher at UV wavelengths where electrons in molecules may be excited. At even shorter wavelengths inthe X-ray bands, the energy is almost completely scattered (and absorbed) by atmospheric molecules. Forthis reason, X-ray astronomy must be conducted from satellites operating outside the atmosphere.Molecular scattering is even lower at the infrared wavelengths than in the visible range; however, thevisibility in the atmosphere tends to be lower as a result of absorption of bands of energy from gaseousatmospheric constituents. This absorption is primarily from excitation of vibrations of water and carbondioxide molecules. Taken together, these factors cause the low levels of molecular scattering at infraredwavelengths with the resulting low SNR to be insufficient for effective flow measurements.

26
Scattered light from molecules includes the thermal molecular motion from a broad spectrum ofDoppler-shifted photons in the detected signal. The air molecules are moving fast as a result of thermalmotion. Air molecules have an average velocity of 459 m/s (about Mach 1.35) at 15 °C. This effect issuperposed on the gas motion measurements relative to the anemometer and makes extracting the flowmotion measurement that uses conventional techniques a formidable challenge to the measurementengineer.
Characteristics of molecular scattered light
Since molecular scattering cross-sections are much smaller than aerosol scattering cross-sectionsat the wavelengths commonly used in anemometers, Rayleigh scattering theory is used to predictmolecular light-scattering behavior. Rayleigh scattered light extends in all directions. The scattered lightintensity I from a light beam with intensity I
0
in a direction that has an angle
θ
with the initialpropagation direction is
(3)
Where is the wave number of the light, the polarizability,
r
the distance from the scattering wherethe intensity is measured. The Rayleigh scattering is dependent on the polarization of light and thedetection angle. In this formula, polarization effects are neglected (“unpolarized light”). For more detailsrefer to van de Hulst 1981
8
. This type of scattering has been termed “billiard ball” scattering because itbehaves as if light photons are elastically bounced or deflected as they encounter individual molecules.No phase shift is created by the elastic collision. In the relatively dense atmospheric concentration ofmolecules, the variability of scattered light presents a smooth angular characteristic.
Molecules also scatter light inelastically. This means that the frequency of the photon is changedbecause of vibration excitation in the molecule or excitation of electrons during the scattering process(Raman scattering, fluorescence, etc.). In principle, airflow parameters can be derived from theseprocesses. For example, the temperature and pressure of air can be derived from laser-inducedfluorescence (LIF) (Mendoza 1998
9
). Proof-of-concept testing using oxygen fluorescence fromflash-lamp excitation was conducted on an F-16 aircraft to measure temperature and density (Azzazy,1990
10
).
As noted above, the thermal motion of molecules causes a major broadening of the scattered signalfrequency. While this increases the difficulty of extracting a Doppler frequency from the bulk flow-fieldmotion, it does offer the opportunity of obtaining the ambient temperature of the air causing the scatteredsignal. The width of the broadening is a direct measure of the mean velocity, which is directly related tothe internal energy and the ambient air temperature. The mean molecular velocity, and therefore thebroadening of the scattered signal frequency is directly proportional to the square root of the absolutetemperature (see figure 4). Measuring temperature in this manner avoids many of the difficultiesassociated with conventional ambient air temperature measurement. This concept offers the possibility ofremotely measuring the ambient air temperature at a distance from the flight vehicle in the flowsurrounding the flight vehicle.
I 1 cos 2 θ + ( ) k
4 α 2
I 0 2 r 2 ⁄ =
k α

27
Figure 4. UV atmospheric scattering with both molecular and aerosol scattering.
Molecular density variation in the atmosphere
Unlike the highly variable atmospheric aerosol distribution, molecular density is well defined andhighly predictable. The gaseous constituents of the atmosphere are uniformly distributed at all altitudesand the density of the atmosphere varies as an approximate logarithm of altitude. The density reaches halfthat of sea level at about 6000 meters and drops to 1/10 of the sea level value at about 17000 meters. Themolecular scattering intensity is proportional to the density and a system based on molecular scatteringmust accommodate the scattering variation up to and including the design-operating altitude. Thisvariation in the molecular scattering magnitude as the altitude changes offers the possibility of remotelyobtaining the ambient air density at some distance from the flight vehicle. Combining the density with thetemperature, as noted in the previous section through the universal gas law, provides the ambientpressure. Calibrations of the measured scattering intensity and spectral width are required to assureaccurate ambient measurements of density and temperature respectively, however, these operations canbe performed in a laboratory setting. A measurement obtained this way avoids the necessity foraircraft-specific calibrations and corrections that must be applied to measurements obtained withconventional sensors.
Aerosol Scattering
Light scattering from aerosols is the basis of most flight optical anemometers. Lasers are used toilluminate the aerosols from a well-defined direction and wavelength. The amount of scattered lightdepends on the diameter, the shape, and the refractive index of the aerosol and the wavelength of light.Light scattering on aerosols is often categorized as a function of the quotient of the diameter of theaerosol and the wavelength of light. The characteristics of the light scattering are described below.A recommended textbook on this complicated matter is van de Hulst, 1981
8
.
Rayleighscattering
Mie (aerosol)scattering
Atmospheric scattering
υ020135

28
Scattering from aerosols much smaller than the wavelength
For aerosols much smaller than the wavelength of the light, the approximations of Rayleigh scatteringapplies (similar to molecular scattering). The intensity of light being scattered is proportional to the4
th
power of the ratio of the aerosol diameter over the wavelength. Equation 3 describes the scattering forthese small aerosols also. The light is scattered in all directions with a smooth distribution. No phaseshifts are introduced at the scattering of the light.
Scattering from particles with sizes on the order of the wavelength
The scattering of light is shape and refractive-index dependent for aerosols with sizes on the order ofthe wavelength of light. The exact relations for the scattering of light can be derived from Maxwell’sequations for electromagnetic fields; however, this is impractical as the calculations are very complicatedand time consuming and the shape and refractive indices are usually unknown. For spherical aerosols,Mie-calculated relations are computationally easier to use. In many investigations and designspecifications the scattering aerosols are assumed to be spherical, which makes the Mie relationsapplicable. The assumption of spherical shape is realistic for liquids, which comprise a majority of thehigh-altitude aerosol population. Even for spherical aerosols the light scattering is not a simpleexpression where the scattered intensity, as a function of the scattering angle, shows large lobes.The phase of scattered light also depends strongly on the scattering angle and is related to the lobes.Examples of the intensity of scattered light as a function of aerosol radius and the angle are given infigures 5(a) and (b) (Mie 1908
11
). The multiple lines in the intensity graph (fig. 5(a)) show the effect ofdifferent aerosol indices of refraction.
(a) Characteristics for 0.81
µ
m wavelength.
Figure 5. Mie scattering.

29
(b) As a function of scattering angle.
Figure 5. Concluded.
In figure 5(b) the upper line is for light scattering on a spherical droplet with a diameter of 5
µ
m. Themiddle trace and lower trace are for 3
µ
m and 1
µ
m respectively. All traces assume a refractive index of1.33 representing water droplets in air.
Scattering from aerosols with sizes larger than the wavelength
For large aerosols optical effects such as refraction, reflection, diffraction and interference play importantroles. Geometrical optics and interference, even if light is not monochromatic (think of the rainbow),determine the distribution of light over the different scattering angles. The properties of the aerosols, such asshape, refractive index, and refractive index gradients must be considered for exact calculations of lightscattering. No straightforward general calculation method for scattering is available for this case. Mostly thescattering from aerosols with these sizes is not very relevant for optical flow measurement because there arevery few aerosols with these sizes in the atmosphere. Moreover, as these aerosols are often too large to followthe flow adequately in situations with highly accelerated flow, most anemometers should not aim to measurethe flow using these aerosols. Clouds and rain may even hamper optical airflow measurements as the opticalaccess between the anemometer and the measurement volume is degraded.
30
Characteristics of Scattered Light From an Ensemble of Aerosols
Light scattered from an ensemble of aerosols is the sum of light-wave contributions of individualaerosols. In this situation, the phase of light waves and the associated interference plays a major role andmust be taken into account. The scattered light intensity of an ensemble of aerosols may be small forsome configurations of individual aerosols, whereas the intensity may be large for the same aerosolsif positions are shifted even a small fraction of a wavelength. This phenomenon is also encounteredif coherent (laser) light is scattered at diffusely scattering objects, where it is called the “specklephenomenon” (Dainty 1975
12
). Taking all effects into account, the time-averaged (and thereforephase-averaged) light intensity of a moving ensemble of aerosols is larger than that of each single aerosolof the ensemble. Additional fluctuations of scattered light intensity are caused by the interference of theindividual aerosol contributions.
Aerosol Distribution in the Atmosphere
Aerosol distribution in the atmosphere is one of the most highly variable factors facing the designer ofanemometers. There are literally hundreds of atmospheric processes that create a myriad of aerosols ofvarious compositions, sizes, and optical properties. Sources of these aerosols include; surface solid orliquid aerosols from high winds or volcanic activity, liquid or solid condensation from atmosphericphysical processes, liquids or solids from atmospheric chemical reactions, and complex combinations ofthese three sources. Distributions of these aerosols have been measured, as have others, and reflected interms of backscatter coefficients at a 10.6 micrometer wavelength (Vaughan and Brown 1995
13
) forvarious geographical regions of the world. The backscatter coefficients, and therefore also the atmosphericaerosol distribution, fluctuate considerably, not only as a function of the region but also as a function oftime. Volcanic eruptions and the season play important roles in the amount of aerosols in the atmosphere.Other researchers determined the size distributions of aerosols in the atmosphere (Deirmendjian 1964
14
)that can be used for a theoretical analysis of aerosol velocimeter performance. Figure 6 illustratesthe ranges of particle distributions and optical backscatter values associated with these situations.The numbers in parentheses indicate the relative magnitude of backscatter values at the selected altitudesin the atmosphere. It should however be noted that these “typical numbers” vary substantially under theinfluence of natural atmospheric processes. The references mentioned above present variations in aerosoldistributions and are an example of several decades of backscatter coefficient measurements.
Backscatter values depend on the wavelength of light. In general the values are higher for shorterwavelengths. The choice of the wavelength for an anemometer is not a straightforward one, depending onthe availability of lasers at different wavelengths and degrees of eye safety. Numerous studies have beenpublished about this choice (Kane 1984
15
, Targ 1996
16
and others).

31
Figure 6. Variation of backscatter values in the natural atmosphere.
Detection
Information about the flow under investigation is encoded in the scattered light. A detector is used toconvert relevant characteristics of scattered light into an electrical signal. In practice, the intensity of light(sometimes as a function of spatial position, sometimes not) is the relevant parameter to measure. Severaltypes of detectors utilize the interaction between photons and different kinds of optically sensitivematerial. Detectors relevant for optical flow measurement produce electrons from impinging photons.The photons provide extra energy to the electrons as they are absorbed by the material. Differentmaterials are used for detection and have optimized absorption characteristics, such that the maximumsensitivity for a specific wavelength of light is obtained. The optimum in sensitivity is reached if eachphoton impinging on the detector results in a signal. This ideal response of a detector leads to the idealquantum efficiency (
η
) of 1. The quantum efficiency depicts the ratio of photons that result in a signal,which is dependent on the wavelength of the photon, and is an important parameter for the detector.
Detectors introduce several types of noise in signals. Signals are generated internally in the detectorwithout any photons impinging to generate the signal. This is called the “dark-current.” Thermalexcitation of electrons is one of the major reasons for this anomaly. As the effect is largest for detectingphotons with low energy infrared (IR), many detectors used for these photons are cooled to lowtemperatures. The quantum character of light results in a random pulsed-noise character of the signal, theso-called shot noise. Even ideal detectors experience this noise. Therefore, it is important in systemdesign to assure that detectors are not exposed to conditions that degrade their performance under eitheroperating or nonoperating conditions.
15,000
10,000
5,000
2,000
0
Lower-stratosphere (5x)
Upper-troposphere (1x–2x)
Mid-troposphere (5x–50x)
Lower-troposphere (500x)Low altitude
Convective
Clear air
Subvisual cirrus
Mtn wave/terrain induced
Alt
itu
de,
met
ers
020138

32
Frequency response is a very important characteristic of a detector. The bandwidth should besufficient for detecting the signal. Noise levels, however, increase typically with the square root of thebandwidth, so for this reason the detection bandwidth should be as small as possible consistent withdetection requirements.
Video cameras are used as detectors in systems when it is necessary to acquire scattered lightmeasurements in a plane. The fact that video cameras require array detectors limits the choice of detectormaterials to those available in a suitable array configuration. The same detector considerations notedabove apply to the video configuration.
Signal Processing
Signal processing may be performed either prior to detection (pre-detection) where the signal is inoptical form or after detection (post-detection) where the signal of interest is in electrical form.For simplicity, both pre-detection and post-detection signal processing are discussed in this section.Examples of signal processing include the five items listed below.
1. Optical wavelength filtering to remove extraneous noise signals, for example background light(pre-detection)
2. Heterodyne signal mixing to generate a difference signal with reduced noise level (pre-detectionor post-detection)
3. Electronic fast Fourier transform processing or autocorrelation of electrical signals to extract theDoppler frequency shift (post-detection)
4. Direct processing using either a high-finesse etalon or a molecular filter (pre-detection)
5. Time-of-flight processing (post-detection)
Signal processing is a collection of operations performed on the signal at some point as it transitsthrough the optical and electronic environments of the flight measurement system. The primaryobjectives of these operations are
1. To improve the signal-to-noise ratio (SNR) of the signal
2. To extract desired information contained in the signal
These primary objectives are both present in most signal processing operations, and it is not useful tocategorize specific signal processing operations under one or the other of the above objectives.
Traditionally the term “signal conditioning” has been applied to processes that improve the SNR.However, with the advent of digital signal processing, the dividing line between improving SNR andextracting the desired information has been blurred. Many of the digital signal processes improve theeffective SNR through digital time-averaging and other processes like time domain-to-frequency domainconversion. Signal conditioning, therefore, has been merged into the discussion of signal processing forthis volume.
Light scattered from regions of low aerosol density is quite often very weak, particularly whenscattered from particles located far away from the light source. Effective signal processing of weaksignals is a critical factor in the performance of optical flow measurement systems. In this section a few
33
basic processing techniques are presented as these techniques are applied in several anemometerconfigurations. The processing techniques specific for a single configuration are discussed together withconfiguration in the section on System Components.
Coherent Processing
Coherent processing is a powerful technique to increase the SNR of frequency-shifted Dopplersignals. In the basic coherent processing approach, the received Doppler signal is first optically mixed(homodyned) with a small amount of the single-frequency transmitted signal immediately prior to signaldetection. In most cases, the mixing occurs on the surface of the detector. The interference of thesecoherent optical signals creates an optical carrier signal modulated by the Doppler difference frequencycomponent on the detector surface. Although strictly not part of the coherent processing, the detectorresponds to this mixed signal by generating a derived Doppler frequency shift as an electronic signal forfurther analysis and processing according to the requirements of the particular system. The amplitude ofthe detector output is proportional to the strength of the received signal and the frequency is the Dopplerfrequency shift.
This coherent processing technique is generally applied to atmospheric flight Doppler anemometers.SNR is a critically important system performance parameter, and yet it is difficult to accurately specifyexplicitly in an equation. The SNR of a heterodyne coaxial system is affected by several factors, and thesystem designer must be well acquainted with the important factors affecting SNR to achieve an optimalbalance and provide the best performance. Theoretically it can’t be better than as follows (Sonnenschein1971
17
, Kane 1984
15
, Keeler 1987
18
, Vaughan and Callan 1989
19
).
(4)
Where F denotes a factor that is a function of the parameters in brackets.
η
= detector quantum efficiency
P
T
= transmitted power
β
π
= atmospheric backscatter coefficient
λ
= wavelength of light
B = System bandwidth
h
= Planck’s constant
ν
= frequency of light
F( ) = function of...
D
= diameter of collecting optic
L
= range
f
= focal distance of collecting optic
SNR ηPT βπλ{ } 2Bhν⁄[ ] F D L λ f, , ,( )=

34
The configuration of the system determines the value of the variable F. As shown in the equation,collecting optic characteristics, wavelength, and range are each an influence on the magnitude of F.Unstated in the equation, but also influencing the magnitude of F, are the operating mode (pulse or CW)and the focused or unfocused state of the system. Unfortunately, all of the “component imperfections”conspire to reduce the SNR and there are no real tradeoffs that could be used to reach an optimumbalance between competing factors. The strategy must be to make each factor as good as possible to getthe best SNR. A few of the “component imperfections” include: detector noise, non-ideal signalprocessing algorithms, laser wave front distortions, and laser turn-on and turn-off characteristics. Amongother factors affecting the SNR, and not explicitly identified in the equation, are the coherence lengthcharacteristics and wave-front characteristics described below.
Optical alignment plays a critical role in coherent processing. It is important that the wave fronts ofthe signals mixed on the detector surface are parallel, to assure that the alternate destructive andconstructive interference is realized simultaneously at all points on the sensitive detector area.Misalignment of optical elements that degrade the parallel wave front of the mixing signals can seriouslyreduce the sensitivity of the coherent detector, the primary reason for using this concept.
For long-range measurements, the coherence length of the laser source should be comparable to therange from which the measurement is obtained. If the coherence length is insufficient, anoptically-delayed reference signal (from a long optical fiber for example) may be used in the coherentmixing process. The fiber length is determined by the required “range gate” delay for desiredmeasurement range.
Direct Processing of Doppler Shifts
To extract the Doppler shift frequency, the direct processing approach requires a mechanism toconvert the optical Doppler frequency shift to an amplitude shift prior to detection. This concept is usedin frequency modulation (FM) radio applications and the translation of frequency shift to amplitudechange is accomplished by a special filter device called a “discriminator”. In optical applications, a filterdevice is used which has a region where the relationship between frequency and amplitude issingle-valued and preferably linear. Typically, a high-finesse etalon or a molecular cell filter is used forthis purpose.
Direct processing requires a very sharp frequency-amplitude characteristic to discriminate therelatively small Doppler frequency shift. The frequency of the light in a typical anemometer isapproximately 10
15
Hz. The Doppler frequency shift is approximately 5
×
10
6
Hz per m/s aerosolvelocity. For velocity ranges from 50 to 300 m/s, the Doppler shift ranges from 250
×
106 to1500 × 106 Hz. Thus, the frequency shift is approximately 109 Hz at an absolute frequency of 1015 Hzor 1 part in 106. This very small frequency shift requires high stability of both the frequency-amplitudefilter characteristic and the illuminating laser frequency. High-resolution spectrometers have beendeveloped and could well provide in-flight direct signal processing in the near future.
Except for the coherence-related factors, the signal-to-noise ratio of a direct processing approach isaffected by many of the same factors as the coherent processing approach. No explicit closed-formequation is known to exist that describes the relationship between the overall SNR and the system andenvironmental factors.

35
Pulsed Operation Signal Processing
Pulsed systems provide short excitation pulses (from tens of nanoseconds to a few millisecondsduration). Pulsed operation may be used to discriminate the measurement volume (see MeasurementVolume Discrimination earlier in this section) or to improve the signal-to-noise ratio. The reason for usingpulsed operation does not influence the necessity to synchronize the signal processing with the pulse timing.In the case of short ranges the delay between pulse transmission and reception of the scattered signal isusually too short to make range gating a practical consideration. If this short-range situation is the case, theprocessing is initiated when the pulse begins. When range gating is used to discriminate the measurementvolume, the signal processing is gated several times for each pulse to acquire information from selectedregions along the length of the beam as the pulse reaches and scatters light from each successive region.Except for the synchronization of signal processing with pulse timing, the signal processing conceptsdiscussed immediately above operate the same with CW signals as with pulsed signals.
Reduction of Effects of Sun Light
As has already been noted, operating in the natural atmosphere requires that optical system design becompatible with the natural aerosol environment to provide the scattering necessary for velocitymeasurement. Another factor of the natural atmosphere is the presence of the sun (unless night flight is anoption for the program), an uncontrolled source of light with the potential to substantially degrade opticalsystem performance. The major hazard to avoid is the entrance of background light into the opticalaperture. At a minimum, this direct or reflected background light has the potential to degrade systemSNR and under worst-case conditions may saturate, or even destroy the detector and render the systeminoperable. Good construction practices will exclude light from sources not on the system optical axis.However, natural background light from the clear sky, from clouds, or reflected from the ground mayalso enter the system. Signal processing can sometimes be used to suppress the effects of extraneous lightto improve the SNR.
Both optical and spatial filtering are effective techniques for reducing extraneous light. Spatialfiltering or masking is already mentioned in Measurement Volume Discrimination (p. 21) earlier in thissection. Most flow measurement systems use single frequency lasers as light sources. Therefore the mostdirect approach is to utilize an optical band-pass filter that excludes all light except that in the vicinity ofthe operating or Doppler-shifted frequency.
Signal Processing and Detection Challenges
In a flight environment, one of the more important issues is controlling extraneous noise sources. Ascontrasted with a wind-tunnel setting, the flight environment affords almost no control over measurementconditions. Ambient light from the sun must be suppressed for some situations. Background light cancause major difficulties as well.
In most situations, the primary issue in the detection process is achieving the highest possiblesignal-to-noise ratio (SNR). This situation is occasioned by the need to use backscattered light sinceforward scatter systems are usually not practical in flight. An additional situation in flight is often thedesire to acquire long-range measurements. Light scattered from a long-range is usually weak and

36
sensitive detectors with low internal noise levels, coupled with signal processing for improving the SNR,are usually required to obtain a reliable flow signal.
Summary
This section has addressed the most important concepts involved in optical flow measurement inflight. This discussion has been limited to only the most salient features of these concepts. For a moredetailed description of any particular concept please refer to the list of sources in the References andBibliography sections.
37
SYSTEM COMPONENTS
Introduction
This section discusses the key system components required to implement flight-based opticalmeasurement systems. The next section (
Laser Anemometer Configurations
, p. 43) will discuss designsfor a variety of optical measurement systems. Descriptions of these system components with salientperformance requirements are reviewed in this section to provide a basic understanding of what isrequired to assemble an optical measurement system. Examples from textbooks giving more detailedinformation on system components are: Bass 1995
20
, Silfvast 1996
3
or (theoretically) Born 1970
21
.
Optical Components
A full systems approach is required to produce the optimal system for performing optical airflowmeasurement in flight. The challenge in developing an effective system arises in part from the fact thatthe support from many disciplines is required to arrive at a system that is a useful measurement tool forresearch purposes. A second factor to be considered is the need to clearly focus on the intendedapplication in the design of the measurement system. In-flight flow measurement systems are highlydependent on accommodating the flight environment, and in some cases, the ability to design andconstruct compact and flexible systems is a key requirement in being able to perform the desiredmeasurements. For the optical measurement of airflows, it is not possible to design a single system thatwill address all of the requirements of even a few applications. For long-range systems, signal-to-noiseconsiderations assume a primary role, which leads to considerations of laser output power, transmittingand receiving optics, detector sensitivity, and signal processing. For short-range systems, such as thoserequired for air data measurement and local flow measurement, high data rates are needed to understandrapid changes in the flow situation as well as relatively high spatial resolution. Requirements must bethoroughly understood and a balance reached in each aspect of the design.
Laser
As already mentioned in the preceding section the laser is the best light source for optical airflowmeasurement in flight because of the ideal light beam characteristics. The requirements on the laser forthe in-flight application significantly affect both the effectiveness and practicality of airborne lasersystems. The size of the laser system, the electrical power consumption and the associated efficiency ofconverting electrical power into light power, the requirements on cooling air or water, and the capabilityto operate in a vibrating environment are, in general, more important than in ground applications.It should be noted that improving the light-conversion efficiency returns dividends not only by reducingthe power required for this function but also by producing less heat, thereby lowering coolingrequirements, resulting in potentially smaller size and further electrical power reductions. In most of theearly in-flight systems the carbon-dioxide laser was applied. Nowadays several laser systems are applied,each with an emphasis on factors that are advantageous for flight applications as follows:
• The carbon dioxide laser is robust and proven technology.
• The diode laser and the diode laser pumped solid-state lasers are small and convert electricalpower efficiently into light power.
• The Nd:YAG and Ho:YAG efficiently generate pulsed high-power light, where Ho:YAG emitslight with an “eye-safe” wavelength. (See
Eye and skin hazards
, p. 6.)

38
There are many types of lasers available (see Table 2 and Hecht 1996
22
, Yu 1997
23
), of whichvirtually none are excluded for in-flight applications provided the system design can accommodate thesize, weight, power, and environmental limitations.
Table 2. Compilation of laser materials.
Active medium Type and operating mode Wavelength, nm
Argon fluoride (ArF) Excimer, pulsed 193
Krypton fluoride (KrF) Excimer, pulsed 249
Xenon chloride (XeCl) Excimer, pulsed 308
Helium cadmium (HeCd) Gas, CW 325, 442
Nitrogen (N) Gas, pulsed 337
Argon ion (Ar) Gas, CW 350, 488, 514.5
Krypton ion (Kr) Gas, CW 350, 647
Xenon fluoride (XeFl) Excimer, pulsed 351
Copper vapor (Cu) Gas, pulsed 510, 578
Helium neon (HeNe) Gas, CW 543, 632.8
Gold vapor (Au) Gas, pulsed 628
Xenon ion (Xe) Gas, pulsed 540
Indium galium arsenic phosphide (InGaAsP) Semiconductor, pulsed or CW 600–1600
Titanium sapphire (TiAl
2
O
3
) Solid state, pulsed 660–1200
Ruby Solid state, pulsed 694
Alexandrite * 1 Solid state, pulsed 700–800
Galium aluminum arsenide (GaAlAs) Semiconductor, pulsed or CW 720–900
Iodine (I) Gas, pulsed 1300
Neodymium (Nd:YAG) * 2 Solid state, pulsed 1064, 532, 266
Indium Phosphate (InP), often in conjunction with rare-earth metal doped fiber amplifiers
Semiconductor, pulsed or CW 1300–1600
Holmium (Ho:YAG) * 3 Solid state, pulsed 2127, 2850, 2920
Hydrogen fluoride (HF) Gas, pulsed or CW 2600–3000
Erbium (Er:YAG) Solid state, pulsed 2940
Deuterium fluoride (H
2
F) Gas, pulsed or CW 3600–4000
Carbon monoxide (CO) Gas, pulsed or CW 5000–7000
Carbon dioxide (CO
2
) Gas, pulsed or CW 9000–11000
Lead tin telluride (PbSnTe)and other lead salts
Semiconductor, pulsed or CW 2000–30000

39
notes:
Alexandrite, chemical formula
1. Nd:YAG, chemical formula Nd:Y
3
Al
5
O
12
, where 532 and 266 nm light is emitted throughapplying frequency doubling in a non-linear crystal.
2. Ho :YAG, chemical formula Ho:Y
3
Al
5
O
12
, also other metals (rare-earth metals) are applied likechromium (Cr), thulium (Tm), and erbium (Er) emitting light with wavelengths between 2000 and3000 nm.
- The active media of semiconductor lasers contains many different atoms (Silvast–1996). Rareearth doped fibers or solid state laser rods are sometimes used to boost laser power.
-- Lasers emitting wavelengths higher than 1400 nm are often termed “eye-safe.” This is anoversimplification of reality. (See
Eye and skin hazards
, p. 6.) The danger for eye damage is lessat these wavelengths for a given power level, but there are still dangers in exposing eyes andother parts of the body to powers high enough to damage tissue (ANSI Z136.1 2000).
Detector
Detectors are used for the conversion from photons to electrical signals. The most importantrequirements on detectors are: (1) high response to light, (2) low noise levels, and (3) sufficientbandwidth to accommodate the rapid light intensity variations. In Table 3 some characteristics ofcommonly applied detectors are provided. Both the photo-multiplier tube (PMT) and the semiconductordetectors generally are available with sufficiently high bandwidths for most in-flight applications. ForDoppler applications with coherent detection, the combination of large velocity measurements and ashort operating wavelength requires the largest detector bandwidth. The choice of detector is mostlygoverned by the light wavelength sensitivity, which is different for different materials. Modern detectorshave nearly ideal photon detection response, leading to the best possible signal-to-noise ratio. In general,far infrared detectors need to be cooled to reduce the noise caused by the thermal excitation of electrons.
Table 3. Compilation of light detectors.
Material Type Typical wavelengthrange, (nm)
Vacuum tube with metal elements Photo-multiplier tube (PMT) 110–1100
Gallium arsenide (GaAs) Semiconductor 400–900
Germanium (Ge) Semiconductor 500–1800
Indium gallium arsenide (InGaAs) Semiconductor 900–1700
Indium antimonide (InSn) Semiconductor 1000–5500
Lead selenide (PbSe) Semiconductor 1000–7000
Mercury cadmium telluride (HgCdTe)
Semiconductor 2000–20000
Be Al1 x– Crx( )2O4

40
Lenses
To receive the maximum optical power for the detector the most important requirement for lenses andfocusing systems is to use a lens with as large a diameter as possible. Furthermore, the optics should haveefficient optical transmission at the wavelength applied. For UV and far IR wavelengths, materials likequartz (for UV) and zinc selenide or germanium (for IR) have to be used for lenses and windows. Usinghigh-quality optical components, high-performing focusing systems may be built with techniques similarto those used for building conventional optical telescopes. Infrared materials may require coatings toprotect lens surfaces from scratching.
Windows
Optical windows are necessary to give optical access to the atmosphere. Obviously the windowsshould be transparent, which leads to material requirements as mentioned in the section above.Additionally, measures are usually required to prevent condensation of water on the window.Temperature differences over the window makes condensation of water likely from cabin air contact withthe inside surface. Ice or a thin layer of water can accrete on the outside surface under certainmeteorological conditions. The water or ice will degrade the optical properties of the window and oftenstrongly attenuate optical transmissions. Measures taken to prevent condensation are typically thecreation of a dry air or nitrogen atmosphere on the warmer side of the window. Ice removal may requireheating the window and may require substantial heater power to maintain an unobscured view. If iceaccretion is even a remote possibility, a means to detect window ice formation, such as a video camera isa wise investment. This capability can resolve mysterious in-flight performance anomalies.
Filters
Very narrow-band filters are required to perform the direct detection operation. Etalons have beenused for this purpose; however, maintaining dimensional stability under conditions of variabletemperature can present substantial problems. Achieving a high finesse at short wavelengths (less than0.3 micrometers) is difficult. Molecular vapor cells can provide a more stable frequency characteristic;however, tight temperature control or other measures are often needed to stabilize the attenuationcharacteristic under varying environmental conditions.
Band-pass filters are sometimes applied to reduce the influence of daylight. Daylight may contributesignificantly to noise, as the intensity of detected light is typically small compared to daylight levels. Thereduction of daylight noise with band-pass filters is typically only part of the solution.
Polarization filters, quarter-wavelength plates, and half-wavelength plates are often applied todifferentiate between transmitted and reflected light and scattered light.
Optical Frequency Shifter
Bragg cells are often used to shift the optical frequency input to a coherent detector. This is necessarywhen the raw Doppler frequency shift is higher than the band-pass of the signal detector. Thetransmission frequency is offset to a value closer to the Doppler-shifted return signal so that thedifference frequency that appears on the detector is within the detector band-pass. Of course, the

41
Doppler-shifted output frequency from the detector is adjusted upward (often accomplishedcomputationally) by the offset value to compensate for the Bragg shift.
Mechanical Construction
Robustness is very important, and by clever design, the requirements can be achieved using structuresthat maintain dimensions within the order of a wavelength while in operation. The task of makingsystems for flight applications is simplified when the size can be as small as possible and the stiffness ashigh as possible.
Conventional materials (like aluminum) usually require precise temperature control to maintaindimensions within the required tolerance. Thermal control for these systems adds considerable weight tothe overall system. Recently developed components (for example, carbon-fiber optical benches) offervery high stiffness and light weight combined with very low thermal expansion such that precisetemperature control is not necessary.
Signal Processors
System requirements determine the signal processor selection. Where it is necessary to operate inconditions of low signal-to-noise ratio, coherent detection is usually selected to give the best performancein a low-density aerosol environment. Coherent detection is used when an averaged measurement isrequired from a single measurement volume in a reference-beam system. Direct detection is anotheroption, and is the technique of choice for some systems, e. g. when a multi-point measurement is obtainedsuch as in Doppler Global Velocimetry systems or available space cannot accommodate a coherentdetection system. Regardless of the mode of detection (coherent or direct), signal processing is donepartly in the optical domain (pre-detection) and partly in the electronic domain (post-detection). Theseconcepts are described in
Light Scattering
, p. 25, and
Detection
, p. 31.
Coherent Detection Signal Processors
The optical portion of the coherent signal processor is integrated into the laser transceiver. A smallportion of light from the transmitter is routed to, and mixed with, the received signal on the surface of thedetector. This may be accomplished by mirrors and beam splitters, fiber optics, or combinations thereof.The output from the detector is more useful when it is presented in the frequency domain and mostsystems provide the means for frequency conversion as a part of the system design. Custom-designed fastFourier transform signal processors utilize digital signal processor (DSP) technology to accomplish thesetransformations. For pulsed systems, the computation must be synchronized with the pulse start. Figure 7shows a real-time flight qualified digital signal processor. Figure 8 shows a block diagram of a typicalsignal processor.

42
Figure 7. Flight-qualified real-time advanced signal processor (RASP) and display.
Figure 8. Digital signal processing block diagram.
Burst Frequency Signal Processors
Burst frequency signal processors are commercially available and may be used in flight applicationswith appropriate packaging and power conversion support. These processors are used to analyze datafrom dual-beam laser Doppler anemometers (also known as LDA in wind tunnel applications). Theoutput from the burst frequency signal processor is a digital readout of the fundamental burst frequencyfrom the LDA installation.
High samplingrate
Analog-to-digitalconverter
Displaydistribution
andrecording
Real-timeadvanced
signalprocessing
020141

43
LASER ANEMOMETER CONFIGURATIONS
Introduction
A large number of laser anemometers have been developed and many of those have been usedin-flight. In this section different configurations of anemometers are presented and the working principlesare explained. Many applications of laser anemometers require far field measurement of flow, asdescribed in the next section,
Applications
. The capability of measuring far field flow is, at the currentstate of development, limited to the reference-beam anemometer. Therefore the reference-beamanemometer will be discussed in more depth than other types of anemometers, within the framework ofthis document.
Two velocimetry methods are identified in the description of the configuration of laser anemometers.
• Doppler techniques measure the frequency of scattered light. Light is scattered from a movingparticle thereby altering the frequency. This altered frequency of light can be determined directlywith frequency-dependent optical processing using a spectrometer or an optical filter. Thecommon approach for detection is converting light frequency changes into light intensityfluctuations using interference of light.
• Transit time techniques, measure the time it takes for a particle to move from one intense lightarea to another intense light area. The velocity of the particle can be derived from the distancebetween the locations where the light was scattered and the time interval between scatterings.
These techniques seem totally different. However, Doppler techniques can be viewed as projecting anintensity-modulated pattern in space, which can be interpreted as a transit anemometer. Thisinterpretation is widely used for the dual-beam laser Doppler technique. The merits and limitations of thisview are addressed in this section. The basic difference between the transit anemometer and Doppleranemometer is that light frequency-shifts and interference are essential for the Doppler technique,whereas in the transit anemometer these effects contribute to noise only.
The various types of laser anemometer configurations together with typical system characteristics andperformance capabilities are summarized in Table 4. There is no common approach for naming opticalsystem configurations. Some systems are described based on the optical configuration, others use thetype of signal processing as a basis for the configuration nomenclature.

44
Doppler Anemometry
The frequency-shift of light scattering from a particle is dependent on the frequency of the light, onthe scattering angle, on the velocity of the particle, and on the angle between the scattering angle and thevelocity vector of the particle.
The frequency change of light with a wave number , scattered in direction , by ascatterer with velocity , is:
,
(5)
where denotes the inner product of the vectors and .
For laser light with frequency f, traveling in direction , that is scattered by a particle in ameasurement volume in direction
so that the frequency-shift at the detector is
(6)
For the velocity component of a particle moving towards the light source, the backscattered lighthas a frequency shift of:
(7)
Table 4. Anemometer configurations.
Type Configuration Detection Signal Processing Range Comment
Doppler Reference-beamanemometry
Coherent DSP or burstfrequency processor
Near field, freestream, and far field
Most widely appliedin-flight concept
Spectrometry Direct Optical filter in combination with image processing
Far field Also potential for nearfield applications, neverimplemented in flight
Dual-beam laser Doppler anemometry
Coherent Burst frequency analyzer, correlator
Near field Also called LDV and LDA
Doppler global velocimetry
Direct Optical filter in combination with image processing
Near field Never implemented in flight
transit Two-spot anemometry
Direct Correlator, analog scope
Near field
Sheet-pairs anemometry
Direct DSP correlator Near field
Particle image velocimetry
Direct Gated DSP Near field Never implemented in flight
k ks k δk+=v
δ f v δ k, ( ) π⁄ =
v δ k, ( ) v δk
o I
δ f f v o i–( ),( ) c⁄=
vlos
δf 2fvlos c⁄=
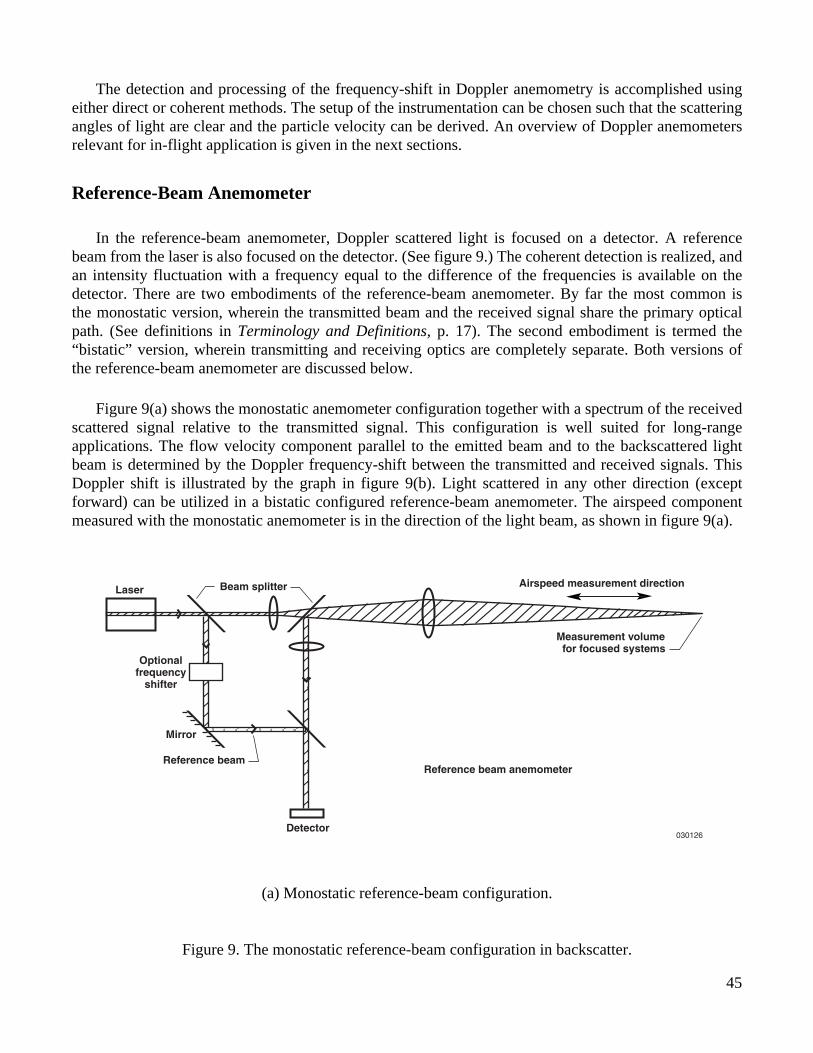
45
The detection and processing of the frequency-shift in Doppler anemometry is accomplished usingeither direct or coherent methods. The setup of the instrumentation can be chosen such that the scatteringangles of light are clear and the particle velocity can be derived. An overview of Doppler anemometersrelevant for in-flight application is given in the next sections.
Reference-Beam Anemometer
In the reference-beam anemometer, Doppler scattered light is focused on a detector. A referencebeam from the laser is also focused on the detector. (See figure 9.) The coherent detection is realized, andan intensity fluctuation with a frequency equal to the difference of the frequencies is available on thedetector. There are two embodiments of the reference-beam anemometer. By far the most common isthe monostatic version, wherein the transmitted beam and the received signal share the primary opticalpath. (See definitions in
Terminology and Definitions,
p. 17). The second embodiment is termed the“bistatic” version, wherein transmitting and receiving optics are completely separate. Both versions ofthe reference-beam anemometer are discussed below.
Figure 9(a) shows the monostatic anemometer configuration together with a spectrum of the receivedscattered signal relative to the transmitted signal. This configuration is well suited for long-rangeapplications. The flow velocity component parallel to the emitted beam and to the backscattered lightbeam is determined by the Doppler frequency-shift between the transmitted and received signals. ThisDoppler shift is illustrated by the graph in figure 9(b). Light scattered in any other direction (exceptforward) can be utilized in a bistatic configured reference-beam anemometer. The airspeed componentmeasured with the monostatic anemometer is in the direction of the light beam, as shown in figure 9(a).
(a) Monostatic reference-beam configuration.
Figure 9. The monostatic reference-beam configuration in backscatter.
Reference beam
Measurement volumefor focused systems
Reference beam anemometer
Detector
Laser Beam splitter
Mirror
Optionalfrequency
shifter
030126
Airspeed measurement direction

46
(b) Reference-beam Doppler frequency shift.
Figure 9. Concluded.
Reference beam anemometers in backscatter configuration have a monostatic optical design in whichthe transmitting and receiving paths utilize the same optical systems as illustrated in figure 9(a). Themonostatic reference-beam configuration probably has the broadest measurement range of anyanemometer and is used in applications at distances from a few centimeters up to 10s of kilometers.All reference-beam anemometer systems require a method of defining the region from which the velocitymeasurements are obtained. Focusing the beam is one method of defining the selected region. Focusingof the beam can be used to define this area of interest for short-range systems from a few centimetersup to about 150 meters and is limited by the size and shape of the focal region of the beam. A focusedsystem can be operated in either pulsed mode or continuous wave (CW) mode and focusing offersthe only means for defining the measurement volume in a monostatic system operated in thecontinuous wave mode. The technique for defining the pulse mode measurement region transmits apulsed beam and gates the reception, so that the received signal is captured from the desired region.(See
Range Gating,
p. 23.) This is called range-gating (adjusting the reception time window) and can beused to acquire information from any point along the beam path at distances out to the farthest point fromwhich signals are received. Measurement resolution is limited by the “optical time length” of the pulse,which is also the physical length of the pulse as it travels through the atmosphere. Range-gating uses agated detector to time-select the distance along the laser beam from which the scattered light is obtained.Laser pulse energy and pulse length must be matched to the requirements of the system (pulse length, innanoseconds, defines the minimum length resolution according to the relationship: L = .3t, where L is inmeters, and t is in nanoseconds).
With this broad range of application, typical systems exhibit substantial performance variationdepending upon the requirements. Long-range systems require comparatively large collection optics,highly sensitive low-noise detectors, and high-speed digital signal processors. These long-range systems
Transmittedfrequency
Backscatteredfrequency
Frequency
Signal∆f
δ f
020142

47
are typically constructed on an optical bench and require tight dimensional control and vibration isolationto maintain the optical integrity of the system, although lightweight, high-strength carbon fiber opticaltables are re-defining the choices. Future systems are expected to be substantially smaller and lighter(except for the optics) than systems in use today.
Bistatic systems (where the transmitting and receiving paths utilize different optical systems off-axisfrom one another) measure the velocity vector along the line that bisects the angle between the axes of thetransmitted beam and the collecting system. With bistatic systems, the measurement volume is defined bythe masking and focusing approaches. (See
Measurement Volume Discrimination,
p. 21.) Bistatic designs(sometimes in conjunction with monostatic systems) can offer the advantage of measuring velocity inmore than one direction from the same measurement volume. (See figure 10.) The on-axis detectormeasures the Doppler frequency shift from the upper (monostatic) system. The off-axis detector measuresthe Doppler frequency shift along the axis of the lower (bistatic) system. To obtain the magnitude of theoff-axis airspeed it is necessary to combine the Doppler frequency shifts from both systems.
Figure 10. Bistatic reference-beam laser velocimeter system.
Some authors use the terms “homodyne” and “heterodyne” to categorize the reference beam laserDoppler anemometers, analogous to customs in radio technology. Regretfully, different definitions forhomodyne and heterodyne are used in available literature, which makes these terms a source ofconfusion. In the most widely applied definition the reference beam of the homodyne laser anemometerhas the same frequency for the laser and is mixed with the received Doppler signal on the detector. In thecase of the heterodyne laser anemometer the frequency of the reference laser beam is shifted in opticalcomponents before impinging on the detector so that the two frequencies are different. Somecharacteristics of the reference-beam anemometer are:
• The measurement volume is defined by masking, focusing, or range-gating depending on theapplication.
020143
Reference beam
Measurementvolume
On-axisdetector
Off-axisdetector
Laser
Mirror
Optionalfrequency
shifter
Bistatic reference beam anemometer
Laser
Beamsplitter
Beamsplitter
Beamsplitter
Mirror
MirrorOff-axis airspeed
measurement direction

48
• This anemometer is useful in a broad range of applications, from near field through far field.
• In the monostatic configuration, the velocity component parallel to the axis of the beam ismeasured.
Dual-Beam Laser Doppler Anemometer
In a dual-beam laser Doppler anemometer two coherent light beams are crossed to create ameasurement volume at the beam intersection. (See figure 11.) Individual particles traversing through themeasurement volume scatter light from both beams. A detector measures the intensity of scattered light.The frequency of intensity fluctuations is a constant, times the velocity component of the scatterer in theintersecting beam plane, perpendicular to the bisector of the beam propagation vectors. The frequency ofintensity fluctuations is independent of the detection angle. The phase of detected intensity fluctuations isdependent on the detection angle only if phase shifts are introduced by the scattering, because aparticle-dependent phase shift of light is added into each scattering direction according to Mie’s scatterrelations. (See
Focusing,
p. 22.)
Figure 11. The dual-beam laser Doppler configuration.
A fringe model is widely in use to explain the principle of the dual-beam laser Doppler anemometer.The model considers an interference pattern formed by the two beams in the measurement volume. Theinterference pattern has parallel light and dark planes, called “fringes”, in the measurement volume asshown in figure 11. The distance between the fringes is
(8)
where
α
is the intersection angle of the two light beams. The frequency fluctuation that results on thedetector when a particle passes the interference pattern is
(9)
where v
⊥
is the particle velocity component in the plane of the two intersecting beams, perpendicular tothe bisector of the beam directions.
Detector
Laser
Beamsplitter
Lens Airspeedmeasuredalong this
axis
Burstprocessor
Fringe spacings = λ /(2 sin (α/2))
α
fD = 2 v sin (α/2)/λ
020144
s λ 2 α 2⁄( )sin( )⁄=
fD 2v⊥ α 2⁄( )sin λ⁄=

49
The fringe model gives an easy insight into most of characteristics of the anemometer. The number offringes in the measurement volume is constant and can be related to beam and measurement volume crosssections. The fringe model explains the signal shape and the relation between velocity and frequency ofintensity fluctuations. Figure 11 displays several of these features.
The fringe model does not provide an easy insight into the effects of the phase differences introducedby light scattering, mentioned in the first part of this section. The phase difference of scattered lightresults in a dependency of the position of the light and dark fringes on particle size and detector position.This dependence is demonstrated in Phase Doppler Anemometers (Bachalo 1984
24
, Durst 1997
25
) whichare used as standard equipment for particle size measurements in the laboratory and are being introducedinto the flight environment (Bachalo 1984
24
).
The dual-beam setup is easily realized, with commonly available optical components. Coherenceaspects are not stringent, which makes the dual-beam anemometer easy to apply in a wide variety ofresearch applications. Dual-beam anemometers are available in many configurations on the market, forapplication in the laboratory, with fewer models suitable for the industrial production environment. Thereare few dual-beam Doppler anemometers developed for in-flight application and none marketedspecifically for this. Some characteristics of this anemometer are:
• It has a small, well defined measurement volume.
• The measured velocity component is perpendicular to the crossed light beams in the plane of thelight beams.
• The distance between the anemometer and the measurement volume must be limited(the anemometer cannot be used at long ranges).
• The best performance is achieved when only one particle at a time is in the measurement volume.
• The position and size of the detector are not critical for flow measurement.
These characteristics are well suited to near field applications in flight, described in the next section(
Applications
). However, the limited distance characteristic precludes use in far field applications.Intersecting two light beams at a large distance and the efficient collection of scattered light are verydifficult for this type of anemometer.
This anemometer has a velocity measurement ambiguity. Velocities in either direction result in thesame signal. To avoid this ambiguity a Bragg cell is used to introduce fixed frequency offset to one of thelight beams. The frequency offset produces a measured velocity offset (the fringes move in themeasurement volume at the velocity offset), and a new ambiguity emerges around this new velocity. Thefrequency shift is chosen such that the ambiguity leaves no inconvenient uncertainties for the experiment.There are many good textbooks describing dual-beam laser Doppler anemometers in detail, see Durst1981
26
, Drain 1980
27
, Riethmuller VKI LS 1991
28
.
Spectrometric Velocimetry
Even for very high aircraft speeds the Doppler shifts of light are very small compared with thefrequency of laser light. High resolution in the frequency domain is required for measuring the smallshifts. Optical filter components such as molecular filters (Ref. Elliott-1999) and Fabry-Perot etalons canprovide the required resolution. The molecular filters have been successfully applied in Doppler global
50
velocimetry and will be further discussed in the next section. Velocimeters with Fabry-Perot etalons havebeen developed primarily for applications in space (Hays 1982
29
, Korb 1992
30
, McGill 1998
31
,Korb 1997
32
, Korb 1998
33
, Skinner 1994
34
, Abreu 1992
35
, Rees 1982
36
, Rees 1990
37
), and also have apotential for airborne applications.
Fabry-Perot etalons introduce a large dispersion of light frequencies in optical spectrometers causedby light interference that quenches light frequencies for most of the spectrum, except for some narrowbands. A thorough description of the Fabry-Perot interferometer is given in many optical textbooks(Hecht 1974
38
, Born 1970
21
) and laser textbooks (Silfvast 1996
3
) as this device determines a keyperformance characteristic of a laser. The passive etalon version is described in the following paragraphs.
A Fabry-Perot etalon is constructed from two partly transmitting parallel mirrors. The transferfunction of light passing through the assembly of the mirrors shows sharp peaks where the optical cavitylength between the mirrors matches a multiple of the half-wavelength of light. The sharpness of the peaksdepends primarily on the reflection coefficient of the mirrors and the precision of the parallel mirroralignment. The sharpness is reflected in a parameter called “finesse” and this determines the resolution ofthe spectrometer.
The sharp slope of the transfer function is used to discriminate the frequency of Doppler-shifted lightand functions as a discriminator signal processor. (See definitions in
Terminology and Definitions,
p. 14.)The edge of a peak is used to modify the transmission as a function of light frequency, but by addinglenses and a camera to the optical configuration the etalon can also be used to disperse the different lightfrequencies in space. The spatial separation is measured by spectrometers with an imaging detector, tocapture the fringe pattern.
The measurement of the frequency shift in the spectrometric velocimeter using an etalon requires ahigh mechanical stability of the cavity, which in turn requires special measures including temperaturecontrol as a minimum and possibly active mechanical feedback. Furthermore, for edge detection, theedge of the transmission peak should be matched to the laser frequency. These are the major challengesin the design of this spectrometrically-based velocimeter. (See discussion under
Filters
, p. 40.)
Doppler Global Velocimetry
Doppler global velocimeters operate on the same principles as described for all Doppler velocimeters.A basic Doppler system with a single laser transmitter and single receiver is capable of resolving asingle velocity component from a defined measurement volume. DGV provides a full 3-componentvelocity field measurement capability over a selected planar measurement region of the flow, andtherefore requires more than a single transmitter and receiver pair to acquire the additional information(Meyers 1995
39 ). A common implementation of DGV uses a single laser transmitter to project a plane of
light in conjunction with three receivers positioned at three viewing angles to acquire the necessary threevelocity components. Alternatively, the sheet can be illuminated intermittently from three differentdirections and analyzed with one receiver assembly (Roehle 1998
40
, 1999
41
, 2000
42
, 2001
43
). This maybe considered as three bistatic planar laser velocimeters with three laser transmitters, respectively, and acommon receiver. Each of the velocimeters obtains a separate flow velocity component at each point inthe measurement plane. The ability to measure 3 components of velocity in an illuminated plane ofinterest is what sets DGV apart from other optical velocity measurement concepts.

51
A vary narrow-band optical filter serves as an optical discriminator signal processor and as discussedin the previous section (covering the range of Doppler shift) is used to convert the DGV Dopplerfrequency shift into an amplitude variation. This filter may be a high-finesse etalon or a molecularvapor filter, such as an iodine vapor cell, the transfer function of which is shown in figure 12 below(Meyers 1995
39
). This is a normal direct-detection process performed for the pixelated field of view.After passing through the filter, the intensity of the light reaching the pixel is determined by two factors,as suggested above: (1) the attenuation imposed by the optical filter (discriminator) as a function of theDoppler frequency shift, and (2) the scattering aerosol and particle density in the region from which thelight originates. To extract the Doppler shift information at the pixel, the effect of the random amplitudemust be removed so that the amplitude variation at the pixel location is caused only by the Dopplerfrequency shift.
Figure 12. Transfer function of the iodine vapor cell.
Correcting for the aerosol and particle density variations requires the use of a compensating parallelvideo detection system, in principle matched pixel-for-pixel with the primary detecting video camera.With the compensating system, it is possible to remove the random amplitude variations by dividing thefiltered signal level from the primary detector video camera by the unfiltered signal level from thecompensating system, on a pixel-by-pixel basis. The ratio of the filtered signal level at the primarydetector video camera pixel to the unfiltered signal level at the corresponding pixel in the compensatingsystem camera, provides a measure of the Doppler frequency shift. On a pixel basis, this is the desiredinformation needed to obtain the velocity shift distribution and thereby determine the velocity fieldvariation for one of the three velocity components across the sensing pixel field.
For this approach, the primary detector camera and the compensating system camera must acquire theidentical view to the point that the field of view for corresponding individual pixels must be very nearlyidentical. In practice, optical distortions between the two fields of view have made it impossible to matchthe scenes on a pixel-for-pixel basis. Scenes have been captured using video frame grabber technologyand computer-based compensating optical corrections have been applied so that the processed scenes aresufficiently matched pixel-by-pixel to allow compensation for amplitude variations. Calibration of pixels
100
50
Darker
+ Speed
– Speed
Brighter
Laser frequencysetting for DGV
Tra
ns
mis
sio
n t
hro
ug
hio
din
e c
ell
, pe
rce
nt
0500 1000Laser frequency about argon
line at 514.5 nm, MHz
1500 2000
020145
25000

52
in both systems has proven to be necessary to account for slightly different gains and to remove biases(Meyers 2001
44
).
Figure 12 shows the transfer characteristic of an iodine vapor cell with an acceptably linearfrequency-amplitude region (Meyers 1971
45
). The vertical dotted line illustrates the situation where thescattered signal has no Doppler shift. When the Doppler shift is positive the response of the transferfunction is to reduce (darken) the amplitude of the signal. When the Doppler shift is negative theresponse of the transfer function is to increase (brighten) the amplitude of the signal. Positive andnegative Doppler shifts result when the flow moves generally toward and away-from the detectorsrespectively, keeping in mind that the component of the flow being measured is along the velocitymeasurement vector (i - o)(as described in figure 13).
The data from three bistatic velocimeters is combined using the geometrical layout of the plane(s) ofthe illuminating laser and the relative positioning of the receiver assemblies to provide 3-componentvelocity measurement. Figure 13 illustrates this concept and the relationship, with only one light sheetand one receiver assembly.
Figure 13. Doppler global velocimeter layout.
Laser Transit Anemometry
Laser transit anemometers derive the velocity of air from particles in the air by determining the traveldistance of a particle in a short time. The principle is implemented in anemometers described in thissection.
Laser Two-Focus Anemometer (L2F)
The laser two-focus anemometer (Schodl 198646) focuses two parallel beams in the airflow, wherethe airflow direction is perpendicular to the beams (fig. 14). Particles crossing the beams successively
Laser propagation direction, i
Collected scatteredlight direction, o
θ2
θ2
Measured velocity
component, o – i020146
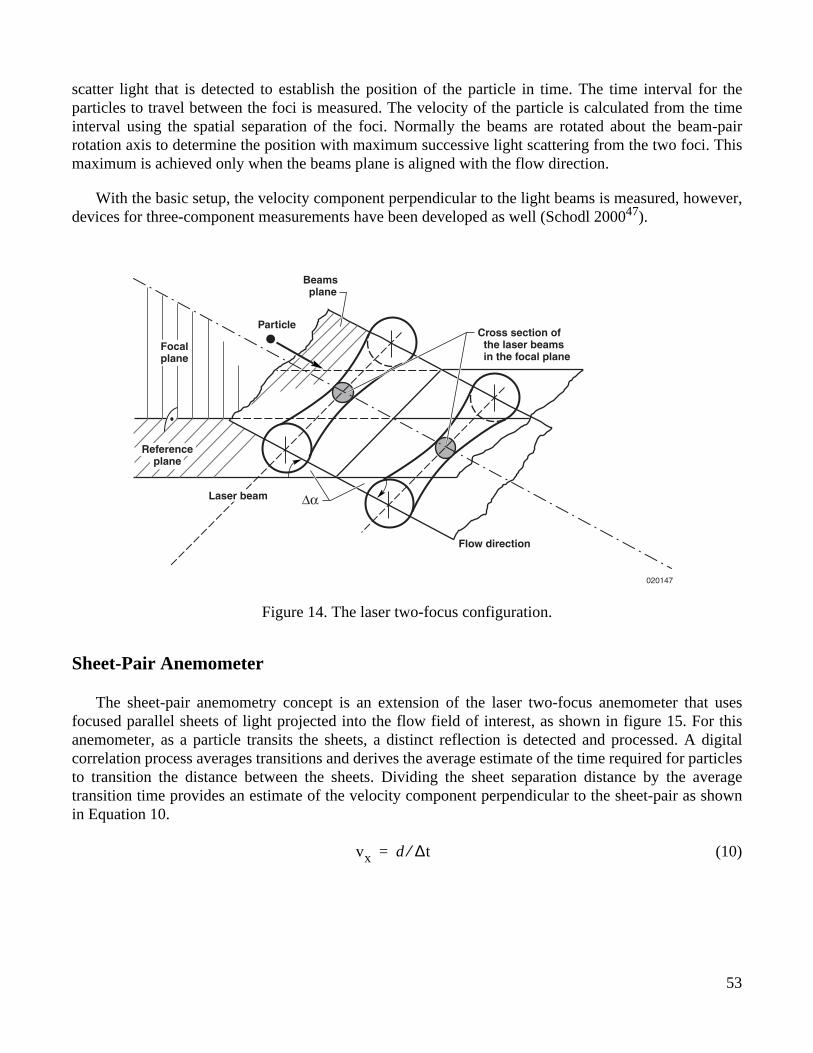
53
scatter light that is detected to establish the position of the particle in time. The time interval for theparticles to travel between the foci is measured. The velocity of the particle is calculated from the timeinterval using the spatial separation of the foci. Normally the beams are rotated about the beam-pairrotation axis to determine the position with maximum successive light scattering from the two foci. Thismaximum is achieved only when the beams plane is aligned with the flow direction.
With the basic setup, the velocity component perpendicular to the light beams is measured, however,devices for three-component measurements have been developed as well (Schodl 200047).
Figure 14. The laser two-focus configuration.
Sheet-Pair Anemometer
The sheet-pair anemometry concept is an extension of the laser two-focus anemometer that usesfocused parallel sheets of light projected into the flow field of interest, as shown in figure 15. For thisanemometer, as a particle transits the sheets, a distinct reflection is detected and processed. A digitalcorrelation process averages transitions and derives the average estimate of the time required for particlesto transition the distance between the sheets. Dividing the sheet separation distance by the averagetransition time provides an estimate of the velocity component perpendicular to the sheet-pair as shownin Equation 10.
(10)
Flow direction
∆α
Cross section ofthe laser beamsin the focal plane
Beamsplane
Particle
Laser beam
Referenceplane
Focalplane
020147
vx d ∆t⁄=
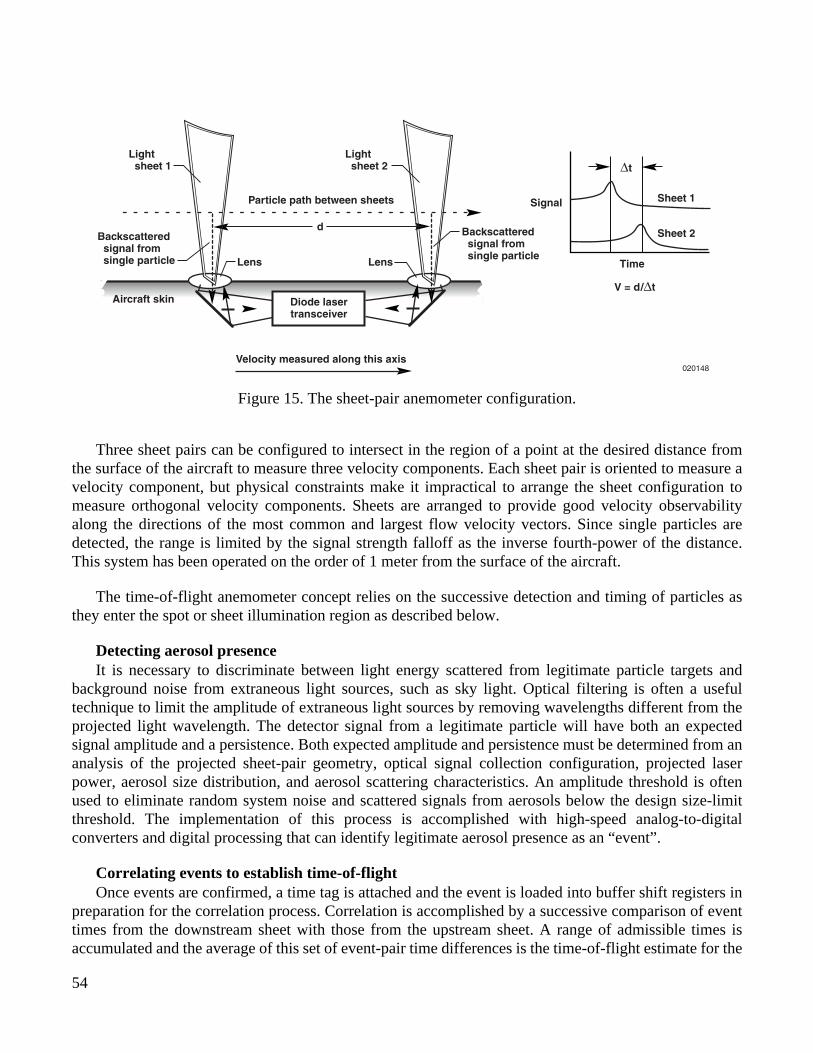
54
Figure 15. The sheet-pair anemometer configuration.
Three sheet pairs can be configured to intersect in the region of a point at the desired distance fromthe surface of the aircraft to measure three velocity components. Each sheet pair is oriented to measure avelocity component, but physical constraints make it impractical to arrange the sheet configuration tomeasure orthogonal velocity components. Sheets are arranged to provide good velocity observabilityalong the directions of the most common and largest flow velocity vectors. Since single particles aredetected, the range is limited by the signal strength falloff as the inverse fourth-power of the distance.This system has been operated on the order of 1 meter from the surface of the aircraft.
The time-of-flight anemometer concept relies on the successive detection and timing of particles asthey enter the spot or sheet illumination region as described below.
Detecting aerosol presenceIt is necessary to discriminate between light energy scattered from legitimate particle targets and
background noise from extraneous light sources, such as sky light. Optical filtering is often a usefultechnique to limit the amplitude of extraneous light sources by removing wavelengths different from theprojected light wavelength. The detector signal from a legitimate particle will have both an expectedsignal amplitude and a persistence. Both expected amplitude and persistence must be determined from ananalysis of the projected sheet-pair geometry, optical signal collection configuration, projected laserpower, aerosol size distribution, and aerosol scattering characteristics. An amplitude threshold is oftenused to eliminate random system noise and scattered signals from aerosols below the design size-limitthreshold. The implementation of this process is accomplished with high-speed analog-to-digitalconverters and digital processing that can identify legitimate aerosol presence as an “event”.
Correlating events to establish time-of-flightOnce events are confirmed, a time tag is attached and the event is loaded into buffer shift registers in
preparation for the correlation process. Correlation is accomplished by a successive comparison of eventtimes from the downstream sheet with those from the upstream sheet. A range of admissible times isaccumulated and the average of this set of event-pair time differences is the time-of-flight estimate for the
Particle path between sheets
Velocity measured along this axis
Lightsheet 1
Sheet 1Signal
Time
V = d/∆t
∆t
Sheet 2
Lightsheet 2
Backscatteredsignal fromsingle particle
Backscatteredsignal fromsingle particle
d
Lens Lens
Aircraft skin Diode lasertransceiver
020148

55
time window used to collect the events. The computation of the time-of-flight can be considered as across-correlation process. With the known sheet-pair spacing and the time-of-flight data, the componentof the vector flow velocity perpendicular to the sheet-pair is computed by dividing the light-sheet spacingby the time-of-flight.
Particle Image Velocimetry (PIV)
A particle image velocimeter illuminates a plane field in the airflow with two light pulses. Theilluminated plane is oriented to be as closely as possible to parallel to the airflow direction. Particles inthe air scatter light, which enable recording of the image of the particles on the projected illuminatedplane from a direction with a good viewing angle. The time between the light pulses is chosen, such thatthe faster particles move a considerable distance in the image field. By correlating the two images, traveldistances can be determined in the recorded area. Together with the time interval of the two pulses, thisinformation provides velocity information in the imaged plane.
The advantage of this technique is that it provides velocity information in a two-dimensional field,whereas many other techniques only give the velocity at a point. In wind tunnels this is very valuable. Forin-flight applications the configuration seems less advantageous and no in-flight PIV application hasbeen reported to the authors’ knowledge.
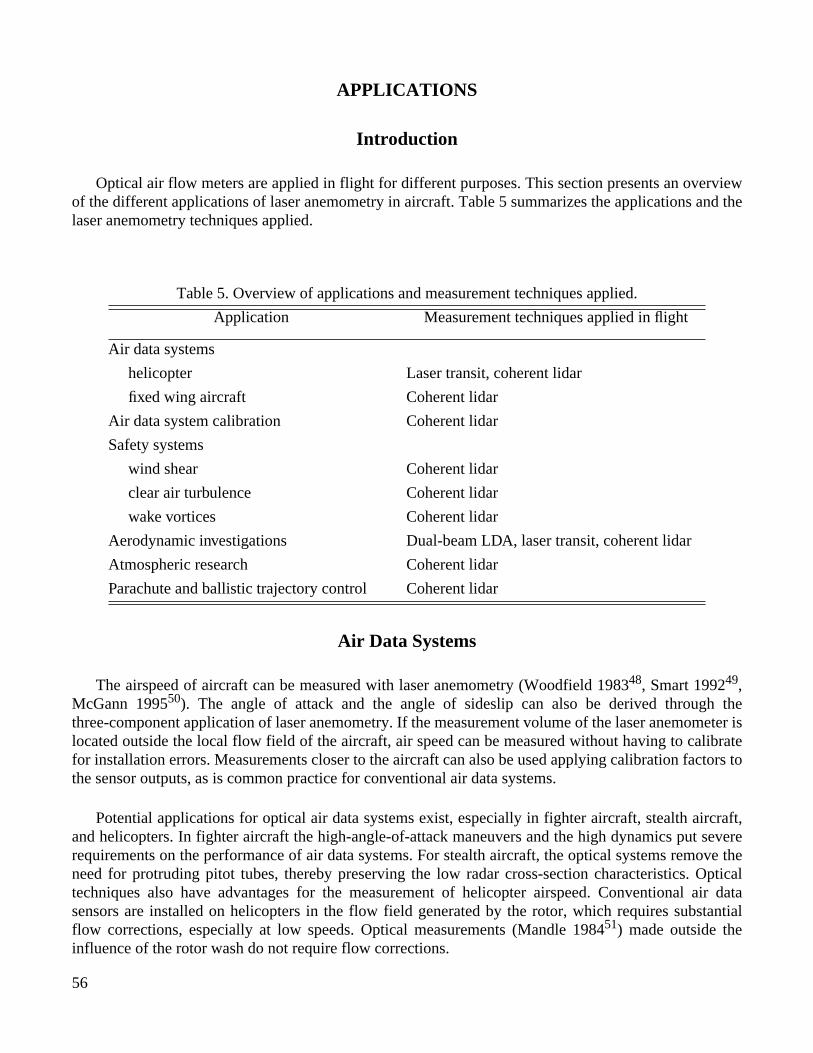
56
APPLICATIONS
Introduction
Optical air flow meters are applied in flight for different purposes. This section presents an overviewof the different applications of laser anemometry in aircraft. Table 5 summarizes the applications and thelaser anemometry techniques applied.
Air Data Systems
The airspeed of aircraft can be measured with laser anemometry (Woodfield 1983
48
, Smart 1992
49
,McGann 1995
50
). The angle of attack and the angle of sideslip can also be derived through thethree-component application of laser anemometry. If the measurement volume of the laser anemometer islocated outside the local flow field of the aircraft, air speed can be measured without having to calibratefor installation errors. Measurements closer to the aircraft can also be used applying calibration factors tothe sensor outputs, as is common practice for conventional air data systems.
Potential applications for optical air data systems exist, especially in fighter aircraft, stealth aircraft,and helicopters. In fighter aircraft the high-angle-of-attack maneuvers and the high dynamics put severerequirements on the performance of air data systems. For stealth aircraft, the optical systems remove theneed for protruding pitot tubes, thereby preserving the low radar cross-section characteristics. Opticaltechniques also have advantages for the measurement of helicopter airspeed. Conventional air datasensors are installed on helicopters in the flow field generated by the rotor, which requires substantialflow corrections, especially at low speeds. Optical measurements (Mandle 1984
51
) made outside theinfluence of the rotor wash do not require flow corrections.
Table 5. Overview of applications and measurement techniques applied.
Application Measurement techniques applied in flight
Air data systems
helicopter Laser transit, coherent lidar
fixed wing aircraft Coherent lidar
Air data system calibration Coherent lidar
Safety systems
wind shear Coherent lidar
clear air turbulence Coherent lidar
wake vortices Coherent lidar
Aerodynamic investigations Dual-beam LDA, laser transit, coherent lidar
Atmospheric research Coherent lidar
Parachute and ballistic trajectory control Coherent lidar
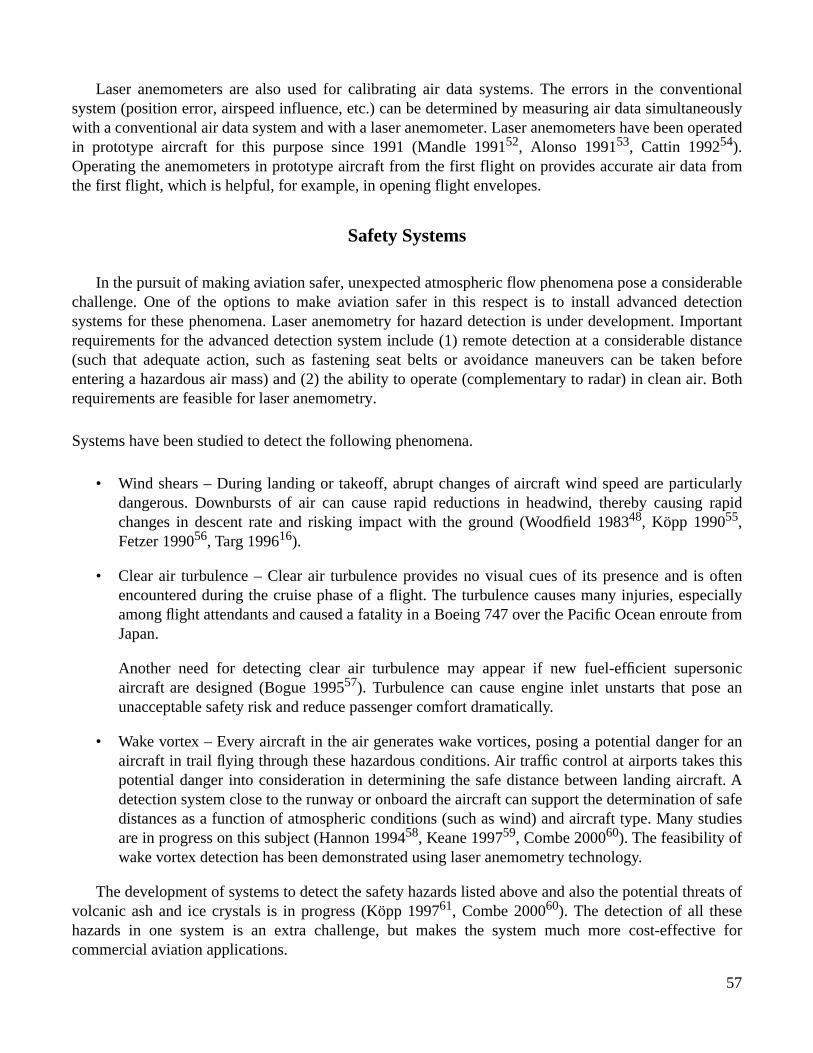
57
Laser anemometers are also used for calibrating air data systems. The errors in the conventionalsystem (position error, airspeed influence, etc.) can be determined by measuring air data simultaneouslywith a conventional air data system and with a laser anemometer. Laser anemometers have been operatedin prototype aircraft for this purpose since 1991 (Mandle 1991
52
, Alonso 1991
53
, Cattin 1992
54
).Operating the anemometers in prototype aircraft from the first flight on provides accurate air data fromthe first flight, which is helpful, for example, in opening flight envelopes.
Safety Systems
In the pursuit of making aviation safer, unexpected atmospheric flow phenomena pose a considerablechallenge. One of the options to make aviation safer in this respect is to install advanced detectionsystems for these phenomena. Laser anemometry for hazard detection is under development. Importantrequirements for the advanced detection system include (1) remote detection at a considerable distance(such that adequate action, such as fastening seat belts or avoidance maneuvers can be taken beforeentering a hazardous air mass) and (2) the ability to operate (complementary to radar) in clean air. Bothrequirements are feasible for laser anemometry.
Systems have been studied to detect the following phenomena.
• Wind shears – During landing or takeoff, abrupt changes of aircraft wind speed are particularlydangerous. Downbursts of air can cause rapid reductions in headwind, thereby causing rapidchanges in descent rate and risking impact with the ground (Woodfield 1983
48
, Köpp 1990
55
,Fetzer 1990
56
, Targ 1996
16
).
• Clear air turbulence – Clear air turbulence provides no visual cues of its presence and is oftenencountered during the cruise phase of a flight. The turbulence causes many injuries, especiallyamong flight attendants and caused a fatality in a Boeing 747 over the Pacific Ocean enroute fromJapan.
Another need for detecting clear air turbulence may appear if new fuel-efficient supersonicaircraft are designed (Bogue 1995
57
). Turbulence can cause engine inlet unstarts that pose anunacceptable safety risk and reduce passenger comfort dramatically.
• Wake vortex – Every aircraft in the air generates wake vortices, posing a potential danger for anaircraft in trail flying through these hazardous conditions. Air traffic control at airports takes thispotential danger into consideration in determining the safe distance between landing aircraft. Adetection system close to the runway or onboard the aircraft can support the determination of safedistances as a function of atmospheric conditions (such as wind) and aircraft type. Many studiesare in progress on this subject (Hannon 1994
58
, Keane 1997
59
, Combe 2000
60
). The feasibility ofwake vortex detection has been demonstrated using laser anemometry technology.
The development of systems to detect the safety hazards listed above and also the potential threats ofvolcanic ash and ice crystals is in progress (Köpp 1997
61
, Combe 2000
60
). The detection of all thesehazards in one system is an extra challenge, but makes the system much more cost-effective forcommercial aviation applications.
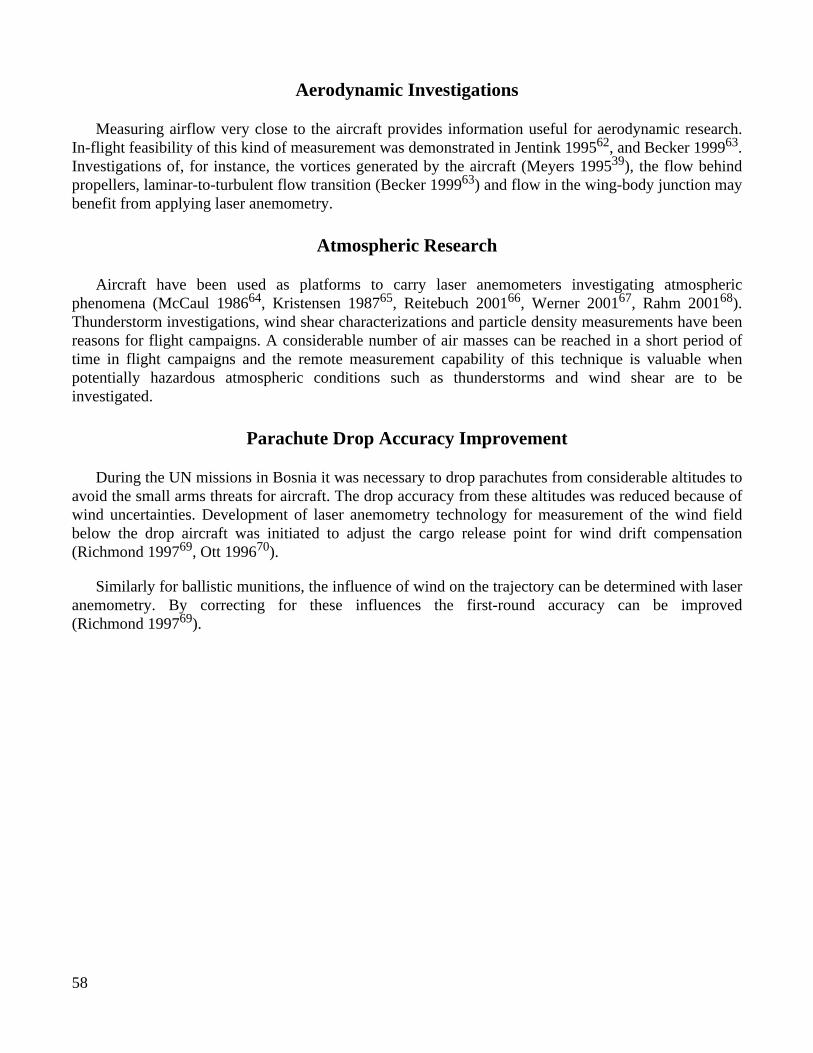
58
Aerodynamic Investigations
Measuring airflow very close to the aircraft provides information useful for aerodynamic research.In-flight feasibility of this kind of measurement was demonstrated in Jentink 1995
62
, and Becker 1999
63
.Investigations of, for instance, the vortices generated by the aircraft (Meyers 1995
39
), the flow behindpropellers, laminar-to-turbulent flow transition (Becker 1999
63
) and flow in the wing-body junction maybenefit from applying laser anemometry.
Atmospheric Research
Aircraft have been used as platforms to carry laser anemometers investigating atmosphericphenomena (McCaul 1986
64
, Kristensen 1987
65
, Reitebuch 2001
66
, Werner 2001
67
, Rahm 2001
68
).Thunderstorm investigations, wind shear characterizations and particle density measurements have beenreasons for flight campaigns. A considerable number of air masses can be reached in a short period oftime in flight campaigns and the remote measurement capability of this technique is valuable whenpotentially hazardous atmospheric conditions such as thunderstorms and wind shear are to beinvestigated.
Parachute Drop Accuracy Improvement
During the UN missions in Bosnia it was necessary to drop parachutes from considerable altitudes toavoid the small arms threats for aircraft. The drop accuracy from these altitudes was reduced because ofwind uncertainties. Development of laser anemometry technology for measurement of the wind fieldbelow the drop aircraft was initiated to adjust the cargo release point for wind drift compensation(Richmond 1997
69
, Ott 1996
70
).
Similarly for ballistic munitions, the influence of wind on the trajectory can be determined with laseranemometry. By correcting for these influences the first-round accuracy can be improved(Richmond 1997
69
).

59
EXISTING SYSTEMS
Introduction
Existing systems illustrate how designers have approached and used optical principles to constructsystems to solve a specific set of requirements. This section provides the reader with examples ofconcepts that have proven to be viable in a specific application. As with other sections in this document,this provides a short overview description of the application and the salient design features. Furtherreading from the referenced literature listed at the back of this document is encouraged to more fullyunderstand the design issues and approaches.
Air Data System Calibration and Air Data Operational Measurement
With all conventional pneumatic air data systems the objective is to measure free stream values.(See definition of free stream in
Terminology and Definitions
, p. 15.) Because it is often impractical toinstall air data booms with sufficient length to obtain free stream samples, errors are present as a result offlow field disturbances caused by the aircraft movement through the air. These errors are repeatable andare functions of measured air data parameters. Although several techniques have been developed over theyears, the most direct and probably the most accurate way to directly obtain the correction factors is tocompare the aircraft air data measurements with optically derived measurements obtainednon-intrusively from the free stream region in front of the aircraft. Two of the applications in this sectionare intended for use as calibration systems.
Thales Air Data Calibration System
For air data system calibration European Aeronautic Defense and Space Company (EADS) applies areference-beam laser anemometry system named ALEV 3 (Alonso 1991
53
, Cattin 1992
54
). This systemmeasures the airspeed of the aircraft in three directions and is installed in prototype aircraft of newaircraft types. The calibrations of the pitot static system and vanes using a laser anemometer have anincreased accuracy compared with those obtained with conventional techniques, such as using a towedcone, tower-fly-by, or a pacer aircraft. Furthermore the availability of true airspeed, angle of attack andangle of sideslip from the first flight moment of a new aircraft type onwards is a valuable feature of thesystem. It precludes the necessity to install a boom on the aircraft. The simplifications in the flight-testprogram of a new aircraft type result in fewer flight test hours and also yield economic benefits.
Figure 16 shows the locations from which the airspeed measurements are taken. The focal length ofthe optical system defines the distance of the measurement volume. (See
Power Effects
, p. 21.) The focaldistance is different for different directions. The distance is chosen such that the airflow in themeasurement volume is not disturbed by the presence of the aircraft, but is not so far away that airturbulence introduces differences between the air speeds experienced by the aircraft and in themeasurement volume. Figure 17 shows a photograph of the system installed in the Airbus A340. Toprovide optical access for the infrared energy exchange from the cabin to the air in the measurementvolume, a cabin window is replaced with a germanium metal plate for a window insert. An atmospherewith dry air is created on the cabin side of the insert to prevent condensation of water on this insert. Thecharacteristics of the system are summarized in Table 6.
60
Figure 16. Typical location of measurement volumes.
Figure 17. Installation of ALEV 3 system in the Airbus A340.
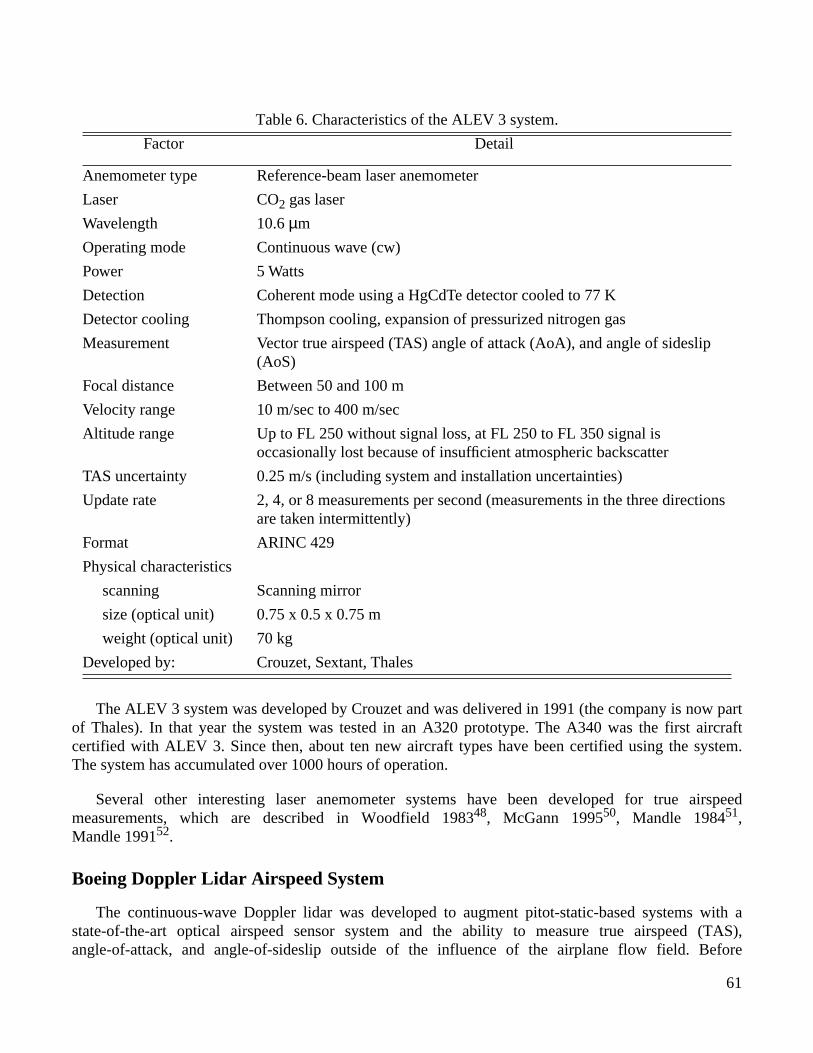
61
The ALEV 3 system was developed by Crouzet and was delivered in 1991 (the company is now partof Thales). In that year the system was tested in an A320 prototype. The A340 was the first aircraftcertified with ALEV 3. Since then, about ten new aircraft types have been certified using the system.The system has accumulated over 1000 hours of operation.
Several other interesting laser anemometer systems have been developed for true airspeedmeasurements, which are described in Woodfield 1983
48
, McGann 1995
50
, Mandle 1984
51
,Mandle 1991
52
.
Boeing Doppler Lidar Airspeed System
The continuous-wave Doppler lidar was developed to augment pitot-static-based systems with astate-of-the-art optical airspeed sensor system and the ability to measure true airspeed (TAS),angle-of-attack, and angle-of-sideslip outside of the influence of the airplane flow field. Before
Table 6. Characteristics of the ALEV 3 system.
Factor Detail
Anemometer type Reference-beam laser anemometer
Laser CO
2
gas laser
Wavelength 10.6
µ
m
Operating mode Continuous wave (cw)
Power 5 Watts
Detection Coherent mode using a HgCdTe detector cooled to 77 K
Detector cooling Thompson cooling, expansion of pressurized nitrogen gas
Measurement Vector true airspeed (TAS) angle of attack (AoA), and angle of sideslip (AoS)
Focal distance Between 50 and 100 m
Velocity range 10 m/sec to 400 m/sec
Altitude range Up to FL 250 without signal loss, at FL 250 to FL 350 signal is occasionally lost because of insufficient atmospheric backscatter
TAS uncertainty 0.25 m/s (including system and installation uncertainties)
Update rate 2, 4, or 8 measurements per second (measurements in the three directions are taken intermittently)
Format ARINC 429
Physical characteristics
scanning Scanning mirror
size (optical unit) 0.75 x 0.5 x 0.75 m
weight (optical unit) 70 kg
Developed by: Crouzet, Sextant, Thales

62
development of the current system, conventional CW or pulsed Doppler lidar systems were used.Previous systems have required large, inefficient laser sources to achieve the power needed to maintainacceptable data rates under clear air (low aerosol density) atmospheric conditions. Unlike some earliersystems, this one is built around a diode-pumped, solid-state laser.
Boeing Defense and Space Group, Seattle, Washington has been improving the enhanced mode lidar(EML) concept for use as a line-of-sight optical airspeed sensor (McGann 1995
50
, Erwin 1993
71
). Thisconcept exploits the fact that as the beam is focused to a small focal volume (fig. 18), obtaining a returnsignal from discrete aerosols is possible (fig. 19). This signal is much greater than that predicted by theconventional lidar signal power equation. As the signal per aerosol increases with sharper focusing, thenumber of aerosols in the detection volume decreases proportionately, thereby increasing thebackscattered signal variability. Under these conditions, aerosols pass individually through the detectionvolume. Each time an aerosol is present, a signal pulse of high-SNR is received. The high-SNR conditionrequires less power than a conventional lidar system and a low-power laser may be used. Using lowpower is a viable option when the required sensing range is limited, and the aerosol density is highenough to provide an adequate data rate (sufficient rate of aerosols transiting the focal region). Largeaerosols in the focal region increase the signal level and partially offset the range limitation. The signalpower returned from each individual aerosol is constant for a given size of aerosol regardless of thenumber density.
Table 7. Characteristics of the Boeing Doppler lidar airspeed system.
Factor Detail
Anemometer type Reference-beam laser anemometer
Laser NdYAG
Wavelength 1.064
µ
m
Operating mode Continuous wave (cw)
Power 0.5 Watt
Detection Coherent mode using an indium gallium arsenide detector
Measurement Single component flow velocity at a point
Focal distance Between 1 and 2 m
Velocity range 10 m/sec to 400 m/sec
Altitude range Tested up to FL 410
TAS uncertainty 1 m/sec
Update rate Dependent upon particle passage rate
Format RS 232
Physical characteristics
scanning None
size (optical unit) 7.5 x 17.5 x 27.5 cm
weight (optical unit) <5 kg
Developed by: Boeing Information Systems
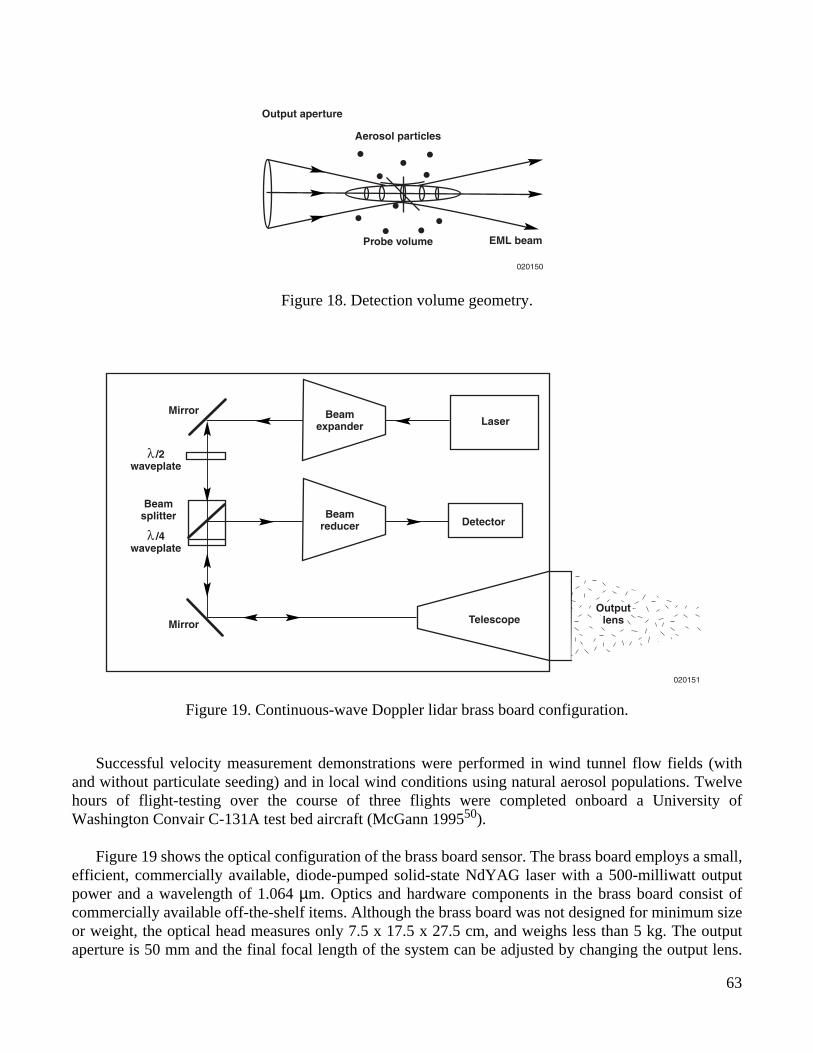
63
Figure 18. Detection volume geometry.
Figure 19. Continuous-wave Doppler lidar brass board configuration.
Successful velocity measurement demonstrations were performed in wind tunnel flow fields (withand without particulate seeding) and in local wind conditions using natural aerosol populations. Twelvehours of flight-testing over the course of three flights were completed onboard a University ofWashington Convair C-131A test bed aircraft (McGann 1995
50
).
Figure 19 shows the optical configuration of the brass board sensor. The brass board employs a small,efficient, commercially available, diode-pumped solid-state NdYAG laser with a 500-milliwatt outputpower and a wavelength of 1.064
µ
m. Optics and hardware components in the brass board consist ofcommercially available off-the-shelf items. Although the brass board was not designed for minimum sizeor weight, the optical head measures only 7.5 x 17.5 x 27.5 cm, and weighs less than 5 kg. The outputaperture is 50 mm and the final focal length of the system can be adjusted by changing the output lens.
Output aperture
Aerosol particles
Probe volume EML beam
020150
Beamexpander
Beamreducer
Laser
Detector
Telescope
Mirror
Mirror
λ /2waveplate
λ /4waveplate
Beamsplitter
Outputlens
020151
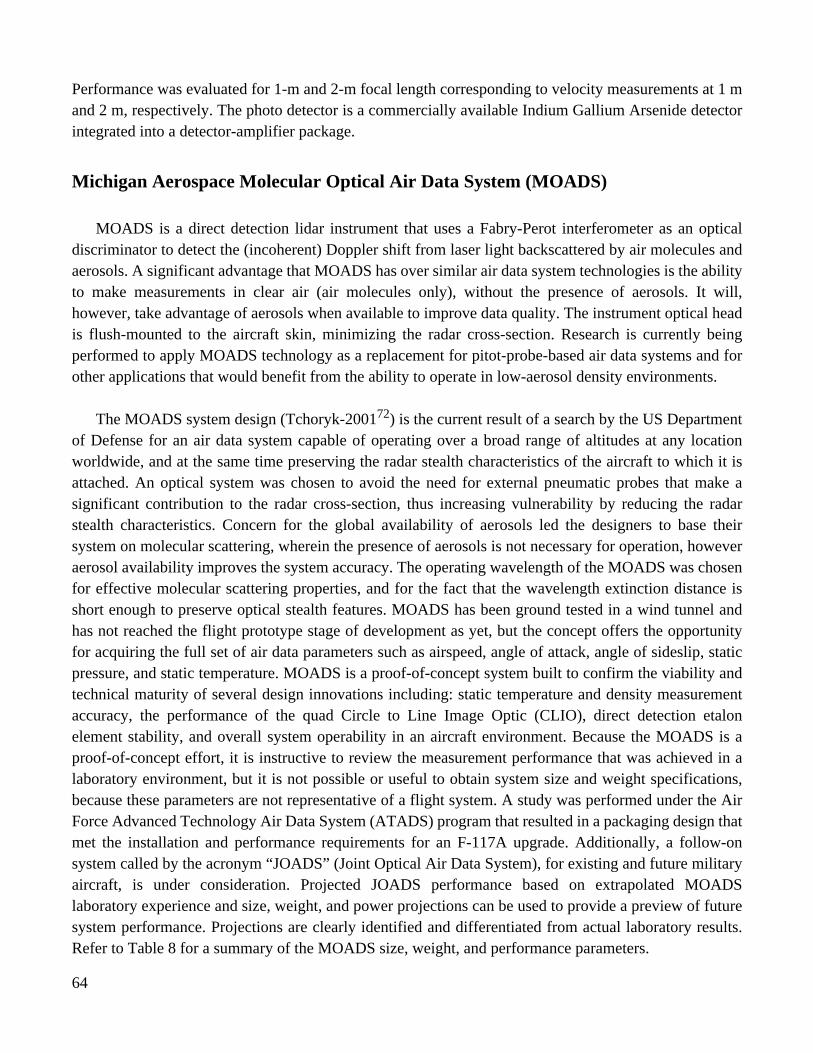
64
Performance was evaluated for 1-m and 2-m focal length corresponding to velocity measurements at 1 mand 2 m, respectively. The photo detector is a commercially available Indium Gallium Arsenide detectorintegrated into a detector-amplifier package.
Michigan Aerospace Molecular Optical Air Data System (MOADS)
MOADS is a direct detection lidar instrument that uses a Fabry-Perot interferometer as an opticaldiscriminator to detect the (incoherent) Doppler shift from laser light backscattered by air molecules andaerosols. A significant advantage that MOADS has over similar air data system technologies is the abilityto make measurements in clear air (air molecules only), without the presence of aerosols. It will,however, take advantage of aerosols when available to improve data quality. The instrument optical headis flush-mounted to the aircraft skin, minimizing the radar cross-section. Research is currently beingperformed to apply MOADS technology as a replacement for pitot-probe-based air data systems and forother applications that would benefit from the ability to operate in low-aerosol density environments.
The MOADS system design (Tchoryk-2001
72
) is the current result of a search by the US Departmentof Defense for an air data system capable of operating over a broad range of altitudes at any locationworldwide, and at the same time preserving the radar stealth characteristics of the aircraft to which it isattached. An optical system was chosen to avoid the need for external pneumatic probes that make asignificant contribution to the radar cross-section, thus increasing vulnerability by reducing the radarstealth characteristics. Concern for the global availability of aerosols led the designers to base theirsystem on molecular scattering, wherein the presence of aerosols is not necessary for operation, howeveraerosol availability improves the system accuracy. The operating wavelength of the MOADS was chosenfor effective molecular scattering properties, and for the fact that the wavelength extinction distance isshort enough to preserve optical stealth features. MOADS has been ground tested in a wind tunnel andhas not reached the flight prototype stage of development as yet, but the concept offers the opportunityfor acquiring the full set of air data parameters such as airspeed, angle of attack, angle of sideslip, staticpressure, and static temperature. MOADS is a proof-of-concept system built to confirm the viability andtechnical maturity of several design innovations including: static temperature and density measurementaccuracy, the performance of the quad Circle to Line Image Optic (CLIO), direct detection etalonelement stability, and overall system operability in an aircraft environment. Because the MOADS is aproof-of-concept effort, it is instructive to review the measurement performance that was achieved in alaboratory environment, but it is not possible or useful to obtain system size and weight specifications,because these parameters are not representative of a flight system. A study was performed under the AirForce Advanced Technology Air Data System (ATADS) program that resulted in a packaging design thatmet the installation and performance requirements for an F-117A upgrade. Additionally, a follow-onsystem called by the acronym “JOADS” (Joint Optical Air Data System), for existing and future militaryaircraft, is under consideration. Projected JOADS performance based on extrapolated MOADSlaboratory experience and size, weight, and power projections can be used to provide a preview of futuresystem performance. Projections are clearly identified and differentiated from actual laboratory results.Refer to Table 8 for a summary of the MOADS size, weight, and performance parameters.
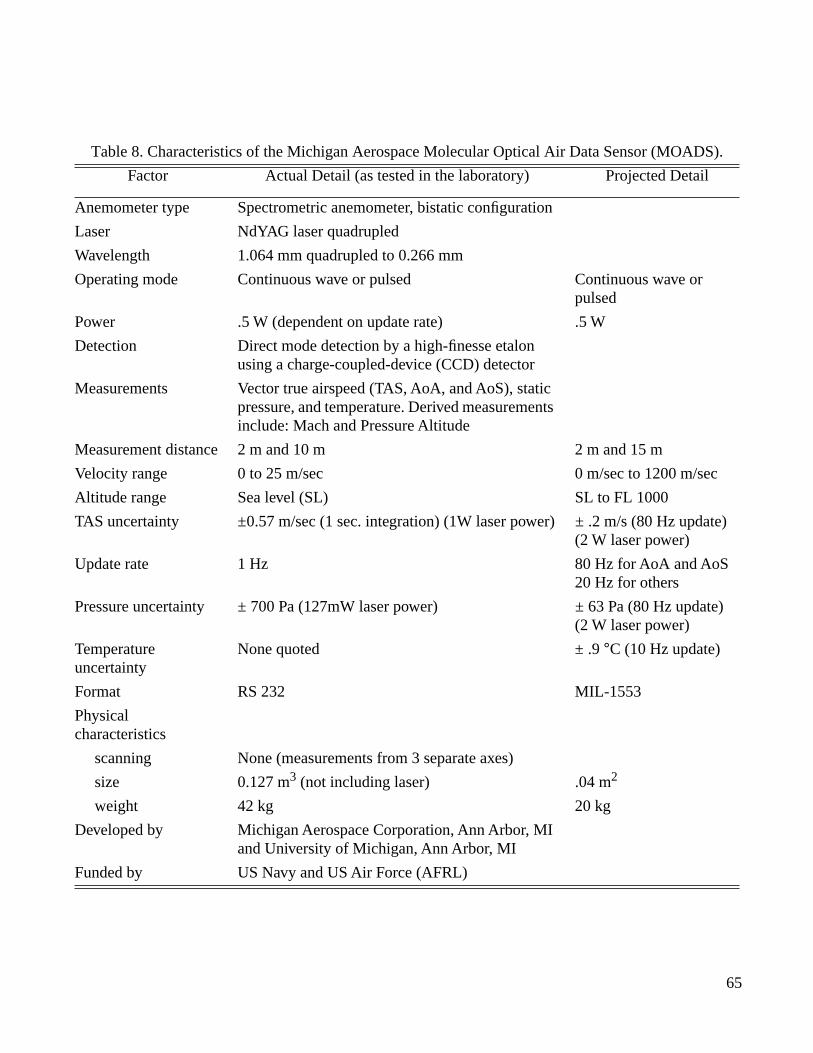
65
Table 8. Characteristics of the Michigan Aerospace Molecular Optical Air Data Sensor (MOADS).
Factor Actual Detail (as tested in the laboratory) Projected Detail
Anemometer type Spectrometric anemometer, bistatic configuration
Laser NdYAG laser quadrupled
Wavelength 1.064 mm quadrupled to 0.266 mm
Operating mode Continuous wave or pulsed Continuous wave or pulsed
Power .5 W (dependent on update rate) .5 W
Detection Direct mode detection by a high-finesse etalon using a charge-coupled-device (CCD) detector
Measurements Vector true airspeed (TAS, AoA, and AoS), static pressure, and temperature. Derived measurements include: Mach and Pressure Altitude
Measurement distance 2 m and 10 m 2 m and 15 m
Velocity range 0 to 25 m/sec 0 m/sec to 1200 m/sec
Altitude range Sea level (SL) SL to FL 1000
TAS uncertainty ±0.57 m/sec (1 sec. integration) (1W laser power) ± .2 m/s (80 Hz update)(2 W laser power)
Update rate 1 Hz 80 Hz for AoA and AoS20 Hz for others
Pressure uncertainty ± 700 Pa (127mW laser power) ± 63 Pa (80 Hz update)(2 W laser power)
Temperature uncertainty
None quoted ± .9
°
C (10 Hz update)
Format RS 232 MIL-1553
Physical characteristics
scanning None (measurements from 3 separate axes)
size 0.127 m
3
(not including laser) .04 m
2
weight 42 kg 20 kg
Developed by Michigan Aerospace Corporation, Ann Arbor, MI and University of Michigan, Ann Arbor, MI
Funded by US Navy and US Air Force (AFRL)

66
The MOADS sensor projects ultraviolet radiation in three directions, then senses the backscatter fromthe intersection of the beam volume and the detection optics fields of view. The system design is basedon the bistatic concept (as defined in
Terminology and Definitions
, p. 13) and uses masking to delineatethe measurement volume (as described in the section on
Light Source
, p. 20). Direct detection isaccomplished using a high-finesse etalon to extract three velocities in the three directions of beamprojection. Temperature is measured by assessing the spectral width of the backscattered signals from thethree beam directions. The shift in the centroid of the backscattered signal is indicative of the meanvelocity of the air molecules, which is directly related to the static temperature of the air. Density ismeasured by assessing the magnitude of the backscattered signal after removing that componentattributable to aerosol backscatter. Earlier sections of this document (
Characteristics of molecularscattered light
, p. 26, and
Molecular density variation in the atmosphere
, p. 27) provide a short overviewof density and temperature measurement using molecular backscatter. Pressure is computed by applyingtemperature and density into the perfect gas law. Figure 20 illustrates the prototype optical head and fiberoptic coupled Signal Processor-Detector assembly.
The outputs from the three etalon detector channels are digitally encoded and processed to providethe air data parameters at the required update rate. MOADS update rate, measurement accuracy, and laserpower are intimately interlinked as noted in Table 8. Measurement accuracy is inversely proportional tothe inverse second-power of the laser power output.
The primary value of the MOADS activity was to confirm the theoretical assumptions regarding thelaser system performance and the statistics that drive this performance. With the information confirmedregarding the laws governing the operation of an ultraviolet-based laser air data system, it has beenpossible to predict with a reasonable degree of certainty the expected performance of a future systemdesigned according to the operating laws. A primary requirement is the laser power necessary forachieving the specified measurement accuracy. The next phase of MOADS development involves alow-dynamics flight demonstration of the current prototype and funding the production of a ruggedizedlaser capable of operating in a high-dynamics environment. This laser power requirement will await thematuration of this technology to allow production of these systems at reasonable prices.

67
Warning System for Atmospheric Threat
Thales Wake Vortex System
There are several systems under investigation for the detection of atmospheric threats to aircraft.A promising approach is followed by a European consortium under the leadership of Thales, Valence,France in the Multifunction Future Laser Atmospheric Measurement Equipment (MFLAME) project(Combe - 2000). The objectives of the project are to develop an airborne system for detecting wakevortices, wind shear, clear air turbulence, volcanic ash, mountain rotor, and hail with one system. Thesehazards are not detected with onboard weather radar. The system is based on a reference-beam laseranemometer. The pulsed laser of the system emits light at a 2-micrometer wavelength with a repetitionrate of 500 pulses per second. An air mass in front of the aircraft at 800 m to 2300 m and in a 3-degreeby 12-degree solid angle is scanned in three seconds. From each pulse the velocity distributionat 21 distances is derived using time-gating as shown in figure 21. In this way, 21 images with1500 velocities are gathered by the system. In these image patterns characteristics for the differenthazards are searched. If a hazard is detected, an alarm is generated for use in the cockpit.
The first experiments were done in early 2000 with a prototype system installed on the ground, 600 mbefore the runway threshold of Toulouse Airport, in Toulouse, France. Images of airflow behind landingaircraft were gathered with a system for optimizing vortex image recognition algorithms and are shownin figure 21. The eventual goal is to develop equipment for installation on commercial airliners.
Miniaturization of the system and implementation of a system for the correction of aircraft motion arethe next steps in the development. For widespread application of this system, low cost is a requirement.
Figure 20. MOADS prototype optical head and signal processor and detector.

68
Figure 21. Images of vortices obtained with the ground-based demonstrator.

69
ACLAIM Airborne Forward-Looking Turbulence Warning System
The detection of turbulence before it reaches the airplane has been a goal of the ACLAIM programsince its inception in 1994. ACLAIM stands for Airborne Coherent Lidar for Advanced In-flightMeasurements, and was a NASA/Dryden-led program to develop and demonstrate an airborne Dopplerlidar system for look-ahead turbulence detection. Turbulence detection has several tangible benefits forcommercial airplanes.
Aircraft engine inlets for supersonic aircraft are susceptible to an unstart condition that causes suddendramatic changes in drag and thrust. These drag and thrust changes precipitate motions to the subjectaircraft that are clearly unacceptable for commercial revenue passenger operations. Atmosphericturbulence is a major factor in precipitating inlet unstart. The original objective for the ACLAIM programwas to detect turbulence from supersonic aircraft with sufficient warning time to configure the inletfor safe transit of the turbulent atmospheric region. It was the need to operate in the high-speedsupersonic flight regime with large Doppler frequency shift that generated a requirement to offset thetransmitted frequency to keep the received difference frequency within the detector bandwidth. Thisapproach is discussed in
Burst Frequency Signal Processors
, p. 42. Table 9 is a summary of theACLAIM characteristics.
Table 9. Characteristics of the ACLAIM forward-looking turbulence warning system.
Factor Detail
Anemometer type: Reference beam laser Doppler anemometer
Laser Tm Ho YAG
Wavelength 2.012
µ
m
Operating mode Pulsed
Power 12 mJ x 100 pps = 1.2 watts
Detection Coherent mode using avalanche silicon photodiode
Measurement Single component airspeed at 96 ranges to maximum range
Distance 0 to >10 Km
Size of measurement volume ~100m long
×
0.1 m diameter
Physical characteristics
Size (transceiver) .5 m length, .4 m width
Size (optical unit) Diameter 0.03 m, length 0.115 m
Developed by Coherent Technologies, Inc.
Funded by NASA Dryden Flight Research Center, Edwards, CA
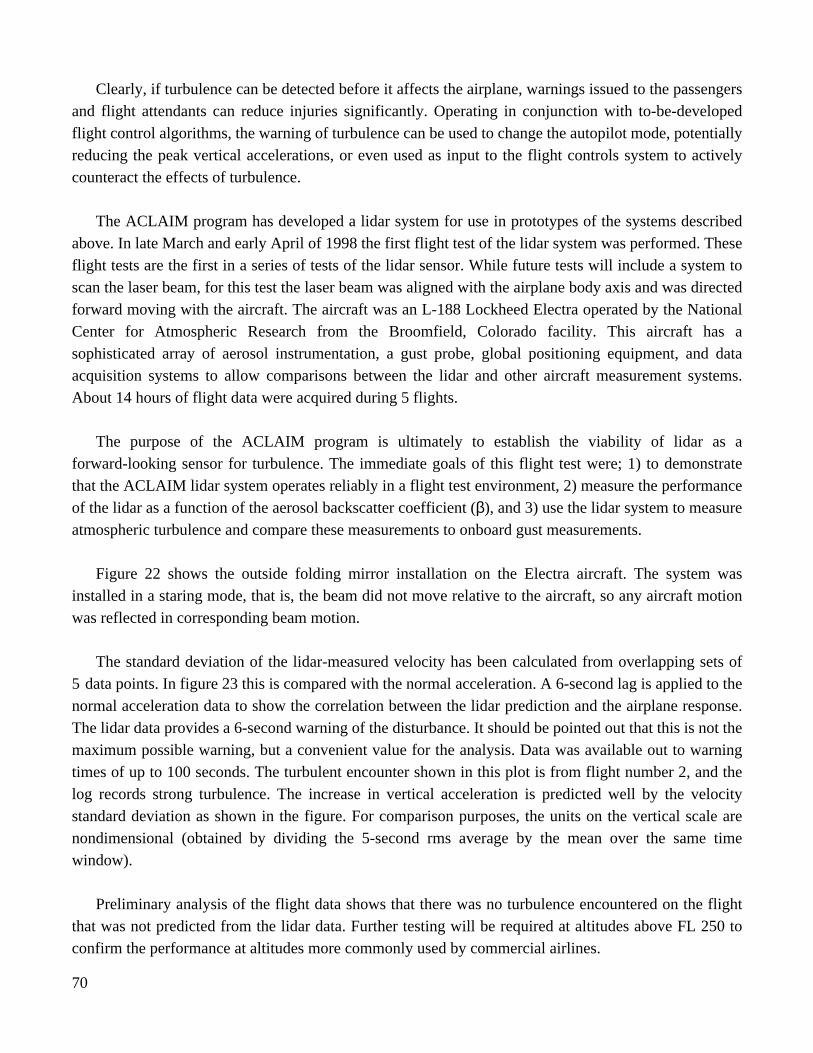
70
Clearly, if turbulence can be detected before it affects the airplane, warnings issued to the passengersand flight attendants can reduce injuries significantly. Operating in conjunction with to-be-developedflight control algorithms, the warning of turbulence can be used to change the autopilot mode, potentiallyreducing the peak vertical accelerations, or even used as input to the flight controls system to activelycounteract the effects of turbulence.
The ACLAIM program has developed a lidar system for use in prototypes of the systems describedabove. In late March and early April of 1998 the first flight test of the lidar system was performed. Theseflight tests are the first in a series of tests of the lidar sensor. While future tests will include a system toscan the laser beam, for this test the laser beam was aligned with the airplane body axis and was directedforward moving with the aircraft. The aircraft was an L-188 Lockheed Electra operated by the NationalCenter for Atmospheric Research from the Broomfield, Colorado facility. This aircraft has asophisticated array of aerosol instrumentation, a gust probe, global positioning equipment, and dataacquisition systems to allow comparisons between the lidar and other aircraft measurement systems.About 14 hours of flight data were acquired during 5 flights.
The purpose of the ACLAIM program is ultimately to establish the viability of lidar as aforward-looking sensor for turbulence. The immediate goals of this flight test were; 1) to demonstratethat the ACLAIM lidar system operates reliably in a flight test environment, 2) measure the performanceof the lidar as a function of the aerosol backscatter coefficient (
β
), and 3) use the lidar system to measureatmospheric turbulence and compare these measurements to onboard gust measurements.
Figure 22 shows the outside folding mirror installation on the Electra aircraft. The system wasinstalled in a staring mode, that is, the beam did not move relative to the aircraft, so any aircraft motionwas reflected in corresponding beam motion.
The standard deviation of the lidar-measured velocity has been calculated from overlapping sets of5 data points. In figure 23 this is compared with the normal acceleration. A 6-second lag is applied to thenormal acceleration data to show the correlation between the lidar prediction and the airplane response.The lidar data provides a 6-second warning of the disturbance. It should be pointed out that this is not themaximum possible warning, but a convenient value for the analysis. Data was available out to warningtimes of up to 100 seconds. The turbulent encounter shown in this plot is from flight number 2, and thelog records strong turbulence. The increase in vertical acceleration is predicted well by the velocitystandard deviation as shown in the figure. For comparison purposes, the units on the vertical scale arenondimensional (obtained by dividing the 5-second rms average by the mean over the same timewindow).
Preliminary analysis of the flight data shows that there was no turbulence encountered on the flightthat was not predicted from the lidar data. Further testing will be required at altitudes above FL 250 toconfirm the performance at altitudes more commonly used by commercial airlines.
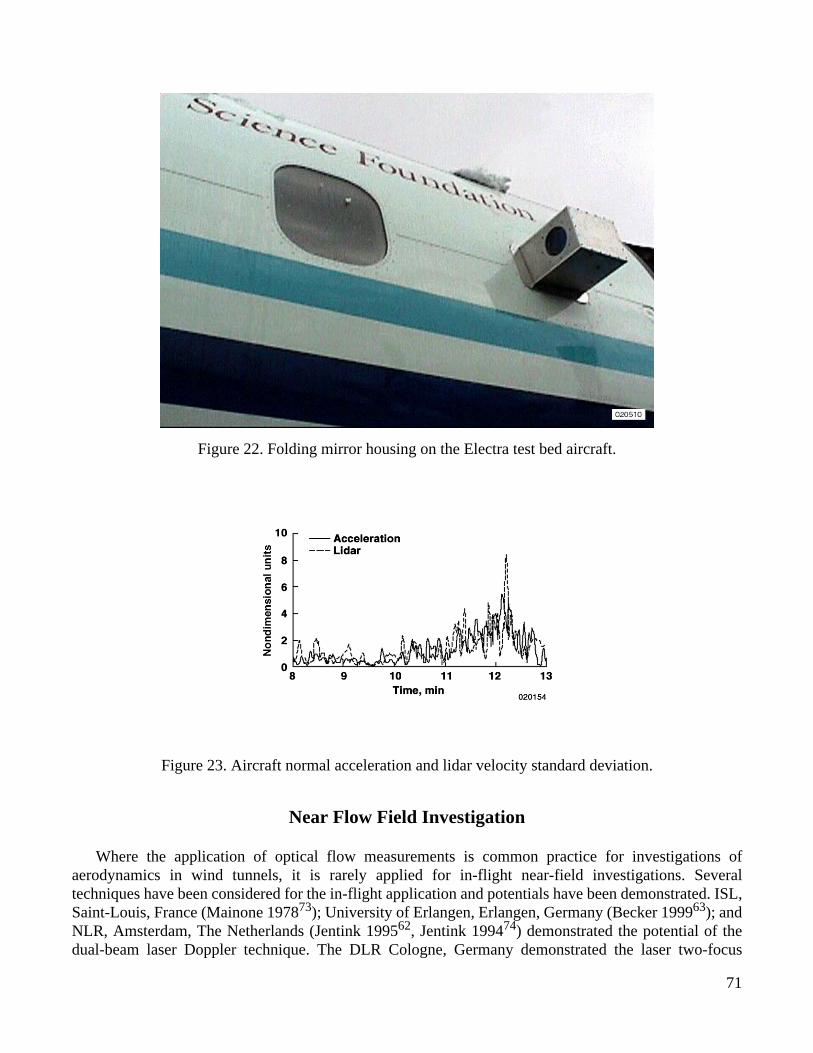
71
Figure 22. Folding mirror housing on the Electra test bed aircraft.
Figure 23. Aircraft normal acceleration and lidar velocity standard deviation.
Near Flow Field Investigation
Where the application of optical flow measurements is common practice for investigations ofaerodynamics in wind tunnels, it is rarely applied for in-flight near-field investigations. Severaltechniques have been considered for the in-flight application and potentials have been demonstrated. ISL,Saint-Louis, France (Mainone 1978
73
); University of Erlangen, Erlangen, Germany (Becker 1999
63
); andNLR, Amsterdam, The Netherlands (Jentink 1995
62
, Jentink 1994
74
) demonstrated the potential of thedual-beam laser Doppler technique. The DLR Cologne, Germany demonstrated the laser two-focus
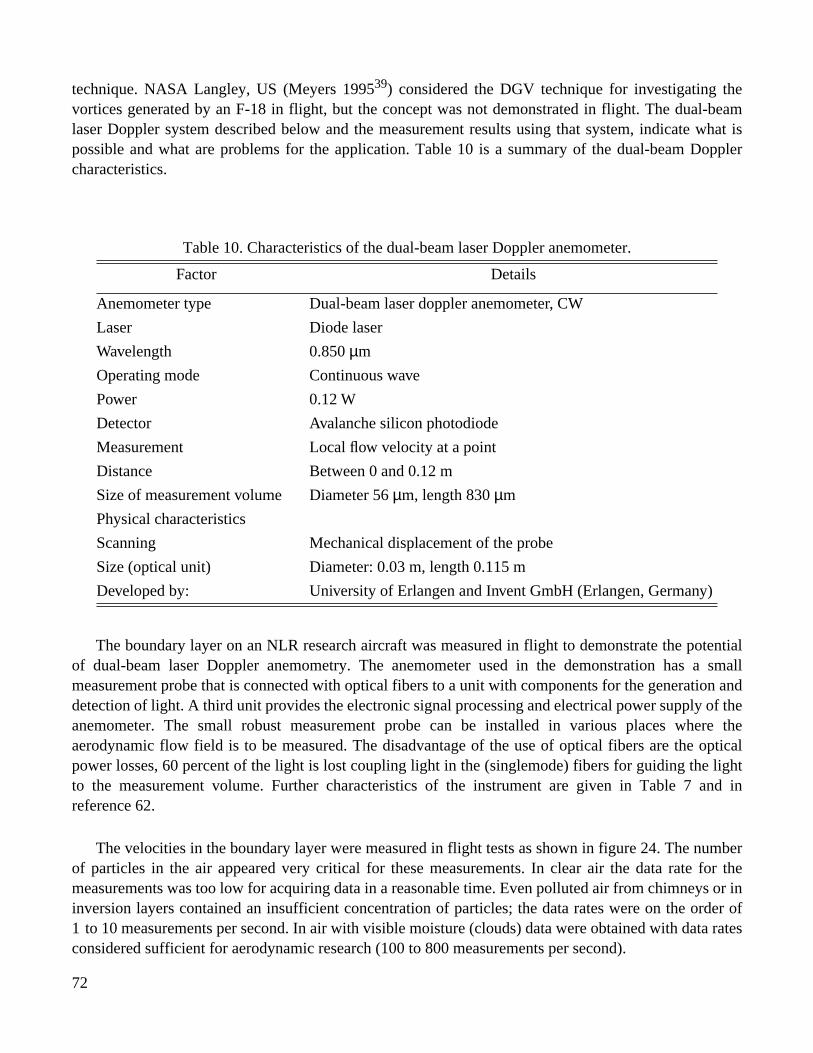
72
technique. NASA Langley, US (Meyers 1995
39
) considered the DGV technique for investigating thevortices generated by an F-18 in flight, but the concept was not demonstrated in flight. The dual-beamlaser Doppler system described below and the measurement results using that system, indicate what ispossible and what are problems for the application. Table 10 is a summary of the dual-beam Dopplercharacteristics.
The boundary layer on an NLR research aircraft was measured in flight to demonstrate the potentialof dual-beam laser Doppler anemometry. The anemometer used in the demonstration has a smallmeasurement probe that is connected with optical fibers to a unit with components for the generation anddetection of light. A third unit provides the electronic signal processing and electrical power supply of theanemometer. The small robust measurement probe can be installed in various places where theaerodynamic flow field is to be measured. The disadvantage of the use of optical fibers are the opticalpower losses, 60 percent of the light is lost coupling light in the (singlemode) fibers for guiding the lightto the measurement volume. Further characteristics of the instrument are given in Table 7 and inreference 62.
The velocities in the boundary layer were measured in flight tests as shown in figure 24. The numberof particles in the air appeared very critical for these measurements. In clear air the data rate for themeasurements was too low for acquiring data in a reasonable time. Even polluted air from chimneys or ininversion layers contained an insufficient concentration of particles; the data rates were on the order of1 to 10 measurements per second. In air with visible moisture (clouds) data were obtained with data ratesconsidered sufficient for aerodynamic research (100 to 800 measurements per second).
Table 10. Characteristics of the dual-beam laser Doppler anemometer.
Factor Details
Anemometer type Dual-beam laser doppler anemometer, CW
Laser Diode laser
Wavelength 0.850
µ
m
Operating mode Continuous wave
Power 0.12 W
Detector Avalanche silicon photodiode
Measurement Local flow velocity at a point
Distance Between 0 and 0.12 m
Size of measurement volume Diameter 56
µ
m, length 830
µ
m
Physical characteristics
Scanning Mechanical displacement of the probe
Size (optical unit) Diameter: 0.03 m, length 0.115 m
Developed by: University of Erlangen and Invent GmbH (Erlangen, Germany)

73
Figure 24. Normalized air velocities measured with dual-beam LDA in the boundary layer.
These measurements were obtained from the boundary layer of the fuselage of the NLR CessnaCitation II. The results are displayed as a function of the distance in the boundary layer, where 0 mmcorresponds to the aircraft skin. Velocities are normalized on TAS and were measured at 100 kts TAS (
∆
)and 180 kts TAS (O). Lines are drawn to guide the eye to the groupings of data points.
In very early experiments during the years from 1976 to 1984, ISL experienced similar limitationsresulting from low particle concentrations with a dual-beam laser-pulsed Doppler anemometer(Mainone 1978
73
). Applying lasers with higher light power and with shorter wavelength than were usedin these early experiments may reduce the limitations (Grosche 2000
75
), but the extent of the reductionsis currently not clear. Applying seeding particles in the airflow, which is common practice forinvestigations in wind tunnels, is not an option for most in-flight applications, as this disturbs the flowthat is to be measured.
Even smaller dual-beam laser anemometers have been developed, such as those at ISL (Damp1991
76
, Damp 1994
77
). The size of the optical head of the anemometer is 50 x 50 x 50 mm
3
and theelectronics is integrated in a unit of the same size. As yet, the unit has not been flight tested.
.8
Knots
LDA velocity normalized on TAS.9 1.0 1.1.7.6.5
Dis
tan
ce,m
m
120
100
80
60
100180
40
20
0
020155

74
FUTURE PROSPECTS AND DIRECTIONS
Introduction
The future of optical airflow measurements in flight is discussed using an approach in which trendsare analyzed from two different perspectives. On one hand there are several needs for in-flightmeasurements that may be met by applying optical airflow measurements. On the other hand the newtechnology developments in optical components, mostly for optical communication, provide the avionicsdesign engineer and flight test instrumentation engineer a perspective of developing systems with lowpower consumption and small size. Both perspectives are discussed below, where the current and nearfuture limitations and challenges for the introduction of optical airflow measurements in flight are alsoaddressed.
The Need Perspective
The need for low radar cross-sections and the increased dynamics of modern fighter aircraft generatenew requirements for optical air data systems. The introduction of optical airflow measurements for thisflight-critical operational application requires that questions of system reliability must be answered,particularly regarding continuity of signals. Apart from the loss of signal because too few particles are inthe air, there should also be a solution for the measurements in air with a very large number of scatterers.The availability of signals generated by aerosols needs further investigation, particularly in the uppertroposphere where the aerosol density may sometimes be insufficient for some systems. Light scatteringon air molecules instead of aerosols may be a solution for the insufficient aerosol condition, but theseanemometers, that are based on Rayleigh scattering, are not mature and require further development andoperational flight experience before the potential can be assessed. Further definition is required in theareas of size, cost, and maintainability. With new components becoming available, smaller size, lessweight, lower cost, and higher reliability systems are easier to design and construct.
The request from society to improve flight safety stimulates the development of remote detection ofatmospheric hazards that are not now detected with conventional weather radar. Optical airflowmeasurements are showing promise for this application. Optical measurements with onboard systemsseem more promising than ground systems or satellite systems, as the air space in the vicinity of aspecific aircraft can be searched for hazards instead of conducting more general overall searches of theatmosphere. Onboard systems face the high operational requirements that are mentioned above for airdata system applications. As the application is directed more toward commercial airliner applications, thelimitation on the cost of systems is probably even more stringent than for air data systems alone.Widespread application in this area may await the next generation of technology to achieve cost andoperational requirements.
Needs for the other applications mentioned in this volume have a much smaller impact on aircraftoperations in general. Laser anemometry has proven to be a valuable technique in many aviation researchprojects where remote detection in “clean” air (using only naturally occurring aerosols) is unique. For theauthors there is no doubt that this technique will find further applications in flight research that utilize itsunique features. In general, only a few tailored systems will be needed for the applications that supportspecific research goals.

75
Some systems can also be expected to be introduced for air data system calibrations. The maturity ofreference-beam laser anemometry for this application has already been proven and expanded use of thetechnique is expected for calibrating air data systems of new aircraft types. The availability of smallsystems that are easy to operate will stimulate the use of this application.
The need for improved parachute drop accuracy is for only a few specialized operations. The opticalairflow measurement technique seems to fulfill the requirements for these operations quite satisfactorily.Further applications of this technique seems likely.
The New Technology Perspective
The development of new lasers is expected to markedly increase the availability of very usefulcomponents for in-flight optical airflow measurement systems. Smaller lasers with improved opticalperformance, such as those with high-energy conversion efficiency, Gaussian beam profiles (at both the“eye-safe” wavelengths and in the blue and UV wavelengths) are expected to become available fromdevelopments in the optical communication community. Introduction of these new lasers in systems foroptical airflow measurements is likely to alleviate several limitations for the installation and the operationof systems.
Technology to miniaturize systems, including optical systems, is found in the integrated circuit andsilicon chip operations. Integrated optics and Microelectromechanical systems (MEMS) can provide avaluable spin-off for the development of optical flow meters. In the area of signal processing, theever-increasing potential of digital signal processing can alleviate the burden of performing complicatedprocessing and interpretation algorithms in real time.
Regretfully the methods to measure air flow for ground applications, such as wind tunnel settings, arenot the same as the methods that are most promising for the in-flight application. The possibility to seedair with particles for optical flow measurements on the ground and the different requirements for theground applications lead to the reference beam technique seldom being applied on the ground, whereas itis the most promising method in flight.
Concluding Remark
In the future interesting research and development can be expected from optical airflow measurementin flight. Major improvements in avionics and flight test instrumentation can result from this research anddevelopment.
Dryden Flight Research CenterNational Aeronautics and Space AdministrationEdwards, California, August 20, 2002

76
REFERENCES
References Cited in Text
1.
Safe
Use of Lasers in an Outdoor Environment,
ANSI Z136.6-2000
,
American Nat. Std. Institute(ANSI), 2000.
2.
American National Standard for Safe Use of Lasers,
ANSI Z136.1-2000, American Nat. Std.Institute (ANSI), 2000, Laser Institute of America, Orlando, FL, 2000.
3. Silfvast, William T.,
Laser Fundamentals
, Cambridge University Press, Cambridge, UK, 1996.
4. Loudon, Rodney,
The quantum theory of light
, second ed., Clarendon Press, Oxford, UK, 1983.
5. Vaughan, J. M. and P. A. Forrester, “Laser Doppler Velocimetry Applied to the Measurement ofLocal and Global Wind,”
Wind Engineering
, vol. 13, No. 1, January 1989.
6. Kogelnik, H. and T. Li, “Laser beams and resonators,”
Applied Optics,
vol. 5, October 1966,pp. 1550–1567.
7. Harris, Michael, Guy N. Pearson, Kevin D. Ridley, Christer J. Karlsson, Fredrik A. A. Olsson, andDietmar Letalick, “Single-particle laser Doppler anemometry at 1.55 m,”
Applied Optics
, vol. 40,no. 6, 2001, pp. 969–973.
8. van de Hulst, H. C.,
Light Scattering by Small Particles
, Second ed., Dover Publications Inc., NewYork, 1981.
9. Mendoza, J., I. Catton, and M. Azzazy, “The Feasibility of Evaluating Flowfield Temperatures andPressures Using Broadband Excitation and Detection,”
Proceedings of ASME FED SummerMeeting: Laser Anemometry & Experimental and Numerical Flow Visualization Symposium,
FEDSM98-5257, Washington, DC, USA, June 21–25, 1998.
10. Azzazy, Medhat, John B. Abbiss, and Robert W. McCullough, “Determination of Aircraft PressureAltitude and Ambient Temperature Using Fluorescence and Rayleigh Scattered Radiation from aContinuum Source,”
Combusting Flow
Diagnostics
, NATO Science Series E:
Applied Sciences
,vol. 207, Paper no. 24, published by Kluwer Academic Publishers, April 1990.
11. Mie, G., “Optics of Turbid Media,”
Ann. Phys
., vol. 25, no. 3, 1908, pp. 377–445.
12.
Laser Speckle and Related Phenomena
, edited by J. C. Dainty, Series: Topics in Applied Physics,vol. 9, Springer-Verlag, New York, 1975.
13. Vaughan, J. M., D. W. Brown, C. Nash, S. B. Alejandro, and G. G. Koenig, “Atlantic atmosphericaerosol studies: 2. Compendium of airborne backscatter measurements at 10.6
µ
m,”
Journal ofGeophysical Research,
vol. 100, no. D1, January 1995, pp. 1043–1065.
14. Deirmendjian, D., “Scattering and Polarization Properties of Water Clouds and Hazes in the Visibleand Infrared,”
Applied Optics
, vol. 3, no. 2, February 1964, pp. 187–196.
µ

77
15. Kane, Thomas J., Bingkun Zhou, and Robert L. Byer, “Potential for coherent Doppler wind velocitylidar using neodymium lasers,”
Applied Optics
, vol. 23, no. 15, August 1984, p. 2477.
16. Targ, Russell, Bruce C. Steakley, James G. Hawley, Lawrence L. Ames, Paul Forney, DavidSwanson, Richard Stone, Robert G. Otto, Vassilis Zarifis, Philip Brockman, Raymond S. Calloway,Sarah Harrell Klein, and Paul A. Robinson, “Coherent lidar airborne wind sensor II: flight-testresults at 2 and 10
µ
m,”
Applied Optics,
vol. 35, no. 36, December 1996, p. 7117.
17. Sonnenschein, C. M. and F. A. Horrigan, “Signal-to-Noise Relationships for Coaxial Systems thatHetrodyne Backscatter from the Atmosphere,”
Applied Optics,
vol. 10, no. 7, July 1971,pp. 1600–1604.
18. Keeler, R. J., R. J. Serafin, R. L. Schwiesow, D. H. Lenschow, J. M. Vaughan, and A. A. Woodfield,“An Airborne Laser Air Motion Sensing System, Part 1: Concept and Preliminary Experiment,”
Journal of Atmospheric and Oceanic Technology
, vol. 4, March 1987, pp. 113–127.
19. Vaughan, J. M., R. D. Callan, D. A. Bowdle, and J. Rothermel, “Spectral analysis, digitalintegration, and measurement of low backscatter in coherent laser radar,”
Applied Opt
ics, vol. 28,no. 15, August 1989, p. 3008.
20.
Handbook of Optics, Volume 1, Fundamentals, Techniques, and Design
, Second ed., edited byMichael Bass, Eric W. Van Stryland, David R. Williams, and William L. Wolfe, McGraw-Hill, Inc.,New York, 1995.
21. Born, Max and Emil Wolf,
Principles of optics
,
Electromagnetic theory of propagation, interferenceand diffraction of light
, Seventh (Expanded) ed., Cambridge University Press, UK, 1970.
22. Hecht, Jeff,
The Laser Guidebook,
Optical and Electro-optical Engineering Series, Second ed.,McGraw-Hill, New York, 1992.
23. Yu, Francis T. S. and Xiangyang Yang,
Introduction to Optical Engineering
, Cambridge UniversityPress, Cambridge, 1997.
24. Bachalo, W. D. and M. J. Houser, “Phase/Doppler spray analyzer for simultaneous measurements ofdrop size and velocity distributions,”
Optical Engineering,
vol. 23, no, 5, Sept.–Oct. 1984,pp. 583–590.
25. Durst, F., G. Brenn, and T. H. Xu, “A review of the development and characteristics ofplanar phase-Doppler anemometry,”
Measurement Science and Technology,
vol. 8, August 1997,pp. 1203–1221.
26. Durst, F., A. Melling, and J. H. Whitelaw,
Principles and Practice of Laser-Doppler Anemometry
,Second ed., Academic Press, London, 1981.
27. Drain, L. E.,
The Laser Doppler Technique
, John Wiley & Sons, Chichester, UK, 1980.
28. Riethmuller, M. L. and A. Boutier, “Laser Velocimetry,”
VKI Lecture Series-05
:
von KarmanInstitute for Fluid Dynamics
, Rhode Saint Genèse, Belgium, 10–14 June 1991.

78
29. Hays, P. B., “High-resolution optical measurements of atmospheric winds from space. 1: Loweratmosphere molecular absorption,”
Applied Optics,
vol. 21, no. 6, March 1982, pp. 1136–1141.
30. Korb, C. Laurence, Bruce M. Gentry, and Chi Y. Weng, “Edge technique: theory and application tothe lidar measurement of atmospheric wind,”
Applied Optics,
vol. 31, no. 21, July 1992,pp. 4202–4213.
31. McGill, Matthew J. and James D. Spinhirne, “Comparison of two direct-detection Doppler lidartechniques,”
Optical Engineering,
vol. 37, no. 10, October 1998, pp. 2675–2686.
32. Korb, C. Laurence, Bruce M. Gentry, and S. Xingfu Li, “Edge technique Doppler lidar windmeasurements with high vertical resolution,”
Applied Optics,
vol. 36, no. 24, August 1997,pp. 5976–5983.
33. Korb, C. Laurence, Bruce M. Gentry, S. Xingfu Li, and Cristina Flesia, “Theory of the double-edgetechnique for Doppler lidar wind measurement,”
Applied Optics,
vol. 37, no. 15, May 1998,pp. 3097–3112.
34. Skinner, Wilbert R. and Paul B. Hays, “Incoherent Doppler lidar for measurement of atmosphericwinds
,”
Proceedings of SPIE vol. 2266,
Optical Spectroscopic Techniques and Instrumentation forAtmospheric and Space Research
, 1994, pp. 383–394.
35. Abreu, Vincent J., John E. Barnes, and Paul B. Hays, “Observations of winds with an incoherentlidar detector,”
Applied Optics
, vol. 31, no. 22, August 1992, pp. 4509–4514.
36. Rees, D., T. J. Fuller-Rowell, A. Lyons, T. L. Killeen, and P. B. Hays, “Stable and rugged etalon forthe Dynamics Explorer Fabry-Perot interferometer. 1: Design and construction,”
Applied Optics,
vol.
21, no. 21, November 1982, pp. 3896–3902.
37. Rees, David and I. Stuart McDermid, “Doppler lidar atmospheric wind sensor: reevaluation of a355-nm Incoherent Doppler lidar,”
Applied Opt
ics, vol. 29, no. 28, October 1990, pp. 4133–4144.
38. Hecht, Eugene and Alfred Zajac,
Optics
, Addison Wesley Publishing Company, 1974.
39. Meyers, James F., “Development of Doppler Global Velocimetry as a Flow Diagnostics Tool,”
Measurement Science and Technology
, vol. 6, no. 6, June 1995, pp. 769–783.
40. Roehle, I., “Doppler Global Velocimetry,”
VKI
Lecture Series 1998-06: Advanced MeasurementTechniques
,
von Karman Institute of Fluid Dynamics
, Brussels, 1998.
41. Roehle, Ingo, “Doppler Global Velocimetry,” paper 4,
RTO AVT Lecture Series, Planar OpticalMeasurement Methods for Gas Turbine Components
, RTO-EN-6, September 1999.
42. Roehle, I., R. Schodl, P. Voigt, and C. Willert, “Recent developments and applications ofquantitative laser light sheet measuring techniques in turbomachinery components,”
MeasurementScience and Technology
, vol. 11, no. 7, 2000, pp. 1023–1035.
43. Roehle, I. and C. E. Willert, “Extension of Doppler global velocimetry to periodic flows,”
Measurement Science and Technology
, vol. 12, no. 4, 2001, pp. 420–431.

79
44. Meyers, James F., Joseph W. Lee, and Richard J. Schwartz, “Characterization of measurement errorsources in Doppler global velocimetry,”
Measurement Science and Technology,
vol. 12, 2001,pp. 357–368.
45. Meyers, James F.,
Investigation and Calculations of Basic Parameters for the Application of theLaser Doppler Velocimeter
, NASA TN D-6125, 1971.
46. Schodl, R., “Laser-two-focus velocimetry,”
Advanced Instrumentation for Aero Engine Components
,AGARD-CP-399, no. 7 (Philadelphia), 1986.
47. Schodl, R., W. Förster, G. Karpinski, H. Krain, and I. Röhle, “3-Component-Doppler-Laser-Two-Focus Velocimetry Applied to a Transonic Centrifugal Compressor,”
10th InternationalSymposium on Application of Laser Techniques to Fluid Mechanics
, Lisbon, Portugal, Paper 7-2,July 2000.
48. Woodfield, Alan A. and J. Michael Vaughan, “Using an Airborne CO
2
Laser for Free StreamAirspeed and Windshear Measurements,”
AGARDograph-AG-272, Advances in Sensors and TheirIntegration into Aircraft Guidance and Control Systems
, no. 7, 1983.
49. Smart, Anthony E., “Optical velocity sensor for air data applications,”
Optical Engineering,
vol. 31,no. 1, January 1992, pp. 166–173.
50. McGann, Rick L., “Flight test results from a low-power Doppler optical air data sensor,” SPIEProceedings vol. 2464,
Air Traffic Control Technologies
, April 1995, pp. 116–124.
51. Mandle, J. and F. X. Weiss, “New calibration methods in air data measurement for low-speedhelicopters,” AGARD-CP-359, no. 16, May 1984.
52. Mandle, Jacques and Eugene Fabacher, “Laser anemometry for flight test,”
Proceedings ETTC '91
,25–26 June 1991, Toulouse, France, pp. 3–4.
53. Alonso, Fernando, “Anemometric Calibration Test Methods for Airbus A330/340,”
ProceedingsETTC
91
, 25–26 June 1991, Toulouse, France, pp. 2–7.
54. Cattin-Valsecchi, F. and C. Lopez, “Utilisation d’un velocimetre laser triaxe pour calibrationanemometrique sur AIRBUS A340,”
AGARD-FMP-Symposium
, AGARD-CP-519, no. 26, 1992.
55. Köpp, F., “Airborne CO
2
Doppler Lidar for Wind Shear Detection,”
Aircraft Integrated MonitoringSystems
, Oberpfaffenhofen, Germany, 1990, pp. 481–499.
56. Fetzer, Gregory J. and Madison J. Post, “Low cost cw CO2 lidar system for low-level wind sheardetection,” Proceedings of SPIE vol. 1222,
Laser Radar V
, 1990, pp. 130–141.
57. Bogue, Rodney K., Harold R. Bagley, David C. Soreide, and David A. Bowdle, “Coherent lidarsolution for the HSCT supersonic inlet unstart problem,” SPIE Proceedings 2464,
Air TrafficControl Technologies
, Paper 13, April 17–21, 1995, pp. 79–93.

80
58. Hannon, Stephen M. and J. Alex Thomson, “Aircraft wake vortex detection and measurementwith pulsed solid-state coherent laser radar,”
Journal of Modern Optics
, vol. 41, no. 11, 1994,pp. 2175–2196.
59. Keane, Mike and Michael Redfern, “Airborne Wind Shear Detection with the MFLAME 2
µ
mLidar,”
Proceedings of the 9th Conference on Coherent Laser Radar
, Linköping, Sweden,June 23–27, 1997, p. 126.
60. Combe, Hubert, Friedrich Köpp, and Mike Keane, “On-Board Wake Vortex Detection: Definition,ground experimentation and results in the MFLAME E.C. Programme,”
3rd Wake-Networkshop,
Great Malvern, UK, 22–23 May 2000. On the Web athttp://www.cerfacs.fr/~wakenet/instru/fields/Malvern-Article.htm.
61. Köpp, Friedrich and Gerd Powilleit, “Investigation of the 3d wake-vortex velocity field for thedevelopment of airborne detection systems,”
Proceedings of the 9th Conference on Coherent LaserRadar
, Linköping, Sweden, June 23–27, 1997, p. 317.
62. Jentink, H. W., M. Beversdorff, and W. Förster, “Laser Anemometry for In-Flight FlowInvestigations,”
Proceedings of the 5th IEEE-ICIASF Conference
, Dayton, Ohio, USA,18–21 July 1995, paper 23.
63. Becker, S., F. Durst, and H. Lienhart, “Laser Doppler Anemometer for In-Flight VelocityMeasurements on Airplane Wings,”
AIAA Journal,
vol. 37, no. 6, June 1999, pp. 680–687.
64. McCaul, Eugene W., Jr., Howard B. Bluestein, and Richard J. Doviak, “Airborne Doppler lidartechniques for observing severe thunderstorms,”
Applied Optics,
vol. 25, no. 5, March 1986,pp. 698–708.
65. Kristensen, Leif and Donald H. Lenschow, “An Airborne Laser Air Motion Sensing System. Part II:Design Criteria and Measurement Possibilities,”
Journal of Atmospheric and Oceanic Technology,
vol. 4, 1987, p. 128.
66. Reitebuch, Oliver, Christian Werner, Ines Leike, Patricia Delville, Pierre H. Flamant,Alexander Cress, and Dirk Engelbart, “Experimental Validation of Wind Profiling Performed bythe Airborne 10-µm Heterodyne Doppler Lidar WIND,”
Journal of Atmospheric and OceanicTechnology
, vol. 18, no. 8, August 2001, pp. 1331–1344.
67. Werner, Ch., P. H. Flamant, O. Reitebuch, F. Köpp, J. Streicher, S. Rahm, E. Nagel, M. Klier,H. Herrmann, C. Loth, P. Delville, Ph. Drobinski, B. Romand, Ch. Boitel, D. Oh, M. Lopez,M. Meissonnier, D. Bruneau, and A. Dabas, “Wind infrared Doppler lidar instrument,”
OpticalEngineeering,
40(1), January 2001, pp. 115–125.
68. Rahm, Stephan, “Precursor experiment for an active true airspeed sensor,”
Optics Letters
, vol. 26,no. 6, March 2001, pp. 319–321.
69. Richmond, R., D. Jewell, J. Carr, and J. Root, “U.S. Air Force Ballistic Winds Program,”SPIE Proceedings Vol. 3065,
Laser Radar Technology and Applications II,
Orlando, Florida,21–25 April 1997, pp. 2–8.
81
70. Ott, J., “Lidar 'reads' air-drop winds,”
Aviation Week & Space Technology
, vol. 144, no. 7,February 12, 1996, p. 44.
71. Erwin, L. L., R. L. McGann, D. C. Soreide, and D. J. Morris, “Enhanced Mode Lidar for AirborneAirspeed Measurement,”
Proceedings of the Seventh Conference on Coherent Laser RadarApplications and Technology
, Paris, France, July 1993.
72. Tchoryk, Pete, Jr., Christopher B. Watkins, Scott K. Lindemann, Paul B. Hays, and Carl A. Nardell,“Molecular Optical Air Data System (MOADS),” SPIE Proceedings 4377,
Laser Radar Technologyand Applications VI
, 16–20 April 2001, Orlando, Florida, Paper 4377-28.
73. Mainone, Dierger and Xavier Bouis, “Verwendung eines Farbstofflasers mit hoher Spitzenleistungund langer Pulsdauer zur Messung der ‘Luftgeschwindigkeit’ vom Flugzeug aus,”
Z. Flugwiss
,Weltraumforsch. 2, Heft 3, 1978, p. 151.
74. Jentink, H. W., M. Stieglmeier, and C. Tropea, “In-Flight Velocity Measurements Using LaserDoppler Anemometry,”
Journal of Aircraft
, vol. 31, no, 2, 1994, pp. 444–446.
75. Grosche, E. G., N. Pape, H. Müller, and V. Strunck, “Range and accuracy of a Laser-DopplerAnemometer for in-flight measurements,”
10th International Symposium on Applications of LaserTechniques to Fluid Mechanics
, 10–13 July 2000, p. 4.2.
76. Damp, Stephan, “Miniature laser Doppler anemometer for sensor concepts,” Proceedings of theSPIE International Symposium of High Power Lasers, Part of OE’LASE’91,
vol. 1418, Paper 52,
Laser Diode Technology and Applications III
, Los Angeles, California, USA, 20–25 January 1991,pp. 459–470.
77. Damp, S. M., E. Sommer, and H. J. Pfeifer, “ASIC based Signal Processing Unit in the MiniatureLDA-Sensor Concept, using Minimal Cross-Correlation,”
Proceedings of the 7th InternationalSymposium on Applications of Laser Techniques to Fluid Mechanics
, Lisbon, Portugal,11–14 July 1994.
Bibliography
Abreu, Vincent J., John E. Barnes, and Paul B. Hays, “Observations of winds with an incoherentlidar detector,” Applied Optics, vol. 31, no. 22, August 1992, pp. 4509–4514.
Alonso, Fernando, “Anemometric Calibration Test Methods for Airbus A330/340,” ProceedingsETTC ‘91, 25–26 June 1991, Toulouse, France, pp. 2–7.
American National Standard for Safe Use of Lasers, ANSI Z136.1-2000, The Laser Institute ofAmerica, American Nat. Std. Institute, Inc. (ANSI), 2000, Orlando, FL, 2000.
Azzazy, Medhat, John B. Abbiss, and Robert W. McCullough, “Determination of Aircraft Pressure,Altitude, and Ambient Temperature Using Fluorescence and Rayleigh Scattered Radiation from aContinuum Source,” Combusting Flow Diagnostics, NATO Science Series E: Applied Sciences,vol. 207, paper 24, published by Kluwer Academic Publishers, April 1990.
82
Bachalo, W. D. and M. J. Houser, “Phase/Doppler spray analyzer for simultaneous measurements ofdrop size and velocity distributions,” Optical Engineering, vol. 23, no, 5, Sept.–Oct. 1984,pp. 583–590.
Becker, S., F. Durst, and H. Lienhart, “Laser Doppler Anemometer for In-Flight VelocityMeasurements on Airplane Wings,” AIAA Journal, vol. 37, no. 6, June 1999, pp. 680–687.
Bilbro, James W., “Atmospheric laser Doppler velocimetry: an overview,” Optical Engineering,vol. 19, no. 4, 1980, pp. 533–542.
Bilbro, James W., C. DiMarzio, D. Fitzjarrald, S. Johnson, and W. Jones, “Airborne Doppler lidarmeasurements,” Applied Optics, vol. 25, no. 21, November 1986, p. 3952.
Bilbro, James W., Steven C. Johnson, and Jeffrey Rothermel, “Wind velocity measurement accuracywith highly stable 12 mJ/pulse high repetition rate CO2 laser master oscillator power amplifier,”NASA CP 2456, Closed-cycle, frequency-stable CO2 laser technology, 1986, pp. 33–45.
Bogue, Rodney K., Harold R. Bagley, David C. Soreide, and David A. Bowdle, “Coherent lidarsolution for the HSCT supersonic inlet unstart problem,” SPIE Proceedings 2464, Air TrafficControl Technologies, paper 13, April 17–21, 1995, pp. 79–93.
Bogue, Rodney, Rick McGann, Thomas Wagener, John Abbiss, and Anthony Smart, “ComparativeOptical Measurements of Airspeed and Aerosols on a DC-8 Aircraft,” Proceedings of the 5thIEEE-ICIASF Conference, Dayton, Ohio, USA, 18–21 July 1995, pp. 56/1–56/25.
Born, Max and Emil Wolf, Principles of optics, Electromagnetic theory of propagation, interferenceand diffraction of light, Seventh (Expanded) ed., Cambridge University Press, UK, 1970.
Cattin-Valsecchi, F. and C. Lopez, “Utilisation d’un velocimetre laser triaxe pour calibrationanemometrique sur AIRBUS A340,” AGARD-FMP-Symposium, AGARD-CP-519, no. 26, 1992.
Combe, Hubert, Friedrich Köpp, and Mike Keane, “On-Board Wake Vortex Detection: Definition,ground experimentation and results in the MFLAME E.C. Programme,” 3rd Wake-Networkshop, Great Malvern, UK, 22–23 May 2000. On the Web athttp://www.cerfacs.fr/~wakenet/instru/fields/Malvern-Article.htm.
Damp, Stephan, “Miniature laser Doppler anemometer for sensor concepts,” Proceedings of theSPIE International Symposium of High Power Lasers, Part of OE’LASE’91, vol. 1418, Paper 52,Laser Diode Technology and Applications III, Los Angeles, California, USA, 20–25 January 1991,pp. 459–470.
Damp, S. M., E. Sommer, and H. J. Pfeifer, “ASIC based Signal Processing Unit in the MiniatureLDA-Sensor Concept, using Minimal Cross-Correlation,” Proceedings of the 7th InternationalSymposium on Applications of Laser Techniques to Fluid Mechanics, Lisbon, Portugal,11–14 July 1994.
Deirmendjian, D., “Scattering and Polarization Properties of Water Clouds and Hazes in the Visibleand Infrared,” Applied Optics, vol. 3, no. 2, February 1964, pp. 187–196.

83
DiMarzio, C., R. Chandler, M. Krause, J. O'Reilly, K. Shaw, and J. Bilbro, “Airborne Lidar DualWedge Scanner,” NASA CP 2228, Abstracts of papers presented at the 11th International LaserRadar Conference, 1982, p. 123.
Drain, L. E., The Laser Doppler Technique, John Wiley & Sons, Chichester, UK, 1980.
Durst, F., G. Brenn, and T. H. Xu, “A review of the development and characteristics ofplanar phase-Doppler anemometry,” Measurement Science and Technology, vol. 8, August 1997,pp. 1203–1221.
Durst, F., A. Melling, and J. H. Whitelaw, Principles and Practice of Laser-Doppler Anemometry,Second ed., Academic Press, London, 1981.
Elliott, Gregory S. and Thomas J. Beutner, “Molecular filter based planar Doppler velocimetry,”Progress in Aerospace Sciences, vol. 35, 1999, pp. 799–845.
Erwin, L. L., R. L. McGann, D. C. Soreide, D. J. Morris, “Enhanced Mode Lidar for AirborneAirspeed Measurement,” Proceedings of the Seventh Conference on Coherent Laser RadarApplications and Technology, Paris, France, July 1993.
Fetzer, Gregory J. and Madison J. Post, “Low cost cw CO2 lidar system for low-level wind sheardetection,” Proceedings of SPIE vol. 1222, Laser Radar V, 1990, pp. 130–141.
Förster, W., “Laser-2-Focus Data Analysis Using a Nonlinear Regression Model,” DLR reportD-51140, Köln, Germany.
Grosche, E. G., N. Pape, H. Müller, and V. Strunck, “Range and accuracy of a Laser-DopplerAnemometer for in-flight measurements,” 10th International Symposium on Applications of LaserTechniques to Fluid Mechanics, 10–13 July 2000, paper 4.2.
Handbook of Optics, Volume 1, Fundamentals, Techniques, and Design, Second ed., edited byMichael Bass, Eric W. Van Stryland, David R. Williams, and William L. Wolfe, McGraw-Hill, Inc.,New York, 1995.
Hannon, Stephen M. and J. Alex Thomson, “Aircraft wake vortex detection and measurementwith pulsed solid-state coherent laser radar,” Journal of Modern Optics, vol. 41, no. 11, 1994,pp. 2175–2196.
Hannon, Stephen M., Harold R. Bagley, and Rodney K. Bogue, “Airborne Doppler Lidar TurbulenceDetection: ACLAIM Flight Test Results,” Proceedings of SPIE vol. 3707, Laser Radar Technologyand Applications, March 1995, pp. 234–243.
Harris, Michael, Guy N. Pearson, Kevin D. Ridley, Christer J. Karlsson, Fredrik A. A. Olsson, andDietmar Letalick, “Single-particle laser Doppler anemometry at 1.55 m,” Applied Optics, vol. 40,no. 6, 2001, pp. 969–973.
Hausamann, Dieter and Brian W. Davis, “Sign of the wind vector: a simple method for itsdetermination with a homodyne cw laser Doppler velocimeter,” Applied Optics, vol. 29, no. 19,July 1990, p. 2919.
µ

84
Hays, P. B., “High-resolution optical measurements of atmospheric winds from space. 1: Loweratmosphere molecular absorption,” Applied Optics, vol. 21, no. 6, March 1982, pp. 1136–1141.
Hecht, Jeff, The Laser Guidebook, Optical and Electro-optical Engineering Series, Second ed.,McGraw-Hill, New York, 1992.
Hecht, Eugene and Alfred Zajac, Optics, Addison Wesley Publishing Company, 1974.
Huffaker, R. Milton and Russell Targ, “Performance Analysis and Technical Assessment of CoherentLidar Systems for Airborne Wind Shear Detection,” SPIE vol. 889 Airborne and Spaceborne Lasersfor Terrestrial Geophysical Sensing, 1988, pp. 65.
Jentink, H. W., M. Beversdorff, and W. Förster, “Laser Anemometry for In-Flight FlowInvestigations,” Proceedings of the 5th IEEE-ICIASF Conference, Dayton, Ohio, USA,18–21 July 1995, paper 23.
Jentink, H. W., M. Stieglmeier, and C. Tropea, “In-Flight Velocity Measurements Using LaserDoppler Anemometry,” Journal of Aircraft, vol. 31, no, 2, 1994, pp. 444–446.
Kane, Thomas J., Bingkun Zhou, and Robert L. Byer, “Potential for coherent Doppler wind velocitylidar using neodymium lasers,” Applied Optics, vol. 23, no. 15, August 1984, p. 2477.
Keane, Mike and Michael Redfern, “Airborne Wind Shear Detection with the MFLAME 2 µmLidar,” Proceedings of the 9th Conference on Coherent Laser Radar, Linköping, Sweden,June 23–27, 1997, p. 126.
Keeler, R. J., R. J. Serafin, R. L. Schwiesow, D. H. Lenschow, J. M. Vaughan, and A. A. Woodfield,“An Airborne Laser Air Motion Sensing System, Part 1: Concept and Preliminary Experiment,”Journal of Atmospheric and Oceanic Technology, vol. 4, March 1987, pp. 113–127.
Kennedy, L. Z. and J. W. Bilbro, “Remote measurement of the transverse wind velocity componentusing a laser Doppler velocimeter,” Applied Optics, vol. 18, no. 17, September 1979, p. 3010.
Kogelnik, H. and T. Li, “Laser beams and resonators,” Applied Optics, vol. 5, October 1966,pp. 1550–1567.
Komine, Hiroshi, Stephen J. Brosnan, William H. Long, and Eddy A. Stappaerts, Doppler GlobalVelocimetry–Development of a Flight Research Instrumentation System for Application toNon-Instrusive Measurements of Flow Field. NASA CR-191490, January 1994.
Köpp, F., “Airborne CO2 Doppler Lidar for Wind Shear Detection,” Aircraft Integrated MonitoringSystems, Oberpfaffenhofen, Germany, 1990, pp. 481–499.
Köpp, Friedrich and Gerd Powilleit, “Investigation of the 3d wake-vortex velocity field for thedevelopment of airborne detection systems,” Proceedings of the 9th Conference on Coherent LaserRadar, Linköping, Sweden, June 23–27, 1997, p. 317.
Korb, C. Laurence, Bruce M. Gentry, and Chi Y. Weng, “Edge technique: theory and application tothe lidar measurement of atmospheric wind,” Applied Optics, vol. 31, no. 21, July 1992,pp. 4202–4213.

85
Korb, C. Laurence, Bruce M. Gentry, and S. Xingfu Li, “Edge technique Doppler lidar windmeasurements with high vertical resolution,” Applied Optics, vol. 36, no. 24, August 1997,pp. 5976–5983.
Korb, C. L.aurence, Bruce M. Gentry, S. Xingfu Li, and Cristina Flesia, “Theory of the double-edgetechnique for Doppler lidar wind measurement,” Applied Optics, vol. 37, no. 15, May 1998,pp. 3097–3112.
Kristensen, Leif and Donald H. Lenschow, “An Airborne Laser Air Motion Sensing System. Part II:Design Criteria and Measurement Possibilities,” Journal of Atmospheric and Oceanic Technology,vol. 4, 1987, p. 128.
Laser Speckle and Related Phenomena, edited by J. C. Dainty, Series: Topics in Applied Physics,vol. 9, Springer-Verlag, New York, 1975.
Loudon, Rodney, The quantum theory of light, Second ed., Clarendon Press, Oxford, UK, 1983.
Mainone, Dierger and Xavier Bouis, “Verwendung eines Farbstofflasers mit hoher Spitzenleistungund langer Pulsdauer zur Messung der ‘Luftgeschwindigkeit’ vom Flugzeug aus,” Z. Flugwiss,Weltraumforsch. 2, Heft 3, 1978, p. 151.
Mandle, Jacques and Eugene Fabacher, “Laser anemometry for flight test,” Proceedings ETTC '91,25–26 June 1991, Toulouse, France, pp. 3–4.
Mandle, J. and F. X. Weiss, “New calibration methods in air data measurement for low-speedhelicopters,” AGARD-CP-359, no. 16, May 1984.
McCaul, Eugene W., Jr., Howard B. Bluestein, and Richard J. Doviak, “Airborne Doppler lidartechniques for observing severe thunderstorms,” Applied Optics, vol. 25, no. 5, March 1986,pp. 698–708.
McGann, Rick L., “Flight test results from a low-power Doppler optical air data sensor,” SPIEProceedings vol. 2464, Air Traffic Control Technologies, April 1995, pp. 116–124.
McGill, Matthew J. and James D. Spinhirne, “Comparison of two direct-detection Doppler lidartechniques,” Optical Engineering, vol. 37, no. 10, October 1998, pp. 2675–2686.
Mendoza, J., I. Catton, and M. Azzazy, “The Feasibility of Evaluating Flowfield Temperatures andPressures Using Broadband Excitation and Detection,” Proceedings of ASME FED SummerMeeting: Laser Anemometry & Experimental and Numerical Flow Visualization Symposium,FEDSM98-5257, Washington, DC, USA, June 21–25, 1998.
Meyers, James F., “Development of Doppler Global Velocimetry as a Flow Diagnostics Tool,”Measurement Science and Technology, vol. 6, no. 6, June 1995, pp. 769–783.
Meyers, James F., Investigation and Calculations of Basic Parameters for the Application of theLaser Doppler Velocimeter, NASA TN D-6125, 1971.
86
Meyers, James F., Joseph W. Lee, and Richard J. Schwartz, “Characterization of measurement errorsources in Doppler global velocimetry,” Measurement Science and Technology, vol. 12, 2001,pp. 357–368.
Meyers, James F. and Michael J. Walsh, Computer Simulation of a Fringe Type Laser Velocimeter,Project Squid Workshop on the Use of the Laser Velocimeter for Flow Measurements, PurdueUniversity, March 27–29, 1974.
Mie, G., “Optics of Turbid Media,” Ann. Phys., vol. 25, no. 3, 1908, pp. 377–445.
Mocker, Hans W. and T. J. Wagener, “Laser Doppler optical air-data system: feasibilitydemonstration and systems specifications,” Applied Optics, vol. 33, no. 27, 1994, p. 6457.
Munoz, R. M., H. W. Mocker, and L. Koehler, “Airborne laser Doppler velocimeter,” Applied Optics,vol. 13, no. 12, 1974, pp. 2890–2898.
Ott, J., “Lidar 'reads' air-drop winds,” Aviation Week & Space Technology, vol. 144, no. 7,February 12, 1996, p. 44.
Post, Madison J. and Richard E. Cupp, “Optimizing a pulsed Doppler lidar,” Applied Optics, vol. 29,no. 28, 1990, pp. 4145–4158.
Rahm, S., “Measurement of a wind field with an airborne continuous-wave Doppler lidar,” OpticsLetters, vol. 20, no. 2, 1995, pp. 216–218.
Rahm, Stephan, “Precursor experiment for an active true airspeed sensor,” Optics Letters, vol. 26,no. 6, March 2001, pp. 319–321.
Rees, David and I. Stuart McDermid, “Doppler lidar atmospheric wind sensor: reevaluation of a355-nm Incoherent Doppler lidar,” Applied Optics, vol. 29, no. 28, October 1990, pp. 4133–4144.
Rees, David, T. J. Fuller-Rowell, A. Lyons, Timothy L. Killeen, and Paul B. Hays, “Stable andrugged etalon for the Dynamics Explorer Fabry-Perot interferometer. 1: Design and construction,”Applied Optics, vol. 21, no. 21, November 1982, pp. 3896–3902.
Reitebuch, Oliver, Christian Werner, Ines Leike, Patricia Delville, Pierre H. Flamant,Alexander Cress, and Dirk Engelbart, “Experimental Validation of Wind Profiling Performed bythe Airborne 10-µm Heterodyne Doppler Lidar WIND,” Journal of Atmospheric and OceanicTechnology, vol. 18, no. 8, August 2001, pp. 1331–1344.
Richmond, Richard, Dan Jewell, John Carr, and James P. Root, “U.S. Air Force Ballistic WindsProgram,” SPIE Proceedings Volume 3065, Laser Radar Technology and Applications II, Orlando,Florida, 21–25 April 1997, pp. 2–8.
Riethmuller, M. L. and A. Boutier, “Laser velocimetry,” VKI Lecture Series-05: von KarmanInstitute for Fluid Dynamics, Rhode Saint Genèse, Belgium, 10–14 June 1991.
Roehle, I. and C. E. Willert, “Extension of Doppler global velocimetry to periodic flows,”Measurement Science and Technology, vol. 12, no. 4, 2001, pp. 420–431.

87
Roehle, I., “Doppler Global Velocimetry,” VKI Lecture Series 1998-06: Advanced MeasurementTechniques, von Karman Institute of Fluid Dynamics, Brussels, 1998.
Roehle, Ingo, “Doppler Global Velocimetry,” paper 4, RTO AVT Lecture Series, Planar OpticalMeasurement Methods for Gas Turbine Components, RTO-EN-6, September 1999.
Roehle, I., R. Schodl, P. Voigt, and C. Willert, “Recent developments and applications ofquantitative laser light sheet measuring techniques in turbomachinery components,” MeasurementScience and Technology, vol. 11, no. 7, 2000, pp. 1023–1035.
Rye, Barry J. and R. Michael Hardesty, “Time series identification and Kalman filtering techniquesfor Doppler lidar velocity estimation,” Applied Optics, vol. 28, no. 5, March 1989, pp. 879–891.
Safe Use of Lasers in an Outdoor Environment, ANSI Z136.6-2000, American Nat. Std. Institute(ANSI), 2000.
Schodl, R., “Laser-two-focus velocimetry,” Advanced Instrumentation for Aero Engine Components,AGARD-CP-399 (Philadelphia), 1986, p. 7.
Schodl, R., W. Förster, G. Karpinski, H. Krain, and I. Röhle, “3-Component-Doppler-Laser-Two-Focus Velocimetry Applied to a Transonic Centrifugal Compressor,” 10th InternationalSymposium on Application of Laser Techniques to Fluid Mechanics, Lisbon, Portugal, Paper 7-2,July 2000.
Silfvast, William T., Laser Fundamentals, Cambridge University Press, Cambridge, UK, 1996.
Skinner, Wilbert R. and Paul B. Hays, “Incoherent Doppler lidar for measurement of atmosphericwinds,” Proceedings of SPIE vol. 2266, Optical Spectroscopic Techniques and Instrumentation forAtmospheric and Space Research, 1994, pp. 383–394.
Smart, Anthony E., “Optical velocity sensor for air data applications,” Optical Engineering, vol. 31,no. 1, January 1992, pp. 166–173.
Sonnenschein, C. M. and F. A. Horrigan, “Signal-to-Noise Relationships for Coaxial Systems thatHetrodyne Backscatter from the Atmosphere,” Applied Optics, vol. 10, no. 7, July 1971,pp. 1600–1604.
Soreide, David, Rodney K. Bogue, L. J. Ehernberger, and Hal Bagley, Coherent Lidar TurbulenceMeasurement for Gust Load Alleviation, NASA TM-104318, 1996.
Soreide, David, Rodney K. Bogue, Jonathan Seidel, and L. J. Ehernberger, The Use of a LidarForward-Looking Turbulence Sensor for Mixed-Compression Inlet Unstart Avoidance and GrossWeight Reduction on a High Speed Civil Transport, NASA TM-104332, 1997.
Soreide, David C., Rodney K. Bogue, L. J. Ehernberger, Stephen M. Hannon, and David A. Bowdle,Airborne Coherent Lidar for Advanced In-Flight Measurements (ACLAIM) Flight Testing of theLidar Sensor, American Meteorological Society, Ninth Conference on Aviation, Range, andAerospace Meteorology, Orlando, Florida, September 2000.

88
Targ, Russell and Roland L. Bowles, “Windshear Avoidance: Requirements Proposed System forAirborne Lidar Detection,” SPIE vol. 899 Airborne and Spaceborne Lasers for TerrestrialGeophysical Sensing, 1988 p. 54.
Targ, Russell, Michael J. Kavaya, R. Milton Huffaker, and Roland L. Bowles, “Coherent lidarairborne windshear sensor: performance evaluation,” Applied Optics, vol. 30, no. 15, May 1991,pp. 2013–2026.
Targ, Russell, Bruce C. Steakley, James G. Hawley, Lawrence L. Ames, Paul Forney, DavidSwanson, Richard Stone, Robert G. Otto, Vassilis Zarifis, Philip Brockman, Raymond S. Calloway,Sarah Harrell Klein, and Paul A. Robinson, “Coherent lidar airborne wind sensor II: flight-testresults at 2 and 10 µm,” Applied Optics, vol. 35, no. 36, December 1996, pp. 7117–7150.
Tchoryk, Pete, Jr., Christopher B. Watkins, Scott K. Lindemann, Paul B. Hays, and Carl A. Nardell,“Molecular Optical Air Data System (MOADS),” SPIE Proceedings 4377, Laser Radar Technologyand Applications VI, 16–20 April 2001, Orlando, Forida, Paper 4377-28.
van de Hulst, H. C., Light Scattering by Small Particles, Second ed., Dover Publications Inc., NewYork, 1981.
Vaughan, J. M., D. W. Brown, C. Nash, S. B. Alejandro, and G. G. Koenig, “Atlantic atmosphericaerosol studies: 2. Compendium of airborne backscatter measurements at 10.6 µm,” Journal ofGeophysical Research, vol. 100, no. D1, January 1995, pp. 1043–1065.
Vaughan, John M., Kurt Ove Steinvall, Christian Werner, and Pierre Henri Flamant, “Coherent LaserRadar in Europe,” Proceedings of the IEEE, Vol. 84, No. 2, February 1996, pp. 205–226.
Vaughan, J. M., and P. A. Forrester, “Laser Doppler Velocimetry Applied to the Measurement ofLocal and Global Wind,” Wind Engineering, vol. 13, no. 1, 1989, p. 1.
Vaughan, J. M., R. D. Callan, D. A. Bowdle, and J. Rothermel, “Spectral analysis, digitalintegration, and measurement of low backscatter in coherent laser radar,” Applied Optics, vol. 28,no. 15, August 1989, pp. 3008–3014.
Wagener, Thomas J., Nick Demma, Jeffrey D. Kmetec, and Tracy S. Kubo, “2 µm LIDAR forLaser-Based Remote Sensing: Flight Demonstration and Application Survey,” 13th DASC,AIAA/IEEE Digital Avionics Systems Conference, Phoenix, Arizona, 30 Oct.–3 Nov. 1994.
Werner, Ch., M. Klier, H. Herrmann, E. Biselli, and R. Häring, “Compact Laser DopplerAnemometer,” AGARD CP 502, Remote Sensing of the Propagation Environment, 1992,paper no. 27.
Werner, Christian, “Applications of spaceborne Doppler and backscatter lidar: a critical review,”Optical Engineering, vol. 34, no. 11, 1995, pp. 3103–3114.
Werner, Ch., P. Flamant, O. Reitebuch, F. Köpp, J. Streicher, S. Rahm, E. Nagel, M. Klier,H. Herrmann, C. Loth, P. Delville, Ph. Drobinski, B. Romand, Ch. Boitel, D. Oh, M. Lopez,M. Meissonnier, D. Bruneau, and A. Dabas, “Wind infrared Doppler lidar instrument,” OpticalEngineeering, 40(1), January 2001, pp. 115–125.

89
Woodfield, Alan A. and J. Michael Vaughan, “Using an Airborne CO2 Laser for Free StreamAirspeed and Windshear Measurements,” AGARDograph-AG-272, Advances in Sensors and TheirIntegration into Aircraft Guidance and Control Systems, 1983, p. 7.
Yu, Francis T. S. and Xiangyang Yang, Introduction to Optical Engineering, Cambridge UniversityPress, Cambridge, 1997.
Section-Specific Breakdown for Further Reading
Introduction
Smart–1992, ANSI Standard Z136, Munoz–1974.
Basic Principles
Dainty–1975, Deirmendjian–1964, Drain–1980, Durst–1981, Hays–1982, Hughes–1973,Kane–1984, Kogelnik–1966, Korb–1992, Loudon–1993, Mendoza–1998, Mie–1908, Silfvast–1996,Sonnenschein–1971, Targ–1996, van de Hulst–1981, Vaughan–1995, Vaughan and Callan–1989,Vaughan and Forrester–1989.
System Components
Damp–1994, Hecht–1992, Kane–1984, Köpp–1990, Silfvast–1996, Yu–1997.
Laser Anemometer Configurations
Abreu–1992, Bilbro–1986, Bilbro and Johnson–1986, Born–1970, Drain–1980, Durst–1981,Elliott–1999, Hausamann–1990, Hays–1985, Hecht–1992, Holmes–1988, Jentink–1994, Komine–1994,Korb–1992, Kristensen–1987, Latalick–1989, McGill–1998, Meyers–1971, Meyers–1974,Meyers–1995, Meyers–2001, Post–1990, Riethmuller–1991, Roehle–1998, Roehle–1999, Roehle–2000,Roehle–2001, Rye–1989, Schodl–1986, Schodl–2000, Silfvast–1996, Skinner–1994, Yu–1997.
Applications
Alonso–1991, Becker–1999, Bilbro–1980, Cattin-Valsecchi–1992, Combe–2000, Fetzer–1990,Hannon–1994, Jentink–1995, Köpp–1997, Mandle–1984, McCaul–1986, McGann–1995, Ott–1996,Rahm–1995, Reitebuch–2001, Richmond–1997, Smart–1992, Soreide–1996, Soreide–1997,Soreide–2000, Targ–1991, Targ–1996, Tchoryk–2001, Woodfield–1983.
Existing Systems
Alonso–1991, Becker–1999, Bogue–March 1995, Bogue–July 1995, Cattin-Valsecchi–1992,Combe–2000, Damp–1991, Damp–1994, Erwin–1993, Grosche–2000, Hannon–1994, Jentink–1994,Jentink–1995, Keane–1997, Köpp–1997, Mandle–1984, Mandle–1991, Manione–1978, McCaul–1986,

90
McGann–1995, Meyers–1995, Ott–1996, Rahm–2001, Reitebuch–2001, Richmond–1997, Schodl–2000,Smart–1992, Soreide–2000, Targ–1996, Vaughan–1996, Wagener–1994, Werner–1992, Werner–2001,Woodfield–1983.
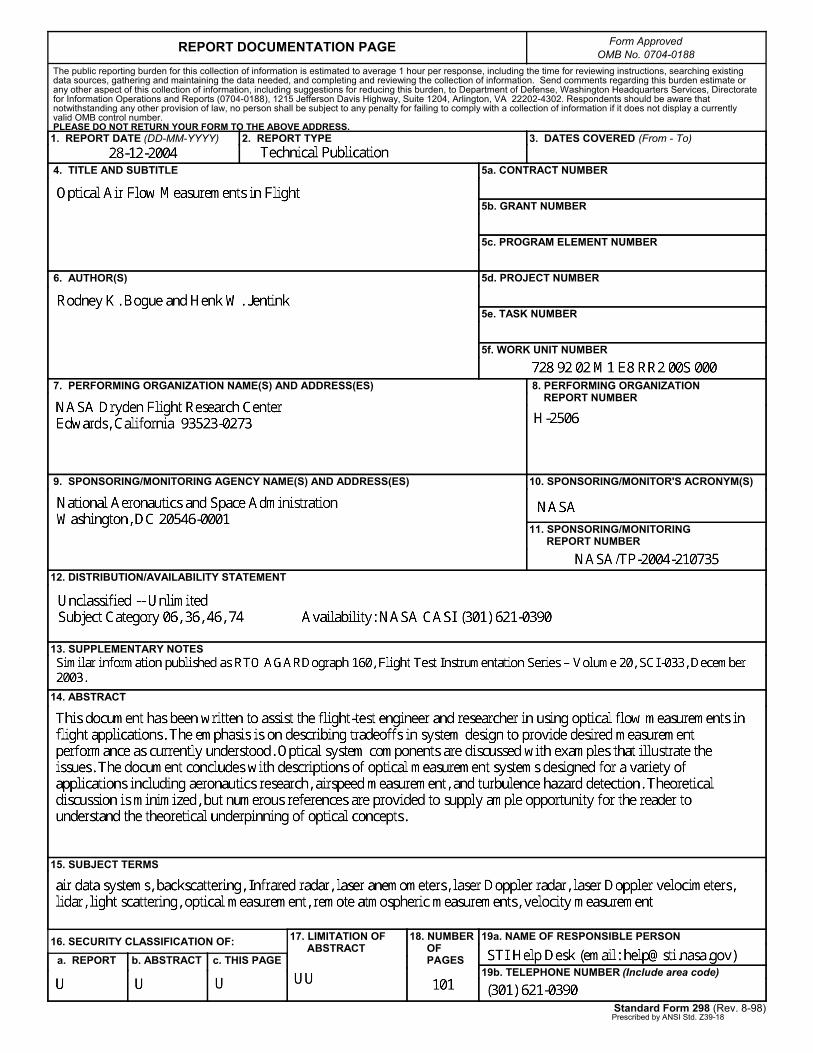
REPORT DOCUMENTATION PAGE Form Approved OMB No. 0704-0188
The public reporting burden for this collection of information is estimated to average 1 hour per response, including the time for reviewing instructions, searching existingdata sources, gathering and maintaining the data needed, and completing and reviewing the collection of information. Send comments regarding this burden estimate or any other aspect of this collection of information, including suggestions for reducing this burden, to Department of Defense, Washington Headquarters Services, Directorate for Information Operations and Reports (0704-0188), 1215 Jefferson Davis Highway, Suite 1204, Arlington, VA 22202-4302. Respondents should be aware that notwithstanding any other provision of law, no person shall be subject to any penalty for failing to comply with a collection of information if it does not display a currently valid OMB control number. PLEASE DO NOT RETURN YOUR FORM TO THE ABOVE ADDRESS. 1. REPORT DATE (DD-MM-YYYY) 2. REPORT TYPE 3. DATES COVERED (From - To)
4. TITLE AND SUBTITLE 5a. CONTRACT NUMBER
5b. GRANT NUMBER
5c. PROGRAM ELEMENT NUMBER
6. AUTHOR(S) 5d. PROJECT NUMBER
5e. TASK NUMBER
5f. WORK UNIT NUMBER
7. PERFORMING ORGANIZATION NAME(S) AND ADDRESS(ES) 8. PERFORMING ORGANIZATION REPORT NUMBER
9. SPONSORING/MONITORING AGENCY NAME(S) AND ADDRESS(ES) 10. SPONSORING/MONITOR'S ACRONYM(S)
11. SPONSORING/MONITORINGREPORT NUMBER
12. DISTRIBUTION/AVAILABILITY STATEMENT
13. SUPPLEMENTARY NOTES
14. ABSTRACT
15. SUBJECT TERMS
16. SECURITY CLASSIFICATION OF: 17. LIMITATION OF ABSTRACT
18. NUMBER OF PAGES
19a. NAME OF RESPONSIBLE PERSON
a. REPORT b. ABSTRACT c. THIS PAGE 19b. TELEPHONE NUMBER (Include area code)
Standard Form 298 (Rev. 8-98)Prescribed by ANSI Std. Z39-18