
Optical active thin films increasing the performance of...
68
Degree project Optical active thin films increasing the performance of photovoltaic modules Author: Wilhelm Johansson Supervisor: Bo Jonson Examiner: Michael Strand External Supervisor: Stefan Karlsson, RISE Glass Date: 2018-05-24 Course Code: 2BT01E, 15 credits Subject: Energy and Environmental Technology Level: Bachelor Thesis Department of Built Environment and Energy Technology
Transcript of Optical active thin films increasing the performance of...

Degree project
Optical active thin films
increasing the performance of
photovoltaic modules
Author: Wilhelm Johansson
Supervisor: Bo Jonson
Examiner: Michael Strand
External Supervisor: Stefan Karlsson,
RISE Glass
Date: 2018-05-24
Course Code: 2BT01E, 15 credits
Subject: Energy and Environmental
Technology
Level: Bachelor Thesis
Department of Built Environment and
Energy Technology


Summary
In order to meet the internationally set targets to mitigate an excessively high global
warming, the anthropogenic addition of greenhouse gases to the atmosphere must
radically decrease within the next few decades. This requires the world's energy system
to be switched from the CO2-intensive energy sources used today to carbon-neutral
energy sources.
Solar energy has the potential to contribute to part of the energy needs of the future,
this potential can be further enhanced by an improvement in life expectancy and energy
efficiency of photovoltaic modules. To avoid degradation of the PV-module’s
encapsulation material, it would be beneficial to reduce the transmittance of destructive
UV radiation through the cover glass. If the UV radiation also could be down shifted
through photoluminescence to wavelengths that can be converted to electricity, an
increase in efficiency could be achieved.
In this study, thin film coatings of ZnO, TiO2, CeOX and BiOX have been deposited
on float glass by spray pyrolysis, and the optical effects of the thin film coatings
have been investigated. The optical parameters examined are the UV-cutoff,
photoluminescence within the wavelengths 330 – 720 nm, and the transmittance of
light within the wavelengths 350 – 1 100 nm.
Minor changes of the optical properties of the glass samples coated with CeOX and
BiOX, led to the conclusion that no significant film had formed on the substrates. Thus,
no conclusions could be drawn regarding the potential of thin film coatings of the two
metal oxides.
Coatings of ZnO showed a tendency to move the UV-cutoff of the glass to longer
wavelengths. This resulted in a reduction of the transmittance of UV radiation
destructive to the PV module by up to 80%. A distinct peak in photoluminescence
could be observed at 377 nm in the ZnO coated samples. Since this peak is within the
wavelength region convertible to electricity by Si PV-modules, the conclusion was
made that coatings of ZnO films have a potential to increase the efficiency of Si PV-
modules in addition to increasing their life length through UV protection.
The samples coated with TiO2 showed tendencies to switch the UV-cutoff to longer
wavelengths. This resulted in a reduction of transmittance of destructive UV radiation
by up to 41%. This led to the conclusion that thin film coatings of TiO2 had the
potential to increase the life expectancy of PV-modules if used on the cover glass.
However, a reduction of photoluminescence could be observed, this was likely due to
an increased reflection by the thin film coating.
Both the thin film coatings of ZnO and TiO2 led to a significant reduction of the
transmittance of light within the wavelength range of 350 - 1100 nm, up to 14 % and
24 %, respectively. Since this is the wavelength region where Si PV modules are active,
this issue needs to be addressed if these types of thin film coatings are going to
be beneficial. Further studies on the possibilities to counteract the reduction of
transmittance within the convertible wavelength range is proposed, e.g. through
application of anti-reflective thin films.

IV
Sammanfattning
För att uppnå de internationellt uppsatta målen att motverka en alltför hög global
uppvärmning måste den antropogena tillförseln av växthusgaser till atmosfären minska
radikalt under de närmaste decennierna. Detta kräver att världens energisystem skiftas
från dagens CO2-intensiva energikällor till CO2-neutrala energikällor.
Elektricitet från solenergi har en potential att bidra med en betydelsefull del av
framtidens energibehov. En förbättring av livslängden och verkningsgraden hos
solmoduler skulle ytterligare kunna öka potentialen för solenergi som en del
av framtidens energisystem. För att motverka nedbrytningen av solcellsmodulernas
inkapslingsmaterial vore det fördelaktigt att minska transmittansen av skadlig UV-
strålning genom modulens täckglas. Om absorptionen av fotoner av de för solcellen
skadliga våglängderna också leder till fotoluminiscens inom det våglängdsområde där
solcellsmodulen kan producera elektricitet, skulle även en ökning i verkningsgrad
kunna åstadkommas.
I denna studie har tunnfilmsbeläggningar av ZnO, TiO2, CeOX och BiOX på floatglas
utförts via spraypyrolys, varefter de optiska effekterna av tunnfilmsbeläggningar har
undersökts. De parametrar som undersökts är, förskjutning av glasets UV-kant,
fotoluminiscens inom våglängdsområdet 330 – 720 nm, samt transmittans av ljus inom
våglängdsområdet 350 – 1 100 nm.
Mycket små förändringar av de optiska egenskaperna gällande de glasprover där
tunnfilmsbeläggning av CeOX och BiOX utförts ledde till slutsatsen att inga
betydelsefulla mängder tunnfilm hade fäst på glasproverna. Därmed kunde inga
slutsatser dras angående potentialen för tunnfilmer av de båda metalloxiderna.
Beläggningarna av ZnO påvisade en tendens att flytta UV-kanten på glaset till längre
våglängder. Detta ledde till en reduktion av transmittansen av skadlig UV-strålning
med upp till drygt 80 %. En tydlig topp gällande fotoluminiscens kunde urskiljas vid
377 nm. Eftersom denna topp ligger inom det våglängdsområde som Si solceller kan
konvertera till elektricitet har tunnfilmsbeläggningar av ZnO en potential att öka
verkningsgraden hos Si solceller utöver dess skydd mot skadlig UV-strålning.
Även beläggningarna av TiO2 påvisade en tendens att flytta UV-kanten till längre
våglängder. Detta ledde till en reduktion av transmittansen av skadlig UV-strålning
med upp till 41 %. Detta ledde till slutsatsen att tunnfilmsbeläggningar av TiO2 har
potentialen att öka livslängden hos Si-solmoduler. En minskning av fotoluminiscensen
inom våglängdsområdet 330 – 720 nm kunde observeras på proverna, detta kan
troligen härledas till en ökad reflektans hos de tunnfilmsbelagda proverna.
Såväl tunnfilmsbeläggningarna av ZnO och TiO2 ledde till en signifikant reduktion av
transmittansen av ljus inom våglängdsområdet 350 – 1100 nm på 14 % respektive
24 %. Detta skulle behöva åtgärdas om tunnfilmsbeläggning av de båda metalloxiderna
ska kunna bli fördelaktigt i framtiden. Vidare studier föreslås därför gällande
möjligheten att motverka reduktionen av transmittans inom det konverterbara
våglängdsområdet, exempelvis via beläggning av antireflektiv tunnfilm.

V
Abstract
Thin film coatings of ZnO, TiO2, CeOX and BiOX have been deposited on soda lime
silica glass through spray pyrolysis. The effects on the optical properties of the coated
glass, as well as the possible impacts on the life expectancy and energy efficiency of
PV-modules have been studied.
ZnO and TiO2 coatings both reduced the transmission of UV radiation of wavelengths
destructive to PV-modules. Therefore, both have the potential to increase the life
expectancy of PV-modules if used on cover glass. The ZnO thin film also showed an
increase in photoluminescence at 377 nm when radiated with UV radiation of 325 nm
while TiO2 reduced the photoluminescence. ZnO coatings on the cover glass have the
potential to increase the efficiency of PV-modules in addition to UV protection. No
CeOX or BiOX films were found to be deposited with the method used.
The ZnO and TiO2 coated samples showed a decrease in transmission of light, due to
increased reflection and possibly scattering. This needs to be addressed if these kinds
of coatings are going to be beneficial for Si PV-modules.
Keywords: Thin films, Coatings, Metal oxides, UV-protection, UV-cutoff, Optical
bandgap, Renewable Energy, Photoluminescence, PV-modules, Energy
Efficiency, Life expectancy

VI
Preface
This study is the result of a Bachelor Thesis done in cooperation with RISE Glass. All
the experimental work was made at RISE Glass in Växjö except for the RAMAN
spectroscopy which was made at Ångström Laboratory at Uppsala University. All
figures and tables in the report are made by the author except for the pictures in figure
6 and figure 11.
I would like to thank Stefan Karlsson for introducing me to the project and being my
supervisor at RISE Glass. Bo Jonson who has been my supervisor at Linnaeus
University. Lars Österlund and Jakob Thyr at Uppsala University for their supervision
regarding the Raman measurements. Osby glass for the sponsoring with glass samples.
Finally, I would like to thank RISE Glass and Smart Housing Småland for their
valuable support throughout the project.
Wilhelm Johansson
Växjö, May 2018

VII
Table of contents
1. Introduction ____________________________________________________________ 1 1.1 Background ............................................................................................................................................................ 1 1.2 Aim and goal .......................................................................................................................................................... 2 1.3 Boundaries of the study .......................................................................................................................................... 2
2. Theory ________________________________________________________________ 3 2.1 Electromagnetic radiation ....................................................................................................................................... 3
2.1.1 UV-radiation ........................................................................................................................................................................5
2.1.2 Transmission, absorption, and reflectance of light. ..............................................................................................................5
2.2 UV-VIS Spectrophotoscopy ................................................................................................................................... 6 2.3 Energy bands and bandgaps.................................................................................................................................... 6 2.4 Photovoltaic modules ............................................................................................................................................. 7
2.4.1 Ethyl-Vinyl-Acetate for encapsulation of PV-cells ..............................................................................................................9
2.5 The properties of glass ............................................................................................................................................ 9 2.5.1 Structural definition of the material......................................................................................................................................9
2.5.2 Glass transition – a unique property ...................................................................................................................................10
2.5.3 Chemical composition ........................................................................................................................................................10
2.5.4 Optical properties ...............................................................................................................................................................10
2.5.5 Production of float glass .....................................................................................................................................................12
2.5.6 Annealing of glass ..............................................................................................................................................................12
2.6 Luminescence ....................................................................................................................................................... 12 2.7 Fluorescence Spectroscopy ................................................................................................................................... 14 2.8 Raman spectroscopy ............................................................................................................................................. 15
2.8.1 Basic principles ..................................................................................................................................................................15
2.8.2 Instrumentation ..................................................................................................................................................................16
2.9 Metals for oxidic thin film coating ....................................................................................................................... 16 2.9.1 Zinc ....................................................................................................................................................................................17
2.9.2 Bismuth ..............................................................................................................................................................................17
2.9.3 Cerium ...............................................................................................................................................................................18
2.9.4 Titanium .............................................................................................................................................................................18
2.10 Thin Film coatings .............................................................................................................................................. 18 2.10.1 Coating made by Chemical Vapor Deposition .................................................................................................................19
2.10.2 Coating made by spray pyrolysis .....................................................................................................................................20
2.11 Precursors used for spray pyrolysis .................................................................................................................... 21
3. Experimental part _______________________________________________________ 23 3.1 Preparation of the precursor solutions used for spray pyrolysis ........................................................................... 23 3.2 Thin film deposition ............................................................................................................................................. 23 3.3 UV-VIS spectroscopy ........................................................................................................................................... 25 3.4 Raman spectroscopy to investigate photoluminescence ....................................................................................... 25 3.5 Calculations of the UV-cutoff and optical bandgap .............................................................................................. 25 3.6 Transmission through the cover glass ................................................................................................................... 27 3.7 The coatings effect on photoluminescence ........................................................................................................... 27
4. Results and discussion ___________________________________________________ 28 4.1 Absorption spectra comparison of coated and uncoated float glass. ..................................................................... 28 4.2 Effect on the optical bandgap and UV-cutoff ....................................................................................................... 30 4.3 Effect on the transmittance of useful energy for Si-PV cells ................................................................................ 32 4.4 Microscopy examination of the coated surfaces. .................................................................................................. 34 4.5 Effect on photoluminescence ................................................................................................................................ 36
5. General remarks ________________________________________________________ 40
6. Outlook_______________________________________________________________ 41
7. Conclusions ___________________________________________________________ 42
8. References ____________________________________________________________ 43
9. Appendices ____________________________________________________________ 47

VIII
Abbreviations and word explanations
AcAc – Acetyl Acetate
CVD – Chemical Vapor Deposition
CO2-eq – Carbon dioxide equivalent
EMR – Electromagnetic Radiation
EVA – Ethyl Vinyl Acetate
MOD – Metal organic deposition
PV – Photovoltaic
PVD – Physical Vapor Deposition
Substrate – Material suspect to thin film coating
TTIP – Titanium isopropoxide
UV-Radiation – Ultraviolet Radiation
UV-cutoff – The wavelength where the light absorption increases
steeply in glass.
Wt % – Weight percentage

1
Wilhelm Johansson
1. Introduction
1.1 Background
The climate on the earth is changing and it is primarily caused by human
activity. The global mean temperature has been rising since the
industrialization of the society, which gives rise to consequences such as
raised sea-level, extreme weather and a threat to the food security. These
phenomena can be observed today but is expected to become more severe in
the future (IPCC, 2014a). To mitigate climate change and stabilize the global
temperature, the emission of greenhouse gases will have to be greatly reduced
and will eventually have to reach 0. For this to be possible the energy sector
will have to switch from fossil energy sources to carbon neutral sources
(IPCC, 2014b).
It is a well-known fact that vast amounts of energy are radiated from the sun
to the earth’s surface, in roughly 90 minutes, as much energy reaches the earth
as all human societies consumes globally during a year (IEA, 2011). However
only a fraction of this energy is captured and today photovoltaic cells account
for a marginal part of the electricity production worldwide, around 1.8 % at
the end of 2016. In recent years however, the sector has been growing
exponentially at a rapid rate, which means that the ability to increase
efficiency and lifespan of PV modules is interesting from an energy
perspective (Brunisholz, 2016).
The energy from photovoltaic cells has through life cycle assessments shown
a CO2 intensity of around 52 g CO2-eq/kWh (Hsu, et al., 2012). This can be
compared to 317 – 389 g CO2-eq/kWh for electricity from coal (U.S. Energy
Information Administration, 2016), and 19 g CO2-eq/kWh for wind power
(Arvensen & Hertwich, 2012). Since the emissions from photovoltaic cells
are made mainly during the production phase, the CO2 intensity is likely to
decline if module energy efficiency and/or lifetime increases. The CO2
intensity is also highly dependent on the energy used for electricity in the
production country (Hsu, et al., 2012).
A photovoltaic module consists of a series of interconnected PV-cells which
are embedded in a protecting encapsulant, on top of which a protective cover
glass is placed. One of the issues facing the PV-modules available today is
that their encapsulant, which most often consists of EVA (ethylene vinyl
acetate), is damaged by UV radiation. The UV radiation makes the
encapsulant degrade and acquire a yellow and eventually brown hue, which
reduces the efficiency of the photovoltaic cells. Eventually the photovoltaic
cells delaminate, and moisture is able to penetrate it, this is also negative for
the PV module (Candida Carvalho de Oliveira, et al., 2018).

2
Wilhelm Johansson
To prevent the degradation of the encapsulant of the PV modules and thereby
increase the efficiency there are two main routes which can be investigated.
One possibility is to increase the durability of the encapsulant itself, and the
other is to protect the encapsulant from the destructive UV radiation by
modifications of the cover glass.
Today, float glass used for cover glass stands for a marginal share of the total
production. As the market for photovoltaic modules grows, the amount of
float glass used for photovoltaic modules can be expected to increase with it.
This will make the research on float glass specifically made for photovoltaic
modules increasingly feasible in the future (Burrows & Fthenakis, 2014).
The coating of float glass with thin films to improve the properties of the glass
is a subject widely researched and applied in production of glass. Thin films
can be used to change the mechanical, chemical and optical properties of the
substrate (Le Bourhis, 2014).
1.2 Aim and goal
The aim of the presented thesis is to evaluate the possibility of depositing
coatings of optically active thin films on float glass, and the potential to
increase energy efficiency and life expectancy of PV-modules.
The goal of the thesis is to deposit metal oxide thin films on float glass and to
study the effects on UV-cutoff, transmittance and photoluminescence that is
achieved through the coatings.
The results achieved in the experimental part of the study will be evaluated
further to assess the effect of the thin film if used on cover glass for PV
modules. This includes whether, the efficiency can be increased by
photoluminescence in the thin film and if the life expectancy can be increased
through the shift of UV-cutoff. For the goal to be accomplished the following
questions need to be answered.
How does the optical properties of the glass change, especially regarding UV
absorption and photoluminescence, by the thin film coatings?
Could these coatings improve the efficiency and life expectancy of PV
modules?
1.3 Boundaries of the study
Although the amount of the precursor used for every thin film will be
measured, the thickness of the thin film will not be determined. The study will
be limited to the deposition of a few different types of metal oxides for the
thin film. The metal oxides will be chosen according to their properties
regarding optical bandgap and photoluminescence.

3
Wilhelm Johansson
2. Theory
2.1 Electromagnetic radiation
Light can be described as electromagnetic radiation (EMR) of different
wavelengths. The electromagnetic radiation detected by the human eye is
called visible light and includes wavelengths of 400 nm (violet light) to 700
nm (red light). EMR with slightly shorter wavelengths, about 10 - 400 nm is
called ultraviolet radiation (UV light) and radiation between 700 nm – 1 mm
is called infrared radiation or heat radiation (Mertens, 2014).
EMR can be described either as a wave or as photons whose energy varies
depending on the wavelength of the radiation according to equation 1
(Mertens, 2014).
E = h ∙ v (Equation 1)
Where h is Planck's constant and v is the frequency of the radiation.
Together with equation 2, this means that radiation with shorter wavelengths
and thereby higher frequency, have higher energy content than photons in
long wavelength radiation (Mertens, 2014).
c = v ∙ λ (Equation 2)
Where c is the speed of light and λ is the wavelength of the radiation.
All bodies warmer than the absolute zero emit EMR to some extent. The
higher the temperature of a body is, the greater amount of energy, in form of
EMR, it emits. It is also true that a warmer body emits radiation with shorter
wavelengths than a low temperature body. The emission of a black body at
different wavelengths is described by Planck’s law, see equation 3 (Mertens,
2014).
𝐵𝜆 =2ℎ𝑐2
𝜆5∙(𝑒ℎ𝑐
𝜆𝑘𝑇−1)
(Equation 3)
Where h is Planck’s constant, c is the speed of light, 𝜆 is the wavelength, k is the Boltzmann constant and T is the absolute temperature of the black body (Mertens, 2014).

4
Wilhelm Johansson
Figure 1 shows the emission of a black body at 5800 K, which is the
approximate temperature of the surface of the sun (Mertens, 2014). It can be
observed that the peak of the number of photons is slightly shifted to longer
wavelengths compared to the peak of energy, this is due to the decreasing
energy per photon at the longer wavelengths.
Figure 1: Emission from a black body at 5800K. The full line is the share of
energy and the dashed line is the share of photons.
The solar energy reaching the earth’s surface, and is thereby useful for PV-
modules, are somewhat different to the spectrum shown in figure 1. This is
mainly due to that the sun is in fact not a black body of a uniform stable
temperature and that the earth’s atmosphere absorbs some of the radiation.
Instead the spectrum of the solar energy reaching the earth’s surface looks
closer to figure 2 (Bird, et al., 1983).
Figure 2: Solar irradiation at the earth’s surface

5
Wilhelm Johansson
2.1.1 UV-radiation
As mentioned previously, EMR of wavelengths between 10 and 400 nm is
called UV-light. The UV radiation is divided into 3 subgroups, UV-A, UV-B
and UV-C. UV-C is the subgroup with the shortest wavelengths 200 – 280 nm
and is thereby the most energy intensive of the three groups. However, as can
be seen in figure 2, virtually no UV-C radiation reaches the surface of the
earth since it is absorbed in the earth’s upper atmosphere. UV-B consists of
radiation of wavelengths between 280 – 315 nm, the majority of this radiation
is absorbed in the earth’s upper atmosphere as well, but a distinguishable
share still reaches the earth’s surface. UV-A radiation is radiation of
wavelengths between 320 – 400 nm, this radiation is not absorbed in as large
amounts as the other groups thus a larger portion of it reaches the earth’s
surface (Díaz, et al., 2000).
2.1.2 Transmission, absorption, and reflectance of light.
When light illuminates a material, it can either be transmitted through, be
absorbed by, or be reflected against the material. The relation between the
three is shown in equation 4 (Freeman, 2003).
𝐴 + 𝑇 + 𝑅 = 1 (Equation 4)
Where A is the absorbed, T is the transmitted, and R is the reflected share of
the incoming light.
The amount of light which will be reflected when it reaches the surface of a
material can be estimated by the relation between the refractive index of the
material and the surrounding medium, see equation 5 (Freeman, 2003).
𝑅 = (𝑛𝑚−𝑛𝑠
𝑛𝑚+𝑛𝑠)
2
(Equation 5)
Where nm is the refractive index of the medium surrounding the material and
ns is the refractive index of the material.
It is however, also important to note that the light transmitted through the
material will also be scattered to some degree. This means that the light
changes its trajectory when it goes through a medium, this phenomenon can
be important to consider when measurements of transmission are made, e.g.
in UV Vis spectroscopy (Freeman, 2003).

6
Wilhelm Johansson
2.2 UV-VIS Spectroscopy
A UV-VIS spectrophotometer is an analytical instrument which measures the
transmittance of electromagnetic radiation through a material, within the
UV-Vis spectrum. The main principle is that a material is irradiated by a beam
of light of a predefined wavelength and intensity. A certain amount of the light
will be absorbed by the material by excitation of electrons, some of the light
will be reflected at the surfaces of the material and some light will be scattered
so that it does not reach the detector. The remaining light will pass right
through the material and reach the detector on the other side. The
transmittance can then be determined through the ratio between the light
intensity reaching the detector and the intensity of the light emitted
(Simonsen, 2003).
There are several different types of spectrophotometers, some of them, such
as the filter photometer and the single beam spectrophotometer can only
measure one wavelength at a time. This can be very time consuming if a whole
spectrum of light is to be measured. In those cases, devices which measure an
entire spectrum in a short period of time is used, an example of these are the
diode array spectrophotometer (Simonsen, 2003).
2.3 Energy bands and bandgaps.
Electrons in an atom or molecule can only exist in a limited number of energy
states. Two electrons in a molecule can, according to Pauli’s exclusion
principle, not have the same energy state. This leads to the fact that if two
atoms are joined together the electrons will get a slightly shifted energy level.
This happens when several atoms are joined together in molecules and
materials, with the result that certain energy intervals will have a very high
amount of allowed energy levels, while other intervals will have no allowed
energy levels, see figure 3 (Mertens, 2014).
Figure 3: Energy levels and energy bands of molecules.

7
Wilhelm Johansson
The regions of allowed energy states are called energy bands whereas the
regions with forbidden energy states are called band gaps. The highest energy
band occupied with electrons is called the valence band, in this band electrons
are not free to move since it has no or few free energy states which it can
occupy. The lowest unoccupied energy band is called the conduction band, if
an electron is excited to this state it can move freely as there are plenty of free
energy states to occupy (Mertens, 2014).
2.4 Photovoltaic modules
Electricity from solar energy can be generated from photovoltaic cells
assembled into a photovoltaic module. The photovoltaic cells are made from
a semiconducting material, most often silicon. Silicon has four valence
electrons, by doping one side of the photovoltaic cell with atoms of an element
with only three valence electrons, e.g. boron, this side will have a shortage of
electrons, this is called p-doping, see figure 4. If the other side with atoms
from an element with five valence electrons, e.g. phosphorous, it will instead
have a surplus of electrons, this is called n-doping, see figure 4 (Mertens,
2014).
Figure 4: Doping of Si, p-doping left and n-doping right.
Individually the n-doped and the p-doped sides are neutrally charged, but
when they are combined the surplus of electrons on the n-side will diffuse to
the p-side, creating an electrical field, see figure 5. If the cell is then radiated
with light containing enough energy, an electric current will be induced
(Mertens, 2014).
Figure 5: Electrical field in np-doped Si.

8
Wilhelm Johansson
A photon induces current in a photovoltaic cell if it has an energy level higher
than the bandgap of the semiconductor in question. This means that only
radiation with a wavelength lower than a certain threshold can be used to
create electricity. This might imply that semiconductors with a lower bandgap
is always preferable, but one must consider that the energy a photon has in
excess compared to the bandgap will be lost in form heat. Si, the material used
for most photovoltaic cells, has a bandgap of 1.12 eV which corresponds to a
wavelength of approximately 1100 nm. The Si PV-cell has a theoretical
maximum efficiency of 28.6 %, but in real use it is often located between
13 - 20 % (Mertens, 2014).
There is also a lower limit regarding which wavelengths the Si-PV modules
can convert to electricity. Wavelengths below this is instead destructive to the
module, approximately 1.4 % of the solar energy is located in this wavelength
region (Bird, et al., 1983) (Candida Carvalho de Oliveira, et al., 2018). There
are also PV-modules using low bandgap semiconductors such as GaSb, Ge
and InAs, they are however not as common as Si-PV (Mertens, 2014).
As mentioned above, the PV-cells are assembled into a module. The PV-cells
are connected in series with a galvanized copper or silver wire which is in turn
embedded in an encapsulant. The principle of this assembly is shown in figure
6. The most commonly used encapsulant is Ethyl-Vinyl-Acetate (EVA) which
will be briefly described in the next section (Mertens, 2014).
Figure 6: Photovoltaic modules. Schematic sketch to the left and a picture
showing PV cells assembled to a module to the right.

9
Wilhelm Johansson
2.4.1 Ethyl-Vinyl-Acetate for encapsulation of PV-cells
EVA is a transparent polymer used for around 80 % of the PV-modules
produced today. The encapsulant is important for the module as it protects the
PV-cells from a variety of environmental parameters such as UV-radiation,
moisture and hail which otherwise would damage the PV-cells. Since the
encapsulant is placed between the PV-cells and the cover glass it is very
important that it has a high light transmittance so that as much convertible
light as possible reaches the PV-cells. Since the encapsulant is used as a
protection against UV-radiation and moisture, it is also important that the
encapsulant has a good resistance against these parameters (Candida Carvalho
de Oliveira, et al., 2018).
EVA has shown relatively good qualities in all the above-mentioned aspects,
while some polymers has shown better qualities in single aspects, EVA has
shown the best overall qualities. This together with its relatively low pricing
is why it is used in the majority of PV-modules today (Candida Carvalho de
Oliveira, et al., 2018).
However, EVA is not inert to the effects of UV-radiation. During a continuous
exposure to UV-radiation, especially UV-B but wavelengths up to 350 nm is
also destructive, the encapsulant loses some of its light transmissivity and gets
a yellow/brown hue. This in turn leads to a lower efficiency of the PV-module
as a smaller amount of light can pass through. To reduce the degradation of
the encapsulant, several different attempts has been made. Doping of the
cover glass with CeO2 has shown positive results, some studies have also
investigated the possibilities to add new materials into the encapsulant to
improve its transparency as well as its resistance to UV-radiation (Candida
Carvalho de Oliveira, et al., 2018).
2.5 The properties of glass
Glass is in many ways an interesting material which has several important
applications in the modern society. In this chapter an introduction to the
different properties of the material will be reviewed. Extra focus will be put
on the properties important for the use as cover glass on solar panels as well
as the properties important regarding thin film deposition.
2.5.1 Structural definition of the material
The definition of glassy materials lies in its non-crystalline structure. In
contrary to crystalline materials, non-crystalline materials have no long-range
order but only a short-range order, this structure is otherwise typical for fluids
and it gives rise to some of the interesting properties typical for glassy
materials (Le Bourhis, 2014).

10
Wilhelm Johansson
2.5.2 Glass transition – a unique property
Glassy materials have the special property that they do not have a specific
melting point in the way otherwise known for crystalline materials. When a
crystalline material goes from the fluid to the solid state it does so at a distinct
temperature and the atoms in the material arranges into a crystalline structure.
Glassy materials on the other hand is cooled so fast that the atoms are not able
to arrange into a crystalline structure before the viscosity of the material has
reached such high values that the atoms are immobilized in a non-crystalline
structure. When cooled further, the glass changes into the solid state at the
glass transition temperature. This temperature can vary widely depending on
the chemical composition of the glass. Whereas silica glass has a transition
temperature of 1500 – 1600 K, the transition temperature of soda glass is in
the order of 800 – 850 K (Le Bourhis, 2014).
2.5.3 Chemical composition
The chemical composition of glass can vary a lot depending on the purpose
the glass is produced for. Since the discovery of glass, over 200,000 different
types of non-crystalline materials have been produced, some compositions are
however more favorable for glass production (Zanotto & Coutinho, 2004).
The most common compositional range of float glass is shown in figure 7.
Figure 7: Composition of float glass expressed in wt % (Le Bourhis, 2014).
2.5.4 Optical properties
The most characteristic property of glassy materials is that it transmits light
of visible wavelengths. As mentioned in chapter 2.1.2, the two factors
decreasing the transmission of a material is the reflectance and the
absorbance. The refractive index of regular float glass lies around 1.52 which
means that approximately 8 % of the incoming light is reflected against the
surface. The absorbance of float glass is generally significantly increased by
iron impurities in the glass, this will be further explained in chapter 2.5.4.2
(Shelby, 2005) .

11
Wilhelm Johansson
2.5.4.1 UV-cutoff in glass
Even though glass materials have a very high transmission in the visible
wavelengths, the same is not true for light in the UV-region of the spectrum.
At a wavelength region, the absorption is radically increased until practically
no radiation is transmitted through the glass, this is known as the UV-cutoff.
There is no general standard for deciding the wavelength of the UV-cutoff,
but it is common to decide the optical bandgap of the glass, this will be further
explained in chapter 3.5 (Shelby, 2005).
2.5.4.2 Iron oxides in glass materials
Iron impurities in glass have a significant effect on the optical properties of
the material. Iron is present in glass mainly in form of two different oxides,
FeO and Fe2O3. As a consequence of the redox behavior of the melt, there is
almost always some amount of iron oxides prevalent in glass. However, the
amount can be modified depending on the purpose of the glass. Green colored
glass contains 0.5 – 1 wt % iron oxide while regular clear glass only contains
approximately 0.05 wt %. To increase the transmissivity of the glass further,
low-iron glass can be produced with an iron content of approximately
0.01 wt % (Johansson, 2011).
Figure 8 shows the absorption spectra of low iron glass and regular soda lime
glass, a decrease of absorption in the low iron glass can be observed in the
wavelength regions 300 – 400 nm and 600 – 1100 nm.
Figure 8: Absorption spectrum of low iron glass and regular clear glass, the
inset shows the spectrum between 600 – 1100 nm.

12
Wilhelm Johansson
2.5.5 Production of float glass
Over 90 % of the flat glass produced globally is produced by Pilkington’s
float glass production method. The principle of the production method is that
molten glass is distributed over a bath of molten tin on which the glass is
cooled from approximately 1100 °C to around 600 °C. The method makes it
possible to manufacture a relatively thin glass with a smooth surface in a
cost-effective manner (Niscimento, 2014).
Since one side of the glass is in contact with the tin bath, and the other side is
exposed to a slightly reducing atmosphere of N2 and H2, the different surfaces
have some different properties. The surface which has been in contact with
the tin bath will have a higher concentration of tin due to ion exchange with
iron in the material. This can be seen by examining the different sides under
UV-light as shown in figure 9, the tin surface, due to photoluminescence, will
emit a white light (Flank, et al., 2011).
Figure 9: Glass irradiated with UV light, tin surface on the right.
2.5.6 Annealing of glass
When a glass material has been produced or heated to an elevated temperature,
it is important to consider the rate of which it is cooled down. If the glass is
cooled too fast, tensile stresses will build up in the glass which is negative for
the mechanical strength and it may cause the glass to crack. The stresses are
in part due to the low thermal conductivity of glass. After the temperature has
sunk to the lower strain point however, it is not as critical to maintain a low
cooling rate, this temperature is approximately 100 °C below the glass
transition temperature (Johansson & Fredriksson, 2005).
2.6 Luminescence
Luminescence is a light phenomenon which occurs when electrons in a
material move between different energy states. This can occur due to several
reasons, which is why luminescence is divided into 6 different categories:

13
Wilhelm Johansson
bio-, chemi-, cathodo-, thermo-, electro-, and photoluminescence (Lakowicz,
2006).
Since this study investigates how thin film coating can change the optical
properties of glass, the category relevant for this study is photoluminescence.
This will therefore will be further described in the following paragraphs.
Photoluminescence occurs if a photoluminescent material is exposed to
photons which excite electrons in the material. When the electrons return to
their original state, they do not fall directly down to their original stage but
falls through other energy bands. This means that the wavelength of the
emitted light will be longer than the light reaching the material. This effect is
explained by a Jablonski diagram as can be seen in figure 10 (Lakowicz,
2006).
Figure 10: Jablonski diagram where the excitation is shown on the arrows
pointing up, and emission is shown in the arrows pointing down.
Photoluminescence can be divided into two different groups depending on
what duration the emission of light continues after the incoming light has
ceased. When the emission of light continues for less than 10-8 seconds, the
photoluminescence is known as fluorescence and if the emissions last longer
than 10-8 seconds, it is known as phosphorescence (Lakowicz, 2006).
The wavelength of the emitted light is most often longer than that of the
absorbed light, see figure 10. This feature is known as the Stokes effect.
Kasha’s rule states that the emission spectra are almost always independent
of the excitation wavelength. Thus, the wavelength of the emitted light is not
dependent on the energy of the absorbed photons. These two rules are highly
applicable to fluorescence, but it is important to note that there are exceptions
(Lakowicz, 2006).

14
Wilhelm Johansson
Apart from the average time between the absorption and the emission another
interesting aspect to measure is the quantum yield. This is a measure of how
many photons are emitted in respect to how many photons were absorbed by
the material, see equation 6 (Lakowicz, 2006).
Φ =# 𝑝ℎ𝑜𝑡𝑜𝑛𝑠 𝑒𝑚𝑖𝑡𝑡𝑒𝑑
# 𝑝ℎ𝑜𝑡𝑜𝑛𝑠 𝑎𝑏𝑠𝑜𝑟𝑏𝑒𝑑 (Equation 6)
Photoluminescence has been observed in glass doped with different metals.
E.g. glass doped with Cerium have shown an emittance of blue light whereas
doping with samarium has led to an emittance of red light. Figure 11 shows
glass doped with different metals irradiated with visible light and UV light
(Stålhandske, et al., 2014).
Figure 11: Glass samples doped with rare earth metals (Tb2O3, CeO2,
Sm2O3 and Eu2O3). Illuminated with visible light to the left
and with UV-light to the right (Stålhandske, et al., 2014).
2.7 Fluorescence Spectroscopy
Generally, fluorescence spectroscopy investigations are performed with a
spectrofluorometer. In most cases, the instrument gives output in form of an
excitation spectrum and an emission spectrum. The excitation spectrum shows
at which excitation wavelength the most fluorescence takes place, whereas the
emission spectrum shows at which wavelengths the light is emitted
(Lakowicz, 2006).
When the emission spectrum and the excitation spectrum of a sample is
determined, the instrument emits a ray of light which goes through a
monochromator. The ray is then split into two, whereas one ray continues to
the sample and the other goes to a reference fluorophore. The EMR reaching
the sample will lead to the emission of light which continues through another
monochromator and into a detector. When the excitation maximum is
measured, the emission monochromator will be fixed at the wavelength
corresponding to the emission maximum. Meanwhile, the excitation
monochromator scans through a predetermined interval and the light intensity
emitted from the sample is recorded (Lakowicz, 2006).

15
Wilhelm Johansson
The emission spectrum is measured by exciting the observed sample with
EMR of a wavelength corresponding to the excitation maximum. In this case,
the emission monochromator scans through a span of wavelengths while the
light intensity measured by the detector is recorded (Lakowicz, 2006). An
overview of a spectrofluorometer is shown in figure 12.
Figure 12: Schematics of a spectrofluorometer.
2.8 Raman spectroscopy
2.8.1 Basic principles
The principle of the Raman spectrophotometer is that the sample observed is
irradiated by a high intensity ray of light with a predefined single wavelength.
The molecules in the sample will then enter a higher energy state, either due
to an increase in vibrational or rotational energy, or due to an excitation of
electrons in the sample. Since the higher energy states are not stable, the
molecules will shortly return to the lower energy state, releasing the excess
energy in form of EMR. The excitation of electrons demands a lot more
energy than an increase of vibrational or rotational energy which leads to the
fact that the former emits radiation of higher energy, and thus shorter
wavelengths, than the latter. Radiation emitted due to transition between
vibrational energy levels is in the infrared region whereas radiation emitted
due to transition of electrons to a lower energy level is in the UV-VIS region
(Ferraro & Nakamoto, 2003). The latter have been more closely explained in
chapter 2.7.
Usually RAMAN spectrophotometers are used to measure the emissions
resulting from the molecule’s transition between vibrational energy levels. In
this case photoluminescence is considered a disturbance because of its
comparably high intensity. In this study however, it is the photoluminescence
that will be measured. The use of a RAMAN spectrophotometer instead of a
fluorescence spectrophotometer when measuring photoluminescence, has the

16
Wilhelm Johansson
advantage that it irradiates the sample with a higher light intensity and thereby
even relatively weak photoluminescence can be observed. One does however
not have as precise control of the energy irradiating the sample and can only
irradiate the sample with one specific wavelength at a time. This leads to the
fact that no quantum yield or excitation maximum can be decided (Ferraro &
Nakamoto, 2003).
2.8.2 Instrumentation
The main components in a Raman spectrophotometer consist of an excitation
source, a sample illuminator, an emission collector, a wavelength selector and
a detector (Ferraro & Nakamoto, 2003).
The excitation source usually consists of a laser, the type of laser used depends
on which wavelength the excitation should have. Before the laser reaches the
sample, it can be filtered to lower the intensity so that the sample is not
damaged. In the sample illuminator, the laser is focused through a lens on the
examined part of the sample. At this stage it is important that as much of the
emissions as possible is collected since the intensity of the emissions are very
low compared to the intensity of the excitation source. After the collector, the
emission from the sample is filtered with a monochromator so that only a
small wavelength region is sent to the detector. The monochromator scans a
predefined wavelength interval while the detector counts the photons, this is
then presented as a Raman spectrum (Ferraro & Nakamoto, 2003).
The detector can be disturbed by cosmic rays which reaches the detector
even if it does not have anything to do with the sample, this will show up as
intense peaks which have to be removed to get a proper spectrum (Ferraro &
Nakamoto, 2003).
2.9 Metals for oxidic thin film coatings
When the metals used for the deposition of thin film have been chosen,
literature studies on the properties of different metals have been made. The
properties of the different metals interesting for the study are that they form
oxides which absorb light in the UV-region which can then be down converted
through photoluminescence to wavelengths which can be converted to
electricity by Si PV-cells. As the reflection of light will be affected by the
refractive index of the thin film this will also be presented for each metal
oxide. Four metals with these properties have been chosen for further studies
and are all examined briefly in the following chapters.

17
Wilhelm Johansson
2.9.1 Zinc
Zinc metal is oxidized to the oxide ZnO, this is the most commonly used
compound of Zn. ZnO is produced by combustion of Zn vapor in air. The
vapor is obtained either through heated evaporation of Zn in the ore or
evaporation of already refined Zn, the latter gives a purer product. ZnO is
often a white material but if it is heated, the oxygen can evaporate, leaving the
material with an excess of Zn atoms. This gives rise to a discoloration and the
material gets a yellow hue (Greenwood & Earnshaw, 1984).
ZnO can primarily form two distinct structures, these are called wurtzite and
zinc-blende. The different structures give them different properties, their
bandgaps are 3.22 and 3.12 eV corresponding to 285 nm and 397 nm for
wurtzite and zinc-blende respectively (Lee, et al., 2002).
It has been shown that an increasing amount of ZnO in Soda lime glass has
the effect that the UV-cutoff is shifted to longer wavelengths. The optical
band gap of the glass was changed from 3.2 eV when no ZnO was added, to
2.32 eV when share of ZnO was raised to 0.4 wt %. The decrease was
correlated although not linear to the addition of ZnO in the glass (Zaid, et al.,
2012). Another study examined showed a decrease in the optical band gap in
soda glass from 3.8 eV to 3.56 eV when the doping with ZnO increases from
0 – 50 wt % (Zaid, et al., 2016).
Thin film of ZnO produced by the sol-gel process have shown an emission
maximum at around 400 nm (Hwangbo, et al., 2007). Photoluminescence has
also been observed in ZnO nanorods at 386, 468 and 640 nm when excited by
325 nm light (Wu, et al., 2005). The refractive index of ZnO is 2.0
(Greenwood & Earnshaw, 1984).
2.9.2 Bismuth
If Bi is directly exposed to O2 at elevated temperatures it forms the oxide
Bi2O3 (Greenwood & Earnshaw, 1984). Bi2O3 has at least 5 different
structures in which its atoms can be arranged. These modifications are called
α, β, γ, δ and ω, and which modification is assembled is dependent on the
conditions in which it is formed (Condurache‐Bota, et al., 2010).
In a study on the optical properties of Bi2O3 deposited by thermal evaporation
in vacuum, different optical bandgaps were observed depending on the
temperature in which the deposition of thin film occurred. The temperatures
used in the study were 27, 77 and 127 °C and bandgaps could be observed at
between 3.9 – 4.7 eV in the UV-region and between 2.5 – 2.9 eV in the VIS
region. These bandwidths correspond to photons of wavelengths between
262.5 – 315.3 nm and 423.6 – 502.4 nm, respectively (Condurache‐Bota, et
al., 2010).

18
Wilhelm Johansson
Photoluminescent properties have been observed for glass doped with Bi2O3
with an emission maximum in the near infrared (NIR) part of the EMR
spectrum. This study showed several excitation maximums in the VIS region.
Because of this, the use of Bi-doped glass was suggested for low-bandgap PV-
cells (Peng & Wondraczek, 2008).
2.9.3 Cerium
When in contact with oxygen Ce forms the metal dioxide CeO2, it is a pale-
yellow material which is relatively inert (Greenwood & Earnshaw, 1984).
In CeO2 a bandgap of 3.29 eV has been found, this corresponds to the energy
of photons of the wavelengths of 376 nm (Niruban Bharathi & Sankar, 2018).
Ce4+ in CeO2 has when synthesized with CuO into a nanocomposite, shown
an optical bandwidth at 3.12 eV, this corresponds to photons of wavelengths
at approximately 397 nm (Ma, et al., 2018). The refractive index of CeO2 is
2.3 at 550 nm (Vangelista, et al., 2017).
Ce3+ have shown photoluminescent properties when doped in Zinc-
borosilicate glass. The excitation maximum observed in the study was located
at 262 nm while the emission maximum was located at 489 nm (Annapurna,
et al., 2004).
2.9.4 Titanium
TiO2 can exist in three different phases, rutile, anatase and brookite. In the
different phases the atoms are arranged in different structures which gives
them different properties. The bandgaps of the oxides are 3.00, 3.21 and 3.13
eV for rutile, anatase and brookite respectively (Dahr, et al., 2013). When
doping soda lime silica glass with 12 mol % TiO2 a switch of the UV-cutoff
from 3.86 to 3.55 eV have been observed (Karlsson, et al., 2016).
Photoluminescence with multiple peaks in the visible range have been
observed in TiO2 nanofibers when irradiated by UV radiation (Chetibi, et al.,
2017). The refractive index of TiO2 anatase and rutile is 2.49 – 2.55 and
2.61 – 2.90 respectively (Greenwood & Earnshaw, 1984).
2.10 Thin Film coatings
It is common practice to apply thin films in order to modify the properties of
the glass surface. The coating by thin films can have several different effects
on the glass, e.g. a change of the reflectivity, absorption, and hardness of the
glass (Le Bourhis, 2014).
For the deposition of thin film on materials, several different methods can be
used, e.g. Physical Vapor Deposition (PVD), Chemical Vapor Deposition
(CVD), sol gel techniques and spray pyrolysis (Le Bourhis, 2014). In the

19
Wilhelm Johansson
following chapters CVD and spray pyrolysis will be explained as their
advantages regarding cost-effectiveness makes them the most relevant
techniques for this study.
2.10.1 Coatings made by Chemical Vapor Deposition
In principle, the CVD-process is performed by letting a gas be sprayed onto
the surface of the material which is to be coated with the thin film (the
substrate). At the surface, a chemical reaction takes place and a thin film is
formed on the substrate. Thin film application usually takes place at high
temperatures 200 - 1600 °C. Since both thin film material and surface material
can vary, a temperature must be chosen which suits both materials (Ho &
Creighton, 2001).
CVD has the advantage that the method provides a conformal film that can be
applied to relatively complicated structures. However, a major drawback is
that the precursors must be in liquid form at room temperature. This is not the
case of any metals other than mercury, but the problem is remedied by using
metal-organic precursors and deposition via Metal Organic Deposition
(MOD). The method also has the drawbacks that the precursors can be
relatively expensive, and that the reaction forming the thin film in some cases
leads to the formation of toxic gases. The high temperature required for the
deposition also means that all types of materials cannot be covered by thin
film via CVD technology (Ho & Creighton, 2001).
As mentioned above, CVD is performed at different temperatures depending
on the type of precursor and surface material to be coated. A temperature
range of 500 - 850 ° C is preferable for MOD (Pattanaik & Sarin, 2001).
The CVD can be performed by use of several different types of reactors, two
of the more common are hot wall reactors and cold wall reactors. The hot wall
reactor is in principle a furnace chamber, where the substrates are placed, it is
often operated at high temperatures and low pressures. This type of reactor
has the advantages that the substrate is kept at a uniform temperature, giving
a uniform layer of thin film. The reactor can generally produce large quantities
at the same time but has the disadvantage that the reactor walls are
contaminated, leading to a need for frequent cleaning of the reactor (Ho &
Creighton, 2001).
In a cold wall reactor, the substrate is heated while the walls of the reactor are
cooled. This type of reactor operates at high pressures and it has the
advantages that less energy for heating and less frequent cleaning of the walls
is needed. The major disadvantage of the reactor is that the coated material
has a less uniform temperature than in a hot wall reactor which leads to a less
uniform thin film coating (Ho & Creighton, 2001).
Before the precursor reaches the material, the ligand or functional group,
which the element used for the thin film is attached to, vaporizes. The thin

20
Wilhelm Johansson
film is created through, pyrolysis, reduction or oxidation depending on what
type of thin film is to be produced (Ho & Creighton, 2001).
2.10.2 Coatings made by spray pyrolysis
The spray pyrolysis technique has the advantage that it is a simple but
effective method which does not require very expensive equipment. This
makes it an interesting method for preparing thin films for research. Thin film
coating made by spray pyrolysis generally consists of an atomizer, a precursor
solution, and a heater for the substrate. The atomizer creates a fine spray from
the liquid used as precursor, it is commonly done by exposing the liquid to an
air stream, continuing through a nozzle which creates a jet stream of droplets.
The precursor solution chosen for the spray pyrolysis can have a significant
influence on the growing of thin film. E.g. if the solution has a too low pH,
the growth of ZnO can be significantly reduced. The heater for the substrate
should keep it at a steady temperature during the thin film coating as this has
a significant impact on the thin film grown on the substrate (Perednis &
Gauckler, 2005).
The main difference between CVD and spray pyrolysis is the state of the
matter reaching the substrate surface. In principle, four different scenarios can
take place as the solution is sprayed on the substrate, these are shown in figure
13. In case 1 the droplets from the spray will reach the surface without prior
vaporization. The solution will then vaporize on the surface and the remaining
complex will react to form a thin film. In case 2, the solvent will have
vaporized before reaching the surface and the precipitate reaches the substrate
where it reacts to form a thin film. In case 3, the precipitate will evaporate and
reach the substrate in form of vapor, this is the only case which could strictly
be called CVD. In case 4 a chemical reaction will occur in the vapor phase,
before reaching the substrate (Pulker, 1999).
Figure 13: Different processes in spray pyrolysis.

21
Wilhelm Johansson
2.11 Precursors used for spray pyrolysis
As mentioned previously, the precursor the solution which is deposited on the
glass to create the thin film. The precursor consists of the element of interest
which has a chemical bond to a single or a group of atoms, these can be
in form of functional groups or ligands. There are several different types
of functional groups and ligands which can be used for the precursor,
e.g. methyl, dimethylamino, cyclopentadienyl and acetylacetate (Ho &
Creighton, 2001). When the choice of precursors was made, the availability
as well as the prevalence of earlier studies where they had successfully been
used for thin film deposition through CVD and spray pyrolysis were the
determining factors.
Acetyl acetonate (acac) is a cheap and nontoxic ligand to use for precursors
(Pflitsch, et al., 2012). CeOX thin films have in previous studies successfully
been grown with Cerium(III) 2,4-pentanedionate hydrate (Ce(acac)3) as a
precursor. The thin films grown were transparent after deposition at
temperatures ranging from 300 – 900 °C (Sawka, et al., 2017) (Wang, et al.,
2016). The same precursor has also been used when growing thin film through
spray pyrolysis (Wang, et al., 2000). The acac complex have also been
favorable when growing thin film of ZnO through spray pyrolysis and CVD.
In this case the precursor is Zinc(II) acetylacetonate (Zn(acac)2) (Pflitsch, et
al., 2012) (Fiddes, et al., 1996).
Therefore, acac will be used as ligand for the Zn and Ce precursors. The
complexes coordinate as an octahedral, as shown in figure 14 (Lohr, et al.,
1999) (Behrsing, et al., 2003).
Figure 14: Structure of Ce(acac)3 and Zn(acac)2(H2O) 2.

22
Wilhelm Johansson
Thin film of Bi2O3 have been successfully grown through CVD with
Tris(2,2,6,6-tetramethyl-3,5-heptanedionato) Bismuth(III) as a precursor. The
growth of thin film was inhibited at temperatures above 325 °C, this is likely
due to the volatility of Bi2O3 (Kang & Rhee, 2004). The structure of the
complex is shown in figure 15.
Figure 15: Structure of Bi(tmhd)3.
When growing TiO2 thin films on glass substrate, the usage of Ti(IV)
isopropoxide (TTIP) as a precursor have shown to be favorable (Sandell, et
al., 2002), due to its high vapor pressure and good thermal stability it is widely
used as a precursor for CVD (Pattanaik & Sarin, 2001). However, when using
TTIP as precursor for thin film growth, it is important to keep a high substrate
temperature so that the ligand does not attach to the substrate together with
the metal oxide. Therefore, a temperature of 500 °C is preferable (Farstad, et
al., 2016).
When preparing a solution with the complex, it is important that the complex
is not exposed to water as this causes hydrolysis leading to that the TiO2
precipitates (Khalil & Zaki, 1997). The complex is in liquid form at room
temperature and its 2D chemical structure is shown in figure 16, the 3D
structure can take several different forms of polymer complexes (Babonneau,
et al., 1988).
Figure 16: 2D structure of Ti(IV) isopropoxide.

23
Wilhelm Johansson
3. Experimental part
3.1 Preparation of the precursor solutions used for spray pyrolysis
The general procedure for preparation of the solutions was as follows. The
amount of metal organic complex shown in table 1 was measured and put into
a glass container. The solvent was then poured into the container and the
solution was stirred and heated to 70 °C. The Ce(acac)3 solution was also
dispersed in an ultrasonic bath, as suggested by Wang et. al (2016)
Table 1: Composition of precursor solutions.
Bi solution Zn solution Ce solution Ti solution
Isopropanol (ml) 150 150 - 100
Ethanol (ml) - - 150 -
Zn(acac)3 (g) - 0.62 - -
Ce(acac)3 (g) - - 0.4 -
Ti isopropoxide (ml) - - - 2.5
Bi(tmhd)3 (g) 0.6 - - -
Wt % metalorganic
complex
0.5 0.5 0.3 3
3.2 Thin film deposition
The thin film was deposited on the air surface of AGC Planibel Clearview
glass samples, with the size 50 x 50 x 3.89 mm. To determine which surface
is which, the glass was examined in UV-light. The technique used for the thin
film coating was spray pyrolysis in a hot wall reactor. The samples were
heated up to 500 °C, after which they were sprayed with the metal organic
solution. The furnace did not have any nozzle to deposit the thin film, instead
the hatch was opened, and the precursor was sprayed on the glass surface
manually. The spray can used for the spray deposition, and the method used
for deposition is shown in figure 17.
Figure 17: Spray can for deposition of precursor and deposition principle.

24
Wilhelm Johansson
To avoid a too steep drop in temperature, a deposition was made of
approximately 1 g of solution for every time the hatch was opened. Between
every deposition the hatch was closed until the temperature had reached 500
°C. As the temperature was controlled during the experiment it did not drop
below 485 °C, and did not rise above 515 °C. Since a lot of time is needed for
the furnace to heat up and for the glasses to be annealed, several samples were
coated during the same heating cycle. The samples were placed in the furnace
according to figure 18.
Figure 18: The glass samples placement in the furnace.
After the deposition was performed, a controlled reduction of the temperature
of the glass occurred at a cooling rate of 30 ° C / h down to 300 °C after which
the furnace was turned off and the samples were left to cool down.
The Bi precursor was deposited at a temperature of 300 °C. An attempt was
also made to deposit the same amount of solution on the tin surface and the
air surface of the two separate samples, Bi 4 and Bi 5.
A series of 6 different amounts of precursor solution were deposited for every
metal. The amount of precursor solution sprayed on every glass sample is
shown in table 2.
Table 2: Sample series, amount of solution sprayed in grams.
1 2 3 4 5 6
Zn (g) 6 12 16 24 32 40
Ti (g) 2 4 6 8 12 18
Ce (g) 4 8 12 14 16 20
Bi (g) 4 6 12 10 10 -

25
Wilhelm Johansson
3.3 UV-VIS spectroscopy
The absorption of the samples was measured with a UV-VIS
spectrophotometer of the model Perkin Elmer Lambda 25. The glass samples
were cleaned with isopropanol and placed in front of the light detector, see
figure 19.
Figure 19: Placement of samples in UV-VIS spectrophotometer.
3.4 Raman spectroscopy to investigate photoluminescence
All samples coated with ZnO, CeOX and TiO2 were examined in a Renishaw
Invia Raman microscope. The samples were irradiated with a He-Cd laser
with the wavelength 325 nm while photoluminescence of wavelengths
between 330 – 720 nm were recorded. The maximum effect of the laser was
6 mW. However, the laser was filtered so that only a fraction of the light
reached the sample, the filter was set to filter out 99 %, 95 % and 90 % of the
laser for the ZnO, CeOX and TiO2 samples respectively. The microscope lens
used for the spectroscopy had a 40 X magnification, this was also used to take
photos of the surface of the coated samples.
As a reference, the spectroscopy was also performed on a non-coated float
glass sample with the above mentioned different filter settings. Prior to the
measurements, the instrument was calibrated by measuring the 1332 cm-1
peak of diamond.
3.5 Calculations of the UV-cutoff and optical bandgap
When the UV-cutoff is measured, one can determine at which wavelength the
glass starts to absorb most of the radiation. As mentioned in chapter 2.5.4.1,
there is no standard for deciding the wavelength of the UV-cutoff. In this
study the UV-cutoff is determined as the wavelength below which less than
5 % of the incoming light is transmitted. This can easily be decided by
examining the absorption spectrum of a given glass.

26
Wilhelm Johansson
The optical bandgap was decided according to the method proposed by Tauc
(1968). After collection of the data from the UV-VIS spectroscopy, the
absorption coefficient can be derived from equation 7.
𝐴(𝜆) =1
𝑡 ∙ log (
𝐼0
𝐼𝑡) (Equation 7)
Where A(λ) is the absorption coefficient at a given wavelength, t is the
pathlength through the glass, I0 is the light intensity emitted by the
spectrophotometer and It is the light intensity reaching the detector.
Tauc’s rule, shown in equation 8 shows the absorption of a certain material.
𝐴(𝜆) =𝐶𝑜𝑛𝑠𝑡𝑎𝑛𝑡
ℎ𝑐
𝜆
∙ (ℎ ∙𝐶
𝜆− 𝐸𝑜𝑝𝑡)
𝑟
(Equation 8)
Where h is Planck’s constant, C is the speed of light, λ is the wavelength and
Eopt is the bandgap of the material in question. It is common practice to use
0.5 as r (Rao, et al., 2012).
If equations 7 and 8 is reorganized to the expressions shown in equation 9 and
10, it can be observed that the bandgap can be found by extrapolating the
linear region of the curve to find the x-intercept of the function shown in
equation 11. To decide where the linear part is located one can examine the
curve visually and examine the value of R2 of a straight line in the linear
interval.
(ℎ𝑐
𝜆∙ 𝐴(𝜆))
1/𝑟
= 𝐶𝑜𝑛𝑠𝑡𝑎𝑛𝑡 ∙ (ℎ ∙𝑐
𝜆− 𝐸𝑜𝑝𝑡) (Equation 9)
𝐸𝑜𝑝𝑡 =ℎ𝑐
𝜆 (Equation 10)
(ℎ𝑐
𝜆∙ 𝐴(𝜆))
1/𝑟
=ℎ𝑐
𝜆 (Equation 11)
A Matlab program was written to investigate the UV-cutoff according to the
principle above, appendix 1.

27
Wilhelm Johansson
3.6 Transmission through the cover glass
To measure the change in efficiency of the PV-cell when the absorption of the
cover glass is changed, a program was written that compares the absorption
of the coated float glass and the reference. By reorganizing equation 7 (chapter
3.5), the light that is transmitted through the glass at a given wavelength can
be determined, see equation 12.
𝐼𝑡 =𝐼0
𝑒𝑡 ∙𝐴(𝜆) (Equation 12)
I0 was chosen as the irradiance according to the solar spectra, for the
wavelengths 350 – 1100 nm, as this is the wavelengths where Si-based PV-
cells can convert EMR into electricity and is still not destructive to the
module. This method follows the standard SS-EN 410:2011 for solar direct
transmittance with the exception that the wavelength interval was modified
from 300 – 2500 nm to 350 – 1100 nm (Standards Sweden 2011).
Since the PV-cells only can convert 1.12 eV of every photon to electricity
(chapter 2.4), calculations were made regarding the total amount of photons
which is transmitted through the glass in order to examine the total amount of
convertible energy which is transmitted through the cover glass. A Matlab
program was written to calculate the energy transmitted according to the
principle above, this can be examined in appendix 2.
3.7 The coatings effect on photoluminescence
The disturbance from cosmic radiation was removed by a program which
calculated the mean value of the previous ten datapoints, corresponding to
approximately 1 nm. If a value was more than 200 counts higher than the
calculated mean value, it was set equal to the previous value.
First a visual inspection was made of the Raman spectra obtained from the
Raman spectroscopy to see if any change in photoluminescence can be
observed compared to the reference sample. The integrated light intensity was
then calculated and compared in different wavelength intervals. The
wavelength intervals were chosen according to the observed differences in the
spectra of the coated samples compared to the reference sample.

28
Wilhelm Johansson
4. Results and discussion
In this chapter the results and evaluations of the experiments will be presented
and discussed.
4.1 Absorption spectra comparison of coated and uncoated float glass.
In this section the ratio between the absorption of the coated samples and the
reference is presented. Note that as the difference between the reference and
the coated samples were considerably lower for the samples coated with BiOX
and CeOX, the plots in figure 22 and 23 have different values on the y-axis
than the plots in figure 20 and 21 and they are thereby not directly comparable.
Figure 20 shows the ratio between the absorption of ZnO coated float glass
and uncoated float glass. All samples show a peak at approximately 370 nm,
this is in the region where ZnO has its optical bandgap, and it is reasonable to
conclude that the peaks are due to absorption of light by the ZnO. The
absorption is also considerably higher than the uncoated float glass in the
longer wavelengths for all the coated thin films, this is thought to be in part
due to an increased reflectivity of the glass surface. The peaks at 370 nm
increases with the amount of deposited precursor with the exception for
sample 2 and 3.
Figure 20: Comparison between ZnO coated glass and regular float glass.

29
Wilhelm Johansson
Figure 21 shows two distinguishable peaks at approximately 370 and 400 nm.
These peaks can be examined on all samples except sample 6 where the
amount of precursor deposited was the highest. Sample 6 however shows a
peak at approximately 570 nm while the two peaks at 370 and 400 nm are
smaller than they are for sample Ti 2 – 5.
Figure 21: Comparison between TiO2 coated glass and regular float glass.
When the ratio between the CeOX coated samples and the reference was
plotted, two peaks were observed at wavelengths of approximately 367 and
395 nm. As can be observed in figure 22, the change in absorption was higher
on the samples with larger amounts of precursors deposited. This gives an
indication that some thin film coating has been deposited.
Figure 22: Comparison between CeOX coated glass and regular float glass.

30
Wilhelm Johansson
When the Bi samples were compared to the reference, only a very small
difference could be distinguished between them, see figure 23. This led to the
conclusion that the coating had not been deposited, therefore the samples were
excluded from further evaluations.
Figure 23: Comparison between BiOX coated glass and regular float glass.
4.2 Effect on the optical bandgap and UV-cutoff
Figure 24 shows the absorption spectrum of the samples with the highest
amount of coating of ZnO, TiO2 and CeOX and the inset shows the Tauc plots.
The Tauc plots for all samples is shown in appendix 3.
Figure 24: UV-cutoff of sample Zn 6, Ti 6, Ce 6 and the reference. The
inset shows the Tauc plot for determining the optical bandgap.

31
Wilhelm Johansson
Table 3 shows the calculated UV-cutoff of the different samples as well as the
optical bandgap. The reduction of transmitted UV radiation with wavelengths
lower than 350 nm, compared to uncoated float glass is also presented for each
sample. A declining trend of the bandgap energy as well as the transmitted
UV-B can be observed when the amount of TiO2 and ZnO coating was
increased. The samples coated with CeOX showed no distinct trend and the
transmission of destructive UV actually increased for all the samples.
Table 3: UV-cutoff of the different samples
Sample Wavelength
(nm)
Optical bandgap
(eV)
Transmission of
destructive UV (%)
Ref. 319 3.64 40.8
Zn 1 320 3.63 30.2
Zn 2 322 3.60 20.4
Zn 3 321 3.63 22.1
Zn 4 323 3.59 17.5
Zn 5 325 3.55 12.1
Zn 6 329 3.53 7.5
Ti 1 320 3.64 37.5
Ti 2 321 3.61 29.9
Ti 3 322 3.57 23.9
Ti 4 322 3.58 23.9
Ti 5 321 3.59 30.8
Ti 6 323 3.56 26.2
Ce 1 319 3.63 42.2
Ce 2 319 3.62 41.8
Ce 3 319 3.62 41.5
Ce 4 319 3.62 41.4
Ce 5 319 3.62 40.9
Ce 6 319 3.60 41.0

32
Wilhelm Johansson
4.3 Effect on the transmittance of useful energy for Si-PV cells
The transmission of sunlight in the wavelength region 350 – 1100 nm is
shown in table 4. It can be observed that a larger amount of deposited
precursor generally leads to a lowered transmission through the glass sample,
this is especially true for the ZnO and TiO2 coated glasses. This could be due
to an increased absorption, reflection or scattering of the incoming light. An
increased reflection could be due to the high refractive indices of the ZnO
(2.0) and TiO2 (2.5 – 2.9).
Table 4: Transmission of sunlight through the samples
Sample Transmitted light (%) Convertible energy (W/m2)
Ref. 85.4 407
Zn 1 80.1 386
Zn 2 77.8 379
Zn 3 77.7 376
Zn 4 76.7 372
Zn 5 72.1 349
Zn 6 73.7 352
Ti 1 83.0 407
Ti 2 79.2 397
Ti 3 71.4 381
Ti 4 71.7 348
Ti 5 65.2 349
Ti 6 65.2 317
Ce 1 85.4 407
Ce 2 85.0 405
Ce 3 83.8 405
Ce 4 84.9 405
Ce 5 84.7 404
Ce 6 84.4 402

33
Wilhelm Johansson
Figure 25 and 26 shows the relative change in transmission of destructive
UV and convertible energy of the ZnO and TiO2 coated samples, compared
to the uncoated sample.
The reduction of the transmission of destructive UV as well as convertible
energy showed linearity for the samples coated with ZnO. A decrease can be
observed both in the transmission of destructive UV and in convertible
energy, but the reduction in destructive UV is significantly steeper.
Figure 25: Linear fit of the change in transmission for the ZnO coated
samples compared to the uncoated sample.
As can be observed in figure 26, there is a distinct relationship between the
amount sprayed and the transmission of convertible energy. This is also true
for the transmission of destructive UV and a clear reducing trend can be
observed which is steeper than the trend for transmission of convertible
energy.
Figure 26: Linear fit of the change in transmission for the TiO2 coated
samples compared to the uncoated sample.

34
Wilhelm Johansson
4.4 Microscopy examination of the coated surfaces.
Figures 27 – 29 show picture montages of 9 pictures covering a small surface
area of the coated samples. The increase in brightness from sample 1 to 6 on
the ZnO and TiO2 coated samples could be due to an increase in reflectivity
as the amount deposited is increased.
The pictures of the ZnO coated surfaces, figure 27, shows that the coating was
not uniformly distributed. Accumulations of ZnO particle agglomerate can be
seen across the surface with a larger amount on the three samples on which
the most solution was deposited.
Figure 27: Photos in 40 X magnification of ZnO coated surfaces.
Figure 28 shows an increasing amount of TiO2 particle agglomerates from
sample 1 – 6. From small amounts in samples 1 – 3 to a larger amount in
sample 4 – 6.
Figure 28: Photos in 40 X magnification of TiO2 coated surfaces.

35
Wilhelm Johansson
As can be observed in figure 29, no distinct difference can be observed
between the different samples and no accumulation of CeOX particles can be
observed on the coated samples.
Figure 29: Photos in 40 X magnification of CeOX coated surfaces.

36
Wilhelm Johansson
4.5 Effect on photoluminescence
Figure 30 and 32 – 34 shows the Raman spectra between 330 – 720 nm of the
sample surfaces. It is important to note that the excitation was made with
different intensities at the different coatings. This leads to the fact that the
spectra of the different coatings cannot be directly compared but each
spectrum should instead be compared to the reference sample in each figure.
Each sample as well as the reference shows a distinct peak around 695 nm.
This can likely be attributed to the Fe3+ present in the glass since it has shown
a peak in photoluminescence at wavelengths around 700 nm when present in
silica glass (Bingham, et al., 2007). The reference sample also shows a peak
at 390 nm, this could be due to photoluminescence from SiO2 (Nagata, et al.,
2004).
Figure 30 shows the spectra of the ZnO coated samples. A strong narrow peak
can be observed at approximately 377 nm which was not prevalent in the
reference sample, this can be compared to the absorption peak seen in figure
20 and corresponds well to the photoluminescence observed in nanorods (Wu,
et al., 2005).
Figure 30: Raman spectra of ZnO coated samples.

37
Wilhelm Johansson
The integrated light intensity of different wavelength intervals of the ZnO
coated samples is shown in table 5. In the wavelength intervals 365 – 410 nm
a fourfold increase in photoluminescence could be observed at the samples
with the highest amount of precursor deposited. In the wavelength interval
450 – 645 nm a trend of increased photoluminescence can also be observed
as the amount of coating is increased.
Table 5: Relative photoluminescence of ZnO coated samples, expressed as 103 photons.
330 – 365 nm 365 – 410 nm 410 – 450 nm 450 – 645 nm 645 – 720 nm
Ref. 96 366 25 1 754 2 894
Zn 1 82 470 23 2 537 3 331
Zn 2 162 547 33 2 257 4 146
Zn 3 57 497 18 2 572 2 892
Zn 4 90 693 22 4 668 5 094
Zn 5 47 1 055 20 4 414 2 681
Zn 6 37 1 484 19 4 441 2 510
Figure 31 shows the integrated value of the light intensity between the
wavelengths 365 – 410 nm plotted against the amount of solution sprayed on
the samples. Although not completely linear (R2=0.88), a clear relationship
can be observed between the amount sprayed and the photoluminescence in
the wavelength region.
Figure 31: Linear fit between solution sprayed and the integrated light
intensity in the wavelength region 365 – 410 nm.

38
Wilhelm Johansson
Sample Zn 4 shows a different pattern compared to the reference and the
other coated samples in the wavelength interval 550 – 650 nm. When the
photoluminescence from the reference sample was subtracted from sample 4,
a peak at 640 nm could be distinguished, see figure 32. This also corresponds
well to the photoluminescence observed in ZnO nanorods (Wu, et al., 2005).
When the same procedure was done with the other ZnO coated samples, no
other peaks then those observed in figure 30 could be distinguished. The
reason for the difference between Zn 4 and the other samples could possibly
be explained by that ZnO of a different structure than on the other samples
could have formed on this sample.
Figure 32: Raman spectra with the light intensity from the reference glass
subtracted from sample Zn 4.

39
Wilhelm Johansson
As can be observed in figure 33, the TiO2 coated samples follow the same
pattern as the uncoated glass although not with the same intensity. It can be
observed that an increased amount of deposition led to a decreasing intensity
of photoluminescence, this may be due to an increased reflection, shielding
the excitation of Fe3+ and SiO2. This led to the conclusion that thin film
coatings of TiO2 caused no change in photoluminescence.
Figure 33: Raman spectra of TiO2 coated samples.
Figure 34 shows the spectrum of CeOX-coated samples compared to non-
coated glass. As can be observed, no significant difference can be seen
between the coated samples and the reference sample.
Figure 34: Raman spectra of CeOX coated samples.

40
Wilhelm Johansson
5. General remarks
It is clear from the nonlinear change of the optical properties of the samples
as the amount of precursor deposited was increased that the method for
deposition was not optimal. For a more precise investigation of the thin films
effect on the optical properties on glasses another coating method would be
preferable, for instance CVD that is cost-efficient and easy to adopt to
industrial processes. The insecurities in how much thin film was grown on the
substrate could have been reduced by measurements of the thin film thickness.
However, the results in this study still show clear trends regarding the optical
effects from thin film coatings of the selected metal oxides.
The amount of precursor sprayed on the substrates differed a lot between the
different metal oxides. This makes it harder to compare the potential of the
different metal oxides with each other. However, since the relation between
thin film growth and the amount of precursor solution sprayed would probably
differ between the metal oxides, the metal oxides would still be hard to
compare directly between each other. Instead, the choice was made to spray
the samples with amounts feasible for each metal oxide.
A decision had to be made whether measurements of the photoluminescence
was going to be performed with a Raman or a spectrofluorometer. The Raman
spectrophotometer was chosen since there was a risk that the fluorescence
would be too weak to measure with the spectrofluorometer. This had the
disadvantage that no quantum yield or excitation maximum could be decided
which might have given a better approximation of how much energy could be
gained due to down converting of destructive UV radiation. Furthermore, it
would have been preferable to measure the Raman spectra with different
excitation wavelengths to study the photoluminescence in more detail. This
could not be done in this study because of a lack of time with the instrument
and a lack of lasers available.
In this study, the thin film deposition was made with spray pyrolysis.
However, it is worth noting that if the coatings are going to be used for
industrial scale cover glass on PV-modules, it will probably be performed
through CVD. This might give rise to a more uniform coating and thereby less
scattering effects than in the samples of this study.

41
Wilhelm Johansson
6. Outlook
Since no deposition of BiOX and CeOX was identified with the method used,
further studies on the potentials of the metal oxides are suggested. During the
literature survey, ZrO2 also showed potentials regarding photoluminescence
and reduction of the transmission of UV radiation destructive to PV-modules.
Studies on thin film coatings of ZrO2 is therefore suggested.
The fact that the coatings of ZnO and TiO2 showed a reduction in transmission
needs to be addressed to evaluate if the thin film coatings will be beneficial
for PV-modules. Studies regarding on how to prevent the reduction in
transmission is therefore suggested. This includes investigation of how much
of the reduction is due to absorption and how much is due to reflection, as
well as the possibilities to prevent the reduction of transmission, e.g. through
coating with antireflective thin film.
Since the trend regarding cover glass is to increase the transmissivity through
the use of low-iron glass, it would be of further interest to study the effects of
thin film coatings on low iron glass. If the transmissivity of low iron glass
could be preserved while the UV radiation destructive to the PV-module is
absorbed by the thin film, important improvements regarding efficiency and
life expectancy of PV-modules would be made possible.

42
Wilhelm Johansson
7. Conclusions
The coating of float glass with ZnO led to a shift of the UV-cutoff to longer
wavelengths and thereby the amount of destructive UV radiation transmitted
was significantly reduced, up to roughly 80 % compared to uncoated float
glass. The samples coated with TiO2 showed a shift of the UV-cutoff to longer
wavelengths and a reduced transmission of destructive UV radiation of up to
41 %.
The samples coated with ZnO showed a peak in photoluminescence at
approximately 377 nm which is in the convertible region for Si-PV-cells. One
of the samples also showed a peak at 640 nm which is also in the convertible
region for Si-PV-cells. No increase in photoluminescence could be observed
on the TiO2 coated samples. Instead, the photoluminescence decreased with
an increased amount of TiO2 coating.
The samples coated with ZnO and the samples coated with TiO2 showed a
reduced transmittance in the wavelength regions in which Si-PV cells can
convert light to electricity. The ZnO coated films showed a decrease of
transmission of convertible energy of up to 14 % and the TiO2 coated samples
showed a decrease of transmission of convertible energy of up to 24 %.
Conclusively, both the coatings of ZnO and TiO2 showed potential to increase
the life expectancy of PV-modules. Both coatings showed the potential of
using low-iron glass to increase the overall transmittivity while being able to
filter the destructive UV radiation. The ZnO coating also showed the potential
to increase the efficiency of the modules. As a result of this, thin film coating
of the cover glass on PV-modules has the potential to increase the electricity
produced during the lifespan of PV-modules. This could contribute to the shift
from CO2 intensive to CO2 neutral energy sources needed to meet the
internationally set targets to mitigate excessive global warming.

43
Wilhelm Johansson
8. References Annapurna, K., Dwivedi, R., Kundu, P. & Buddhudu, S., 2004. Blue emission spectrum of
Ce3+:ZnO-B2O3-SiO2 optical glass. Materials Letters, February , p. 787– 789.
Anon., 2014. Luminescence Basic concepts, Applications and Instrumentation. Pfäffikon: Trans
Tech Publications Ltd.
Arvensen, A. & Hertwich, E., 2012. Assessing the life cycle environmental impacts of wind
power: A review of present knowledge and research needs. Renewable and Sustainable Energy
Reviews, 10 August, pp. 5994-6006.
Babonneau, F. o.a., 1988. XANES and EXAFS Study of Titanium Alkoxides. Inorganic
Chemistry, 5 January, pp. 3166-3172.
Behrsing, T. o.a., 2003. Cerium acetylacetonates—new aspects, including the lamellar clathrate
[Ce(acac)4]·10H2O. Inorganica chimica acta, 6 August, pp. 229-327.
Bingham, P., Parker, J. M., Searle, T. M. & Smith, I., 2007. Local structure and medium range
ordering of tetrahedrally coordinated Fe3+ ions in alkali-alkaline earth-silica glasses. Journal of
non-chrystalline solids, 15 May, pp. 2479-2494.
Bird, R. E., Lewis, L. J. & Hulstrom, R. L., 1983. Terrestrial Solar Spectral Data Sets. Solar
Energy, pp. 563-573.
Brunisholz, M., 2016. Snapshot of global photovoltaic markets, Paris: International Energy
Agency.
Burrows, K. & Fthenakis, V., 2014. Glass needs for a growing photovoltaic industry. Solar
Energy Materials & Solar Cells, 18 oktober, pp. 455-459.
Candida Carvalho de Oliveira, M., Diniz, A. S. A. C., Viana, M. M. & Lins, V. d. F. C. L., 2018.
The causes and effects of degradation of encapsulant ethylene vinyl acetate copolymer (EVA) in
crystalline silicon photovoltaic modules: A review. Renewable and Sustainable Energy Reviews,
january, pp. 2299-2317.
Chetibi, L. o.a., 2017. Photoluminescence properties of TiO2 nanofibers. Journal of nanoparticle
research, 29 March.
Condurache‐Bota, S., Rusu, G. I., Tigau, N. & Leontie, L., 2010. Important physical parameters
of Bi2O2 thin films found by applying several models for optical data. chrystal Research &
Technology, 14 April, pp. 503 - 511.
Dahr, S. o.a., 2013. Effect of Ta alloying on the optical, electronic and magnetic properties of
TiO2 thin films. i: S. B. Ogale, red. Functional metal oxides: New science and novel applications.
New Jersey: John Wiley & Sons, Incorporated, pp. 133-160.
Díaz, S. B., Morrow, J. H. & Booth, C. R., 2000. UV physics and optics. i: S. De Mora, S.
Demers & M. Vernet, red. The effects of UV radiation in the marine environment. Cambridge:
Cambridge University Press, pp. 35-71.
Farstad, M. H. o.a., 2016. TiOx thin films grown on Pd(100) and Pd(111) by chemical vapor
deposition. Surface Science, July, pp. 80-89.
Ferraro, J. R. & Nakamoto, K., 2003. Introductory Raman Spectroscopy. 2:nd red. Orlando:
Elsevier Science & Technology.

44
Wilhelm Johansson
Fiddes, A. J. C. o.a., 1996. Preparation of ZnO films by spray pyrolysis. Journal of Crysstal
Growth, pp. 210-213.
Flank, A.-M., Lagarde, P., Jupille, J. & Montigaud, H., 2011. Redox profile of the glass surface.
Journal of Non-Chrystalline Solids, August, pp. 3200-3206.
Freeman, M. H., 2003. Optics. 11:th red. Oxford: Butterworth-Heinemann.
Greenwood, N. N. & Earnshaw, A., 1984. Chemistry of the elements. 2:nd ed. Oxford: Elsevier.
Ho, P. & Creighton, J., 2001. Introduction to Chemical Vapor Deposition (CVD). i: Chemical
Vapor Deposition. Scarborough: ASM International, pp. 1 - 23.
Hsu, D. o.a., 2012. Life Cycle Greenhouse Gas Emissions of Crystalline Silicon Photovoltaic
Electricity Generation. Journal of industrial ecology, 19 March, pp. 122-135.
Hwangbo, S., Lee, Y.-J. & Hwang, K.-S., 2007. Photoluminescence of ZnO layer on commercial
glass substrate prepared by sol–gel process. Ceramics International, 18 April, pp. 1237-1239.
IEA, 2011. Solar Energy Perspectives, Paris: International Energy Agency.
IPCC, 2014a: Summary for policymakers. In: Climate Change 2014: Impacts, Adaptation, and
Vulnerability. Part A: Global and Sectoral Aspects. Contribution of Working Group II to the
Fifth Assessment Report of the Intergovernmental Panel on Climate Change [Field, C.B., V.R.
Barros, D.J. Dokken, K.J. Mach, M.D. Mastrandrea, T.E. Bilir, M. Chatterjee, K.L. Ebi, Y.O.
Estrada, R.C. Genova, B. Girma, E.S. Kissel, A.N. Levy, S. MacCracken, P.R. Mastrandrea, and
L.L. White (eds.)]. Cambridge University Press, Cambridge, United Kingdom and New York,
NY, USA, pp. 1-32.
Bruckner T., I. A. Bashmakov, Y. Mulugetta, H. Chum, A. de la Vega Navarro, J. Edmonds, A.
Faaij, B. Fungtammasan, A. Garg, E. Hertwich, D. Honnery, D. Infield, M. Kainuma, S.
Khennas, S. Kim, H. B. Nimir, K. Riahi, N. Strachan, R. Wiser, and X. Zhang, 2014: Energy
Systems. In: Climate Change 2014: Mitigation of Climate Change. Contribution of Working
Group III to the Fifth Assessment Report of the Intergovernmental Panel on Climate Change
[Edenhofer, O., R. Pichs-Madruga, Y. Sokona, E. Farahani, S. Kadner, K. Seyboth, A. Adler, I.
Baum, S. Brunner, P. Eickemeier, B. Kriemann, J. Savolainen, S. Schlömer, C. von Stechow, T.
Zwickel and J.C. Minx (eds.)]. Cambridge University Press, Cambridge, United Kingdom and
New York, NY, USA.
Johansson, L. G., 2011. How do you colour glass?. i: E. Flygt, red. An introduction to glass.
Växjö: Glafo, pp. 96-113.
Johansson, L. G. & Fredriksson, H., 2005. The melting and annealing. i: E. Flygt, red. An
introduction to glass Craft Technology and art. Växjö: Glafo, pp. 50-67.
Kang, S. W. & Rhee, S. W., 2004. Growth of bismuth oxide films by direct liquid injection-metal
organic chemical vapor deposition with Bi(tmhd)3 (tmhd: 2,2,6,6-tetramethyl-3,5-heptanedione).
Thin solid films, 1 June, pp. 79-83.
Karlsson, S. o.a., 2016. Effect of TiO2 on optical properties of glasses in the soda-lime-silicate
system. Optical Materials Express, 16 March, pp. 1198-1216.
Khalil, K. M. S. & Zaki, M. I., 1997. Synthesis of high surface area titania powders via basic
hydrolysis of titanium(IV) isopropoxide. Powder Technology, August, pp. 233-239.
Lakowicz, J. R., 2006. Principles of Fluorescnce Spectroscopy. 3:rd red. New York: Springer.

45
Wilhelm Johansson
Le Bourhis, E., 2014. Glass : Mechanics and Technology. New Jersey: John Wiley & Sons,
Incorporated .
Lee, G. H., Kawazoe, T. & Ohtsu, M., 2002. Difference in optical bandgap between zinc-blende
and wurtzite ZnO structure formed on sapphire (0001) substrate. Solid state communications,
October, pp. 163-165.
Lohr, L. L., Miller, J. C. & Sharp, R. R., 1999. Electronic structure and magnetic properties of
high-spin octahedral Co(II) complexes: Co(II)(acac)2(H2O)2. Journal of Chemical Physics, 16
September, pp. 10148-10158.
Ma, X., Lu, P. & Wu, P., 2018. Optical and ferromagnetic properties of hydrothermally
synthesized CeO2/CuO nanocomposites. Ceramics international, 1 April, pp. 5284-5290.
Mertens, K., 2014. Photovoltaics Fundamentals, Technology and Practice. 1:st red. Munich:
John Wiley & Sons Ltd.
Nagata, S. o.a., 2004. Luminescence in SiO2 induced by MeV energy proton irradiation. Journal
of Nuclear materials, 1 August, pp. 1507-1510.
Niruban Bharathi, R. & Sankar, S., 2018. Effects of transition metal element (CO, Fe, Ni)
codoping on structural, optical and magnetic properties of CeO2:Er nanoparticles. Superlattices
and Microstructures, 12 January, pp. 1 - 15.
Niscimento, M. L. F., 2014. Brief history of the flat glass patent - Sixty years of the float process.
World Patent Information, 4 juli, pp. 50-56.
Pattanaik, A. & Sarin, V., 2001. Basic principles of CVD Thermodynamics and Kinetics. i:
Chemical Vapor Deposition. Scarborough: ASM International, pp. 23-45.
Peng, M. & Wondraczek, L., 2008. Bismuth-doped oxide glasses as potential solar spectral
converters and concentrators. Journal of Materials Chemistry, 12 December, pp. 627-630.
Perednis, D. & Gauckler, L. J., 2005. Thin Film Deposition Using Spray Pyrolysis. Journal of
Electroceramics, 2 August, pp. 103-111.
Pflitsch, C., Nebatti, A., Brors, G. & Atakan, B., 2012. MOCVD-growth of thin zinc oxide films
from zinc acetylacetonate and air. Journal of Crystal Growth, 27 March, pp. 5-9.
Pilkington, 2010. Pilkington and the Flat Glass Industry, Tokyo: NSG Group.
Pulker, H. K., 1999. Coatings on glass. Second revised red. Elsevier Science: Amsterdam.
Rao, S. S. o.a., 2012. Optical properties of alkaline earth borate glasses. International journal of
engineering science and technology, December, pp. 25-35.
Sandell, A. o.a., 2002. Titanium dioxide thin-film growth on silicon (111) by chemical vapor
deposition of titanium(IV) isopropoxide. Journal of Applied Physics, 15 September, pp. 3381-
3387.
Sawka, A., Kwatera, A. & Andreasik, P., 2017. Deposition and characterization of ceria layers
using the MOCVD method. Material Letters, 1 October, pp. 39-41.
Shelby, J. E., 2005. Introduction to glass science and technology. 2:nd red. Cambridge: The
Royal Society of Chemistry.
Simonsen, F., 2003. Analysteknik. Köpenhamn: Studentlitteratur.

46
Wilhelm Johansson
Stålhandske, C., Lundstedt, K. & Sundberg, P., 2014. Mapping of fluorescence from cerium
oxide in commercial art glass, Parma: Glafo.
Standards Sweden 2011, Personal Glass in building - Determination of luminous and solar
characteristics of glazing, SS-EN 410:2011.
Available from: Swedish Standards. [18 May 2018].
Tauc, J., 1968. Optical properties and electronic structure of amorphous Ge and Si. Materials
research bulletin, January, pp. 37-46.
U.S. Energy Information Administration, 2016. Carbon Dioxide Emissions Coefficients. [Online]
Available at: https://www.eia.gov/environment/emissions/co2_vol_mass.php
[Använd 8 February 2018].
Vangelista, S. o.a., 2017. Structural,Chemical and Optical Properties of Cerium Dioxide Film
Prepared by Atomic Layer Deposition on TiN and Si Substrates. Thin Solid Films, 31 August, pp.
78-84.
Wang, S. o.a., 2000. Preparation and characterization of cerium (IV) oxide thin films by spray
prolysis method. Solid State Ionics, 2 August, pp. 211-215.
Wang, X. o.a., 2016. Cerium oxide standing out as electron transport layer for efficient and stable
perovskite solar cells processed in low-temperature. Journal of Materials Chemistry A, 13
December.
Venkataprasad Bhat, S. & Deepak, F. L., 2005. Tuning the bandgap of ZnO by substitution with
Mn2+, Co2+ and Ni2+. Solid State Communications, 14 June, pp. 345 - 347.
Wu, L., Wu, Y., Pan, X. & Kong, F., 2005. Synthesis of ZnO nanorods and the annealing effect
on its photoluminescence property. Optical materials, March, pp. 418-422.
Zaid, M. H. M. o.a., 2016. Comprehensive study on compositional dependence of optical band
gap in zinc soda lime silica glass system for optoelectronic applications. Journal of Non-
Crystalline Solids, 22 July, pp. 107-112.
Zaid, M. H. M. o.a., 2012. Effect of ZnO on the Physical Properties and Optical Band Gap of
Soda Lime Silicate Glass. International Journal of Molecular Sciences, 18 June, pp. 7550 - 7558.
Zanotto, E. & Coutinho, F., 2004. How many non-crystalline solids can be made from all the
elements of the periodic table?. Journal of Non-Crystalline Solids, 12 oktober, pp. 285-288.

47
Wilhelm Johansson
9. Appendices
Appendix 1: Matlab program for determining UV-cutoff.
Appendix 2: Matlab program for calculations of solar transmission in
different wavelength intervals.
Appendix 3: Plots from Bandgap calculations.
Appendix 4: Raw data from UV VIS measurements.

1
Wilhelm Johansson
Appendix 1: Matlab program for determining UV-cutoff.
clear;
%Data input
%Wavelength
lambda= xlsread('FloatGlassNoThinFilm.xlsx','FloatGlassNoThinFilm','A3:A903');
%Absorption
A= xlsread('FloatGlassNoThinFilm.xlsx','FloatGlassNoThinFilm','B3:B903');
Thickness=3.89; %Sample thickness
eVperJ=6.241506e18; %eV/J
h=6.6261e-34; %Planck's constant
C=299792458; %Speed of light
A=A/Thickness;
%Bandgap calculations
%Boundaries for the linear part of the plot
startX=3.92;
stopX=4.02;
%Switches
z=1;
start=1;
%Storage for start and stop of straight line
W=0;
w=0;
for j=1:length(lambda)
%Calculations for plot
plot2X(j)=h*C/(lambda(j)*10^-9)*eVperJ;
plot2Y(j)=sqrt(A(j)*h*C/(lambda(j)*10^-9)*eVperJ);
if start==1&&h*C/(lambda(j)*10^-9)*eVperJ>startX
if W==0
W=j;
End

2
Wilhelm Johansson
%Preparing calculations for linear regression
plot3X(2,z)=h*C/(lambda(j)*10^-9)*eVperJ;
plot3Y(z)=sqrt(A(j)*h*C/(lambda(j)*10^-9)*eVperJ);
plot3X(1,z)=1;
z=z+1;
end
if h*C/(lambda(j)*10^-9)*eVperJ>stopX
if start==1
w=j;
end
start=0;
end
end
%Plot the figure
plot(plot2X,plot2Y);
hold on
%Calculation of Bandgap
b1 = plot3X'\plot3Y';
yCalc1 = b1(2)'*plot2X+b1(1)';
medel=mean(plot2Y(W:w));
Sum_namn=0;
Sum_talj=0;
for i=W:w
Sum_talj=Sum_talj+(plot2Y(i)-yCalc1(i))^2;
Sum_namn=Sum_namn+(plot2Y(i)-medel)^2;
end
Rsq1 = 1 - sum((plot2Y(W:w) - yCalc1(W:w)).^2)/sum((plot2Y(W:w) -
mean(plot2Y(W:w))).^2)
Bandgap_calc=-b1(1)/b1(2)'
%Plot the straight line
plot(plot2X(1:w),yCalc1(1:w),'--');
axis([plot2X(1),4.5,0,max(plot2Y)+0.3]);

1
Wilhelm Johansson
Appendix 2: Matlab program for calculations of solar
transmission in different wavelength intervals.
%Data input regarding the sample
lambda= xlsread('Ce6_16apr.xlsx','Ce6_16apr','A3:A903');
A= xlsread('CeZ.xlsx','CeZ','B3:B903');
%Data input of constants
eVperJ=6.241506e18; %eV/J
h=6.6261e-34; %Planck’s constant
C=299792458; %Speed of light
%Formatting of the indata
for i=1:length(lambda)
revlambda(i)=lambda(length(lambda)-i+1);
revA(i)=A(length(A)-i+1);
end
%Read solar spectrum
lambdasun= xlsread('Solar spectrum surface.xlsx','SMARTS2','A3:A2004');
I= xlsread('Solar spectrum surface.xlsx','SMARTS2','C3:C2004');
%Correction of indata so every datapoint accounts for the right amount of energy.
for i=1:length(I)
if i<length(I)
Icorr(i)=(lambdasun(i+1)-lambdasun(i))*I(i);
else Icorr(i)=(lambdasun(i)-lambdasun(i-1))*I(i);
end
end
%Boundaries of the measured part of the spectrum
start=350;
stop=1100;
%Switches
vilk1=1;
vilk2=1;
%Storage for placement of start and stop
Sunhold1=1;
Sunhold2=1;
%Find start and stop values in indata
while vilk1||vilk2

2
Wilhelm Johansson
vilk1=0;
vilk2=0;
if lambdasun(Sunhold1)<start
Sunhold1=Sunhold1+1;
vilk1=1;
end
if lambdasun(Sunhold2)<stop
Sunhold2=Sunhold2+1;
vilk2=1;
end
end
%Create absorption spectrum that fits the solar spectra indata
Count=1;
for j=1:Sunhold2
switch1=1;
while switch1
if revlambda(Count)==lambdasun(j)
Abs(j)=revA(Count);
switch1=0;
end
if revlambda(Count)>lambdasun(j)
Abs(j)=revA(Count-1)+(revA(Count)-revA(Count- 1))/(revlambda(Count)-
revlambda(Count-1))*(lambdasun(j)-revlambda(Count-1));
switch1=0;
end
Count=Count+1;
end
Count=Count-1;
end
%Calculations on how large part of the energy is transmitted
for i=1:length(Abs)
Itsun(i)=Icorr(i)/10^(Thickness*Abs(i));
V=C/(lambdasun(i)*1e-9);
sun_trans_photons(i)= Itsun(i)/(h*V);
sun_in_photons(i)= Icorr(i)/(h*V);
end
%Share of energy transmitted
Transmitted_sun=sum(Itsun(Sunhold1:Sunhold2))/sum(Icorr(Sunhold1:Sunhold2))
%Share of photons transmitted
Photonstransmitted=sum(sun_trans_photons(Sunhold1:Sunhold2))/sum(sun_in_phot
ons(Sunhold1:Sunhold2))
%Convertible energy transmitted
Useful_energy=sum(sun_trans_photons(Sunhold1:Sunhold2))*1.12/eVperJ

1
Wilhelm Johansson
Appendix 3: Plots from Bandgap calculations.
Figure 1 – 6 shows the Tauc plots from which the bandgaps were calculated.
Figure 1: Tauc’s plot for ZnO samples 1 – 3 compared to the reference.
Figure 2: Tauc’s plot for ZnO samples 4 – 6 compared to the reference.

2
Wilhelm Johansson
Figure 3: Tauc’s plot for TiO2 samples 1 – 3 compared to the reference.
Figure 4: Tauc’s plot for TiO2 samples 4 – 6 compared to the reference.

3
Wilhelm Johansson
Figure 5: Tauc’s plot for CeOX samples 1 – 3 compared to the reference.
Figure 6: Tauc’s plot for TiO2 samples 4 – 6 compared to the reference.

1
Wilhelm Johansson
Appendix 4: Raw data from UV VIS measurements.
Figure 1 – 7 shows the raw absorption data from the UV-Vis measurments.
Figure 1: Absorption spectra of ZnO samples 1 – 3.
Figure 2: Absorption spectra of ZnO samples 4 – 6.

2
Wilhelm Johansson
Figure 3: Absorption spectra of TiO2 samples 1 – 3.
Figure 4: Absorption spectra of TiO2 samples 4 – 6.

3
Wilhelm Johansson
Figure 5: Absorption spectra of CeOX samples 1 – 3.
Figure 6: Absorption spectra of CeOX samples 4 – 6.
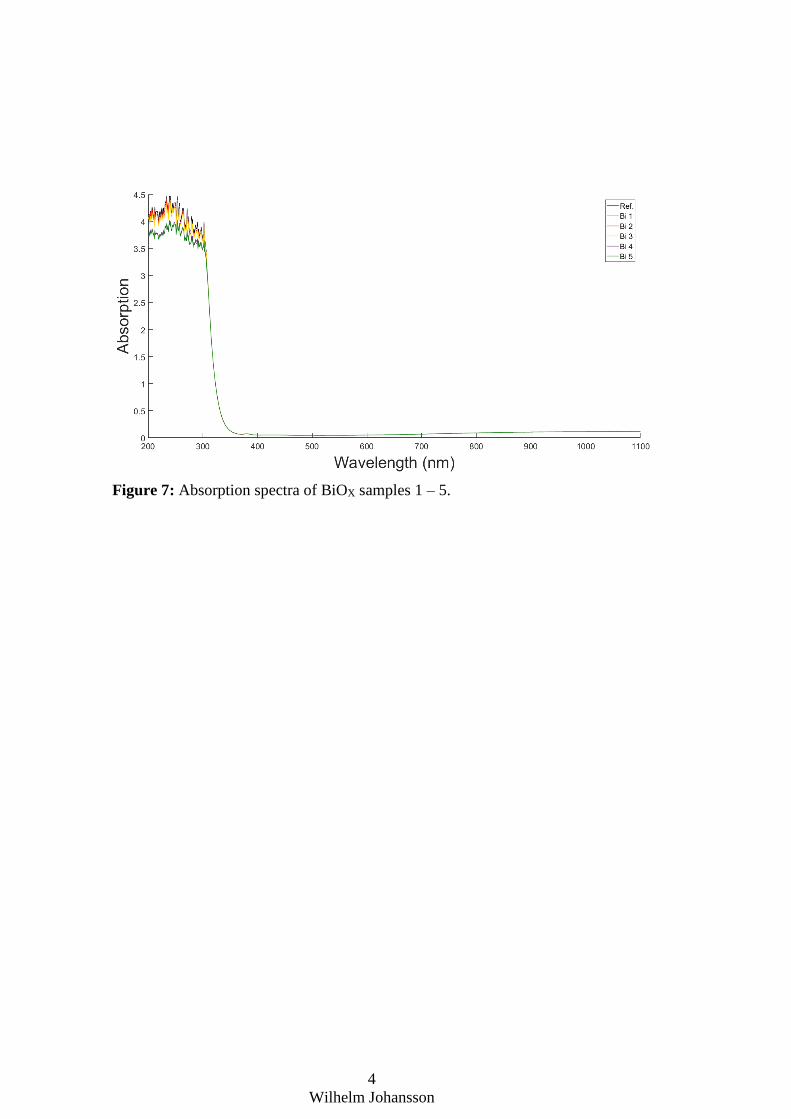
4
Wilhelm Johansson
Figure 7: Absorption spectra of BiOX samples 1 – 5.


Faculty of Technology
SE-391 82 Kalmar | SE-351 95 Växjö
Phone +46 (0)772-28 80 00
Lnu.se/fakulteten-for-teknik


