OPPORTUNITY INDUSTRIES - brookings.edu · a shot over time at obtaining better jobs, with higher...
28
CHAD SHEARER ISHA SHAH December 2018 OPPORTUNITY INDUSTRIES Exploring the industries that concentrate good and promising jobs in metropolitan America
Transcript of OPPORTUNITY INDUSTRIES - brookings.edu · a shot over time at obtaining better jobs, with higher...

OPPORTUNITY INDUSTRIES 1
FINDINGS REFERENCESDEFININGINTRODUCTION CONCLUSION
1
FINDINGS IMPLICATIONS REFERENCES APPENDICESTRENDSSUMMARY INTRODUCTION CONCLUSION
CHAD SHEARERISHA SHAH
December 2018
OPPORTUNITYINDUSTRIESExploring the industries that concentrate good and promising jobs in metropolitan America

2 BROOKINGS METROPOLITAN POLICY PROGRAM
FINDINGS REFERENCESDEFININGINTRODUCTION CONCLUSION
2
FINDINGS IMPLICATIONS REFERENCES APPENDICESTRENDSSUMMARY

OPPORTUNITY INDUSTRIES 3
TABLE OF CONTENTS
Introduction 4
Defining Opportunity Industries 6
Findings 8
1. Promising career pathways depend on the availability of good jobs 8
2. Opportunity Industries concentrate good jobs for workers without college degrees 13
3. Metropolitan areas contain different concentrations of good and promising jobs 16
Conclusion 21
References 23
Endnotes 24
Acknowledgments 26

4 BROOKINGS METROPOLITAN POLICY PROGRAM
FINDINGS REFERENCESDEFININGINTRODUCTION CONCLUSION
In recent decades, technological change and the global integration it enables have been rapidly reshaping the U.S. economy. Digitalization, automation, and expanding global trade have vastly improved the potential of some individuals and firms to thrive but have diminished prospects for others. New technologies and trade shocks have claimed scores of decent-paying jobs and rendered certain skills obsolete, altering the pathways available to those individuals striving to reach or maintain their place in the American middle class.
Although this process of economic progress is not
new, the accelerating pace at which technology
and trade are changing work and society makes
it harder for many individuals, institutions, and
communities to adapt, contributing to growing
disparities between both people and places.
As the labor market continues to tilt toward more
advanced and select sets of skills, how and where
will individuals find durable sources of good jobs?
Experts have devoted increasing attention to this
question at the national level. However, relatively
little research explores pathways to labor market
opportunity in individual metropolitan areas, the
relevant economic context for most American
workers and jobseekers.
INTRODUCTION
Moreover, the debate about how best to promote
upward mobility often begins and ends with a
focus on education and skills. If workers can just
obtain more education and job-specific training,
the argument goes, they will become more
productive, more resilient to economic change,
and better able to earn higher wages. And there
is no shortage of evidence demonstrating a clear
link in the United States between educational
attainment and income. Yet there remain tens
of millions of adults who are already part of the
American workforce, and whose work schedule,
family obligations, or financial situation preclude
them from investing significantly in further
education and training. These workers deserve
a shot over time at obtaining better jobs, with
higher pay and benefits.
« Back to top
OPPORTUNITY INDUSTRIES 5
FINDINGS REFERENCESDEFININGINTRODUCTION CONCLUSION
This report asserts that the structure of regional
economies—in particular, the kinds of occupations
and industries present and the relationships
among them—can influence outcomes for these
workers. It identifies and explores a concept
we call “Opportunity Industries.” These are the
sectors of the economy that, based on a first-
of-its-kind analysis of workers’ experiences
over time, appear to offer the best chances for
individuals—particularly those without four-year
college degrees—to obtain a “good job,” one
that provides stable middle-class wages and
benefits. We examine the presence of these jobs
and industries within the nation’s 100 largest
metropolitan areas, and how pathways to those
jobs—including through “promising jobs” that
represent stepping stones to good jobs over
time—may differ for workers by race, gender, and
educational attainment.
This report proceeds by first describing the
definitions used to identify good and promising
jobs and the opportunity industries that contain
them. The report analyzes in turn: (a) the
occupations accessible to sub-baccalaureate
workers that contain good and promising jobs,
and how workers tend to access them over time;
(b) the characteristics of industries that tend
to concentrate those occupations; and (c) the
availability of good and promising jobs across
major metropolitan areas. Detailed information
on each metropolitan area is available in an
accompanying web-based interactive tool.
The report concludes by suggesting how local
actors in business, economic development, and
workforce development can use this information
and insight to sustain and expand labor market
opportunity in their communities. Forthcoming
case studies of the metropolitan regions of
Central Indiana and California’s Inland Empire
showcase how the insights and solutions this
analysis supports also vary according to the
economy, workforce, and political landscape of
different places.
Overall, the findings of this report should inspire
cautious optimism about the future of labor
market opportunity in metropolitan America.
Although we find a shortage of opportunity across
metropolitan areas, the dynamism necessary for
adapting to this period of accelerating economic
change is already a fundamental part of how local
labor markets function. The challenge for local
leaders is to harness this dynamism by growing
and improving jobs in opportunity industries that
encourage, rather than inhibit, upward mobility.
6 BROOKINGS METROPOLITAN POLICY PROGRAM
FINDINGS REFERENCESDEFININGINTRODUCTION CONCLUSION
Leaders in metropolitan areas—elected officials, presidents of colleges and universities, CEOs of local businesses, heads of major nonprofits and philanthropies—are focused on how they can promote opportunity for more individuals and families in their communities. And for good reason, as economic growth over the past several years has not consistently translated into improved outcomes for all residents. According to Brookings’s latest Metro Monitor, only 11 of the nation’s 100 largest metro areas managed to simultaneously grow their economy, improve standards of living, and deliver increased employment opportunity and earnings for a broad segment of their populations in 2016.1
Metro areas are a critical geography for achieving
inclusive economic growth. They represent the
local labor markets in which most Americans
live and work. Moreover, U.S. adults who do not
possess a four-year college degree—many of
whom have struggled to achieve and maintain a
foothold in the American middle class in recent
years—rely chiefly on their local labor markets
to provide opportunities to gain knowledge and
experience as they work their way toward better-
paying jobs and, hopefully, economic security.2
Accordingly, this analysis aims to reveal both
where individuals, especially those without four-
DEFINING OPPORTUNITY INDUSTRIES
year college degrees (whom we refer to as sub-
baccalaureate workers), can find good jobs that
provide economic security, and how individuals
can navigate local labor markets to obtain these
good jobs. To do this, we define and measure
three types of wage and salary jobs in each of the
nation’s 100 largest metropolitan areas:3
• Good jobs pay at least a metropolitan
area’s median annual earnings for full-time,
year-round sub-baccalaureate workers
and provide employer-sponsored health
insurance.4 Setting the pay threshold in this
way ensures that it reflects variations in pay
« Back to top

OPPORTUNITY INDUSTRIES 7
FINDINGS REFERENCESDEFININGINTRODUCTION CONCLUSION
and costs of living across metropolitan areas.5
This threshold ranges from a low of $13.78
an hour, or about $28,660 per year, in the
McAllen, Texas metropolitan area to a high of
$22.46 per hour, or about $46,710 per year, in
the San Francisco, Calif. metropolitan area.6
Employer-sponsored health insurance serves
as a proxy for the availability of other benefits,
such as paid leave and retirement benefits.
• Promising jobs are entry-level positions
that provide career pathways to good jobs.
Promising jobs do not meet the criteria for a
good job but, based on an analysis of historical
job-switching patterns and projections, will
enable an incumbent worker to reach a good
job within 10 years. We use a first-of-its-kind
analysis of past occupational mobility trends
to estimate how workers will move—or not
move—between occupations over the next 10
years, based on projected job openings and
demographics of incumbent workers in each
metropolitan area.7
• Other jobs are those that do not meet the
criteria of either good jobs or promising
jobs. Other jobs fail to meet at least one of
the criteria of good jobs, meaning they do not
provide adequate pay and/or do not provide
employer-sponsored health insurance, nor
do they offer incumbent workers reliable
career pathways to a good job within 10 years.
Although other jobs are a vital source of work
and income for the people who hold them,
their low pay and lack of benefits to better jobs
would leave many working families without
sufficient resources to meet all their basic
needs and without a viable pathway to a more
economically secure future.
We further differentiate good and promising
jobs by the typical educational attainment (with
and without a four-year college degree) of the
people who hold those jobs. For instance, “good
jobs held by sub-baccalaureate workers” refers
to jobs that are: (a) occupied by individuals who
do not hold a four-year college degree; and (b)
meet the earnings and benefits criteria noted
above. This report focuses on the types of good
and promising jobs held by sub-baccalaureate
workers, who face shrinking opportunities in
many labor markets. However, it also presents
data on jobs held by people who have at least a
bachelor’s degree, since these workers and the
industries in which they are concentrated help
support opportunity and prosperity for all people
in metropolitan economies.
This analysis estimates the share of jobs that
qualify as good, promising, or other jobs in each
occupation and “maps” them to industries. Jobs
in each occupation are labeled good, promising,
or other based on the probability that they
meet the criteria for each category given local
economic dynamics, jobholders’ demographic
characteristics, and their educational attainment.
This approach thus estimates what share of jobs
in each of more than 800 occupations (defined
by the Standard Occupation Classification (SOC)
system) fall into each category of job quality.8 We
then tie these occupational job quality metrics
to industries (defined by the North American
Industrial Classification System (NAICS)) using
detailed data on the staffing patterns of each
metro area’s industries.9
This report presents high-level findings on the
opportunity industries and occupations that
concentrate good and promising jobs across the
nation’s 100 largest metropolitan areas. These
findings reveal considerable variation in the
share of jobs that qualify as good or promising
across occupations, industries, and metropolitan
areas. More detailed data and findings on
individual metropolitan areas and their industries,
occupations, and workers are can be explored
and downloaded from a web-based interactive
tool. More details about the data and methods
used to drive these findings are available in an
accompanying technical appendix.

8 BROOKINGS METROPOLITAN POLICY PROGRAM
FINDINGS REFERENCESDEFININGINTRODUCTION CONCLUSION
1. Promising career pathways depend on the availability of good jobs
Although we hear a lot about their disappearance
due to trade and technology, “good jobs” are
important features of nearly all U.S. metropolitan
labor markets. By identifying the occupations
that concentrate those jobs, as well as those
that provide viable pathways to good jobs, local
leaders can help more workers without college
degrees get a leg up in the labor market.
OCCUPATIONS THAT REQUIRE SPECIALIZED SKILLS CONCENTRATE GOOD JOBS FOR WORKERS WITHOUT COLLEGE DEGREES
Altogether, the nation’s 100 largest metropolitan
areas provided 11.4 million good jobs held by
sub-baccalaureate workers in 2017, accounting
for 11 percent of all jobs in large metro areas.
Another 9.4 million jobs, or 9 percent of all jobs,
were promising jobs held by sub-baccalaureate
workers.
However, with more than 38 million prime-aged
sub-baccalaureate workers, the nation’s large
metro areas do not provide nearly enough good
and promising jobs for all of them.10 Only 20
percent of sub-baccalaureate workers currently
hold a good job, while another 13 percent hold a
promising one. To be sure, not all of these workers
could hold good jobs, since the definition of good
jobs implies that half of all full-time, year-round
sub-baccalaureate workers in the metropolitan
area earn less than the threshold. Yet there is
scope for increasing that share, as well as the
representation of these workers in jobs that
facilitate more pathways to higher earnings in the
future.
Most good jobs and promising jobs held by
sub-baccalaureate workers are concentrated in
occupations that themselves contain high shares
of good and promising jobs. Yet these good and
promising jobs are typically not found in the same
occupations.
• Maintenance, construction, production,
and transportation occupations account
for a disproportionate share of both good
and promising jobs for sub-baccalaureate
workers. These traditionally “blue-collar”
occupations together account for 19 percent
of jobs in large metro areas, but 44 percent
of good jobs and 25 percent of promising
jobs held by sub-baccalaureate workers.
FINDINGS
« Back to top

OPPORTUNITY INDUSTRIES 9
FINDINGS REFERENCESDEFININGINTRODUCTION CONCLUSION
These occupations also contain among the
highest shares of good and promising jobs for
these workers. For example, in maintenance
occupations, 42 percent of jobs are good
jobs held by sub-baccalaureate workers, on
average, and another 10 percent are promising.
In production occupations, which are found
mostly in manufacturing industries, 22
percent of jobs are good, and 13 percent are
promising for sub-baccalaureate workers. In
transportation occupations, which include fork-
lift drivers, package and luggage handlers, and
truck drivers, 15 percent of jobs are good, and
14 percent are promising.
• Management, business, computer, and
engineering occupations also contain a
disproportionate share of good jobs held by
sub-baccalaureate workers but provide few
promising jobs. Together, occupations under
these major categories account for 16 percent
of all jobs in large metro areas, and 25 percent
of good jobs held by sub-baccalaureate
workers. However, these occupations represent
only 4 percent of promising jobs held by
sub-baccalaureate workers. In these “white-
collar” occupations, large shares of jobs are
actually held by sub-baccalaureate workers.
Good jobs held by sub-baccalaureate workers
represent 24 percent of jobs in engineering
and architectural occupations, 20 percent
in management occupations, 19 percent in
computer and math occupations, and 12
percent in business operations occupations.
• Likewise, health care practitioner and
protective service occupations account for
relatively large shares of good jobs held
by sub-baccalaureate workers, but few
promising ones. Together these occupations
account for 8 percent of jobs in large metro
areas, but 14 percent of good jobs held by
sub-baccalaureate workers. Like the other
skilled professional occupations above, these
Concentration of good and promising jobs by major occupation group2017
Note: Agriculture and legal occupations are excluded.
Source: Authors’ analysis of U.S. Census Bureau public-use microdata and EMSI estimates
FIGURE 1
Promising sub-baccalaureate jobs Good sub-baccalaureate jobs Good and promising high-skill jobs Other jobs
0%
25%
50%
75%
100%
Sub-baccalaureate average
Educatio
n (25)
Tota
l
Mai
ntenan
ce (4
9)
Constru
ctio
n (47)
Prote
ctive
(33)
Product
ion (5
1)
Tran
sporta
tion (5
3)
Enginee
ring (1
7)
Man
agem
ent (
11)
Computa
tion (1
5)
Health
pra
ctiti
oner (2
9)
Admin
istra
tive
(43)
Facil
ities
(37)
Busines
s (13
)
Health
tech
nician
(31)
Sales
(41)
Food se
rvice
(35)
Arts/E
nterta
inm
ent (
27)
Perso
nal ca
re (3
9)
Science
(19)
Social s
ervic
e (2
1)

10 BROOKINGS METROPOLITAN POLICY PROGRAM
FINDINGS REFERENCESDEFININGINTRODUCTION CONCLUSION
occupations provide fewer promising jobs.
Health practitioner occupations, such as
nurses, therapists, and diagnostic technicians,
provide significantly more good jobs for sub-
baccalaureate workers then health support
occupations, such as home health aides and
nursing assistants. In protective services
occupations, public sector jobs such as police
and firefighters are typically good jobs, while
private sector jobs such as security guards are
typically not.
• Many of the occupations that provide
relatively few good jobs for sub-
baccalaureate workers provide many more
promising jobs. Jobs in administrative, sales,
and food-service occupations are among
the most prevalent in metropolitan America,
accounting for more than one out of every
three jobs. These occupations provide few
good jobs, but higher-than-average shares
of promising jobs held by sub-baccalaureate
workers. Together, they provide 47 percent
of all promising jobs for sub-baccalaureate
workers in large metro areas. Similarly,
personal care occupations, such as child care
workers, and facilities care occupations, such
as groundskeepers and janitors, provide almost
no good jobs but many promising ones.
• In some occupations, the bulk of good and
promising jobs are held by workers with a
four-year college degree. Large shares of
jobs in the social service, education, arts, and
science occupations are good or promising
for high skill workers. These occupations
provide few good or promising jobs for sub-
baccalaureate workers. By contrast, although
half or more of all positions in management,
computer, and engineering are good or
promising jobs held by high-skill workers,
these fields also meet or exceed the average
share of good and promising jobs held by sub-
baccalaureate workers.
PEOPLE SWITCH CAREERS TO GET GOOD JOBS
Occupations that provide the best chances of
obtaining a good job typically require specialized
skills. Yet few people follow a specific career
pathway to get one. Instead, most people who
obtain a good job do so by switching from an
unrelated occupation—especially people who do
not have a four-year college degree.
Obtaining a good job often requires an
occupational switch because good jobs are
scarce and highly concentrated in a few types
of occupations. Meanwhile, promising jobs are
also highly concentrated, but often in different
occupations. As a result, most promising career
pathways to good jobs are “lattices” that run
across occupations rather than “ladders” that
exist within them.
• Workers with less education are more likely
to switch careers and depend more on
career switching to get a good job. Across
the nation’s largest metro areas, more than 71
percent of workers who are projected to obtain
a good job by 2027 will move from one major
occupation group to another, representing
a significant career switch. This is especially
the case for workers without college degrees.
Nearly 72 percent of workers with an associate
degree will switch careers to get a good job,
and more than 77 percent of workers with only
a high school diploma will switch careers to get
a good job.
• Sub-baccalaureate workers are more likely
to switch careers to get a good job in part
because more of them start in occupations
that provide few good jobs. Less educated
workers are more likely to begin their careers
in food service, personal care, facilities care,
and health care technician occupations where
good jobs are scarce. In fact, more than
90 percent of sub-baccalaureate workers

OPPORTUNITY INDUSTRIES 11
FINDINGS REFERENCESDEFININGINTRODUCTION CONCLUSION
Share of workers projected to switch careers within 10 yearsBy level of educational attainment
Source: Authors’ analysis of U.S. Census Bureau public-use microdata and EMSI estimates
FIGURE 2
40% 60% 80% 100%
No diploma
High school diploma
Some college or certificate
Associate degree
Baccalaureate degree or higher
Total
Share of incumbents in pathways to good jobs projected to switch careersShare of incumbents not in pathways to good jobs projected to switch careers
who start in one of these four occupational
categories will switch to a different
occupational category in order to obtain a
good job. Sub-baccalaureate workers who start
from occupations that provide more good
jobs or require more specialized training or
experience, such as health care practitioners,
protective service, construction, production,
and science and engineering occupations,
are far less likely to switch careers in order to
obtain a good job.
• Workers who make the most successful
career switches move into jobs that are
better paid but entail similar skill sets.
For example, nearly 33 percent of sub-
baccalaureate workers who switch out of
health care technician occupations switch
into good jobs in health care practitioner
occupations. About 39 percent of sub-
baccalaureate workers who switch out
of facilities care occupations switch into
construction, maintenance and repair,
or production occupations. And sub-
baccalaureate workers who switch from jobs
in these better-paying occupational categories
often switch into good jobs in management,
business, or supervisory roles within other
occupational categories that entail judgment,
decision making, and communication.
These findings suggest two key implications for
how metropolitan leaders across an array of
systems and institutions might seek to broaden
local labor market opportunity.
First, for most people, the likelihood of obtaining
a good job depends significantly on how many
good jobs are available in the local economy.
Career ladder or apprenticeship models, in which
someone starts in a low-paid job and acquires
skills and experience over time that allows them
to advance to a good job in the same occupation,
are rare. Instead, most people gain experience
12 BROOKINGS METROPOLITAN POLICY PROGRAM
FINDINGS REFERENCESDEFININGINTRODUCTION CONCLUSION
in one occupation and then move to a better
job in a different occupation when they find an
opportunity to do so.
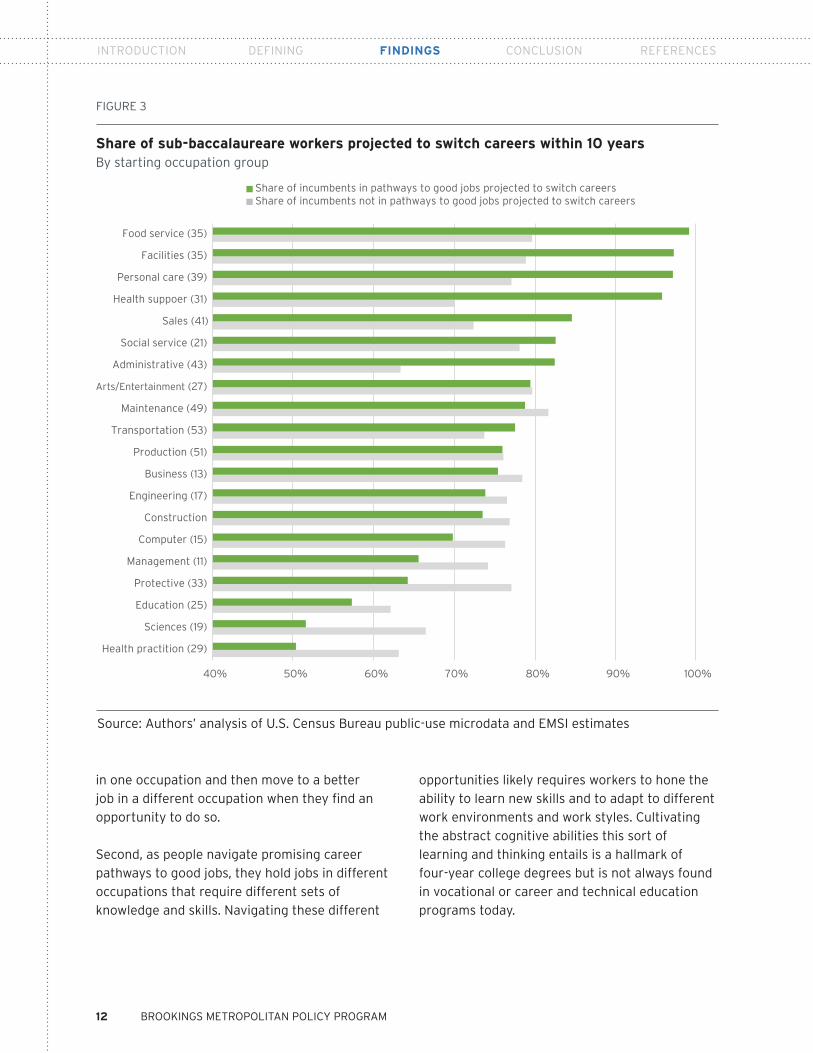
Second, as people navigate promising career
pathways to good jobs, they hold jobs in different
occupations that require different sets of
knowledge and skills. Navigating these different
opportunities likely requires workers to hone the
ability to learn new skills and to adapt to different
work environments and work styles. Cultivating
the abstract cognitive abilities this sort of
learning and thinking entails is a hallmark of
four-year college degrees but is not always found
in vocational or career and technical education
programs today.
Share of sub-baccalaureare workers projected to switch careers within 10 yearsBy starting occupation group
Source: Authors’ analysis of U.S. Census Bureau public-use microdata and EMSI estimates
FIGURE 3
40% 50% 60% 70% 80% 90% 100%
Arts/Entertainment (27)
Sales (41)
Health practition (29)
Sciences (19)
Education (25)
Protective (33)
Management (11)
Computer (15)
Construction
Engineering (17)
Business (13)
Production (51)
Transportation (53)
Maintenance (49)
Administrative (43)
Social service (21)
Health suppoer (31)
Personal care (39)
Facilities (35)
Food service (35)
Share of incumbents in pathways to good jobs projected to switch careersShare of incumbents not in pathways to good jobs projected to switch careers

OPPORTUNITY INDUSTRIES 13
FINDINGS REFERENCESDEFININGINTRODUCTION CONCLUSION
2. Opportunity industries concentrate good jobs for workers without college degrees
Industries organize work around different sets of
occupations and skills. This naturally means that
different industries provide different levels of
good and promising jobs. Opportunity industries
are those in which good jobs represent an above-
average share of the industry’s total jobs.
By supporting the growth of opportunity
industries, especially those that help drive
growth in other parts of the economy, leaders in
metropolitan areas can increase opportunities for
more people and families to reach and maintain
their place in the middle class.
TRADABLE INDUSTRIES OFFER AMONG THE BEST CHANCES FOR SUB-BACCALAUREATE WORKERS TO OBTAIN GOOD JOBS
Regional economists tend to describe
metropolitan economies as containing two types
of industries. “Tradable” industries are those
in which firms export most of their products or
services to customers outside the region, and
thus compete in national and global markets.
These tradable industries—think manufacturing,
software, higher education, or freight
transportation—constitute the wealth-generating
sectors of the local economy. They, in turn,
support a set of “local-serving” industries in areas
such as retail, food services, and basic health
care that cater primarily to consumers within the
region.
This simple rubric for characterizing metropolitan
industries enables a useful first-order look at
where good and promising jobs tend to exist
within metro economies.
• The opportunity industries that provide
among the highest concentrations of good
jobs for people without a four-year college
degree are tradable. Across the nation’s 100
largest metropolitan areas, tradable industries
contain only about 29 percent of all jobs
but account for 38 percent of the good jobs
held by sub-baccalaureate workers.11 These
tradable opportunity industries not only
contain many of metropolitan America’s good
jobs for sub-baccalaureate workers, but also
generate wealth and growth for the entire
economy, accounting for nearly 44 percent of
metropolitan America’s economic output in
2017.12
Tradable industries typically associated with
blue-collar jobs, including the manufacturing,
logistics, and wholesale trade sectors, provide
especially high concentrations of good jobs
and near-average shares of promising jobs
for sub-baccalaureate workers. In both the
logistics sector, which comprises industries
involved in the transportation and warehousing
of goods, and the manufacturing sector, about
25 percent of jobs are good jobs held by
sub-baccalaureate workers—higher than the 11
percent average across all large metropolitan
economies. In wholesale trade, 12 percent of
jobs are good jobs held by sub-baccalaureate
workers.
• The share of good jobs varies across
detailed industries within tradable sectors.
For example, 36 percent of jobs in the primary
metal manufacturing industry are good jobs
for sub-baccalaureate workers, but the same
is true of only 8 percent of jobs in apparel
manufacturing. In logistics, 36 percent of long-
distance freight trucking jobs are good jobs
for sub-baccalaureate workers, versus only
14 percent of jobs in general warehousing or
distribution centers. Sectors thus indicate only
so much about where real opportunity lies for
workers without four-year college degrees.
Other largely blue-collar sectors like utilities
or construction are mostly local-serving but
contain some tradable industries that are
important sources of good jobs. Thirty-seven

14 BROOKINGS METROPOLITAN POLICY PROGRAM
FINDINGS REFERENCESDEFININGINTRODUCTION CONCLUSION
(37) percent of jobs in the utilities sector are in
tradable industries, but of those jobs—mostly in
electric power generation or transmission—49
percent qualify as good jobs for sub-
baccalaureate workers. In the construction
sector, only 7 percent of jobs are in tradable
industries, including civil infrastructure and
industrial facilities construction. Fully 31
percent of jobs in these industries qualify as
good jobs for sub-baccalaureate workers.
Tradable industries in sectors typically
associated with white-collar jobs also provide
above-average shares of good jobs for
sub-baccalaureate workers: 13 percent in
information (telecommunications, broadcast,
and other media industries); 15 percent in
corporate headquarters; and 14 percent in
professional services industries (engineering,
legal, accounting, and consulting services).
• Although tradable industries concentrate
good jobs for sub-baccalaureate workers,
they do not concentrate promising jobs.
Good jobs outnumber promising jobs by
nearly two-to-one in tradable industries, on
average. In tradable industries, people who
hold promising jobs can often obtain good
jobs without switching industries, by building
specific expertise that allows them to climb
career ladders. For example, workers who
begin as assemblers of engines and other
machines move into first-line supervisor
roles or roles that involve more advanced
techniques and skills in the same industry,
such as computer-controlled tool operation.
• In contrast to tradable industries,
industries in local-serving sectors of the
economy provide below-average shares of
good jobs for people without a four-year
college degree. In the nation’s 100 largest
metropolitan areas taken together, local-
serving industries account for 57 percent of all
jobs but only 41 percent of good jobs held by
sub-baccalaureate workers. However, local-
serving industries provide many workers with
stepping stones to upward mobility, accounting
for 67 percent of promising jobs held by sub-
baccalaureate workers. Improving job quality
and career pathways from these industries can
help more people reach good jobs.
Local-serving industries in the hospitality and
retail sectors are among metropolitan areas’
largest sources of jobs but provide some of
the lowest concentrations of good jobs. In food
service industries, which make up the local-
serving portion of the hospitality sector, less
than 1 percent of jobs are good jobs held by
sub-baccalaureate workers. In the retail sector,
which is almost entirely local-serving, that
share is under 3 percent.
Overall, most jobs in local-serving industries
are neither good nor promising. However,
there are some local-serving industries that
provide exceptional opportunities for sub-
baccalaureate workers. Industries in the
utilities and construction sectors that primarily
serve local consumers offer good jobs for sub-
baccalaureate workers at rates well above the
economy-wide average. Across the nation’s
largest metropolitan areas, 48 percent of jobs
in the utilities sector and 31 percent of jobs
in the construction sector qualify as good for
sub-baccalaureate workers.
• Local-serving sectors do provide many
promising jobs in metropolitan areas.
Although relatively few good jobs for sub-
baccalaureate workers exist in local-serving
sectors, they tend to provide significant shares
of promising jobs. In hospitality and retail,
promising jobs held by sub-baccalaureate
workers account for 14 percent of all jobs,
well above the economy-wide average. In
the administrative services sector, which
includes industries like temporary hiring
agencies, waste management, and facilities
management, just 5 percent of jobs are good
jobs, but 15 percent are promising jobs. In

OPPORTUNITY INDUSTRIES 15
FINDINGS REFERENCESDEFININGINTRODUCTION CONCLUSION
the local “other services” sector—a catchall
that includes auto repair shops, dry cleaners,
religious and civic institutions—just 6 percent
of jobs are good jobs, but 11 percent are
promising jobs. The real estate and arts and
entertainment (A&E) industries also contain
few good jobs but above-average shares of
promising ones.
• Routes to upward mobility from local-
serving sectors often involve switching
industries. Because local-serving sectors
tend to comprise a large share of all jobs in
the typical metropolitan area, especially for
workers without college degrees, they account
for many promising jobs. However, because
these sectors provide relatively few good
jobs, workers who start from promising jobs
in local-serving industries typically switch to
another industry in order to obtain a good
job. Although some people who work in food
service industries have promising jobs, most
are not likely to become restaurant managers.
To get ahead, they are more likely to move to
a different industry altogether, becoming truck
drivers or customer service representatives.
• Neither tradable nor local-serving,
government is typically a large and rich
source of good jobs for sub-baccalaureate
workers. Government accounts for the
remaining 14 percent of jobs in metropolitan
America not accounted for by tradable or
local-serving sectors. Most government jobs in
metropolitan areas are in either state or local
government. But in government at all levels,
an average of 21 percent of jobs are good
jobs held by sub-baccalaureate workers, while
another 7 percent qualify as promising.
HIGH-SKILL WORKERS FIND GOOD AND PROMISING JOBS ACROSS A RANGE OF INDUSTRIES
For workers with bachelor’s degrees, the
distinction between tradable and local-serving
industries is less sharp with regard to where good
and promising jobs exist in most metro areas.
• A wide range of industries provide relatively
high shares of good and promising jobs for
workers with at least a bachelor’s degree.
High-skilled workers are required in nearly
every industry to one degree or another,
whether tradable or local-serving. Across
the nation’s 100 largest metropolitan areas,
an average of 23 percent of jobs are good
or promising jobs held by people with at
least a bachelor’s degree (because good and
promising jobs are broadly similar for workers
with four-year degrees, we combine these
categories).
• Tradable industries in the professional
services, information, and headquarters
sectors offer the largest shares of good and
promising jobs for workers with at least
a bachelor’s degree. In some professional
services industries, such as computer
systems design, engineering services, and
scientific research, over 50 percent of jobs
are good or promising for high-skill workers.
In the information sector, industries such as
publishing and data processing offer above-
average (45 percent) shares of good or
promising jobs for college degree holders,
similar to corporate headquarters jobs (40
percent).
• Several local-serving industries also
provide opportunities for good jobs and
upward mobility for workers with at least a
bachelor’s degree. The health care, education,
and government sectors are particularly
important local-serving sources of good
jobs for these workers. The private health
care sector, often held up as providing rich
opportunity for sub-baccalaureate workers,
actually delivers relatively low shares of good
or promising jobs for those workers, but
many jobs for high-skill workers. Twenty-six
(26) percent of jobs in the health care sector,
32 percent in the education sector, and 37

16 BROOKINGS METROPOLITAN POLICY PROGRAM
FINDINGS REFERENCESDEFININGINTRODUCTION CONCLUSION
percent in the government sector are good or
promising for college-educated workers.
For economic development leaders, these findings
reinforce the importance of tradable industries
as drivers of local wealth generation and
opportunity. In almost every tradable industry, the
share of jobs that qualify as good or promising—
for people both with and without a bachelor’s
degree—exceeds the economy-wide average. As
these industries grow, they can disproportionately
increase metropolitan areas’ wealth and
opportunity.
For leaders of workforce development and higher
education institutions, these findings point to
industries where people can find better labor
market opportunities. Yet these leaders must
also consider the circuitous career pathways
many people, especially those without a four-year
college degree, follow to good jobs. Not only do
few upwardly mobile sub-baccalaureate workers
stay in the same occupation over a 10-year period,
but they also tend to switch industries as well.
By recognizing these non-linear pathways to
higher earnings, local leaders can develop more
effective policies and initiatives that help sub-
baccalaureate workers move more quickly toward
good jobs.
3. Metropolitan areas contain different concentrations of good and promising jobs
This analysis reveals considerable variation across
major metropolitan areas, not only in the total
share of jobs that qualify as good or promising,
but also in the distribution of those jobs by
workers’ educational attainment. As a result, each
metropolitan area manages to stand out on some
dimension of its labor market opportunity, or lack
of it.
Concentration of good and promising jobs by industry sector2017
Note: Agriculture and mining industries are excluded.
Source: Authors’ analysis of U.S. Census Bureau public-use microdata and EMSI estimates
FIGURE 4
Educatio
n (61)
0%
25%
50%
75%
100%
Tota
l
Utiliti
es (2
2)
Constru
ctio
n (47)
Logistics
(48-4
9)
Man
ufact
uring (3
1-33)
Wholes
ale
(42)
Gover
nmen
t (90)
Info
rmat
ion (5
1)
Real e
stat
e, et
c. (5
3)
Admin
istra
tive
(56)
Headquar
ters
(55)
Local s
ervic
es (8
1)
Retai
l (44-4
5)
Profe
ssio
nal (5
4)
Health
care
(62)
Arts/E
nterta
inm
ent (
71)
Finan
ce (5
2)
Hospita
lity
(72)
Sub-baccalaureate average
Promising sub-baccalaureate jobs Good sub-baccalaureate jobs Good and promising high-skill jobs Other jobs

OPPORTUNITY INDUSTRIES 17
FINDINGS REFERENCESDEFININGINTRODUCTION CONCLUSION
• The share of jobs that are good or promising
jobs held by sub-baccalaureate workers
varies considerably across the nation’s
largest metropolitan areas. Nationwide, 21
percent of jobs in large metro areas are good
or promising jobs held by sub-baccalaureate
workers. This share varies, however, from a
high of 35 percent of jobs in the Spokane,
Wash. metro area to a low of just 9 percent of
jobs in the Washington, D.C. metro area.
• The chances that a sub-baccalaureate
worker holds a good or promising job also
differs considerably across metro areas. The
number of good or promising jobs held by sub-
baccalaureate workers varies by place not only
because those places have different kinds of
occupations and industries, but also because
their workers have varying levels of education.
Overall, about one in three (34 percent) of
sub-baccalaureate workers in the 100 largest
metro areas holds a good or promising job. The
Spokane, Wash. metro area has enough good
and promising jobs for one out of every two
sub-baccalaureate workers there, while the
Washington, D.C. metro area has enough for
only one-in-five sub-baccalaureate workers.
• The share of jobs that are good or promising
jobs held by high-skill workers also varies
across metro areas. High-skill workers
have better chances of obtaining good and
promising jobs. Nationwide, 23 percent of jobs
are good or promising jobs held by high-skill
workers who have at least a four-year college
degree. Because high-skill workers represent
about 42 percent of all workers in large metro
areas, these labor markets provide enough
good and promising jobs for 70 percent of
all high-skill workers. High-skill good and
promising jobs represent 35 percent of all jobs
in San Jose, the largest share of the top 100
metro areas, where 75 percent of high-skill
workers hold a good or promising job. The
Stockton, Calif. metro area provides the lowest
share—13 percent—of good and promising jobs
for high-skill workers. But because a much
lower share of Stockton’s workers have four-
year degrees, it still provides enough good and
promising jobs for 71 percent of its high-skill
workers.
INDUSTRIES AND WAGE LEVELS ARE THE PRIMARY FACTORS BEHIND LOCAL LABOR MARKET OPPORTUNITY
Metropolitan areas that have a diverse base of
tradable industries, while maintaining overall
affordability, provide among the highest shares
of good and promising jobs. Metropolitan areas
that have only one or neither of these ingredients
tend to have less broad-based labor market
opportunity:
• The size and diversity of a metro area’s
sectors help determine the share of its jobs
that are good and promising—and who holds
these jobs. For example, the Youngstown,
Ohio and Jackson, Miss. metropolitan areas
offer among the highest shares of good
and promising jobs for sub-baccalaureate
workers. This is primarily because their
manufacturing and logistics sectors, which
tend to concentrate good and promising
jobs, employ especially large shares of these
workers. In these metro areas, the share of
jobs in opportunity industries, such as primary
metal manufacturing in Youngstown or freight
trucking in Jackson, is several times the
national large metro average. Similarly, the
San Jose and Washington metropolitan areas
concentrate opportunity industries that yield
good and promising jobs for high-skill workers,
such as professional services, corporate
headquarters, and government.
• Within sectors, variation in metro areas’
detailed industries lead to differences in the
quantity of good jobs. For example, across all
large metropolitan areas, 24 percent of jobs
in the manufacturing sector are good jobs
held by sub-baccalaureate workers. In Tucson,

18 BROOKINGS METROPOLITAN POLICY PROGRAM
FINDINGS REFERENCESDEFININGINTRODUCTION CONCLUSION
Ariz., 45 percent of manufacturing jobs are
in transportation equipment manufacturing,
which requires advanced skill sets. As a result,
30 percent of Tucson’s manufacturing jobs are
good jobs for sub-baccalaureate workers. By
contrast, 44 percent of manufacturing jobs in
Stockton, Calif. are in lower-skilled food and
beverage manufacturing, such that only 16
percent of that region’s manufacturing jobs are
good jobs for sub-baccalaureate workers.
• Even within industries, differing company
specializations and skills requirements
can translate into regional differences
in good jobs. For example, 70 percent of
the workers in Wichita’s transportation
equipment manufacturing industry, which is
focused mostly on aerospace manufacturing,
have some post-secondary education or
credential. However, only 51 percent of workers
in Memphis’s transportation equipment
manufacturing industry, which is focused
mostly on automotive parts, have some post-
secondary education.13 As a result, Wichita’s
transportation equipment manufacturing
industry workers are better compensated, and
67 percent of the jobs in this industry qualify
as good jobs, versus 46 percent in Memphis.
• Metro areas with higher typical earnings for
sub-baccalaureate workers tend to exhibit
smaller overall shares of good jobs for
those workers. For example, median earnings
for sub-baccalaureate workers in Jackson,
Miss. are $32,400, but in Houston they are
$38,900.14 As a result, only 19 percent of jobs
in Houston’s general freight trucking industry
qualify as good jobs for sub-baccalaureate
workers, versus 50 percent in Jackson. In
metro areas with higher sub-baccalaureate
earnings, part-time and seasonal jobs are less
likely to qualify as good jobs, even if they pay
high hourly wages.
• The share of a metro area’s jobs that are
promising depends on the same factors that
determine the share of good jobs as well
as the overall dynamism of the economy.
As noted above, the availability of good jobs
directly determines the share of jobs in a
metropolitan area that are promising. Though
industries in some sectors of the economy
provide internal career ladders that permit
workers to gain specific knowledge and
experience, most upwardly mobile workers
instead switch between occupations and
industries based on the availability of better
paying jobs in other parts of the local economy.
The share of jobs in a metropolitan area that
provide promising pathways to good jobs also
depends on the metropolitan area’s growth
rate and affordability, however. For example,
the combination of faster growth and lower
wage thresholds in many Sun Belt metro areas
creates more opportunities for incumbent
workers and their lower wage thresholds help
them reach good jobs faster.
No large U.S. metropolitan area provides
sufficient high-quality labor market opportunities
for all the people who need them, especially
workers without a bachelor’s degree. Even in
Spokane, with the highest share of good and
promising jobs for sub-baccalaureate workers,
only half of its sub-baccalaureate workers
hold one. Metro areas can begin to close these
gaps by addressing factors that influence local
labor market opportunity, such as industrial
composition, workforce characteristics, wage
levels, and growth dynamics.

OPPORTUNITY INDUSTRIES 19
FINDINGS REFERENCESDEFININGINTRODUCTION CONCLUSION
Share of jobs that qualify as good, promising, or otherBy metropolitan area
Source: Authors’ analysis of U.S. Census Bureau public-use microdata and EMSI estimates
FIGURE 5 (part I of II)
0% 10% 20% 30% 40% 50% 60% 70% 80% 90% 100%
Washington-Arlington-Alexandria, DC-VA-MD-WV
Baltimore-Columbia-Towson, MD
San Jose-Sunnyvale-Santa Clara, CA
San Francisco-Oakland-Hayward, CA
New York-Newark-Jersey City, NY-NJ-PA
Boston-Cambridge-Newton, MA-NH
Bridgeport-Stamford-Norwalk, CT
Philadelphia-Camden-Wilmington, PA-NJ-DE-MD
New Haven-Milford, CT
Hartford-West Hartford-East Hartford, CT
Denver-Aurora-Lakewood, CO
Oxnard-Thousand Oaks-Ventura, CA
Minneapolis-St. Paul-Bloomington, MN-WI
Chicago-Naperville-Elgin, IL-IN-WI
Richmond, VA
Houston-The Woodlands-Sugar Land, TX
Austin-Round Rock, TX
Dallas-Fort Worth-Arlington, TX
Durham-Chapel Hill, NC
Raleigh, NC
Seattle-Tacoma-Bellevue, WA
Worcester, MA-CT
Milwaukee-Waukesha-West Allis, WI
Atlanta-Sandy Springs-Roswell, GA
Des Moines-West Des Moines, IA
Madison, WI
Baton Rouge, LA
Albany-Schenectady-Troy, NY
Colorado Springs, CO
San Diego-Carlsbad, CA
Virginia Beach-Norfolk-Newport News, VA-NC
Detroit-Warren-Dearborn, MI
Phoenix-Mesa-Scottsdale, AZ
Allentown-Bethlehem-Easton, PA-NJ
Provo-Orem, UT
Las Vegas-Henderson-Paradise, NV
Kansas City, MO-KS
Sacramento-Roseville-Arden-Arcade, CA
New Orleans-Metairie, LA
San Antonio-New Braunfels, TX
Springfield, MA
St. Louis, MO-IL
Charlotte-Concord-Gastonia, NC-SC
Providence-Warwick, RI-MA
Los Angeles-Long Beach-Anaheim, CA
Birmingham-Hoover, AL=
Stockton-Lodi, CA
Nashville-Davidson-Murfreesboro-Franklin, TN
Pittsburgh, PA
Ogden-Clearfield, UT
Buffalo-Cheektowaga-Niagara Falls, NY
Cincinnati, OH-KY-IN
Harrisburg-Carlisle, PA
Memphis, TN-MS-AR
Jacksonville, FL
Charleston-North Charleston, SC
Omaha-Council Bluffs, NE-IA
Oklahoma City, OK
Cleveland-Elyria, OH
Portland-Vancouver-Hillsboro, OR-WA
Tulsa, OK
Urban Honolulu, HI
Columbus, OH
Tampa-St. Petersburg-Clearwater, FL
Syracuse, NY
Salt Lake City, UT
Louisville/Jefferson County, KY-IN
North Port-Sarasota-Bradenton, FL
Rochester, NY
Albuquerque, NM
Indianapolis-Carmel-Anderson, IN
Miami-Fort Lauderdale-West Palm Beach, FL
Augusta-Richmond County, GA-SC
Winston-Salem, NC
Tucson, AZ
Orlando-Kissimmee-Sanford, FL
Greenville-Anderson-Mauldin, SC
Grand Rapids-Wyoming, MI
Columbia, SC
Little Rock-North Little Rock-Conway, AR
Akron, OH
Palm Bay-Melbourne-Titusville, FL
Cape Coral-Fort Myers, FL
Toledo, OH
Wichita, KS
Greensboro-High Point, NC
Dayton, OH
Bakersfield, CA
Boise City, ID
Jackson, MS
Scranton-Wilkes-Barre-Hazleton, PA
McAllen-Edinburg-Mission, TX
Riverside-San Bernardino-Ontario, CA
Knoxville, TN
El Paso, TX
Youngstown-Warren-Boardman, OH-PA
Lakeland-Winter Haven, FL
Fresno, CA
Deltona-Daytona Beach-Ormond Beach, FL
Spokane-Spokane Valley, WA
Promising sub-baccalaureate jobs Good sub-baccalaureate jobs Good and promising high-skill jobs Other jobs

20 BROOKINGS METROPOLITAN POLICY PROGRAM
FINDINGS REFERENCESDEFININGINTRODUCTION CONCLUSION
0% 10% 20% 30% 40% 50% 60% 70% 80% 90% 100%
Washington-Arlington-Alexandria, DC-VA-MD-WV
Baltimore-Columbia-Towson, MD
San Jose-Sunnyvale-Santa Clara, CA
San Francisco-Oakland-Hayward, CA
New York-Newark-Jersey City, NY-NJ-PA
Boston-Cambridge-Newton, MA-NH
Bridgeport-Stamford-Norwalk, CT
Philadelphia-Camden-Wilmington, PA-NJ-DE-MD
New Haven-Milford, CT
Hartford-West Hartford-East Hartford, CT
Denver-Aurora-Lakewood, CO
Oxnard-Thousand Oaks-Ventura, CA
Minneapolis-St. Paul-Bloomington, MN-WI
Chicago-Naperville-Elgin, IL-IN-WI
Richmond, VA
Houston-The Woodlands-Sugar Land, TX
Austin-Round Rock, TX
Dallas-Fort Worth-Arlington, TX
Durham-Chapel Hill, NC
Raleigh, NC
Seattle-Tacoma-Bellevue, WA
Worcester, MA-CT
Milwaukee-Waukesha-West Allis, WI
Atlanta-Sandy Springs-Roswell, GA
Des Moines-West Des Moines, IA
Madison, WI
Baton Rouge, LA
Albany-Schenectady-Troy, NY
Colorado Springs, CO
San Diego-Carlsbad, CA
Virginia Beach-Norfolk-Newport News, VA-NC
Detroit-Warren-Dearborn, MI
Phoenix-Mesa-Scottsdale, AZ
Allentown-Bethlehem-Easton, PA-NJ
Provo-Orem, UT
Las Vegas-Henderson-Paradise, NV
Kansas City, MO-KS
Sacramento-Roseville-Arden-Arcade, CA
New Orleans-Metairie, LA
San Antonio-New Braunfels, TX
Springfield, MA
St. Louis, MO-IL
Charlotte-Concord-Gastonia, NC-SC
Providence-Warwick, RI-MA
Los Angeles-Long Beach-Anaheim, CA
Birmingham-Hoover, AL=
Stockton-Lodi, CA
Nashville-Davidson-Murfreesboro-Franklin, TN
Pittsburgh, PA
Ogden-Clearfield, UT
Buffalo-Cheektowaga-Niagara Falls, NY
Cincinnati, OH-KY-IN
Harrisburg-Carlisle, PA
Memphis, TN-MS-AR
Jacksonville, FL
Charleston-North Charleston, SC
Omaha-Council Bluffs, NE-IA
Oklahoma City, OK
Cleveland-Elyria, OH
Portland-Vancouver-Hillsboro, OR-WA
Tulsa, OK
Urban Honolulu, HI
Columbus, OH
Tampa-St. Petersburg-Clearwater, FL
Syracuse, NY
Salt Lake City, UT
Louisville/Jefferson County, KY-IN
North Port-Sarasota-Bradenton, FL
Rochester, NY
Albuquerque, NM
Indianapolis-Carmel-Anderson, IN
Miami-Fort Lauderdale-West Palm Beach, FL
Augusta-Richmond County, GA-SC
Winston-Salem, NC
Tucson, AZ
Orlando-Kissimmee-Sanford, FL
Greenville-Anderson-Mauldin, SC
Grand Rapids-Wyoming, MI
Columbia, SC
Little Rock-North Little Rock-Conway, AR
Akron, OH
Palm Bay-Melbourne-Titusville, FL
Cape Coral-Fort Myers, FL
Toledo, OH
Wichita, KS
Greensboro-High Point, NC
Dayton, OH
Bakersfield, CA
Boise City, ID
Jackson, MS
Scranton-Wilkes-Barre-Hazleton, PA
McAllen-Edinburg-Mission, TX
Riverside-San Bernardino-Ontario, CA
Knoxville, TN
El Paso, TX
Youngstown-Warren-Boardman, OH-PA
Lakeland-Winter Haven, FL
Fresno, CA
Deltona-Daytona Beach-Ormond Beach, FL
Spokane-Spokane Valley, WA
Promising sub-baccalaureate jobs Good sub-baccalaureate jobs Good and promising high-skill jobs Other jobs
Share of jobs that qualify as good, promising, or otherBy metropolitan area
FIGURE 5 (part II of II)
Source: Authors’ analysis of U.S. Census Bureau public-use microdata and EMSI estimates
0% 10% 20% 30% 40% 50% 60% 70% 80% 90% 100%
Washington-Arlington-Alexandria, DC-VA-MD-WV
Baltimore-Columbia-Towson, MD
San Jose-Sunnyvale-Santa Clara, CA
San Francisco-Oakland-Hayward, CA
New York-Newark-Jersey City, NY-NJ-PA
Boston-Cambridge-Newton, MA-NH
Bridgeport-Stamford-Norwalk, CT
Philadelphia-Camden-Wilmington, PA-NJ-DE-MD
New Haven-Milford, CT
Hartford-West Hartford-East Hartford, CT
Denver-Aurora-Lakewood, CO
Oxnard-Thousand Oaks-Ventura, CA
Minneapolis-St. Paul-Bloomington, MN-WI
Chicago-Naperville-Elgin, IL-IN-WI
Richmond, VA
Houston-The Woodlands-Sugar Land, TX
Austin-Round Rock, TX
Dallas-Fort Worth-Arlington, TX
Durham-Chapel Hill, NC
Raleigh, NC
Seattle-Tacoma-Bellevue, WA
Worcester, MA-CT
Milwaukee-Waukesha-West Allis, WI
Atlanta-Sandy Springs-Roswell, GA
Des Moines-West Des Moines, IA
Madison, WI
Baton Rouge, LA
Albany-Schenectady-Troy, NY
Colorado Springs, CO
San Diego-Carlsbad, CA
Virginia Beach-Norfolk-Newport News, VA-NC
Detroit-Warren-Dearborn, MI
Phoenix-Mesa-Scottsdale, AZ
Allentown-Bethlehem-Easton, PA-NJ
Provo-Orem, UT
Las Vegas-Henderson-Paradise, NV
Kansas City, MO-KS
Sacramento-Roseville-Arden-Arcade, CA
New Orleans-Metairie, LA
San Antonio-New Braunfels, TX
Springfield, MA
St. Louis, MO-IL
Charlotte-Concord-Gastonia, NC-SC
Providence-Warwick, RI-MA
Los Angeles-Long Beach-Anaheim, CA
Birmingham-Hoover, AL=
Stockton-Lodi, CA
Nashville-Davidson-Murfreesboro-Franklin, TN
Pittsburgh, PA
Ogden-Clearfield, UT
Buffalo-Cheektowaga-Niagara Falls, NY
Cincinnati, OH-KY-IN
Harrisburg-Carlisle, PA
Memphis, TN-MS-AR
Jacksonville, FL
Charleston-North Charleston, SC
Omaha-Council Bluffs, NE-IA
Oklahoma City, OK
Cleveland-Elyria, OH
Portland-Vancouver-Hillsboro, OR-WA
Tulsa, OK
Urban Honolulu, HI
Columbus, OH
Tampa-St. Petersburg-Clearwater, FL
Syracuse, NY
Salt Lake City, UT
Louisville/Jefferson County, KY-IN
North Port-Sarasota-Bradenton, FL
Rochester, NY
Albuquerque, NM
Indianapolis-Carmel-Anderson, IN
Miami-Fort Lauderdale-West Palm Beach, FL
Augusta-Richmond County, GA-SC
Winston-Salem, NC
Tucson, AZ
Orlando-Kissimmee-Sanford, FL
Greenville-Anderson-Mauldin, SC
Grand Rapids-Wyoming, MI
Columbia, SC
Little Rock-North Little Rock-Conway, AR
Akron, OH
Palm Bay-Melbourne-Titusville, FL
Cape Coral-Fort Myers, FL
Toledo, OH
Wichita, KS
Greensboro-High Point, NC
Dayton, OH
Bakersfield, CA
Boise City, ID
Jackson, MS
Scranton-Wilkes-Barre-Hazleton, PA
McAllen-Edinburg-Mission, TX
Riverside-San Bernardino-Ontario, CA
Knoxville, TN
El Paso, TX
Youngstown-Warren-Boardman, OH-PA
Lakeland-Winter Haven, FL
Fresno, CA
Deltona-Daytona Beach-Ormond Beach, FL
Spokane-Spokane Valley, WA
Promising sub-baccalaureate jobs Good sub-baccalaureate jobs Good and promising high-skill jobs Other jobs

FINDINGS REFERENCESDEFININGINTRODUCTION CONCLUSION
OPPORTUNITY INDUSTRIES 21
FINDINGS REFERENCES APPENDIXDEFININGINTRODUCTION CONCLUSION
This report reinforces the challenges facing leaders throughout metropolitan America in expanding labor market opportunity, especially for individuals without a four-year college degree. Yet it also points to potential solutions.
Nearly all metropolitan areas do not provide
enough good and promising jobs for sub-
baccalaureate workers. Furthermore, those jobs
are highly concentrated in industries such as
construction and manufacturing that have grown
slowly in recent years and not likely to account for
much greater proportions of future jobs. In fact,
as technological change continues to reshape
work, some good jobs in these industries and
others, including logistics, may disappear.
Yet the report also finds reasons for optimism.
For one, some fast-growing industries and
occupations typically associated with higher-
skill work, such as computer, engineering, and
information technology jobs, in fact contain many
good jobs for sub-baccalaureate workers.
More importantly, this report finds considerable
dynamism in local labor markets. Many people
CONCLUSION
switch occupations and industries from one
year to the next. This dynamism is crucial to
communities’ adjustment to a changing economy.
In a series of recent studies on automation,
McKinsey Global Institute found that as many
as one in four U.S. workers will need to switch
occupations by 2030 as their current one
disappears.15 As it turns out, many more workers
will switch occupations naturally as they seek
better opportunities.
The challenge for leaders in metropolitan America
is harnessing this dynamism in ways that enable
workers’ mobility to better jobs and the middle
class. Although there is no doubt arming people
with the knowledge and skills required by the jobs
of the future is essential, most people cannot
find opportunity where none exists. Metropolitan
economies must provide the good jobs people
need to move ahead.
« Back to top

22 BROOKINGS METROPOLITAN POLICY PROGRAM
FINDINGS REFERENCESDEFININGINTRODUCTION CONCLUSION
To that end, leaders should seek to grow more
good jobs in opportunity industries, improve job
quality in industries where it is low, and prepare
people for a more dynamic economy. These
strategies implicate a number of systems and
institutions in metropolitan areas.
• First, economic developers can prioritize
opportunity industries that concentrate
good jobs. Too often, scarce public resources
are spent on incentivizing on job growth or
retention in industries that provide too little
opportunity. Though job growth is important,
economic development is more effective when
the job growth it spurs increases the share
of good jobs in the local economy. Such jobs
not only broaden access to opportunity, but
industries that concentrate good jobs also tend
to have a greater economic impact. Economic
development can also involve more than
incentives. Existing institutions and customized
services can create shared knowledge and
resources that can enhance the growth and
competitiveness of local firms, especially the
more footloose firms in tradable industries
that disproportionately contain good jobs.16
• Second, leaders in the private and public
sectors can work together to improve
job quality. In most metropolitan areas, job
growth alone is unlikely to close the gap
between the number of good jobs and the
number of people who need them. Improving
the quality of the existing job base is not
only essential for workers but can also help
employers. A growing body of research shows
that improving job quality—by treating labor
as an asset rather than a cost—is good for
the bottom line in some sectors that provide
many “other” jobs, including retail, hospitality,
health care, and education.17 Improving job
quality doesn’t just mean increasing wages and
benefits. Improving the visibility of pathways
from low-quality jobs to better ones can also
increase opportunity.
• Third, education and workforce development
institutions can prepare people for and
connect them to today’s more demanding
and dynamic labor market. The content
of work changes rapidly today, even within
occupations. New technologies constantly
emerge, requiring continuous training and
adaption. Meanwhile, workers may need to
switch careers more often to stay ahead of
change or access opportunity. These dynamics
stress the growing importance of abstract
cognitive abilities that enable people to think
and learn by themselves. Specific knowledge
and skills remain essential to getting a job, but
keeping that job or finding a better one may
require workers and institutions to adopt new
modes of learning and teaching to succeed in
today’s labor market.
These efforts to expand labor market opportunity,
while not a panacea, can help more of today’s
working families thrive and invest in their own
future and that of their community. Ultimately,
creating an economy that provides greater
opportunity for more people and families
requires leaders across multiple systems to
share an understanding of the challenges and
pursue a coordinated strategy to address them.
By assessing the effects of shifting local labor
market demand on the local workforce, this report
and its accompanying web-based interactive tool
provide new information to help inform such
efforts, charting the industries and occupations
that may provide the best chances for individuals
in each metro area to obtain a good middle-class
job.

OPPORTUNITY INDUSTRIES 23
FINDINGS REFERENCESDEFININGINTRODUCTION CONCLUSION
Bartik, Timothy J. “Who Benefits from Economic
Development Incentives? How Incentive Effects
on Local Incomes and the Income Distribution
Vary with Different Assumptions about Incentive
Policy and the Local Economy.” Upjohn Institute
Technical Report No. 18-034. Kalamazoo, MI: W.E.
Upjohn Institute for Employment Research, 2018.
Delgado, Mercedes, Michael Porter, and Scott
Stern. “Defining Clusters of Related Industries.”
National Bureau of Economic Research Working
Paper No. 20375. 2014.
Manyika, James, Michael Chui, Mehdi Miremadi,
Jacques Bughin, Katy George, Paul Willmott, and
Martin Dewhurst. “Harnessing automation for a
future that works.” McKinsey and Company, 2017.
REFERENCES
Manyika, James, Susan Lund, Michael Chui,
Jacques Bughin, Jonathan Woetzel, Parul Batra,
Ryan Ko, and Saurabh Sanghavi. “Jobs Lost,
Jobs Gained: Workforce Transitions in a Time of
Automation.” McKinsey and Company, 2017.
Shearer, Chad, Amy Liu, Natalie Holmes, and John
Ng. “Opportunity Clusters: Identifying pathways
to good jobs in metro New Orleans.” Brookings.
2015.
« Back to top

24 BROOKINGS METROPOLITAN POLICY PROGRAM
FINDINGS REFERENCESDEFININGINTRODUCTION CONCLUSION
1. Chad Shearer and others, “Metro Monitor
2018,” Brookings, 2018.
2. Timothy J. Bartik, “What Proportion of
Children Stay in the Same Location as Adults,
and How Does This Vary Across Location and
Groups?” Upjohn Institute for Employment
Research, 2009. https://research.upjohn.org/
up_workingpapers/145/.
3. Wage and salary jobs represent over 90
percent of employment nationwide and at
least 85 percent of employment in every large
metropolitan area. These shares have remained
stable in recent years. Not only are wage and
salary jobs the most dominant and enduring form
of employment, but they also tend to provide
more stable employment and income compared to
contract and contingent work.
4. Median earnings thresholds for each
metropolitan area were determined from
2012–2016 1-year American Community Survey
(ACS) microdata collected from the Minnesota
Population Center’s Integrated Public-Use
Microdata Series (IPUMS). Dollar-denominated
fields were deflated prior to analysis.
5. In many metropolitan areas, this earnings
threshold is roughly equivalent to the income a
typical working-age adult would need to meet
their family’s basic needs according to detailed
county-based cost-of-living estimates.
6. Authors’ analysis of 2012–2016 1-year ACS
microdata collected from IPUMS.
7. These anticipated trends take into account
recent regional growth patterns, macroeconomic
projections, and modest estimates of labor
automation. A description of the underlying
data and methods of analysis is available in the
technical appendix.
8. U.S. Bureau of Labor Statistics, “2010
Standard Occupational Classification System,”
2010. See: https://www.bls.gov/soc/
9. U.S. Office of Management and Budget, “2012
North American Industry Classification System,”
2012. See: https://www.census.gov/eos/www/
naics/
10. This analysis includes workers aged 18 to 57
years who have at least 12 years of education.
Data on the number, share, and likelihood of
holding jobs of different quality come from the
authors’ analysis of 2012-2016 ACS 1-year data
collected from IPUMS.
11. For tradable industry definitions, see:
Delgado, Mercedes, Michael Porter, and Scott
Stern. “Defining Clusters of Related Industries.”
National Bureau of Economic Research Working
Paper No. 20375. 2014.
12. Emsi estimates.
13. Authors’ analysis of pooled 2012-2016
American Community Survey 1-year microdata.
14. Ibid.
15. James Manyika and others, “Jobs Lost,
Jobs Gained: Workforce Transitions in a Time of
Automation,” McKinsey Global Institute, 2017.
16. Timothy J. Bartik, “Who Benefits from
Economic Development Incentives? How Incentive
Effects on Local Incomes and the Income
Distribution Vary with Different Assumptions
about Incentive Policy and the Local Economy.”
Upjohn Institute Technical Report No. 18-
034. Kalamazoo, MI: W.E. Upjohn Institute for
Employment Research, 2018.
ENDNOTES

OPPORTUNITY INDUSTRIES 25
FINDINGS REFERENCESDEFININGINTRODUCTION CONCLUSION
17. François Carré and Chris Tilly, “Where Bad
Jobs are Better: Retail Jobs Across Countries
and Companies” (Russell Sage Foundation, 2017);
Zeynep Ton, “The Good Jobs Strategy: How
the Smartest Companies Invest in Employees
to Lower Costs and Boost Profits” (Houghton
Mifflin Harcourt, 2014); Nancy Martin, “Advancing
the Anchor Mission of Healthcare,” Healthcare
Anchor Network (coordinated by The Democracy
Collaborative), 2017; Rush University Medical
Center, “Anchor Mission Playbook,” The
Democracy Collaborative, 2017.
26 BROOKINGS METROPOLITAN POLICY PROGRAM
FINDINGS REFERENCESDEFININGINTRODUCTION CONCLUSION
The Brookings Institution is a nonprofit organization devoted to independent research and policy solutions. Its mission is to conduct high-quality independent research and, based on that research, to provide innovative practical recommendations for policymakers and the public. The conclusions and recommendations of any Brookings publication are solely those of its author(s), and do not reflect the views of the Institution, its management, or its other scholars.
The Metropolitan Policy Program at Brookings would like to thank both the Surdna Foundation and State Farm for their generous support of this analysis, and the Metropolitan Council, a network of business, civic, and philanthropic leaders that provides both financial and intellectual support for the Program.
Brookings is committed to quality, independence, and impact in all of its work. Activities supported by its donors reflect this commitment.
This research would not have been possible without input and advice from researchers and practitioners throughout the country.
The authors are grateful to Amy Liu and Alan Berube for their incredible patience and invaluable guidance. The authors are also indebted to Natalie Holmes and John Ng, who were coauthors of an earlier Brookings report on Metro New Orleans for which many of the methods that undergird this analysis were first developed. Special thanks go to Marek Gootman, Mark Muro, Elizabeth Patterson, and Carolyn Gatz for their contributions to accompanying case studies that informed the presentation of findings in this report. The authors acknowledge the excellent research assistance of Elena Casanovas, Kyle Finnegan, Jonathan Guy, Kanny Morgan, and Samuel Peterson.
Early applications and presentations of this research in Metro New Orleans, Central Indiana, California’s Inland Empire, Northeast Ohio, Greater Phoenix, and Metro Atlanta helped sharpen the assumptions, methods, and presentation of this analysis. The authors are grateful for the valuable thought partnership of leaders in these communities, including Allison Plyer of the Data Center in metro New Orleans; David Johnson, Betsy McCaw, Jason Kloth, Elizabeth Lerch, Nathan Ringham, and their colleagues at the Central Indiana Corporate Partnership; Karthick Ramakrishnan, Lou Monville, and Ron Loveridge of the Inland Empire’s IEGO initiative; Brad Whitehead, Peter Truog, and Bethia Burke of the Fund for our Economic Future in Northeast Ohio; the staff of the Greater Phoenix Economic Council; and the staff of the Metro Atlanta Chamber of Commerce.
The work of the Brookings Metro communications team was invaluable in producing the report and toward its outreach. Thanks to Julia Kraeger, David Lanham, Alec Friedhoff, Rachel Barker, Anthony Fiano, Carly P. Anderson for their assistance with various aspects of the production of this report. Special thanks go to Alec Friedhoff for interactive data visualization production and to Luisa Zottis for report layout and design.
Finally, the authors thank Andy Bailor, Thomas Joyce, Theron Kelso, and Joe Kestell of Brookings Information Technology Services department for their expert help with the custom computing solutions that made it possible to complete this work.
IMAGE CREDITS
All photos via Shutterstock.
ACKNOWLEDGEMENTS

OPPORTUNITY INDUSTRIES 27
FINDINGS REFERENCESDEFININGINTRODUCTION CONCLUSION
ABOUT THE METROPOLITAN POLICY PROGRAM AT BROOKINGS
The Metropolitan Policy Program at Brookings delivers research and solutions to help metropolitan leaders build an advanced economy that works for all.
To learn more, visit brookings.edu/metro.
FOR MORE INFORMATION
Chad Shearer
Senior Research Associate and Senior Project Manager
Metropolitan Policy Program at Brookings

28 BROOKINGS METROPOLITAN POLICY PROGRAM
FINDINGS REFERENCESDEFININGINTRODUCTION CONCLUSION
BROOKINGS METROPOLITAN POLICY PROGRAM28
1775 Massachusetts Avenue, NW
Washington, D.C. 20036-2188
telephone 202.797.6139
fax 202.797.2965
www.brookings.edu/metro