Opportunities to Create Value Across the Value Chain · Opportunities to Create Value Across the...
36
Tamal Ghosh PhD PepsiCo Advanced Research – Beverage Packaging Hawthorne, NY, USA [email protected] © PepsiCo 2013 Opportunities to Create Value Across the “Sustainable Packaging” Value Chain
Transcript of Opportunities to Create Value Across the Value Chain · Opportunities to Create Value Across the...

Tamal Ghosh PhD
PepsiCo Advanced Research – Beverage PackagingHawthorne, NY, [email protected]
© PepsiCo 2013
Opportunities to Create Value Across the “Sustainable Packaging” Value Chain

2
Who We Are
Global Beverages
Global Snacks
Global Nutrition
Brands
22billion-dollar
brands
Performance
More than $66 billion
revenue
Scale
>200 countries
& territories
People
~300,000employees
PepsiCo is a global food and beverage powerhouse. Our broad range of more than 3,000 delicious products offers consumers
convenient, nutritious and affordable options in nearly every country around the world.
© PepsiCo 2013
3
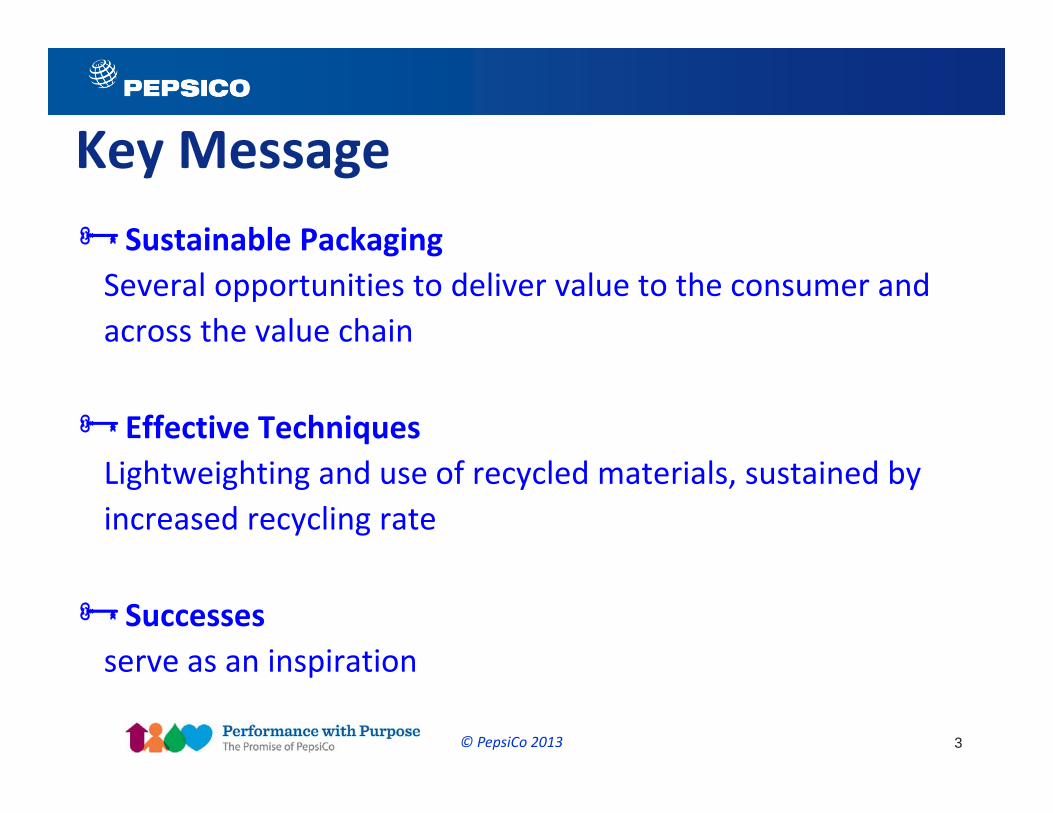
Key Message
© PepsiCo 2013
Sustainable PackagingSeveral opportunities to deliver value to the consumer and across the value chain
Effective TechniquesLightweighting and use of recycled materials, sustained by increased recycling rate
Successesserve as an inspiration

Document Title Goes Here 4Document Title Goes Here 4
The Value of Packaging
© PepsiCo 2013
Document Title Goes Here 5
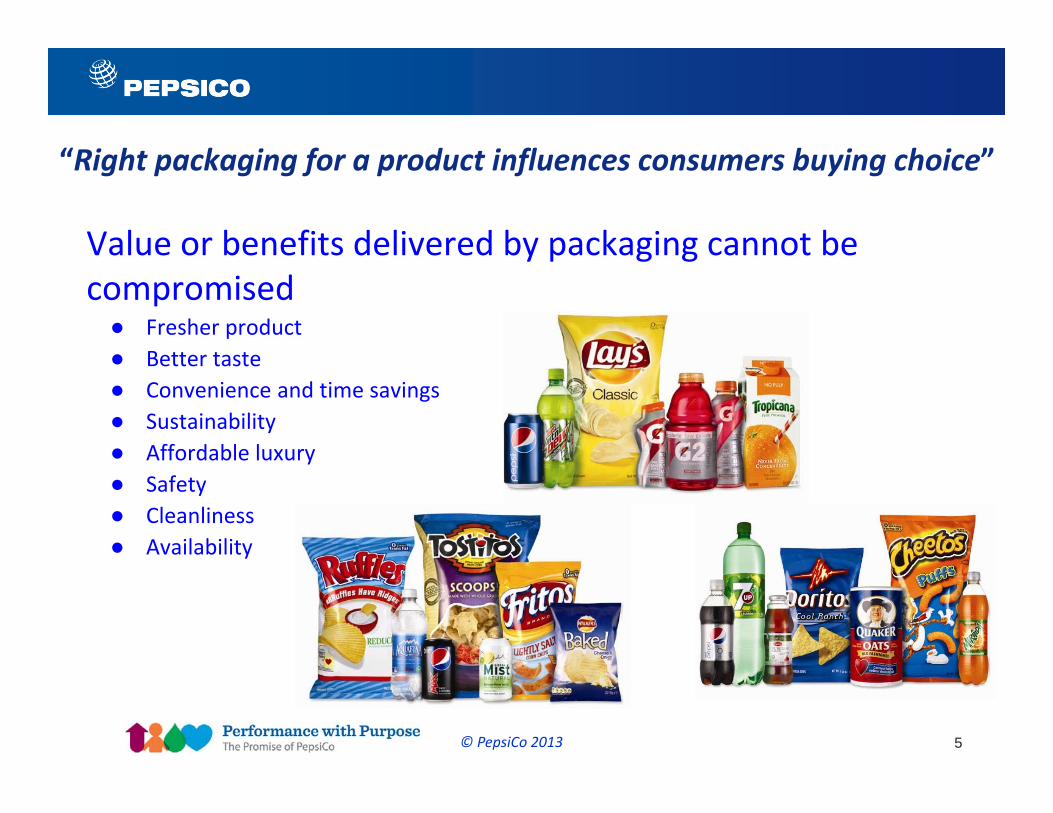
“Right packaging for a product influences consumers buying choice”
© PepsiCo 2013
Value or benefits delivered by packaging cannot be compromised● Fresher product● Better taste● Convenience and time savings● Sustainability● Affordable luxury● Safety● Cleanliness● Availability
Document Title Goes Here 6
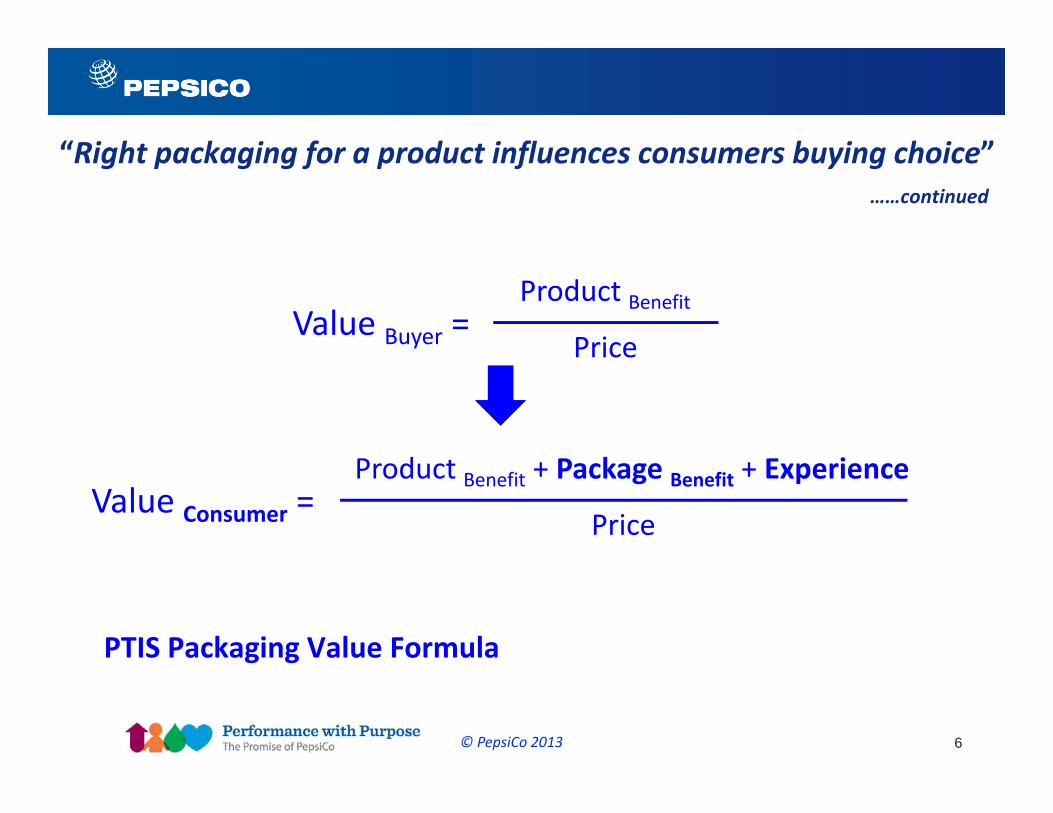
“Right packaging for a product influences consumers buying choice”……continued
© PepsiCo 2013
PTIS Packaging Value Formula
Value Buyer =Product Benefit
Price
Value Consumer =Product Benefit + Package Benefit + Experience
Price
Document Title Goes Here 7Document Title Goes Here 7
Sustainable Packaging
© PepsiCo 2013

Document Title Goes Here 8
Sustainable Packaging: Working Definition
● Is beneficial, safe & healthy for individuals and communities throughout its life cycle
● Meets market criteria for both performance and cost● Is sourced, manufactured, transported, and recycled using renewable energy
● Optimizes the use of renewable or recycled source materials● Is manufactured using clean production technologies and best practices● Is made from materials healthy throughout the life cycle● Is physically designed to optimize materials and energy● Is effectively recovered and utilized in biological and/or industrial closed loop cycles
© PepsiCo 2013
http://www.sustainablepackaging.org/
9
You can’t tame what you can’t measure!
© PepsiCo 2013

10
Attempts to "Quantify" Sustainable Packaging
Life Cycle Assessment (LCA)● Accepted technique to assess environmental impacts associated with all
stages of a product's life from cradle to grave
● International standards ISO e.g., 14040, ISO 14044 and PAS 2050
© PepsiCo 2013

11
Attempts to "Quantify" Sustainable Packaging……continued
Environmental impact categories most relevant to beverage packaging
© PepsiCo 2013
Total Energy Consumption[MJ]
Solid Waste [kg] GHG Emissions (Carbon Footprint) [kg CO2e]
Water Consumption [m3]
● Choice of a relevant basis is critical, e.g., for beverage packaging:
o Cradle‐to‐Material (or Gate): kilograms material
o Cradle‐to‐Grave: 1000 liters beverage delivered

Document Title Goes Here 12Document Title Goes Here 12
Opportunities for Creating Value
© PepsiCo 2013
Document Title Goes Here 13
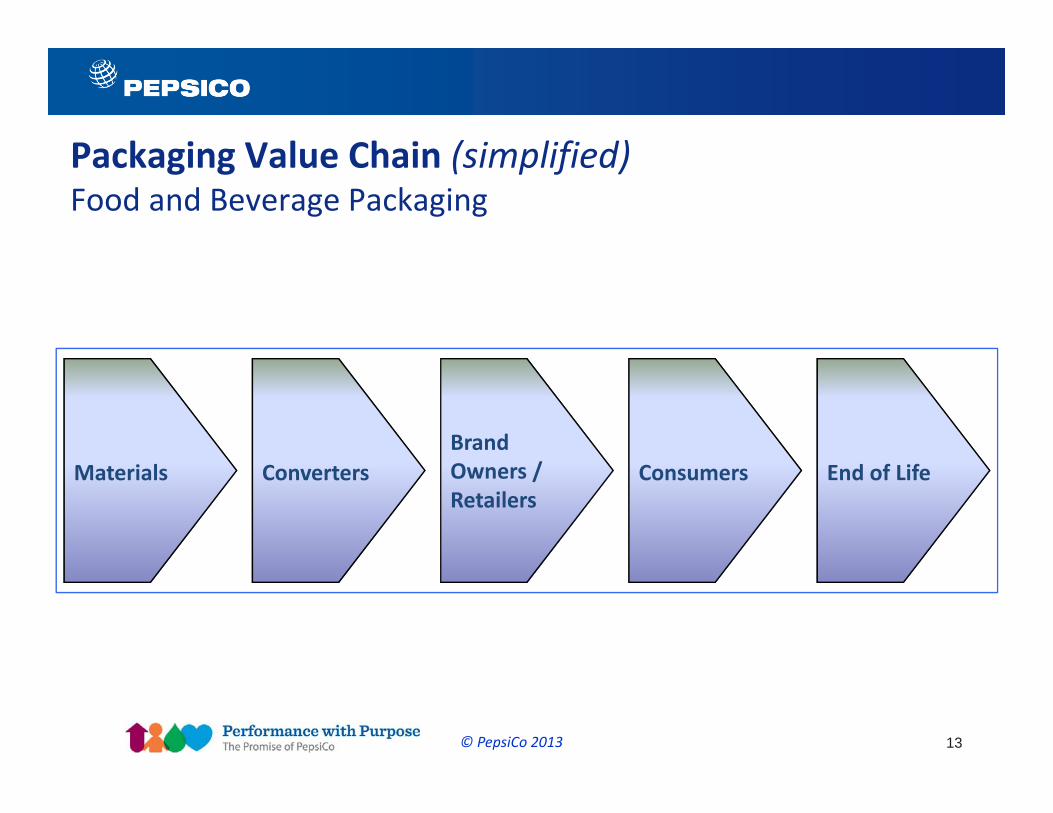
Packaging Value Chain (simplified)Food and Beverage Packaging
© PepsiCo 2013
Materials ConvertersBrandOwners /Retailers
Consumers End of Life
14
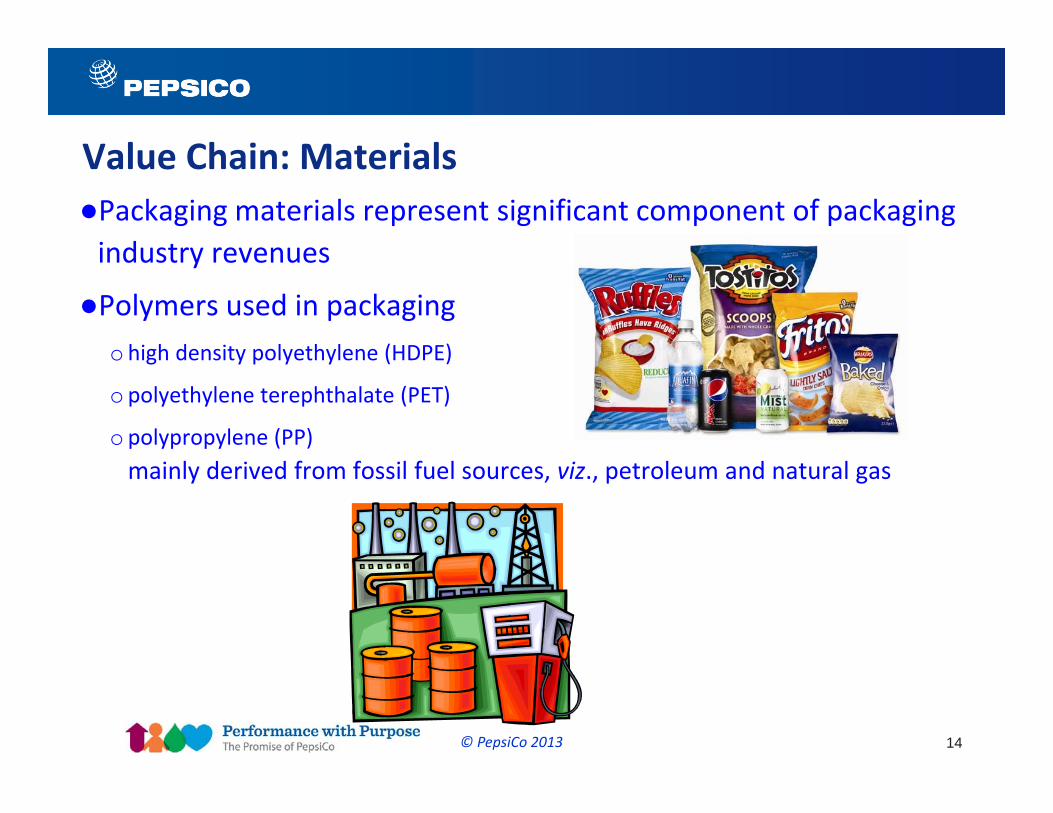
Value Chain: Materials●Packaging materials represent significant component of packaging industry revenues
●Polymers used in packagingo high density polyethylene (HDPE)
o polyethylene terephthalate (PET)
o polypropylene (PP)mainly derived from fossil fuel sources, viz., petroleum and natural gas
© PepsiCo 2013

15
Value Chain: Materials……continued
Recent developments in synthesis of polymers from biomass● Poly Lactic Acid (PLA)● Poly Ethylene (PE) and Poly Propylene (PP)● Purified Terephthalic Acid (PTA) + Mono Ethylene Glycol (MEG) → Poly Ethylene Terephthalate (PET)
● Furan 2,5 dicarboxylic acid (FDCA) + MEG → Poly Ethylene Furanate (PEF)
© PepsiCo 2013

16
Value Chain: Materials……continued●Value Proposition
oPLA: primarily from corn; lower carbon footprint; many end‐of‐life options including compostability
oPoly Butylene Succinate (PBS): less expensive than petroleum‐based counterpart
oPEF: superior CO2, O2, H2O vapor barrier versusPET (higher shelf life)
●Post Consumer Recycled (PCR) polymer presents potential for additional cost savings and lower environmental impact
© PepsiCo 2013
17
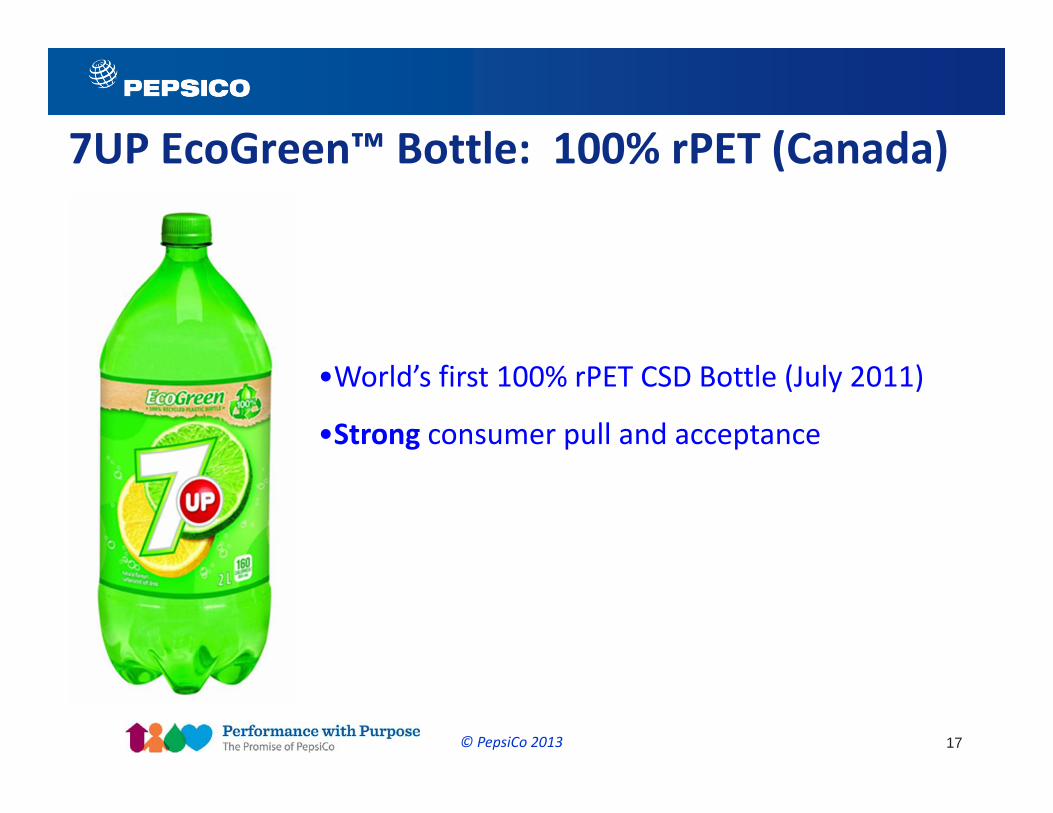
•World’s first 100% rPET CSD Bottle (July 2011)
•Strong consumer pull and acceptance
7UP EcoGreen™ Bottle: 100% rPET (Canada)
© PepsiCo 2013

18
0
50
100
100% vPET 100% rPET
Greenhouse Gas Emission [kg CO2e / 1000 lit beverage]
‐27%
0
1000
2000
100% vPET 100% rPET
Total Energy Demand [MJ / 1000 lit beverage]
‐47%
Life Cycle Results: 7UP 2 liter EcoGreen™ Bottle45.1 g bottle, no caps or labels (cut‐off method)
0
5
10
15
100% vPET 100% rPET
Solid Waste [kg / 1000 lit beverage]
‐4%
0
300
600
100% vPET 100% rPET
Water Consumption [liters / 1000 lit beverage]
‐7%
© PepsiCo 2013

Document Title Goes Here 19
Value Chain: ConvertingOpportunities to deliver value at the converting process step● Energy reduction ● For rigid packaging, through optimum mold design
© PepsiCo 2013
Document Title Goes Here 20
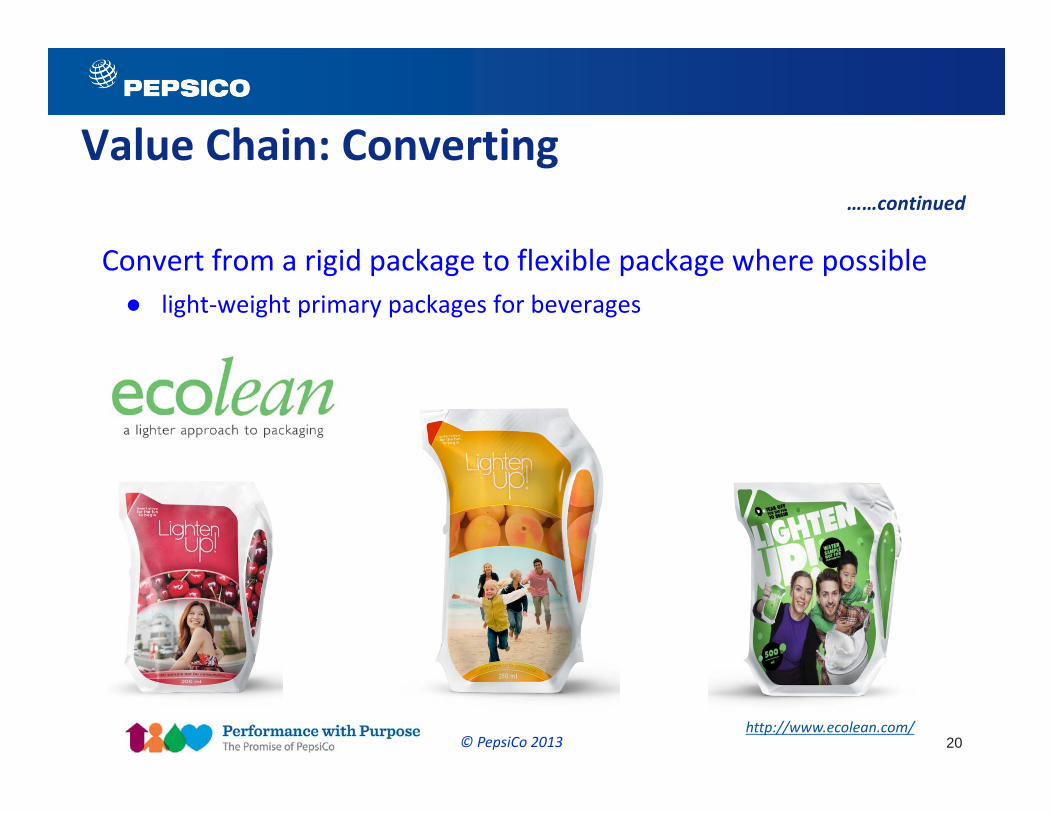
Value Chain: Converting……continued
Convert from a rigid package to flexible package where possible● light‐weight primary packages for beverages
© PepsiCo 2013http://www.ecolean.com/

Document Title Goes Here 21
Value Chain: Converting……continued
Light weighting or material reduction presents a powerful case for sustainable packaging and value creation
● less material → lower cost, lower waste● optimum package
© PepsiCo 2013

Document Title Goes Here 22
0
10
20
30
40
50
60
70
80
90
Virgin RawMaterial
RecycledContentRaw
Material
ContainerConverting
Converterto FillerTransport
Filler toRetail
Transport
Cap LifeCycle
Label LifeCycle
SecondaryPackagingLife Cycle
End‐of‐lifekg CO
2e / 1,000
liters beverage de
livered
16.8 g
10.9 g
Bottle Weight [g]
GHG emissions[kg CO2e / 1000 liters]
Aquafina 16.8 195
Ecofina 10.9 142
‐35% ‐27%
Life Cycle GHG emissions by Stage: Aquafina® Bottles16.9 oz. PET Bottle Lightweighting (cut‐off method)
© PepsiCo 2013

Document Title Goes Here 23
Value Chain: Brand Owners and Retailers
●Brand owners / Consumer Packaged Goods (CPG) companies most influential stakeholders in the value chain
●Because of primary interface with consumers, success of package is intimately connected to success of product
© PepsiCo 2013
Document Title Goes Here 24
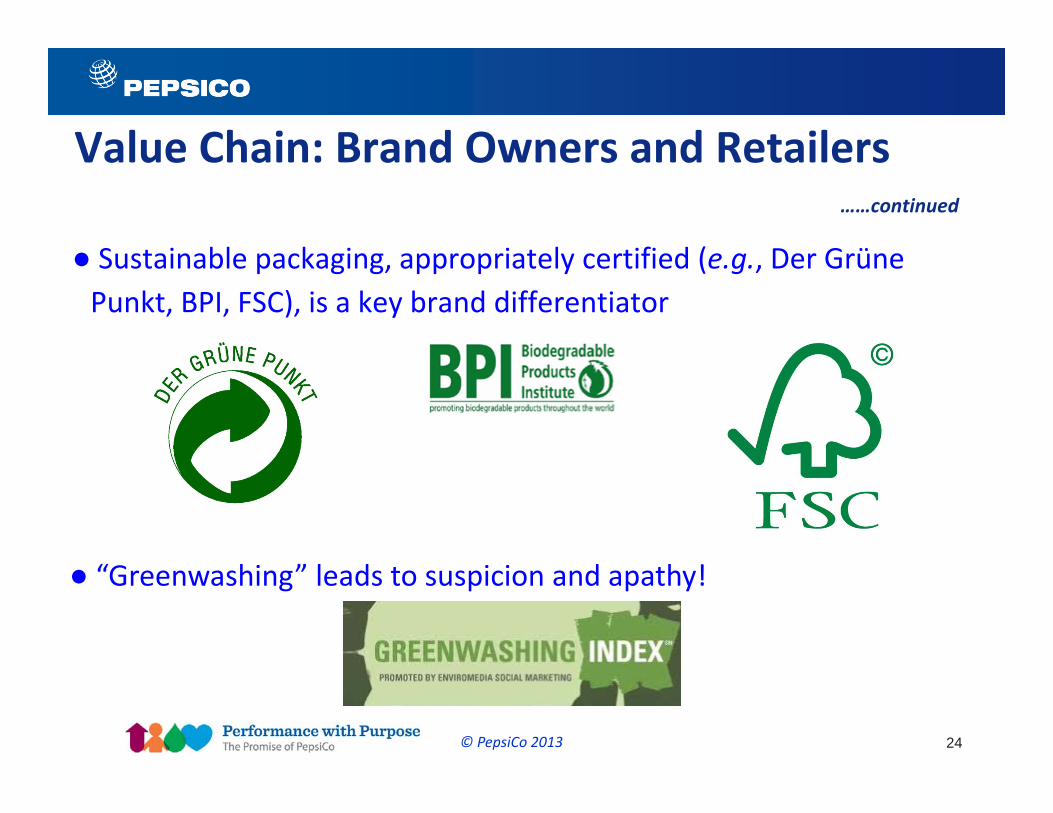
● Sustainable packaging, appropriately certified (e.g., Der GrünePunkt, BPI, FSC), is a key brand differentiator
© PepsiCo 2013
Value Chain: Brand Owners and Retailers ……continued
● “Greenwashing” leads to suspicion and apathy!

Document Title Goes Here 25© PepsiCo 2013
Value Chain: Brand Owners and Retailers ……continued
Dow Jones Sustainability Index (DJSI) and NGOs such as Carbon Disclosure Project (CDP) contribute to virtual policing of brand owners’ claims

Document Title Goes Here 26
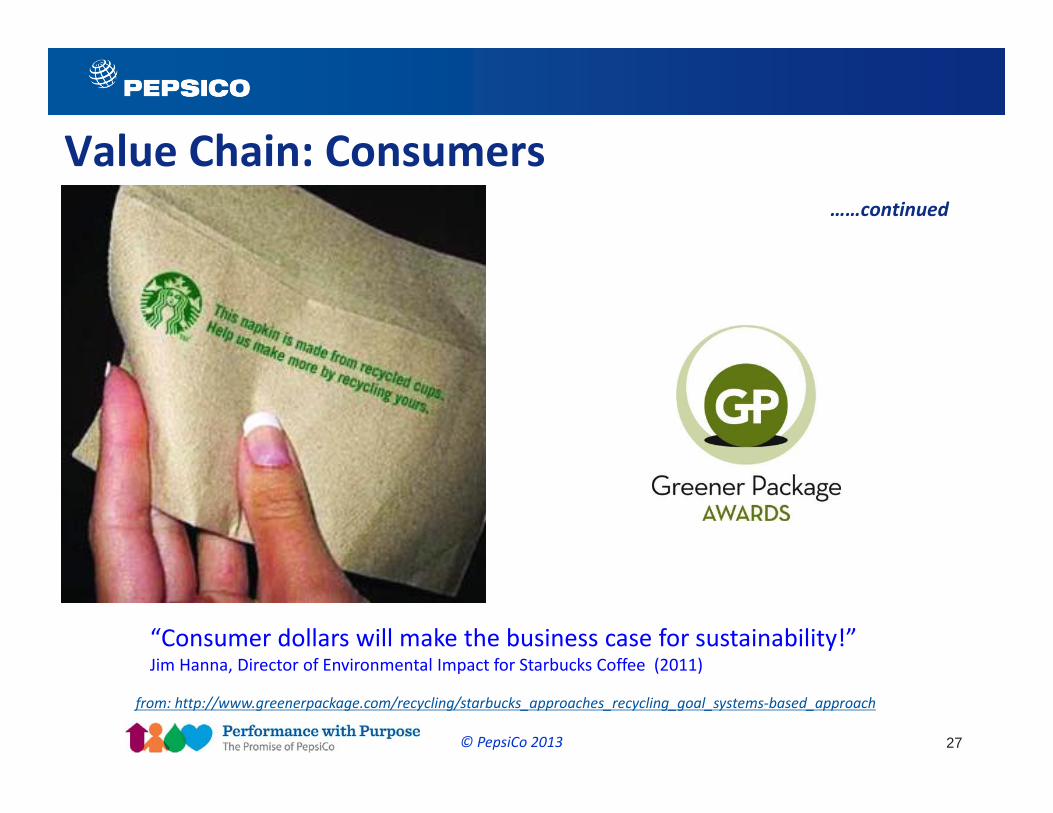
Value Chain: Consumers
● Most “visible” stakeholder in the value chain● Significant and growing segment of customers: LOHAS (Lifestyle of
Healthy and Sustainability) market, have been influencing packaging choices at the brand owner / retailer
© PepsiCo 2013
Document Title Goes Here 27
Value Chain: Consumers……continued
© PepsiCo 2013
“Consumer dollars will make the business case for sustainability!”Jim Hanna, Director of Environmental Impact for Starbucks Coffee (2011)
from: http://www.greenerpackage.com/recycling/starbucks_approaches_recycling_goal_systems‐based_approach

Document Title Goes Here 28
Value Chain: Consumers……continued
© PepsiCo 2013
from: http://www.ipsos‐na.com/news‐polls/pressrelease.aspx?id=5996
Document Title Goes Here 29
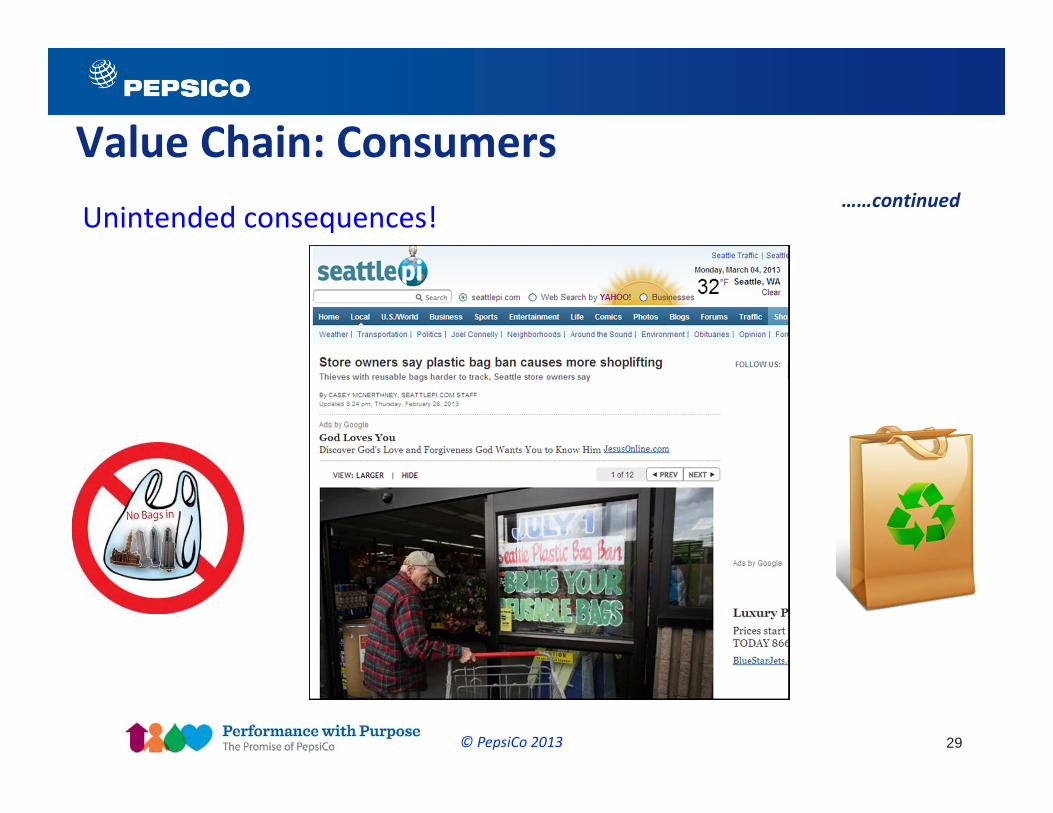
Value Chain: Consumers……continued
Unintended consequences!
© PepsiCo 2013

Document Title Goes Here 30
Value Chain: End‐of‐Life
© PepsiCo 2013
Recycle / Reuse
most preferred
Litter
least preferred
Landfill BioDegradation
Waste‐to‐
Energy

Document Title Goes Here 31© PepsiCo 2013
from: http://www.asyousow.org/sustainability/eprreport.shtml

Document Title Goes Here 32
Cradle‐to‐MaterialConventional fossil‐based PTA+MEG PET
100% rPET
Greenhouse Gas Emission [kg CO2e / 1000 kg PET]
100.0% 52.8%
Non‐Renewable Energy Demand [GJ / 1000 kg PET] 100.0% 28.6%
Solid Waste [kg / 1000 kg PET] 100.0% 83.7%
Water Consumption [m3 / 1000 kg PET] 100.0% 80.2%
Eutrophication [kg N e / 1000 kg PET] 100.0% 88.6%
Smog Formation [kg NOx e / 1000 kg PET]
100.0% 79.1%
Acidification [H+ moles e / 1000 kg PET] 100.0% 67.7%
Ozone Depletion [kg CFC‐11 e / 1000 kg PET] 100.0% 10.3%
Environmental Impact: virgin versus recycled PETlower across the board!
© PepsiCo 2013

Document Title Goes Here 33Document Title Goes Here 33
Concluding Remarks
© PepsiCo 2013
Document Title Goes Here 34
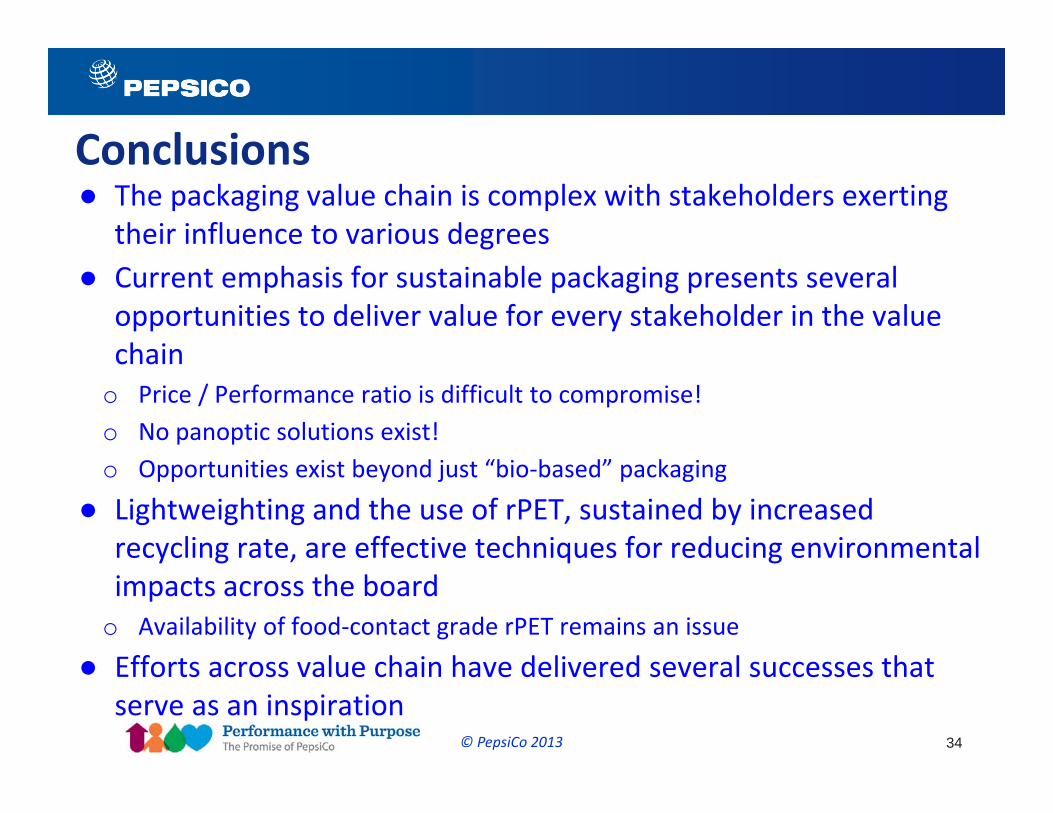
Conclusions● The packaging value chain is complex with stakeholders exerting
their influence to various degrees● Current emphasis for sustainable packaging presents several
opportunities to deliver value for every stakeholder in the value chaino Price / Performance ratio is difficult to compromise!o No panoptic solutions exist!o Opportunities exist beyond just “bio‐based” packaging
● Lightweighting and the use of rPET, sustained by increased recycling rate, are effective techniques for reducing environmental impacts across the boardo Availability of food‐contact grade rPET remains an issue
● Efforts across value chain have delivered several successes that serve as an inspiration
© PepsiCo 2013
Document Title Goes Here 35
Acknowledgements
Ed Socci, PhD
© PepsiCo 2013

Document Title Goes Here 3636
Thank you!© PepsiCo 2013