OPPORTUNITIES FOR INTEREST GENERATING INVESTMENTS …
56
Legend Financial Advisors, Inc. ® 5700 Corporate Drive, Suite 350, Pittsburgh, PA 15237-5829 Phone: (412) 635-9210 E-mail: [email protected] www.legend-financial.com OPPORTUNITIES FOR INTEREST GENERATING INVESTMENTS OVER THE NEXT THREE YEARS Presented By Louis P. Stanasolovich, CFP ® , CEO and President Legend Financial Advisors, Inc. ®
Transcript of OPPORTUNITIES FOR INTEREST GENERATING INVESTMENTS …

Legend Financial Advisors, Inc.® 5700 Corporate Drive, Suite 350, Pittsburgh, PA 15237-5829
Phone: (412) 635-9210 E-mail: [email protected] www.legend-financial.com
OPPORTUNITIES FOR INTEREST
GENERATING INVESTMENTS OVER THE
NEXT THREE YEARS
Presented By
Louis P. Stanasolovich, CFP®, CEO and President
Legend Financial Advisors, Inc.®

LOU STANASOLOVICH, CFP®,
CEO & PRESIDENT
Lou is founder, CCO, CEO and President of Legend Financial Advisors, Inc.®
and EmergingWealth Investment Management, Inc. ®
Legend’s founder, Lou was selected by Financial Planning magazine as part of
their inaugural Influencer Awards for the Wealth Creator Award recognizing the
advisor who has made the most significant contributions to best practices for
portfolio management.
He is one of only four advisors nationwide to be selected 12 consecutive
times by Worth magazine as one of “The Top 100 Wealth Advisors”
in the country.
Lou has also been selected 13 times by Medical Economics magazine as one of
“The 150 Best Financial Advisors for Doctors in America”
Lou has been selected five times by Dental Products Report as one of “The Best Financial Advisors for Dentists in
America.”
He has twice been named one of “The 100 Great Financial Planners in America” by Mutual Funds magazine.
Lou has been named three times to Investment Advisor magazine’s “IA 25” list, ranking the 25 most influential people in
and around the financial advisory profession.
Lou was profiled in Financial Planning magazine as one of the country’s “Movers & Shakers” recognizing the top
individuals who have done the most to advance the financial advisory profession.
Lou has also been selected three times by Pittsburgh Magazine as one of the Pittsburgh area’s FIVE STAR Wealth
Managers, a list that represents the most elite financial advisors in Pittsburgh.
With over 30 years advising clients, he has shared his financial planning and investment management expertise through
dozens of speeches, radio and television broadcasts, webcasts, and hundreds of times as an interviewee, writer and
publisher.
As Of: February 21, 2019 COPYRIGHT 2019 LEGEND FINANCIAL ADVISORS, INC.®

COMMON
CHARACTERISTICS OF
INTEREST GENERATING
INVESTMENTS (DEBT)

DEBT INVESTMENT RISK CHARACTERISTICS
Source: Legend Financial Advisors, Inc.®, Copyright 2016
Legend Financial Advisors, Inc.®, Reprinted with Permission

TOTAL RETURN LOSSES OF 5.0% OR MORE IN
U.S. 10-YEAR TREASURY BONDS, 1950 TO-DATE
Source: The Leuthold Group, LLC, Perception Express, August 7, 2018, http://leuth.us/stock-market
REPRINTED WITH PERMISSION FROM THE LEUTHOLD GROUP, LLC
As of: August 7, 2018
COPYRIGHT 2019 THE LEUTHOLD GROUP, LLC

Source: The Leuthold Group, LLC, www.leutholdgroup.com
COPYRIGHT 2019 THE LEUTHOLD GROUP, LLC
REPRINTED WITH PERMISSION FROM THE LEUTHOLD GROUP, LLC
As of: September 30, 2018

Source: Bloomberg Investment Services
COPYRIGHT 2019 LEGEND FINANCIAL ADVISORS, INC.®
REPRINTED WITH PERMISSION OF LEGEND FINANCIAL ADVISORS, INC..
YIELD CURVE: ALL U.S. ISSUERS
As Of: March 5, 2019
As of: March 5, 2019

Source: Barclays Capital, JP Morgan, BofA Merrill Lynch and Standard & Poor’s via
Eaton Vance Monthly Market Monitor, February 2019 www.eatonvance.com
FIXED INCOME CHARACTERISTICS AND PERFORMANCE ANALYSIS
As of: January 31, 2019
Averages
REPRINTED WITH PERMISSION OF EATON VANCE DISTRIBUTORS, INC.
2.57
2.70
3.28
2.94
3.31
3.91
6.94
6.92
6.24
5.65
6.25
2.58
IndexCoupon
(%)
Spread
(bps)
Price
($)
Yield to
Worst (%)Maturity
(yrs.)
Duration
(yrs.)

Source: Bloomberg Barclays, LCD, and Morningstar
Eaton Vance Monthly Market Monitor, February 2019, www.eatonvance.com
CORPORATE DEBT MARKET ANALYSIS
REPRINTED WITH PERMISSION OF EATON VANCE DISTRIBUTORS, INC.
As of: January 31, 2019

PRICE IMPACT OF A 1% RISE IN INTEREST RATES
Source: U.S. Treasury, Barclays Capital, FactSet, J.P. Morgan Asset Management
COPYRIGHT 2019 J.P. MORGAN ASSET MANAGEMENT
REPRINTED WITH PERMISSION OF J.P. MORGAN ASSET MANAGEMENT
As of: December 31, 2018
Sectors shown are provided by Barclays
and are represented by Broad Market; MBS:
U.S. Aggregate Securitized – MBS;
Corporate: U.S. Corporates; Municipals:
Muni Bond 10-year; High Yield: Corporate
High Yield; TIPS: Treasury Inflation
Protection Securities (TIPS). Floating Rate:
FRN (BBB); Convertibles: U.S. Convertibles
Composite; ABS: ABS + CMBS. Yield and
return information based on bellwethers for
Treasury securities. Sector yields reflect
yield to worst, while Treasury yields are
yield to maturity. Correlations are based on
10-years of monthly returns for all sectors.
Change in Interest Rates))+(0.5 *Price*
Convexity * (Change in Interest Rates) ^2).

SOURCE: BLOOMBERG INVESTMENT SERVICE
COPYRIGHT 2019 LEGEND FINANCIAL ADVISORS, INC.®As Of: January 31, 2019

SOURCE: BLOOMBERG INVESTMENT SERVICE
COPYRIGHT 2019 LEGEND FINANCIAL ADVISORS, INC.®As Of: January 31, 2019

DURATION OF THE BARCLAYS U.S. AGGREGATE
Source: FactSet, J.P. Morgan Asset Management
COPYRIGHT 2019 J.P. MORGAN ASSET MANAGEMENT
REPRINTED WITH PERMISSION OF J.P. MORGAN ASSET MANAGEMENT
As of: December 31, 2018

THE CASE FOR
FLOATING-RATE
LOANS

FLOATING-RATE LOAN PRIMER
1. Corporate Debt Issued By Below-Investment-Grade Borrowers
2. Most Issuers Are Significant In Size And Scale – And Many Are Familiar
Household Names
3. Companies Undertake Loans For Recapitalizations, Acquisitions And
Refinancings
4. Coupon Income From Floating-rate Loans Resets Regularly (About Every 40-60
Days On Average) To Maintain A Fixed Spread Over A Variable Base Rate,
Usually Libor
5. Loans Are Often Referred To As “Senior And Secured”: They Typically Have
The Highest Priority Of Claims In An Issuer’s Capital Structure And Are
Secured By Specific Collateral
6. Other Common Monikers: Bank Loans, Leveraged Loans, Senior Loans (All Are
Synonymous)
As Of: February 21, 2019 COPYRIGHT 2019 LEGEND FINANCIAL ADVISORS, INC.®

LOANS VS. BONDS: HYPOTHETICAL RETURNS IN VARIOUS
RATE SCENARIOS
Source: Eaton Vance
Floating-Rate Loan Chart Book Q4 2018, www.eatonvance.com
As of: December 31, 2018
REPRINTED WITH PERMISSION FROM EATON VANCE

Source: Eaton Vance
Eaton Vance, Floating-Rate Loan Chart Book Q4 2018, www.eatonvance.com
10-YEAR CORRELATION WITH U.S. TREASURIES
As of: December 31, 2018
REPRINTED WITH PERMISSION OF EATON VANCE DISTRIBUTORS, INC.

DESPITE A HISTORIC “BULL RUN” IN BONDS…… Loans Outperformed Bonds In Majority Of Intra One-Year Periods
Source: Eaton Vance, Floating-Rate Loan Chart Book Q1 2015, www.eatonvance.com
Note: Loans are represented by Credit Suisse Leveraged Loan Index and bonds are represented by the Barclays Capital U.S. Aggregate Index.
Analysis includes all rolling one-year periods since inception of Credit Suisse Leveraged Loan Index in February 1992.
As of: March 31, 2015
REPRINTED WITH PERMISSION FROM EATON VANCE

Source: Eaton Vance
Eaton Vance, Floating-Rate Loan Chart Book Q4 2018, www.eatonvance.com
DISTRIBUTION OF ALL QUARTERLY TOTAL RETURNS:
Q1 1992 TO Q3 2018
As of: December 31, 2018
REPRINTED WITH PERMISSION OF EATON VANCE DISTRIBUTORS, INC.

Source: The Leuthold Group, LLC, Perception Express, December 7, 2018, http://leuth.us/bond-market
REPRINTED WITH PERMISSION FROM THE LEUTHOLD GROUP, LLC
As of: December 7, 2018
COPYRIGHT 2018 THE LEUTHOLD GROUP, LLC
MUNICIPAL TAX EQUIVALENT YIELD / BARCLAYS U.S. CORPORATE BOND YIELD
1.8
1980 1983 1986 1989 1992 1995 1998 2001 2004 2007 2010 2013 2016
1.6
1.4
1.2
1.0
0.8
Yield Ratio
Median: 1.15
Nov-18:
1.09

FROM NOW UNTIL
THE RECESSION

CHARACTERISTICS OF
A PRE-RECESSION ECONOMY
1. More Volatility In The Stock Market
2. Slowing Economic Conditions
3. Slowing Profit Growth Of Companies
4. A Declining Stock Market Over At Least Six Months
5. Generally Rising Interest Rates
6. An Inversion Of The Yield Curve Occurs (Two-Year U.S.
Treasury Yield Curves Become Higher Than The Ten-Year
Yield Curve)
7. Commodity Prices Rise
As Of: February 21, 2019 COPYRIGHT 2019 LEGEND FINANCIAL ADVISORS, INC.®

Source: Bloomberg Investment Services, L.P.
COPYRIGHT 2019 LEGEND FINANCIAL ADVISORS, INC.®As Of February 28, 2019

Source: Bloomberg Investment Services, L.P.
COPYRIGHT 2019 LEGEND FINANCIAL ADVISORS, INC.®As Of March 5, 2019

Source: Bloomberg Investment Services, L.P.
COPYRIGHT 2019 LEGEND FINANCIAL ADVISORS, INC.®As Of February 28, 2019

Source: Bloomberg Investment Services, L.P.
COPYRIGHT 2019 LEGEND FINANCIAL ADVISORS, INC.®
As Of: February 28, 2019

Source: Bloomberg Investment Services
COPYRIGHT 2019 LEGEND FINANCIAL ADVISORS, INC.®
REPRINTED WITH PERMISSION OF LEGEND FINANCIAL ADVISORS, INC.®
As Of March 5, 2019

SOURCE: BLOOMBERG INVESTMENT SERVICE
COPYRIGHT 2019 LEGEND FINANCIAL ADVISORS, INC.®
As of: March 1, 2019

SOURCE: BLOOMBERG INVESTMENT SERVICE
COPYRIGHT 2019 LEGEND FINANCIAL ADVISORS, INC.®As of: March 2019
FLOATING-RATE LOANS VS. SELECT ASSET CLASSES

SOURCE: BLOOMBERG INVESTMENT SERVICE
COPYRIGHT 2019 LEGEND FINANCIAL ADVISORS, INC.®As of: March 1, 2019

As of: March 1, 2019 SOURCE: BLOOMBERG INVESTMENT SERVICE
COPYRIGHT 2019 LEGEND FINANCIAL ADVISORS, INC.®

2007-2009 RECESSION

3 MONTH T-BILLS VS. 90 DAY COMMERCIAL PAPER
July 1, 2007 To January 15, 2008
Source: Bloomberg Investment Services
COPYRIGHT 2019 LEGEND FINANCIAL ADVISORS, INC.®
REPRINTED WITH PERMISSION OF LEGEND FINANCIAL ADVISORS, INC.®

Source: Bloomberg Investment Services
COPYRIGHT 2019 LEGEND FINANCIAL ADVISORS, INC.®
REPRINTED WITH PERMISSION OF LEGEND FINANCIAL ADVISORS, INC.®
As Of March 1. 2019

Source: Bloomberg Investment Services
COPYRIGHT 2019 LEGEND FINANCIAL ADVISORS, INC.®
REPRINTED WITH PERMISSION OF LEGEND FINANCIAL ADVISORS, INC.®
SPX INDEX PAST 6 MONTHSJuly 15, 2007 To January 18, 2008

Source: Bloomberg Investment Services
COPYRIGHT 2019 LEGEND FINANCIAL ADVISORS, INC.®
REPRINTED WITH PERMISSION OF LEGEND FINANCIAL ADVISORS, INC.®
As Of February 28, 2019

2019 RECESSION EVALUATION

Source: Bloomberg Investment Services
COPYRIGHT 2019 LEGEND FINANCIAL ADVISORS, INC.®
REPRINTED WITH PERMISSION OF LEGEND FINANCIAL ADVISORS, INC.®
3 MONTH T-BILLS VS. 90 DAY COMMERCIAL PAPER
January 1, 2018 To March 5, 2019
As Of March 5, 2019

Source: Bloomberg Investment Services
COPYRIGHT 2019 LEGEND FINANCIAL ADVISORS, INC.®
REPRINTED WITH PERMISSION OF LEGEND FINANCIAL ADVISORS, INC.®
As Of February 20. 2019

Source: Bloomberg Investment Services
COPYRIGHT 2019 LEGEND FINANCIAL ADVISORS, INC.®
REPRINTED WITH PERMISSION OF LEGEND FINANCIAL ADVISORS, INC.®
As Of February 20, 2019

Source: Bloomberg Investment Services
COPYRIGHT 2019 LEGEND FINANCIAL ADVISORS, INC.®
REPRINTED WITH PERMISSION OF LEGEND FINANCIAL ADVISORS, INC.®
As Of March 1. 2019

WHAT INTEREST GENERATING
INVESTMENTS TO USE AS A U.S.
RECESSION APPROACHES
1. Variable Rate Debt Investments:
a. Bank Loans
b. Highly Discounted Jumbo Adjustable Interest Rate Mortgages
2. Investments To Avoid:
a. Foreign And Emerging Market Bonds
b. Most Intermediate And Long-Term Bonds Of All Types
c. Probably Utilities
As Of: February 21, 2019 COPYRIGHT 2019 LEGEND FINANCIAL ADVISORS, INC.®

DURING THE
FIRST HALF OF
THE RECESSION

CHARACTERISTICS OF THE
FIRST HALF OF A RECESSION
1. Volatility (VIX) Increases Substantially In the Stock Market
2. The Stock Market Decline Accelerates
3. Economic Conditions Decrease – High Yield Prices Fall Precipitously
4. Possible Deflation
5. Profit Growth Goes Negative
6. Energy Prices Decline
7. Interest Rates Begin To Decline
8. The U.S. Dollar Rises
9. Gold Bullion Prices Decline
10. Food Prices Rise
As Of: February 21, 2019 COPYRIGHT 2019 LEGEND FINANCIAL ADVISORS, INC.®

BARCLAYS U.S. HIGH YIELD BOND MINUS TREASURY BOND YIELD
20
1987 1989 1991 1993 1995 1997 1999 2001 2003 2005 2007 2009 2011 2013 2015 2017
15
10
5
Source: The Leuthold Group, LLC, Perception Express, December 7, 2018, http://leuth.us/bond-market
REPRINTED WITH PERMISSION FROM THE LEUTHOLD GROUP, LLC
As of: December 7, 2018
COPYRIGHT 2018 THE LEUTHOLD GROUP, LLC
Nov-18:
4.29
Differential
Median: 4.99

HIGH YIELD BONDS
Source: J.P. Morgan Global Economic Research, J.P. Morgan Asset Management
COPYRIGHT 2019 J.P. MORGAN ASSET MANAGEMENT
REPRINTED WITH PERMISSION OF J.P. MORGAN ASSET MANAGEMENT
As of: December 31, 2018

Source: Bloomberg Barclays, LCD, and Morningstar
Eaton Vance Floating-Rate Loan Chart Book, Q4 2018, www.eatonvance.com
CORPORATE BOND MARKET UPDATE
REPRINTED WITH PERMISSION OF EATON VANCE DISTRIBUTORS, INC.
As of: December 31, 2018

Source: Eaton Vance
Eaton Vance, Floating-Rate Loan Chart Book Q4 2018, www.eatonvance.com
DISTRESS RATIO
Percent Of Bank Loans Below $80
As of: December 31, 2018
REPRINTED WITH PERMISSION OF EATON VANCE DISTRIBUTORS, INC.

WHAT INTEREST GENERATING
INVESTMENTS TO USE IN THE
FIRST HALF OF A U.S. RECESSIONAssumes A Rising U.S. Dollar
1. Money Markets, U.S. Treasury Bills, CDs, Stable Value Funds
(For Retirement Plans)
2. The U.S. Dollar
3. Intermediate and Long Dated U.S. Treasuries – GNMAs,
Short/Intermediate/Long-Zero Coupon U.S. Treasuries
4. Avoid: High-Yield Bonds, Bank Loans, Highly Discounted Jumbo
Adjustable Interest Rate Mortgages, Municipal Bonds, Foreign
And Emerging Market Bonds
As Of: February 21, 2019 COPYRIGHT 2019 LEGEND FINANCIAL ADVISORS, INC.®

DURING THE
SECOND HALF OF
THE RECESSION

CHARACTERISTICS OF THE
SECOND HALF OF A RECESSION
1. Interest Rates Continue To Fall
2. The Stock Market Begins To Decline Precipitously
3. Corporate Bond & Bank Loan Funds’ Default Rates Increase
4. Corporate Profits Continue To Bottom
5. Gold Bullion Begins To Rise
6. U.S. Dollar Begins To Fall
7. Commodities Tend To Fall
8. A Recession Is Officially Declared
As Of: February 21, 2019 COPYRIGHT 2019 LEGEND FINANCIAL ADVISORS, INC.®

Source: Palmer Square Capital Management, www.palmersquarecap.com
REPRINTED WITH PERMISSION FROM PALMER SQUARE CAPITAL MANAGEMENT, LLC
As of: March 31, 2018
COPYRIGHT 2019 Palmer Square Capital Management, LLC
HISTORICAL AVERAGE ANNUAL DEFAULT RATE
Sector Yield Historical Average Annual
Default Rate
CLO AAA 3.29% 0.00%
CLO AA 3.68% 0.00%
CLO A 4.48% 0.03%
CLO BBB 5.53% 0.13%
CLO BB 8.29% 0.47%
CLO B 10.17% 2.59%
Floating Rate Bank Loan BB/B 5.89% 3.20%
High Yield 6.33% 3.00%
Past performance is no guarantee of future returns.
Source: CLO yields from JP Morgan CLOIE Index, CLO average annual default rates from Moody’s 2000-2014; Floating
Rate Bank Loan BB/B (JLYMSBB) yields and default rates from JP Morgan 1998-2017, High Yield from BAML and default
rates from JPM 1982-2017, as of December 29, 2017.

HIGH YIELD BONDS
Source: J.P. Morgan Global Economic Research, J.P. Morgan Asset Management
COPYRIGHT 2016 J.P. MORGAN ASSET MANAGEMENT
REPRINTED WITH PERMISSION OF J.P. MORGAN ASSET MANAGEMENT
As of: December 31, 2016
Average Latest
High Yield Spreads 5.9% 5.6%
High Yield Default Rates 3.9% 3.5%
Default rate is as of 11/30/2016 and Spread to Worst is as of 12/31/2016. Default rates are defined as the par value percentage of the total market trading at or
below 50% of par value and include any Chapter 11 filing, prepackaged filing or missed interest payments. Spreads indicated are benchmark yield to worst less
comparable maturity Treasury yields. Yield to worst is defined as the lowest potential yield that can be received on a bond without the issuer actually defaulting
and reflects the possibility of the bond being called at an unfavorable time for the holder. High yield is represented by the J.P. Morgan Domestic HY Index.
Investment grade is represented by the J.P. Morgan U.S. Liquid Index. Recovery rates are issuer-weighted and based on bond price 30 days after default date.
The 2009 adjusted recovery rate is based on year-end prices. *2016 recovery rate is for the last 12 months ending November 216, and is not included in the
average recovery rate calculated over the period.
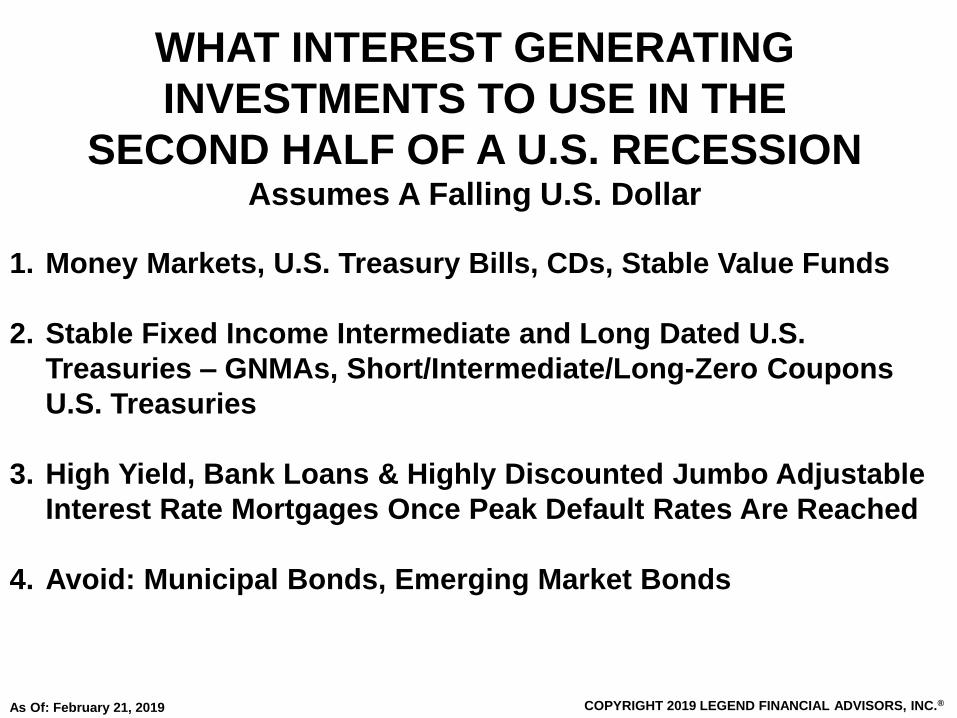
1. Money Markets, U.S. Treasury Bills, CDs, Stable Value Funds
2. Stable Fixed Income Intermediate and Long Dated U.S.
Treasuries – GNMAs, Short/Intermediate/Long-Zero Coupons
U.S. Treasuries
3. High Yield, Bank Loans & Highly Discounted Jumbo Adjustable
Interest Rate Mortgages Once Peak Default Rates Are Reached
4. Avoid: Municipal Bonds, Emerging Market Bonds
WHAT INTEREST GENERATING
INVESTMENTS TO USE IN THE
SECOND HALF OF A U.S. RECESSIONAssumes A Falling U.S. Dollar
As Of: February 21, 2019 COPYRIGHT 2019 LEGEND FINANCIAL ADVISORS, INC.®

QUESTIONS AND ANSWERS

Call Us With Any Questions
Or To
Schedule An Appointment
(412) 635-9210 Or (888) 236-5960
www.legend-financial.com