Opportunities for Energy Efficiency and Demand …LBNL-4849E Opportunities for Energy Efficiency and...
31
LBNL-4849E Opportunities for Energy Efficiency and Demand Response in the California Cement Industry Daniel Olsen, Sasank Goli, David Faulkner, Aimee McKane Environmental Energy Technologies Division December 2010
Transcript of Opportunities for Energy Efficiency and Demand …LBNL-4849E Opportunities for Energy Efficiency and...

LBNL-4849E
Opportunities for Energy Efficiency and Demand Response in the California Cement Industry
Daniel Olsen, Sasank Goli, David Faulkner, Aimee McKane
Environmental Energy Technologies Division
December 2010

Disclaimer
This document was prepared as an account of work sponsored by the United States Government. While this document is believed to contain correct information, neither the United States Government nor any agency thereof, nor The Regents of the University of California, nor any of their employees, makes any warranty, express or implied, or assumes any legal responsibility for the accuracy, completeness, or usefulness of any information, apparatus, product, or process disclosed, or represents that its use would not infringe privately owned rights. Reference herein to any specific commercial product, process, or service by its trade name, trademark, manufacturer, or otherwise, does not necessarily constitute or imply its endorsement, recommendation, or favoring by the United States Government or any agency thereof, or The Regents of the University of California. The views and opinions of authors expressed herein do not necessarily state or reflect those of the United States Government or any agency thereof or The Regents of the University of California.

i
Acknowledgements
The work described in this report was coordinated by the Demand Response Research Center and funded by the California Energy Commission (CEC), Public Interest Energy Research (PIER) Program, under Work for Others Contract No. 500‑03‑026 and by the U.S. Department of Energy under Contract No. DE‑AC02‑05CH11231.
The authors wish to thank Anish Gautam, Michael Lozano and Chris Scruton (California Energy Commission), for their support of this research project.
The authors would also like to thank the reviewers of this document, Stephen Coppinger (CalPortland) and Kevin Happ (FLSmidth), for their valuable and insightful comments.
Please cite this report as follows:
Olsen, Daniel, Sasank Goli, David Faulkner, Aimee McKane. 2010. Opportunities for Energy Efficiency and Demand Response in the California Cement Industry. PIER Industrial/Agricultural/Water End‑Use Energy Efficiency Program.

ii
Table of Contents
Abstract ................................................................................................................................................. iv Executive Summary ............................................................................................................................ 1 1.0 Introduction ................................................................................................................................ 3 2.0 Cement Plant Characteristics ................................................................................................... 5
2.1. Cement Plant Design Characteristics ............................................................................... 6 2.2. Cement Plant Operations Limitations .............................................................................. 8
3.0 Energy Use .................................................................................................................................. 11 4.0 Energy Efficiency and Demand Response Opportunities ................................................... 15
4.1. Energy Efficiency Opportunities ....................................................................................... 15 4.2. Demand Response Opportunities ..................................................................................... 16 4.3. Load Shedding ..................................................................................................................... 17 4.4. Load Shifting ........................................................................................................................ 18
5.0 Conclusions and Recommendations ....................................................................................... 21 5.1. Conclusions .......................................................................................................................... 21 5.2. Recommendations ............................................................................................................... 21 5.3. Benefits to California ........................................................................................................... 21
6.0 References ................................................................................................................................... 22 7.0 Glossary ....................................................................................................................................... 25

iii
List of Figures
Figure 1. Diagram of the cement manufacture process at a modern cement plant .......................... 5
Figure 2. Energy used in the production of cement in the United States, 1978‑2008. .................... 11
Figure 3. Specific fuel and electrical intensity used to manufacture one metric ton of cement, 1978‑2008. .......................................................................................................................................... 12
Figure 4. Estimated 1999 baseline specific electrical energy use for wet and dry cement plants. 13
Figure 5. Electrical power used by Lehigh Permanente cement plant weekdays during August 2009. .................................................................................................................................................... 19
Figure 6. Electrical power used by the Lehigh Permanente cement plant weekdays during September 2009. ................................................................................................................................ 20

iv
Abstract
This study examines the characteristics of cement plants and their ability to shed or shift load to participate in demand response (DR). Relevant factors investigated include the various equipment and processes used to make cement, the operational limitations cement plants are subject to, and the quantities and sources of energy used in the cement‑making process. Opportunities for energy efficiency improvements are also reviewed.
The results suggest that cement plants are good candidates for DR participation. The cement industry consumes over 400 trillion Btu of energy annually in the United States, and consumes over 150 MW of electricity in California alone. The chemical reactions required to make cement occur only in the cement kiln, and intermediate products are routinely stored between processing stages without negative effects. Cement plants also operate continuously for months at a time between shutdowns, allowing flexibility in operational scheduling. In addition, several examples of cement plants altering their electricity consumption based on utility incentives are discussed. Further study is needed to determine the practical potential for automated demand response (Auto‑DR) and to investigate the magnitude and shape of achievable sheds and shifts.
Keywords: Demand response, cement industry, energy efficiency, electricity use, mineral manufacturing

1
Executive Summary
During periods of peak demand on the energy grid or shortage of supply, the stability of the grid may be compromised or the cost of supplying electricity may rise dramatically. Demand Response (DR) programs aim to mitigate the frequency and severity of these problems by reducing the demand on the grid during these critical times. The Industrial Demand Response Team of the Demand Response Research Center has identified the cement industry as a good candidate for DR.
The cement industry is very energy intensive: in the United States alone over 350 trillion Btu of fuel and 10 billion kWh of electricity are consumed annually. Research indicates that the application of DR strategies to the cement industry is feasible, but depends on the characteristics of each facility. The largest demand response targets are the large grinding mills used in the manufacture of cement. The specifics of cement plants vary widely from one site to another, so DR strategies which are easy at one site may be impossible at another. Nevertheless, the potential for DR is high and significant reduction in energy demand during peak hours and critical peak times is possible.
Future research will gather more detailed information on cement plants in California to further analyze their DR potential. An ongoing survey of the control capabilities of industrial facilities will provide insight into the control capabilities of cement plants to determine the ease of implementing manual and automated DR strategies. Case studies of specific cement‑making sites and manual tests of DR activities at these sites should yield tangible data on potential peak‑time energy savings possible throughout the industry.

2

3
1.0 Introduction The Demand Response Research Center (DRRC), led by Lawrence Berkeley National Laboratory (LBNL), is funded by the California Energy Commission’s (CEC) Public Interest Energy Research Program (PIER). The Center exists to conduct and disseminate research that broadens the knowledge base of Demand Response (DR), strategies that reduce total utility load during times of critical demand or market conditions which raise electricity supply costs. These strategies are aimed at improving the reliability of the power grid, allowing utilities to supply power more efficiently, and lowering the average energy cost to the consumer. To effect these changes, the DRRC focuses on policies and tariffs, the state of utility markets and technology, and customer technology and behavior.
DR strategies include direct control of loads by the utility (load response) and pricing programs designed to reward end users for reducing load during peak hours and critical times (price response). The Automated Facility Demand Response (Auto‑DR) research project works to support increased penetration of DR in large facilities through automation of DR strategies. In 2006, the Industrial Demand Response Team was formed within the DRRC to analyze DR capabilities of industrial sites. Through research and case studies of industrial sectors and entities, the team gathers knowledge on the feasibility of industrial DR strategies with an emphasis on Auto‑DR and works to encourage implementation of these strategies. In 2009, the team began conducting research on the implementation of DR at cement plants.

4

5
2.0 Cement Plant Characteristics Cement is a fine powder used as a hydraulic binder to hold together concrete and mortar. Cement plants are sites that, through a variety of techniques, process quarried raw materials into cement. The overwhelming majority of cement currently produced is a formulation known as Portland cement, or a mixture of Portland cement and additives. Portland cement is produced by passing ground and blended raw materials through a cement kiln, yielding hard nodules up to 25 mm in diameter known as clinker. The clinker is quenched with air in a clinker cooler and is then ground with gypsum and optionally other additives in a cement mill to produce cement, which is sold as bulk powder or bagged.
Figure 1. Diagram of the cement manufacture process at a modern cement plant
Portland cement is composed of five main constituents, four of them present in clinker and the fifth, gypsum, added during finish grinding. Calcium silicates (tricalcium silicate, Ca3SiO5, or “alite”; and dicalcium silicate, Ca2SiO4, or “belite”) make up the bulk of cement and are responsible for its strength. Iron and aluminum containing clinker phases (tricalcium aluminate, Ca3Al2O6, or “aluminate”; and calcium aluminoferrite, Ca2(Al,Fe)2O5, or “ferrite”) act as liquid fluxes in the hottest part of the kiln. Gypsum (CaSO4∙2H2O) is present to control the rate of hydration of cement. The production of Portland cement requires a large amount of calcium, which is usually obtained from natural calcium carbonate in limestone or other calcareous materials. Cement plants with few exceptions are either associated with a limestone quarry or get their limestone by water transport from a nearby source. Argillaceous materials such as clay, marl, and shale provide silica, aluminum oxide, and iron oxide. Corrective ingredients like sand, bauxite, and iron ore are used to ensure correct proportions of silica, aluminum oxide, and iron oxide, respectively.
In 2007, there were 115 active cement plants in 37 states and Puerto Rico operating 175 cement kilns. Together they consumed 156 million metric tons of raw materials, 9 million metric tons of

6
coal, 2 million metric tons of petroleum coke, 87 million liters of oil, 330 million cubic meters of natural gas, 446 thousand metric tons of tires, 296 thousand metric tons of solid waste, and nearly a billion liters of liquid waste and used 13,300 GWh of electricity to produce approximately 93 million metric tons of cement (USGS Mineral Yearbook 2007). The average cement kiln in 2008 produced 584,000 metric tons of cement (Portland Cement Association, 2010). The expense of transporting cement long distances quickly overtakes the value of the cement, so the cement industry is largely regional. As a result, the average distance of a cement shipment is less than 100 miles (U.S. Dept. of Transportation, Commodity Flow Survey 2007).
California’s cement industry is the largest in the country, consuming 1,600 GWh of electricity, 62 million cubic meters of natural gas, and 2.3 million tons of coal annually at the peak of cement production in 2005 (Coito et al., 2005). In 2007, California had clinker capacity of 12,650,000 metric tons, cement production was 12,190,000 metric tons, and cement consumption was 12,360,000 metric tons. There are 11 cement plants in California, employing just over 2000 people in the production of cement statewide. Approximately 100,000 people are employed in cement and related industries, which includes the ready‑mix concrete industry and cement and masonry contractors (Portland Cement Association, USGS Mineral Yearbook 2007).
2.1. Cement Plant Design Characteristics Cement plants are custom designed to fit their location and are capital intensive, long term facilities. They are usually built in a location that provides enough limestone for several decades of operation. The other ingredients are often purchased and delivered by truck, boat, or rail. Once raw materials are quarried or delivered, they are crushed to a size that can be handled and transported easily by plant equipment. Since raw materials typically vary in composition, they are usually pre‑homogenized by large stackers and reclaimers either within or en route to storage before eventually being transported to the raw mill. A simplified process diagram is shown in Figure 1.
The raw mill exists to grind and blend the raw materials to prepare them for the kiln. There are two ways in which this is commonly accomplished: wet grinding and dry grinding. In wet grinding, raw materials are ground with water to produce pumpable slurry of about 30% water. In dry grinding, raw materials are ground and dried to produce a powder. The wet process historically dominated the industry due to the lower energy required to grind materials with water and the ease of homogenizing liquid slurry. Dry grinding is now the prevailing method due to advances in technology which make dry process plants much more efficient. Wet process plants are still used where local raw materials contain high levels of moisture. Hot air from the kiln or cooler is often used to aid in the drying of raw materials in the dry process. Raw materials are precisely proportioned and then ground and blended to yield raw mix, also known as raw meal or kiln feed. Dry raw mix blending can be accomplished pneumatically, mechanically, or by large gravity‑fed silos. Wet process plants typically blend raw mix in large slurry tanks.
Raw mix, once blended, is transported to the cement kiln. The cement kiln is the heart of the cement plant, effectively defining its capacity. Modern cement plants use rotary kilns, long steel

7
tubes lined with firebrick and supported by piers distributed along their length. These kilns can be up to 8 meters in diameter, with length to diameter ratios ranging from 10 to 40. Rotary kilns are oriented at a slight downward slope and are rotated along their axis at 1–5 rotations per minute which allows material deposited at the higher end to slowly travel to the lower end, where a large flame is constantly maintained by the kiln burner. This flame is usually fueled by coal or petroleum coke, and is burned at 2000 °C leading to a peak material temperature of 1400–1450 °C. Directly fired kilns feed fuel directly from the fuel mill to the kiln burner, while indirectly fired kilns have intermediate storage. Indirect firing allows more of the kiln combustion air to be drawn from the cooler, raising efficiency and allowing greater control of the kiln flame (Worrell and Galitsky, 2008). At many plants, raw material is passed through one or more preheaters immediately before entering the cement kiln. Design of the kiln system is dependent on the type of kiln feed supplied, the desired capacity of the kiln, and the implementation of a preheater system. Kilns with no preheaters often have systems of hanging chains within the kiln that facilitate heat transfer from the hot combustion gases to the raw materials.
As the raw mix moves through the kiln system, water is evaporated, volatile elements are driven out, and minerals are decomposed into their constituent oxides releasing significant quantities of CO2 and other gases. This process is known as calcination. Due to these losses, it takes at least 1.575 tons of raw materials to make one ton of clinker (Greer et al., 1992). As the material moves through the kiln, the main clinker phases begin to form. At peak material temperature, the aluminate and ferrite are liquid and act as fluxes to promote the formation of alite and the nodulation of clinker.
Preheaters heat kiln feed by passing it through hot kiln exhaust gases before the feed enters the kiln, which decreases kiln residence time and fuel usage and increases plant capacity. Most preheaters are gas suspension preheaters, large cyclones which let dry kiln feed fall through hot swirling kiln exhaust gases. These cyclones are often used in series to achieve greater efficiency, and large towers are constructed to support the cyclone stacks. High capacity plants may have several preheater lines feeding one kiln. To solve the problem of volatile elements circulating between the kiln and cyclones, many plants duct away and dispose of a percentage of kiln exhaust gas between the kiln and the lowest preheater. This is known as an alkali bleed or alkali bypass. Some older plants use grate preheaters, where an air‑permeable grate carries pellets of raw meal made from a semi‑dry (dry kiln feed nodulated with 10–15% water) or semi‑wet (filter‑pressed slurry cake, 15–20% water remaining) process through hot kiln exhaust gas before dropping them into the kiln. This configuration is known as a Lepol kiln. Preheaters allow partial calcination of raw mix before the kiln; more calcination can be achieved with a precalciner.
Precalciners are an improvement of the gas suspension preheater system. They burn up to 60% of total fuel in a special chamber between the higher end of the kiln and the preheater stack to allow significant calcination of the kiln feed to occur before the kiln, thus greatly increasing the efficiency and capacity of the kiln system. Precalciners calcine raw materials more rapidly than the kiln does in long‑kiln systems, which leads to clinker which is more completely reacted

8
(Alimmaryi and Tamás, 1980). Since less fuel is burned in the kiln, the firebrick lining of the kiln has a longer lifespan (Alsop, Chen, and Tseng, 2007).
After the cement kiln, red‑hot clinker falls into the clinker cooler. The cooler passes large volumes of air past the clinker and has the dual purpose of cooling the clinker and heating the air for use in the kiln. Hot cooler air can also be ducted away and used as combustion air in precalciners or drying air in raw mills. Modern clinker coolers force air through a bed of clinker which is moved horizontally through the cooler by the action of reciprocating grates or crossbars, recovering up to 80% of clinker heat (Worrell and Galitsky). Some systems use a crusher partway through the cooler to achieve smaller clinker size and faster cooling. Older systems used traveling grates, rotary coolers, or satellite (planetary) coolers, but these have been rendered obsolete by the newer generation of cooler technology. Clinker exits the cooler at around 100 °C and is conveyed to storage or to the cement mill. Due to the seasonal nature of the construction industry, cement plants usually have on‑site storage for 5–25% of their annual clinker capacity (Greer et al.).
The cement mill, or finish mill, grinds clinker and about 5% gypsum to make cement. Gypsum is present to control the hydration rate of the cement and to prevent flash‑set (irreversible early stiffening of cement paste). ASTM Type I/II cement now also allows up to several percent limestone. Cement grinding is often completed using a series of mills, fans, and separators in open or closed grinding circuits to grind cement more efficiently than if only one mill was used. After grinding, cement is transported to storage before being sold. Many cement plants also produce blended cement, made by grinding hydraulic materials (e.g. granulated blast furnace slag), pozzolanic materials (e.g. volcanic rocks, fly ash), or inert materials (e.g. limestone) with the clinker and gypsum. This allows more cement to be produced from the same amount of clinker.
2.2. Cement Plant Operations Limitations In order to produce good quality cement, kiln feed must be precisely controlled in size and in formulation. Raw material particles that are too large will not completely react, and particles that are too small waste grinding energy and can lead to excessive dusting in the kiln (Christensen, 1979). A common method of describing the fineness of raw mix is percent by weight retained on a 90 μm sieve, and 5–15% is typical for raw mixes. The “burnability” of raw mix is a measure of its ability to react in the kiln to form clinker phases. Burnability and clinker composition are influenced by the raw mix’s Lime Saturation Factor (ratio of lime to other oxides), Silica Ratio (ratio of silica to iron oxide and alumina), and Alumina Ratio (ratio of alumina to iron oxide). These parameters are tightly controlled to maintain cement quality. Since kiln reactions consume lime to produce the desired clinker phases, lime remaining in the clinker after the kiln is known as “free lime” and is a common benchmark of reaction completion.
The ratios of calcium, silica, aluminum oxide, and iron oxide in kiln feed determine the potential ratio of clinker phases, but the inclusion of minor elements also has a great impact on cement. Alkalies have long been known to affect the formation of clinker and properties of

9
resulting cement. In general, alkalies and their reactions with other kiln constituents disrupt the melt in the kiln and yield poor quality cement (Jawed and Skalny, 1977 & 1978). MgO and SO3 are also commonly present in cement clinker in concentrations of up to 3% and affect the formation of alite within the kiln (Ghosh 1991, Gadayev and Kodess, 1999). Volatile elements are prone to repeatedly evaporate and re‑condense, which can cause clumping of kiln feed. Sophisticated raw materials analysis systems such as prompt‑gamma neutron activation analysis (PGNAA), X‑ray diffraction (XRD) or X‑ray fluorescence (XRF) are used to ensure proper raw mix formulation.
The kiln system at a cement plant is run continuously when the plant is active, shutting down for scheduled maintenance only once or twice a year, apart from occasional inventory control shutdowns in periods of low demand. The startup and shutdown process must be carefully controlled in order to minimize damage to the firebrick lining and steel shell of the kiln. Anything that interrupts the clinker production process, such as a blockage of the preheaters or build‑up on the kiln induced draft (ID) fan, must be painstakingly avoided. When active, the kiln must be maintained at the proper temperature for optimum production of cement. Overcooking the materials in the kiln wastes fuel and decreases the porosity of clinker, leading to high energy use in the cement mill. Undercooking leads to incomplete reaction of raw materials and poor nodulation. Poor management of the kiln can lead to increases in cement kiln dust which is harder to grind and handle than proper clinker nodules (Maki et al., 1994). The kiln atmosphere must also be kept in oxidizing conditions for optimum reaction of the raw materials. Reducing conditions lead to an increase in heat consumption and a decrease in ultimate strength of resulting cement (Sorrentino, 1994). If waste fuels are used in the kiln, their chemical contribution to the kiln atmosphere and clinker must not be detrimental.
After the kiln, the cooler must quickly cool the clinker nodules to maintain clinker quality. Slow cooling of clinker leads to the development of large crystals of aluminate and ferrite and the decomposition of alite into belite and free lime, reducing the cement’s ultimate strength. Fast air‑quenching of clinker quickly crystallizes the liquid phase of the clinker, causing stresses that lead to microcracks in the alite crystals. These microcracks make the clinker easier to grind and result in a higher concentration of fine particles in cement (Maki et al., 1993).
At the cement mill, clinker and gypsum must be ground into correctly sized cement. Particle size distribution of cement is influenced by the type of mill or mills grinding it. Traditionally ball mills have been preferred for the final stage of grinding, due to their versatility and characteristic particle size distribution. However, energy efficient vertical roller mills are becoming the most common and preferred solutions today. Separators are used in grinding circuits to separate adequately fine particles from those to be returned to the mill. If materials within the mill become too hot, gypsum begins to dehydrate into hemihydrate and anhydrite, which affects the set time, water demand, and ultimate strength of cement (Goswami, Mohapatra, and Panda, 1990). Water sprays within mills are sometimes used to combat excessive material temperatures.
The control of dust emissions from cement plants in the United States is regulated by the New Source Performance Standards of the Environmental Protection Agency (Code of Federal

10
Regulations, Title 40, Section 60, Subpart F). Particulate matter in kiln gases is limited to 0.15 kg per metric ton of dry kiln feed and particulate matter in clinker cooler exhaust gases is limited to 0.05 kg per metric ton of dry kiln feed. Cement plants must also regulate their emission of mercury, total hydrocarbons, and toxic hydrocarbons such as dioxins, furans, and PCBs (Code of Federal Regulations, Title 40, Section 63, Subpart LLL), as well as other regulated gaseous emissions, like NOx, SOx, and CO2. Since the kiln is run with very infrequent stops, the emission control system at a cement plant must be durable and available for continuous use.
Measures to combat the release of particulate matter include negative pressure in mills and the use of cyclones, fabric filters, and electrostatic precipitators to filter exhaust air. Negative pressure in mills helps to ensure that any air leaks in the mill have clean air flowing in rather than dusty air flowing out. Cyclones direct incoming air to swirl around an inverted cone and collect particulates that are thrown to the sides and fall through the bottom. Their efficiency can be very high for large particles, but smaller particles tend to remain in the airstream. Fabric filters, also known as bag filters, draw air through woven filter bags, building up a layer of dust on the filter known as filter cake. Filter cake is periodically removed by jets of air (pulse‑jet filters) or a sudden reversal of air which causes the filter cake to detach from the bag (reverse‑air filters). A large number of these bags are used in parallel to filter large amounts of air in what is known as a baghouse. Electrostatic precipitators charge incoming airborne particulates and use charged plates to remove them from the airstream. The plates are periodically rapped to dislodge buildup. Chemical emissions are controlled by scrubbers.

11
3.0 Energy Use Large quantities of energy are used to transform raw materials into cement: the United States cement industry consumes over 350 TBtu of fuel and 10 billion kWh of electricity annually. The cost of purchased energy represented 17.9% of the total value of shipments from the U.S. cement industry in 2008 (United States Department of Commerce, Annual Survey of Manufacturers, 2008). The majority of the energy used in the cement industry comes from fuel. Coal, petroleum coke, and natural gas make up the bulk of fuel used. Oil was commonly used as fuel in the 1970s, but the rising cost of petroleum has virtually eliminated its use. Alternative fuels (e.g. tires, solvents, dewatered sewage sludge, etc.) contributed 11% of energy used to make cement in the United States in 2008 and 18% of energy used in the European cement industry in 2006 (USGS, 2008; Cembureau, 2009). Waste fuels are attractive to cement plants as the high temperatures in kilns lead to complete combustion of organic compounds and facilities using these fuels can in some cases collect disposal fees, lowering their energy costs. The decline in annual energy use since 2005 (as seen in Figure 2) is a result of the lower production rate of cement due to the global recession. It has also offered some additional DR opportunities since production pressures have been reduced, and once demand increases there may be less flexibility.
Figure 2. Energy used in the production of cement in the United States, 1978-2008.
Source data from USGS Mineral Yearbook, various years

12
Figure 3. Specific fuel and electrical intensity used to manufacture one metric ton of cement, 1978-2008.
Source data from USGS Mineral Yearbook, various years.
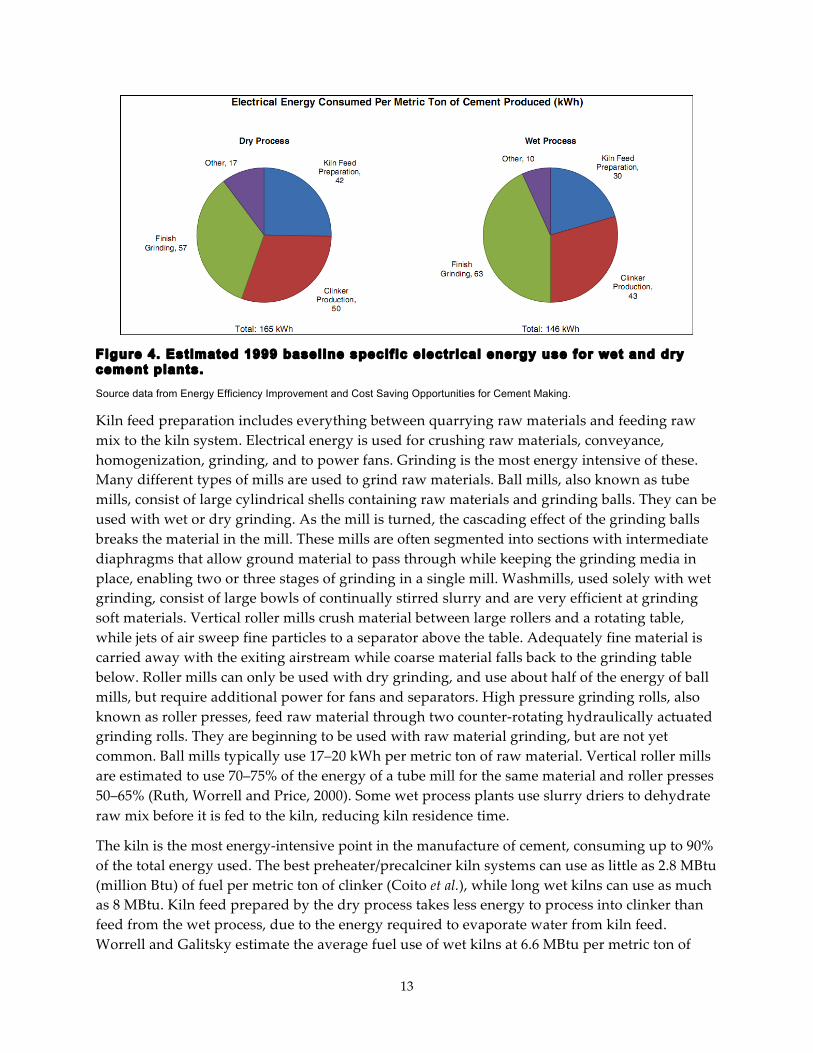
From 1978 to 2008, the average fuel energy used to manufacture a ton of cement fell from 5.9 MBtu to 4.2 MBtu, and the average electrical energy used fell from 152 kWh to 142 kWh, as seen in Figure 3. Though the wet process requires less electrical energy to make a ton of cement, it requires significantly more overall energy due to higher fuel consumption in the kiln. Electrical energy can be broken down by where in the cement‑making process it is consumed, with roughly 25% of total electrical energy consumed in kiln feed preparation, 30% in clinker production, 35% at the cement mill, and 10% attributable to other destinations (Worrell and Galitsky). This breakdown is shown in Figure 4.
13
Figure 4. Estimated 1999 baseline specific electrical energy use for wet and dry cement plants.
Source data from Energy Efficiency Improvement and Cost Saving Opportunities for Cement Making.
Kiln feed preparation includes everything between quarrying raw materials and feeding raw mix to the kiln system. Electrical energy is used for crushing raw materials, conveyance, homogenization, grinding, and to power fans. Grinding is the most energy intensive of these. Many different types of mills are used to grind raw materials. Ball mills, also known as tube mills, consist of large cylindrical shells containing raw materials and grinding balls. They can be used with wet or dry grinding. As the mill is turned, the cascading effect of the grinding balls breaks the material in the mill. These mills are often segmented into sections with intermediate diaphragms that allow ground material to pass through while keeping the grinding media in place, enabling two or three stages of grinding in a single mill. Washmills, used solely with wet grinding, consist of large bowls of continually stirred slurry and are very efficient at grinding soft materials. Vertical roller mills crush material between large rollers and a rotating table, while jets of air sweep fine particles to a separator above the table. Adequately fine material is carried away with the exiting airstream while coarse material falls back to the grinding table below. Roller mills can only be used with dry grinding, and use about half of the energy of ball mills, but require additional power for fans and separators. High pressure grinding rolls, also known as roller presses, feed raw material through two counter‑rotating hydraulically actuated grinding rolls. They are beginning to be used with raw material grinding, but are not yet common. Ball mills typically use 17–20 kWh per metric ton of raw material. Vertical roller mills are estimated to use 70–75% of the energy of a tube mill for the same material and roller presses 50–65% (Ruth, Worrell and Price, 2000). Some wet process plants use slurry driers to dehydrate raw mix before it is fed to the kiln, reducing kiln residence time.
The kiln is the most energy‑intensive point in the manufacture of cement, consuming up to 90% of the total energy used. The best preheater/precalciner kiln systems can use as little as 2.8 MBtu (million Btu) of fuel per metric ton of clinker (Coito et al.), while long wet kilns can use as much as 8 MBtu. Kiln feed prepared by the dry process takes less energy to process into clinker than feed from the wet process, due to the energy required to evaporate water from kiln feed. Worrell and Galitsky estimate the average fuel use of wet kilns at 6.6 MBtu per metric ton of

14
clinker and the average fuel use of dry kilns at 4.4 MBtu per metric ton, and the average electrical energy use at 43 kWh per metric ton for wet kilns and 50 kWh per metric ton for dry kilns. Electrical energy for the kiln system is used to turn the kiln and to operate large ID fans, the clinker cooler, and the fuel mill. Efficiency upgrades to the kiln system will often result in lower total energy usage but increase electrical energy usage because the preheaters and coolers that most effectively recover heat require increased fan and drive power. Modern coolers use 5–10 kWh of electrical energy per metric ton of clinker cooled (Cembureau, 1999).
The cement mill is the most electrically energy intensive portion of the cement manufacture process. The mill selection and grinding circuit design have a great impact on the energy consumed in grinding clinker into cement. Due to variation in mill design, grindability of clinker, and ultimate fineness of cement, pinpointing the energy usage of a mill type is difficult. Ball mills have the highest energy consumption; a typical ball mill by itself consumes around 35 kWh per metric ton to grind cement to a Blaine fineness1 of 3500 cm2/g. Vertical roller mills use 75‑80% of the energy of a ball mill, and roller presses 70‑75% (Cembureau, 1999). Aside from the energy used for the mills themselves, energy is also used for fans and separators in grinding circuits, and for material transport. High pressure grinding rolls are often used as a pre‑grinding stage before a ball mill in order to reduce energy consumption compared to a ball mill alone.
1 When discussing cement, the fineness of the product is usually measured by the Blaine air permeability test (ASTM C‑204), which yields a specific surface area measured in cm2/g.

15
4.0 Energy Efficiency and Demand Response Opportunities Cement plants have high investment costs and infrequent downtime, which hinders their ability to upgrade equipment on a regular basis. A 2005 case study of the California cement industry estimated potential annual energy savings of 360 GWh of electricity and 7.8 TBtu of fuel, a 20% reduction compared to 2005 energy use (Coito et al.). Worrell and Galitsky’s Energy Efficiency Improvement and Cost Saving Opportunities for Cement Making contains a comprehensive list of energy efficiency measures for both wet and dry process plants. The most effective energy saving opportunities involve changes in fundamental plant equipment or processes, but there are many options that could easily be implemented during the regular downtime of the cement plant.
4.1. Energy Efficiency Opportunities At the raw mill, the largest energy savings can be accomplished by upgrading mills and separators used to grind raw materials. A switch from a ball mill to a high efficiency vertical roller mill is estimated to save 6–7 kWh per metric ton of raw materials, which is estimated to save 11–13 kWh per metric ton of cement. High efficiency separators yield more efficient separation of coarse and fine particles, reducing re‑grinding of adequately fine particles, and can save 5–6 kWh per metric ton (Worrell and Galitsky). Consistently fine particles also improve burning conditions in the kiln, potentially reducing kiln fuel consumption. Since mills operate more efficiently at their maximum capacity, process control systems that maximize mill throughput can reduce raw mill specific energy consumption (Gordon, 2004). Additional energy savings can be achieved by switching from pneumatic conveyance to mechanical conveyance, and by retrofitting homogenization silos to gravity‑based blending systems.
The biggest energy savings for the kiln are savings in fuel. Wet‑process cement plants can achieve significant energy savings, a reduction of fuel use as high as 50%, by converting to the dry or semi‑wet process. The application of process control systems typically results in energy savings of 2.5–5%, but can range as high as 10%. These systems not only save fuel, but increase throughput and refractory life of the kiln (Worrell and Galitsky). If a plant’s raw mix has low burnability, the addition of mineralizers can reduce the kiln temperature needed for clinkering, saving fuel (Kolovos et al., 2001). The most efficient clinker coolers are able to achieve heat recovery efficiency of up to 80%, reducing the amount of fuel which must be burned in the kiln. Waste heat recovery from exhaust gases may be used to economically cogenerate electricity at some cement plants (Legmann, 2002; Mirolli, 2007). Waste heat can potentially be recovered from the clinker cooler exhaust, the kiln exhaust, or the preheater exhaust, and can be converted to electricity, typically by a Steam Rankine cycle. The hotter and more dust‑free the exhaust stream, the more suitable it is for waste heat regeneration.
Induced draft fans can be very large, frequently over 1000 HP in size each, and draw large volumes of air through the cooler, kiln, preheaters, and emission control system. Energy can be saved by upgrading fan drives to adjustable speed drives (ASDs), modifying cyclone preheaters for lower pressure drops, and reducing bottlenecks in ducting. The use of ASDs plant‑wide instead of constant speed fan drives with dampers is estimated to save 6‑8 kWh per metric ton

16
of cement (Worrell and Galitsky). ASDs also drastically reduce induction motor starting currents, extending the lives of motors and the plant power system. By replacing preheaters with lower pressure drop designs and optimizing duct sizes between preheaters, the Mason City cement plant in Iowa was able to reduce specific energy consumption by 4 kWh per metric ton of cement and simultaneously increase plant capacity by over 30% (Blum, 1990). Plant‑wide energy savings can also be achieved by properly designing and maintaining compressed air systems. Reducing air leaks is estimated to yield electrical energy savings of 16% in compressed air systems, and overall compressed air energy savings of 33% are estimated to be achievable by adopting an assortment of energy efficiency measures (Radgen and Blaustein, 2001).
The best way to save energy at the cement mill is by upgrading mills and grinding circuits. These upgrades not only allow cement to be ground with less electrical energy, they also improve the capacity of the cement mill. Using a two‑stage closed circuit with high pressure grinding rolls, a disagglomerator, two separators, and a ball mill, cement grinding has been shown to be accomplishable with less than 22 kWh of electrical energy per metric ton (Aydoğan et al., 2006). By pre‑grinding clinker in a vertical roller mill or between high‑pressure grinding rolls before a ball mill, grinding capacity can be increased by 25–35% compared to the ball mill alone, and two‑stage roller press/tube mill circuits can increase capacity 35–100% (Cembureau, 1999; Conroy, 1999). If greater efficiency is desired without purchasing new mills, the separators in grinding circuits can be upgraded to more efficient models, or existing mills can be optimized for maximum efficiency. Upgrading to high efficiency separators is estimated to save up to 8 kWh per metric ton of cement (Worrell and Galitsky). By adjusting the quantity and size of grinding balls in a 7500 HP ball mill used for clinker grinding in Mexico, a 17.5% reduction in specific power was achieved (Longhurst, 2010).
4.2. Demand Response Opportunities The majority of energy consumed at cement plants is used in the kiln in the form of fuel, which must be continuously supplied to the kiln. Electrical loads tied to the kiln system cannot be stopped or shifted without loss of product or damage to the kiln. This includes the drives to turn the kiln, the operation of the clinker cooler, material transport to and from the kiln, ID fans, and the filtration system to clean exhaust air to EPA standards before it is expelled to the atmosphere. As long as pyroprocessing is not interrupted, however, significant electrical sheds can be achieved without impacting plant operation.
Potential for demand response exists in quarrying operations, raw mix grinding, fuel grinding, and clinker grinding. These processes, unlike kiln operation, are non‑continuous. Their interruptibility is dependent on the amount of storage present at various points in the cement process, the capacities of the mills compared to the kiln, and the types of mills used in grinding. In order for raw mills to be shut down, there must be enough raw mix in the silo to supply the kiln until the mill comes back online. Care must be taken to ensure that enough raw mix is present in the storage silo for adequate blending: below a certain portion of silo capacity, blending efficiency can become too low for proper kiln function. If the kiln is indirectly fired and adequate stores of ground fuel are present, the fuel mill can be shut down. The cement mill can also be shut down as long as stores of finished cement outlast cement shipments until the

17
cement mill is reactivated. A small amount of product cement does get discarded in the process of shutting down the cement mill, but clinker coming from the cooler is simply stockpiled for later use. Plants that have limited cement storage capacity may not have as much flexibility in shifting load through their finish mills. If either the cement mills or raw mills are undersized compared to the kiln, they may need to be run continuously during peak cement season to prevent bottlenecking the entire cement‑making process, precluding their shutdown as a DR strategy.
The technical ability to implement Auto‑DR is dependent on the level of controls and automation present at the cement plant. However, initial feedback from plant personnel indicated that cement plants may be hesitant to allow an outside source to control the shutdown of their equipment, particularly in periods when they have a high demand for their products. If there are loads that are non‑critical to production that can be automated, such as raw material stockpiling, compressors, or lighting, Auto‑DR is possible. But, for motor loads critical to production, an event‑based manual DR (opt‑in) approach may be more viable. Also, at least in California under current operating procedures, there may be safety considerations associated with the automatic stopping and starting of large rotating equipment such as grinding mills. These and other aspects are presently under study by the DRRC as part of an industrial control survey.
As cement plants are energy intensive facilities, management of their power demand is not a new subject. A 1977 report on electricity pricing prepared for the state of California analyzed the response of foreign cement plants to multi‑period tariffs. An English cement plant was able to reduce daily on‑peak demand by 40–50% for the 10 most expensive hours. A sample of French cement plants reduced energy use by 40–50% during two two‑hour periods of highest electricity cost compared to their peak use. In Mexico and Latin America, cement plants have operated with mills down during peak hours. Typically, a newly installed mill would be sized for 20 hours/day of operation. In plants that choose not to operate during peak hour periods, the mills would be sized for 16‑18 hours/day. It was estimated that proposed time‑of‑use pricing in California could reduce electrical consumption from 12pm–6pm in the cement industry by 30–35% (Acton, Manning, and Mitchell, 1977). However, in certain areas of the US, particularly in California, cement plants electricity tariffs have been structured around the interruptible service model, and such plants are not able to be on DR programs as well. It is noted that the California model of interruptible service has worked well over the years, and has demonstrated the inherent load shifting capacity that can be harnessed towards DR as well.
4.3. Load Shedding During periods where it is financially advantageous to reduce electrical usage, numerous processes can be shed without interrupting proper kiln operation. The raw mill and cement mill are the largest interruptible loads. If the raw mill can be stopped, rock crushers and conveyors from the quarry as well as raw material homogenization can also be shut down and the kiln can be fed by raw mix from storage silos. The cement mill can be shut down, with clinker from the cooler going to storage. Mills run most efficiently during steady operation, so for load shedding

18
to be feasible the financial incentives from the utility must outweigh the cost of stopping and starting mills, both in wasted electricity and operator time if applicable.
In 1992, Lafarge’s Whitehall, PA cement plant agreed to a new interruptible power contract. The new contract offered financial incentives for the plant to minimize “firm demand” (the amount of power that must be available at all times for reliable plant operation), minimize maximum on‑peak demand, and maximize on‑peak load factor. In return, the utility company was able to initiate “curtailment periods” in which the plant was required to quickly initiate large sheds to reduce power consumption below firm demand levels. These sheds were accomplished by stopping all raw mills, finish mills, and quarrying operations, and running only the kiln and necessary support processes. By carefully monitoring and managing their power demand, Lafarge was able to reduce 1993 power costs by 20% compared to 1991 costs. Upon purchasing diesel generators to provide a majority of firm demand onsite during a curtailment, 1996 power costs were reduced by over 40% compared to 1991 costs (Rose, 1997).
If shutting down the cement mill altogether is not feasible or desirable, cement can be ground from clinker with lower grinding energy requirements. The amount of energy required to grind cement increases exponentially with the Blaine specific surface area of the final product. The chemical composition of raw mix and burning technique also have an impact on clinker grindability, as do the properties of any additives interground with clinker (Erdogdu, Tokyay and Türker, 1999). If a plant manufactures multiple types of cement, grinding varieties of cement with lower grinding energy requirements during peak hours can yield some energy savings without lowering mill output.
4.4. Load Shifting Load shifting capabilities depend on the level of automation and scheduling and the amount of storage at each step in the cement making process. Grinding of clinker, fuel, and raw materials are energy‑intensive processes that can be moved away from peak hours, provided there is enough storage to provide raw mix and fuel to the kiln and to stockpile clinker during peak hours. If raw mix stores are adequate, then quarrying, crushing, and homogenization of raw materials can also be shifted to off‑peak without interrupting plant operation. With modern dispatch systems, cement shipping can be fully automated (Miller and Rogers, 2007) which provides the potential to move some cement shipments outside of peak hours if truck or train scheduling is flexible, although local regulations may again restrict the automation of some of these processes—for instance, in California there must always be a weighmaster present, so trucks can’t be loaded unattended.
In 1997, Bosowa began construction on a new cement plant in South Sulawesi, Indonesia. Their cement grinding circuit consisted of a hydraulic roll press, a high efficiency separator, and one large ball mill powered by a 5.5 MW gearless mill drive. Due to the high capacity of the grinding circuit, plant operators were able to shut down the cement mill for several hours per day. By scheduling all of their finish grinding to occur during off‑peak hours with lower electrical rates, the plant estimated savings of over $1 million per year in energy costs (Hamdani, 2000).
19
In response to rolling blackouts in South Africa starting in 2007, Eskom, the nation’s largest producer of electricity, began encouraging demand‑side management of electricity. A study into the feasibility of load shifting at cement plants was completed, which analyzed raw mill usage over the course of several months at one plant and concluded that the raw mills could be scheduled to shut down during peak hours (in South Africa, 6pm–8pm), saving 9 MW of on‑peak power without reduction in daily plant output and saving the plant approximately $100,000 annually in energy costs (Mathews et al., 2007).
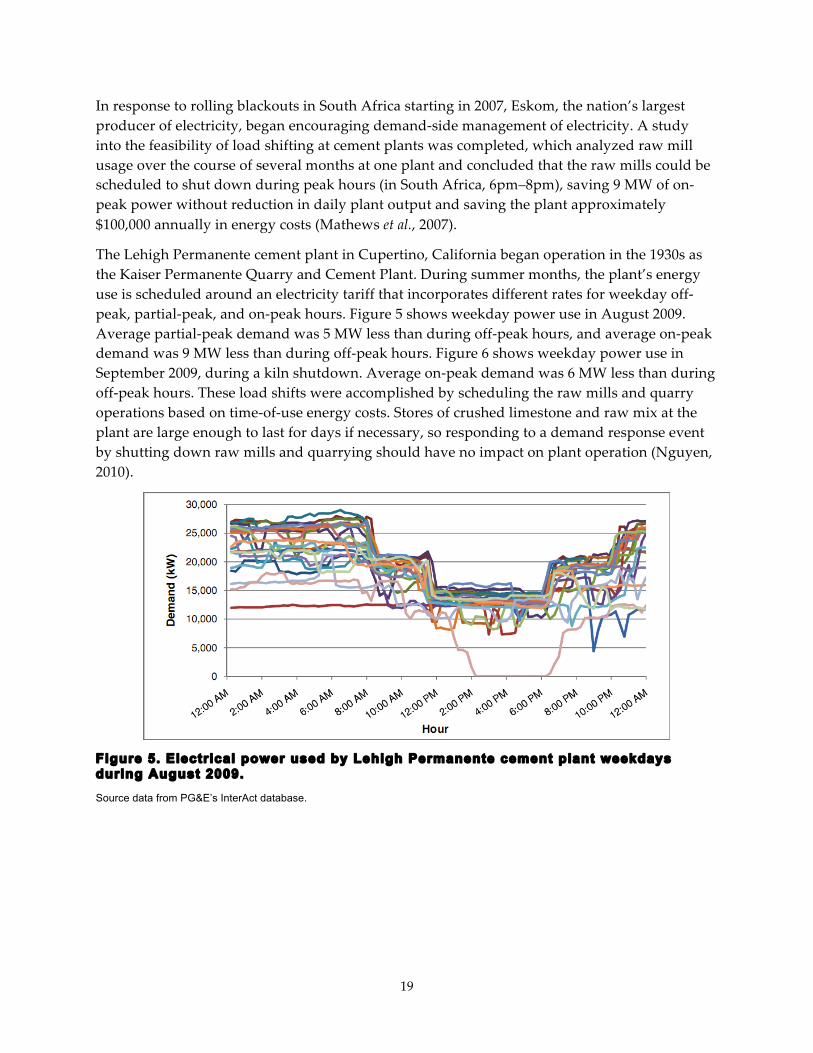
The Lehigh Permanente cement plant in Cupertino, California began operation in the 1930s as the Kaiser Permanente Quarry and Cement Plant. During summer months, the plant’s energy use is scheduled around an electricity tariff that incorporates different rates for weekday off‑peak, partial‑peak, and on‑peak hours. Figure 5 shows weekday power use in August 2009. Average partial‑peak demand was 5 MW less than during off‑peak hours, and average on‑peak demand was 9 MW less than during off‑peak hours. Figure 6 shows weekday power use in September 2009, during a kiln shutdown. Average on‑peak demand was 6 MW less than during off‑peak hours. These load shifts were accomplished by scheduling the raw mills and quarry operations based on time‑of‑use energy costs. Stores of crushed limestone and raw mix at the plant are large enough to last for days if necessary, so responding to a demand response event by shutting down raw mills and quarrying should have no impact on plant operation (Nguyen, 2010).
Figure 5. Electrical power used by Lehigh Permanente cement plant weekdays during August 2009.
Source data from PG&E’s InterAct database.

20
Figure 6. Electrical power used by the Lehigh Permanente cement plant weekdays during September 2009.
Source: PG&E’s InterAct database.

21
5.0 Conclusions and Recommendations
5.1. Conclusions The cement manufacture industry requires large amounts of energy to transform raw materials into finished cement. Though the majority of total energy used comes from fuel continuously being burned in the kiln, significant electrical energy is consumed primarily by large mills grinding raw materials and clinker. These mills, as well as the raw material preparation equipment that feed them, do not need to be running continuously for the plant to operate smoothly as long as storage of intermediate products can outlast grinding cessations. Since cement plants operate 24 hours per day, they have the capability to shift mill operation and have been seen to do so in response to variable energy pricing or utility‑initiated curtailment periods. Due to this flexibility and the large amounts of energy used, demand response at cement plants appears to be feasible and worthwhile.
5.2. Recommendations This study has highlighted the operational potential for DR in cement plants. Further study or demonstration is necessary to quantify and describe the practical capability of DR in this industry. This work could include:
• Manual tests of demand response in cement plants to demonstrate the achievable magnitude, shape, and response time of load reductions.
• Analysis of the potential for cement plants to participate in Auto‑DR, incorporating technical and regulatory barriers.
• The development of a strategy guide for DR in cement plants, describing proven approaches to DR implementation and solutions to common obstacles.
• A study of the financial value of participation in DR programs compared to other tariff structures, some of which may preclude DR participation.
5.3. Benefits to California This study is the first comprehensive investigation of the opportunities for DR in cement plants. Cement plants in California produce more cement than any other state in the nation, and this production represents over 150 MW of electric load. Since this load in concentrated in less than a dozen plants, each implementation of DR could yield considerable peak load reduction. Reducing peak electrical demand eases strain on the electricity distribution and supply system, leading to significant economic and environmental benefits for California.

22
6.0 References 2002 Commodity Flow Survey, part of the 2002 Economic Census. Washington, D.C.: U.S. Dept. of
Transportation, Bureau of Transportation Statistics, 2004.
Annual Survey of Manufactures. Washington, D.C.: U.S. Dept. of Commerce, Bureau of the Census, 2010.
Acton, J. P., W. G. Manning, and B. M. Mitchell. Electricity Pricing and Load Management: Foreign Experience and California Opportunities. California State Energy and Resources Conservation and Development Commission, 1977.
Alimmaryi, Salim A., and Ferenc D. Tamás. “Burnability of Cement Raw Materials at Rapid Calcination Conditions.” Cement and Concrete Research 10.6 (1980).
Alsop, Philip A., Hung Chen, and Herman H. Tseng. Cement Plant Operations Handbook: for Dry Process Plants. 5th ed. Dorking, Surrey, UK: Tradeship Publications, 2007.
Aydoğan, Namık A., Levent Ergün, and Hakan Benzer. “High Pressure Grinding Rolls (HPGR) Applications in the Cement Industry.” Mineral Engineering 19.2 (2006).
Blum, K.J. “Modification of an existing preheater system for increased production and efficiency,” Cement Industry Technical Conference, 1990., XXXII, Record of Conference Papers., IEEE, pp.359‑372, 22‑24 May 1990
Cembureau. “Best Available Techniques for the Cement Industry.” (1999).
Cembureau. “Sustainable Cement Production : Co‑processing of Alternative Fuels and Raw Materials in the Cement Industry.” (2009).
Christensen, N.H. “Burnability of Cement Raw Mixes at 1400 °C II: The Effect of the Fineness.” Cement and Concrete Research 9.3 (1979).
Coito, Fred, Frank Powell, Ernst Worrell, Lynn Price, and Rafael Friedmann. Case Study of the California Cement Industry. Berkeley, CA: Lawrence Berkeley National Laboratory, 2005 <http://industrial‑energy.lbl.gov/node/162>
Conroy, G.H. “Southdownʹs Victorville 97 Plant Expansion,” Cement Industry Technical Conference, 1999. Conference Record. 1999 IEEE‑IAS/PCA, pp.227‑257, 11‑15 April 1999
Erdogdu, K., M. Tokyay and P. Türker. “Comparison of Intergrinding and Separate Grinding for the Production of Natural Pozzolan and GBFS‑Incorporated Blended Cements.” Cement and Concrete Research 29.5 (1999).
Gadayev, Anatoly, and Boris Kodess. “By‑product Materials in Cement Clinker Manufacturing.” Cement and Concrete Research 29.2 (1999).
Ghosh, S. N. Progress in Cement and Concrete. New Delhi: ABI, 1991. Print.

23
Gordon, L. “Advanced Raw Mill Control Delivers Improved Economic Performance in Cement Production,” Cement Industry Technical Conference, 2004. IEEE‑IAS/PCA, pp. 263‑ 272, 25‑30 April 2004
Goswami, G., B. Mohapatra, and J. D. Panda. “Gypsum Dehydration During Comminution and Its Effect on Cement Properties.” Journal of the American Ceramic Society 73.3 (1990).
Greer, Walter L., Ann Dougherty, and Douglas M. Sweeny. “Portland Cement.” Air Pollution Engineering Manual. By Anthony J. Buonicore and Wayne T. Davis. New York: Van Nostrand Reinhold, 1992.
Hamdani, R. “Ball mill driven with gearless mill drive,” Cement Industry Technical Conference, 2000 IEEE‑IAS/PCA, pp.55‑68, 7‑12 May 2000
Jawed, Inam, and Jan Skalny. “Alkalies in Cement: A Review I. Forms of Alkalies and Their Effect on Clinker Formation.” Cement and Concrete Research 7.6 (1977).
Jawed, Inam, and Jan Skalny. “Alkalies in Cement: A Review II. Effects of Alkalies on Hydration and Performance of Portland Cement.” Cement and Concrete Research 8.1 (1978).
Kolovos, K., P. Loutsi, S. Tsivilis, and G. Kakali. “The Effect of Foreign Ions on the Reactivity of the CaO–SiO2–Al2O3–Fe2O3 System: Part I. Anions.” Cement and Concrete Research 31.3 (2001).
Legmann, H. “Recovery of industrial heat in the cement industry by means of the ORC process,” Cement Industry Technical Conference, 2002. IEEE‑IAS/PCA 44th, pp.29‑35, 5‑9 May 2002
Longhurst, D.A. “Economics and methodology of ball mill media maintenance,” Cement Industry Technical Conference, 2010 IEEE‑IAS/PCA 52nd, pp.1‑20, March 28 2010‑April 1 2010
Maki, I., S. Ito, T. Tanioka, Y. Ohno, and K. Fukuda. “Clinker Grindability and Textures of Alite and Belite.” Cement and Concrete Research 23.5 (1993).
Maki, I., T. Tanioka, Y. Ohno, and K. Fukuda. “Texture and Grindability of the Dust Component in Portland Cement Clinker.” Cement and Concrete Research 24.3 (1994).
Mathews, Edward, Marius Kleingeld, Johan Van Der Bijl, and Niel Jordaan. Real‑time Energy Management in the Cement Industry. Presented at the Industrial and Commercial Use of Energy Conference, Cape Peninsula Institute of Technology, 2007.
Manufacturing Energy Consumption Survey. Washington, DC: Energy Information Administration, Office of Energy Markets and End Use, U.S. Dept. of Energy, 2006. Web. <http://www.eia.doe.gov/emeu/mecs/mecs2006/2006tables.html>.

24
Miller, R.W.; Rogers, D.G. “Automated cement shipping and raw materials receiving system Union Bridge, MD Plant,” Cement Industry Technical Conference Record, 2007. IEEE, pp.38‑44, April 29 2007‑May 2 2007
Mirolli, M.D. “Ammonia‑water based thermal conversion technology: Applications in waste heat recovery for the cement industry,” Cement Industry Technical Conference Record, 2007. IEEE, pp.234‑241, April 29 2007‑May 2 2007
Nguyen, Ken. Lehigh Southwest Cement Company. Personal interview. 2010.
The Portland Cement Association. “Cement Industry Overview.” Web. <http://www.cement.org/econ/industry.asp> (2010).
Radgen, Peter and Edgar Blaustein. “Compressed Air Systems in the European Union, Energy, Emissions, Savings Potential and Policy Actions”, Fraunhofer Institute of Systems Technology and Innovation, Karlsruhe, Germany, 2001.
Rose, M.P. “Power costs reduction measures at Lafarge Whitehall plant,” Cement Industry Technical Conference. 1997. XXXIX Conference Record., 1997 IEEE/PCA, pp.89‑95, 20‑24 Apr 1997
Ruth, Michael, Ernst Worrell, and Lynn Price. Evaluating Clean Development Mechanism Projects in the Cement Industry Using a Process‑Step Benchmarking Approach. Lawrence Berkeley National Laboratory, 2000. Web. <http://industrial‑energy.lbl.gov/node/71>.
Sorrentino, F. P. “The Influences of Kiln Atmosphere on Clinker Characteristics.” Advances in Cement and Concrete: Proceedings of an Engineering Foundation Conference, July 24‑29, 1994, New England Center, University of New Hampshire, Durham, NH. By M. W. Grutzeck and Shondeep L. Sarkar. New York, N.Y.: American Society of Civil Engineers, 1994.
U.S. Department of the Interior. U.S. Geological Survey. “Cement.” U.S. Geological Survey 2006 Minerals Yearbook. By Hendrik D. Van Oss. 2008. Web. <http://minerals.usgs.gov/minerals/pubs/commodity/cement/myb1‑2006‑cemen.pdf>.
Worrell, Ernst, and Christina Galitsky. Energy Efficiency Improvement and Cost Saving Opportunities for Cement Making. Lawrence Berkeley National Laboratory, 2008.

25
7.0 Glossary ASD Adjustable Speed Drive Auto‑DR Automated Demand Response Btu British Thermal Unit CEC California Energy Commission DR Demand Response DRRC Demand Response Research Center EPA Environmental Protection Agency GWh Gigawatt‑hour HP Horsepower ID Induced Draft kWh Kilowatt‑hour MBtu Million British Thermal Units MW Megawatt PGNAA Prompt‑Gamma Neutron Activation Analysis PIER Public Interest Energy Research RD&D Research, Development, and Demonstration TBtu Trillion British Thermal Units USGS United States Geological Survey XRD X‑ray Diffraction XRF X‑ray Fluorescence