Familienaam Voornaam Promotor Co-promotor Alaerts Nicolas ...
Upload
phungkhuongCategory
view
215download
0
Operator de Program:
Promotor:
Parteneri de proiect din partea Statelor Donatoare:
Parteneri de proiect:
Proiect „Calea Verde spre Dezvoltare Durabilă”

Comparative analysis of the variation ofin-situ agrometeorological parametersand main indicators estimated fromremote sensing data used for extremeevents monitoring in Region 7 Centre
National Meteorological Administration
18 – 21 August 2015 / Workshop II Sibiu
Project “ Green Path to Sustainable Development ”Program RO 07 – Adapting to Climatic Change 2009-2014

• In the last decades, significant agricultural areas across Romania were affected
by extreme climate events, with multiple negative implications in agriculture,
water resources and ecosystems conservation.
• In this respect, it is particularly important to know the duration, intensity,
frequency and spatio-temporal distribution of the risk factors for agriculture
(drought, heat, excess / deficit of soil water, etc) in order to identify the
agricultural areas with different degrees of vulnerability and elaboration of
strategic decisions for long-term planning such as design, location and
operation of irrigation systems in order to ensure the water needs for plants.
• To have complex agro meteorological information it is necessary to improve the
operational capabilities of monitoring using advanced remote sensing
techniques and Geographic Information Systems (GIS).
Introducere

• Remote sensing techniques play an important role in crop identification,
acreage and production estimation, disease and stress detection, soil and water
resources characterization because they provide spatially explicit information
and access to remote locations. These techniques allow examining the
properties and processes of ecosystems and their inter-annual variability at
multiple scales because remote sensing observations can be obtained over
large areas of interest almost every day.
• Data sets provided by satellite systems can be used in global, regional or local
studies, to obtain input data used to produce various models of energy balance,
water balance, etc.
• From remote sensing data can be extracted biophysical, biological or structural
vegetation parameters: leaf area index (LAI), biomass, photosynthetic active
radiation daily fraction absorbed by vegetation cover (fAPAR), normalized
difference vegetation index (NDVI), normalized difference water index (NDWI).
Introducere

Global Temperature Anomalies averaged from 2009 to 2013
The average temperature in 2013 was 14.6 ˚C, which is 0.6 °C warmer than the mid-20th
century baseline.
The average global temperature has risen about 0.8 °C since 1880, according to the new
analysis.
With the exception of 1998, the 13 warmest years in the 134-year record, all have occurred
since 2000.
(NASA's Goddard Institute for Space Studies 2013 Report; http://svs.gsfc.nasa.gov/).
Introducere

Source: Atlas of mortality and economic losses from weather, climate and water extremes (1970-2012),
WMO No. 1123, 2014
EUROPE
No. of natural disasters
1971-1980 60
1981-1990 246
1991-2000 379
2001-2010 577
Total Europe / 1352
Franta – 123, Italia – 75,
Romania – 71, Spania – 70
▲Increase

Source: Global Assessment Report on Disaster Risk Reduction, UN - 2015. National Risk Profile - Romania
ROMANIA / 2005-2014
Frequency (%) Economic losses(%)
Floods – 49% Earthquake – 52%
Extreme temperature– 22% Floods – 49%
Storms – 11% Drought – 6%
Flash Floods– 7%
Earthquake – 5%
Drought – 3%

DECENIUL SECOLUL XX
ANI EXTREMI SECETOSI ANI EXCESIV PLOIOSI
1901-1910 1907-1908 1910
1911-1920 1917-1918 1911, 1912, 1915, 1919
1921-1930 1923-1924, 1927-1928 1929
1931-1940 1934-1935 1937, 1939, 1940
1941-1950 1945-1946, 1947-1948, 1949-1950 1941, 1944, 1947
1951-1960 1952-1953 1954, 1955, 1957, 1960
1961-1970 1962-1963, 1964-1965 1969, 1970
1971-1980 1973-1974, 1975-1976 1972, 1974, 1975, 1976
1981-1990 1982-1983, 1985-1986, 1987-1988 1981, 1990
1991-2000 1992-1993, 1997-1998, 1999-2000 1991, 1997
SECOLUL XXI
2001-2010 2000-2001, 2001-2002, 2002-2003, 2006-2007, 2008-2009 2005, 2006, 2008, 2010
2011-2020 2011-2012 , …2013, 2014 …
Cresterea frecventei anilor secetosi incepand din 1981
Perioade cu precipitatii abundente pe secvente scurte de timp generatoare de
viituri rapide si inundatii (ex. 2004-2005, primavara si vara 2006, vara 2008 si 2010,
primavara si toamna 2013, primavara si vara 2014)
Ani secetoşi / ploioşi în România, perioada 1901-2014
Analiza climatologica

OBSERVED SHIFTS IN THE
COURSE OF THE MEAN ANNUAL
AIR TEMPERATURE IN ROMANIA
7.0
7.5
8.0
8.5
9.0
9.5
10.0
10.5
11.0
19
61
19
62
19
63
19
64
19
65
19
66
19
67
19
68
19
69
19
70
19
71
19
72
19
73
19
74
19
75
19
76
19
77
19
78
19
79
19
80
19
81
19
82
19
83
19
84
19
85
19
86
19
87
19
88
19
89
19
90
19
91
19
92
19
93
19
94
19
95
19
96
19
97
19
98
19
99
20
00
20
01
20
02
20
03
20
04
20
05
20
06
20
07
20
08
20
09
20
10
20
11
20
12
20
13
20
14
ºCMean annual air temperature trend in Romania
over 1961-2014 period
The warmest 5 years in Romania / 1961-2014 (1961-1990 / 8.8C)
Annual air temperature Deviation
1. 2007 10.6C 1.8C
2. 1994 10.4C 1.6C
3. 2009 10.3C 1.5C
4. 2000, 2008, 2014
10.2C 1.4C
5. 2002, 2013 10.1C 1.3C
1961-1990 / 8.8ºC
1981-2014 / 9.3ºC
+0.5ºC


RainfallSeptember 1st – October 31 (mm)Sowing period for winter wheat
1961-2014
1981-20101961-1990
Rainfall regime classesdrymoderate dryoptimalrainy

RainfallNovember 1st – March 31 (mm)
1961-2014
Rainfall regime classesdrymoderate dryoptimalrainy
1961-1990 1981-2010

Zoning of the precipitation duringthe dormant period (November
1st – March 31)
Precipitatii medii multianuale
BLAJ
0.0
10.0
20.0
30.0
40.0
50.0
60.0
70.0
80.0
90.0
I II III IV V VI VII VIII IX X XI XII
luna
l/m
p
media 1961-1990
media 1981-2010
Multiannual rainfall regime Blaj 1961-2014
Month
mm

Rainfall (annual precipitation)June 1st – August 31(mm)
Summer period
Rainfall regime classesdrymoderate dryoptimalrainy
1961-1990 1981-2010
1961-2014

Rainfall (annual precipitation)June 1st – August 31(mm)
Summer period

Rainfall (annual precipitation)September 1st – August 31(mm)
agricultural year
1961-2014
1981-20101961-1990
Rainfall regime classes
moderate dryoptimalrainy
excessive rainy
Rainfall regime classes
moderate dryoptimalrainy
excessive rainy
Rainfall regime classes
moderate dryoptimalrainy
excessive rainy

Precipitatii medii multianuale
LACAUTI
0.0
20.0
40.0
60.0
80.0
100.0
120.0
140.0
160.0
I II III IV V VI VII VIII IX X XI XII
luna
l/m
p
media 1961-1990
media 1981-2010
Month
Multiannual rainfall regime Lacauti 1961-2014
mm
Multiannual rainfall regime Lacauti 1961-2014
Zoning of the precipitation duringthe agricultural year (September 1st -
August 31)
- 15.5% rainfall

Evolution of the mean annual air temperature recorded in Region 7 Centre,
over 1961-1990 and 1981-2010 intervals
Temperaturi medii multianuale
JOSENI
-10.0
-8.0
-6.0
-4.0
-2.0
0.0
2.0
4.0
6.0
8.0
10.0
12.0
14.0
16.0
18.0
I II III IV V VI VII VIII IX X XI XII
luna
grade
media 1963-1990
media 1981-2010
Temperaturi medii multianuale
MIERCUREA CIUC
-10.0
-8.0
-6.0
-4.0
-2.0
0.0
2.0
4.0
6.0
8.0
10.0
12.0
14.0
16.0
18.0
20.0
I II III IV V VI VII VIII IX X XI XII
luna
grade
media 1961-1990
media 1981-2010
+ 0.6C + 0.6C

Evolution of the mean annual airtemperature recorded in Region 7 Centre,over 1961-1990 and 1981-2010 intervals
Temperaturi medii multianuale
BLAJ
-6.0
-4.0
-2.0
0.0
2.0
4.0
6.0
8.0
10.0
12.0
14.0
16.0
18.0
20.0
22.0
I II III IV V VI VII VIII IX X XI XII
luna
grade
media 1961-1990
media 1981-2010
Temperaturi medii multianuale
SIBIU
-6.0
-4.0
-2.0
0.0
2.0
4.0
6.0
8.0
10.0
12.0
14.0
16.0
18.0
20.0
22.0
I II III IV V VI VII VIII IX X XI XII
luna
grade
media 1961-1990
media 1981-2010
IntervalMonthly mean air temperature (C) – Region 7 Centre
I II III IV V VI VII VIII IX X XI XII
1961-1990 -5.0 -3.0 1.6 7.0 12.0 14.8 16.5 16.0 12.4 7.1 1.8 -2.5
1981-2010 -4.0 -3.0 1.5 7.2 12.6 15.6 17.4 17.0 12.4 7.5 1.9 -2.7
Deviation +1.0 0 +0.1 +0.2 +0.6 +0.8 +0.9 +1.0 0 +0.4 +0.1 -0.2

Evolution of the mean annual airtemperature recorded in Region 7 Centre,over 1961-1990 and 1981-2010 intervals
Temperaturi medii multianuale
BRASOV
-8.0
-6.0
-4.0
-2.0
0.0
2.0
4.0
6.0
8.0
10.0
12.0
14.0
16.0
18.0
20.0
I II III IV V VI VII VIII IX X XI XII
luna
gra
de
media 1961-1990
media 1981-2010
Temperaturi medii multianuale
BARAOLT
-8.0
-6.0
-4.0
-2.0
0.0
2.0
4.0
6.0
8.0
10.0
12.0
14.0
16.0
18.0
20.0
I II III IV V VI VII VIII IX X XI XII
luna
grade
media 1961-1990
media 1981-2010
Temperaturi medii multianuale
DUMBRAVENI
-6.0
-4.0
-2.0
0.0
2.0
4.0
6.0
8.0
10.0
12.0
14.0
16.0
18.0
20.0
22.0
I II III IV V VI VII VIII IX X XI XII
luna
grade
media 1961-1990
media 1981-2010
Temperaturi medii multianuale
FAGARAS
-8.0
-6.0
-4.0
-2.0
0.0
2.0
4.0
6.0
8.0
10.0
12.0
14.0
16.0
18.0
20.0
22.0
I II III IV V VI VII VIII IX X XI XII
luna
grade
media 1961-1990
media 1981-2010

y = 0.0031x + 8.6497
6.0
7.0
8.0
9.0
10.0
11.0
12.0
190
1
190
5
190
9
191
3
191
7
192
1
192
5
192
9
193
3
193
7
194
1
194
5
194
9
195
3
195
7
196
1
196
5
196
9
197
3
197
7
198
1
198
5
198
9
199
3
199
7
200
1
200
5
200
9
201
3
Mean annual air temperature - Sibiu / 1901-
2013
ºC
y = 0.0055x + 7.3392
4.0
6.0
8.0
10.0
190
1
190
5
190
9
191
3
191
7
192
1
192
5
192
9
193
3
193
7
194
1
194
5
194
9
195
3
195
7
196
1
196
5
196
9
197
3
197
7
198
1
198
5
198
9
199
3
199
7
200
1
200
5
200
9
201
3
ºC Mean annual air temperature - Brasov / 1901-
2013
y = 0.0082x + 8.3773
6.0
7.0
8.0
9.0
10.0
11.0
190
1
190
5
190
9
191
3
191
7
192
1
192
5
192
9
193
3
193
7
194
1
194
5
194
9
195
3
195
7
196
1
196
5
196
9
197
3
197
7
198
1
198
5
198
9
199
3
199
7
200
1
200
5
200
9
201
3
ºCMean annual air temperature - Tg. Mures /1901-
2013
Observed shifts in the course of
the mean annual air temperature
SIBIU
1961-1990 8.5ºC
1991-2013 9.2ºC, +0.7ºC
BRASOV
1961-1990 7.5ºC
1991-2013 8.1ºC, +0.6ºC
TG. MURES
1961-1990 8.8ºC
1991-2013 9.4ºC, +0.6ºC

y = -0.2501x + 659.02
0.0
500.0
1000.0
1500.0
1…1…1…1…1…1…1…1…1…1…1…1…1…1…1…1…1…1…1…1…1…1…1…1…1…2…2…2…2…
mmAnnual precipitation amounts trend - Sibiu /1901-
2013
y = -1.9722x + 787.460
500
1000
1500
190
1
190
5
190
9
191
3
191
7
192
1
192
5
192
9
193
3
193
7
194
1
194
5
194
9
195
3
195
7
196
1
196
5
196
9
197
3
197
7
198
1
198
5
198
9
199
3
199
7
200
1
200
5
200
9
201
3
mm Annual precipitation amounts trend - Brasov /1901-
y = -0.5954x + 639.48
0
200
400
600
800
1000
1200
190
1
190
5
190
9
191
3
191
7
192
1
192
5
192
9
193
3
193
7
194
1
194
5
194
9
195
3
195
7
196
1
196
5
196
9
197
3
197
7
198
1
198
5
198
9
199
3
199
7
200
1
200
5
200
9
201
3
Annual precipitation amounts trend - Tg. Mures /1901-m
m
Observed shifts in the course of the
annual precipitation amounts (mm)
SIBIU
1901-1980 653.3 mm
1981-2013 624.1 mm
BRASOV
1901-1980 711.2 mm
1981-2013 587.3 mm
TG. MURES
1901-1980 617.2 mm
1981-2013 572.2 mm

0
20
40
60
80
100
120
I II III IV V VI VII VIII IX X XI XII
l/m
p
luna
Precipitatii medii multianuale (l/mp) 1961-1990, 1981-2010 si 1961-2014 / SIBIU
media 1961-1990
media 1981-2010
media 1961-2014
Interval / Month May June July August
1961-1990 78,2 99,0 86,4 68,1
1981-2010 69,1 92,9 92,6 76,8
1961-2014 77,9 96,4 93,5 72,1
SignificanceOPTIMAL
pluviometric regime
Multiannual averages of
rainfall (l / m2) fallen in 24 h,
recorded at the
meteorological station Sibiu

Month Value / Date
(1961-1990)
Value / Date
(1981-2010)
Value / Date
(1961-2014)
Value / Date
(2015)
Mai 69,9 l/mp /
10.05.1973
35,3 l/mp /
30.05.1998
69,9 l/mp /
10.05.1973
18,5 l/mp /
07.05.2015
Iunie 45,2 l/mp /
22.06.1979
70,4 l/mp /
18.06.1998
70,4 l/mp /
18.06.1998
44,9 l/mp /
26.06.2015
Iulie 57,0 l/mp /
19.07.1974
53,2 l/mp /
28.07.2004
57,0 l/mp /
19.07.1974
3,9 l/mp / 28.07.2015
August 65,8 l/mp /
25.08.1977
46,6 l/mp /
05.08.2005
65,8 l/mp /
25.08.1977
0 l/mp / 01-
13.08.2015
Maximum Precipitation (l / m) fallen in 24 h, recorded at the meteorological
station Sibiu

DateSoil moisture
(mc/ha)
% Cau (% from usable water
capacity of the soil)Significance
31.05.2015 810 mc/ha 51 %CAu Satisfactory supply
30.06.2015 1025 mc/ha 64 %CAu Satisfactory supply
DateSoil moisture
(mc/ha)
% Cau (% from usable water
capacity of the soil)Significance
30.06.2015 1030 mc/ha 64 %CAu Satisfactory supply
31.07.2015 465 mc/ha 29 %CAu Strong pedological drought
15.08.2015 331 mc/ha 21 %CAu Strong pedological drought
Soil moisture (mc / ha) on the 0-100 cm soil profile, for winter wheat, during the peak
demand of water for the plants (May-June) to agrometeorological station Sibiu
Soil moisture (mc / ha) on the 0-100 cm soil profile, for maize, during the peak demand of
water for the plants (June - August) to agrometeorological station Sibiu
Legend (% CAu - % from usable water capacity of the soil)
0 – 20%CAu : Extreme pedological dorught(SE)
20 – 35%CAu : Strong pedological drought(SP)
35 – 50%CAu : Moderate pedological drought(SM)
50 – 70%CAu : Satisfactory supply(AS)
70 – 85%CAu : Almost optimum supply (ApO)
85 – 100%CAu : Optimal supply(AO)
> 100%CAu : Excess (E)

Interval / Month May June July August
1961-1990 74,6 78,0 83,6 63,8
1981-2010 65,7 84,8 77,0 65,6
1961-2014 72,9 83,7 80,4 65,2
SignificanceOPTIMAL
pluviometric regime
Multiannual averages of
rainfall (l / m2) fallen in 24 h,
recorded at the
meteorological station Targu
Mures
Precipitatii medii multianuale (l/mp) 1961-1990, 1981-2010 si 1961-2014 / TG. MURES
0
10
20
30
40
50
60
70
80
90
I II III IV V VI VII VIII IX X XI XII
luna
l/m
p
media 1961-1990
media 1981-2010
media 1961-2014

Maximum Precipitation (l / m) fallen in 24 h, recorded at the meteorological
station Targu Mures
Month Value / Date
(1961-1990)
Value / Date
(1981-2010)
Value / Date
(1961-2014)
Value / Date
(2015)
Mai 51.1 l/mp / 13.05.1970 29 l/mp / 14.05.1984 51.1 l/mp / 13.05.1970 23,4 l/mp / 14.05.2015
Iunie 53.5 l/mp / 12.06.1974 49.2 l/mp / 18.06.1998 56,8 l/mp / 10.06.2011 27,2 l/mp / 26.06.2015
Iulie 67.8 l/mp / 02.07.1975 59.6 l/mp / 18.07.1985 67.8 l/mp / 02.07.1975 9,8 l/mp / 09.07.2015
August 38,8 l/mp / 05.08.1962 49,6 l/mp / 24.08.200549,6 l/mp / 24.08.2005 25,6 l/mp / 06.08.2015
01-13.08.2015

DateSoil moisture
(mc/ha)
% Cau (% from usable water
capacity of the soil)Significance
31.05.2015 889 mc/ha 52 %CAu Satisfactory supply
30.06.2015 1051 mc/ha 62 %CAu Satisfactory supply
DateSoil moisture
(mc/ha)
% Cau (% from usable water
capacity of the soil)Significance
30.06.2015 1053 mc/ha 62 %CAu Satisfactory supply
31.07.2015 888 mc/ha 52 %CAu Satisfactory supply
15.08.2015 929 mc/ha 55 %CAu Satisfactory supply
Soil moisture (mc / ha) on the 0-100 cm soil profile, for winter wheat, during the peak
demand of water for the plants (May-June) to agrometeorological station Targu Mures
Soil moisture (mc / ha) on the 0-100 cm soil profile, for maize, during the peak demand of
water for the plants (June - August) to agrometeorological station Targu Mures
Legend (% CAu - % from usable water capacity of the soil)
0 – 20%CAu : Extreme pedological dorught(SE)
20 – 35%CAu : Strong pedological drought(SP)
35 – 50%CAu : Moderate pedological drought(SM)
50 – 70%CAu : Satisfactory supply(AS)
70 – 85%CAu : Almost optimum supply (ApO)
85 – 100%CAu : Optimal supply(AO)
> 100%CAu : Excess (E)

GIS database
•The GIS database contains
info-layers in a relational
structure, that are: sub-basins
and basin limits; land
topography (15m cell size
DEM); hydrographic and
canal networks; transport
network (roads, railways);
localities; administrative
boundaries; agro –
meteorological stations; land
cover/land use, updated from
satellite images
GIS Database

CLC 2012
GIS Database

Remote sensimg data used
• In order to monitor the vegetation statement, the medium and high resolution satellite
images have been used to obtain the dedicated vegetation indexes. These indexes are
good indicators of drought and they are used also by the scientific community (European
Drought Observatory).
• TERRA – AQUA/MODIS Surface Reflectance 8-Day L3 Global 500 m products
(MOD09A1): provides bands 1–7 at 500 m resolution in an 8-day gridded level-3 product
in the sinusoidal projection. Science Data Sets provided for this product include
reflectance values for Bands 1–7, quality assessment, and the day of the year for the
pixel along with solar, view, and zenith angles.
• TERRA MODIS 8 – day LAI/fAPAR product (1 km spatial resolution): is composited every
8 days at 1-kilometer resolution on a Sinusoidal grid. Science Data Sets provided in the
MOD15A2 include LAI, FPAR, a quality rating, and standard deviation for each variable.
• Medium resolution satellite data: 2000 - present

Remote sensimg data
• The LANDSAT 5 TM data: 7 spectral bands, with 30 m spatial resolution (thermal band (6)
has 120 m spatial resolution). (200-2013).
• Landsat 7 ETM+ data: the main features are: a panchromatic band with 15 m spatial
resolution (band 8); visible bands in the spectrum of blue, green, red, near-infrared (NIR),
and mid-infrared (MIR) with 30 m spatial resolution (bands 1-5, 7); a thermal infrared
channel with 60 m spatial resolution (band 6). (2000-present).
• Landsat 8 OLI data: the main features are: a panchromatic band with 15 m spatial
resolution (band 8); visible bands in the spectrum of blue, green, red, near-infrared (NIR),
and mid-infrared (MIR) with 30 m spatial resolution (bands 1-9); two thermal infrared
channels with 100 m spatial resolution (bands 10 and 11). (2014 – present)
• SPOT 7 data.
• Image product resolution: 6 m for multispectral and 1.5 for panchromatic.
• Spectral bands, with simultaneous panchromatic and multispectral
acquisitions: Panchromatic (450 – 745 nm); Blue (450 – 525 nm); Green
(530 – 590 nm); Red (625 – 695 nm); Near-infrared (760 – 890 nm).

Vegetation indices
• The Normalized Difference Vegetation Index (NDVI) is a non-linear transformation of
visible bands (Red) and near infrared (NIR), being defined as the difference between these
two bands divided by their sum:
NDVI = (NIR-RED) / (NIR + RED).
• NDVI is a "measure" of development and vegetation density and is associated with
biophysical parameters as: biomass, leaf area index (LAI), used widely in crop growth
models, the percentage of vegetation cover of the land, photosynthetic activity of
vegetation.
• NDVI values range from -1.0 to 1.0, with negative values indicating clouds and water,
positive values near zero indicating bare soil, and higher positive values of NDVI ranging
from sparse vegetation (0.1 - 0.5) to dense green vegetation (0.6 and above).
• Indirectly, NDVI is used to estimate the effects of rainfall over a period of time, to estimate
the state of vegetation for different crops, and environmental quality as habitat for various
animals, pests and diseases.

Vegetation indices (cont.)
The NDVI spatial distribution obtained from MODIS data (MOD09A1): 05.08-
05.09.2007 (droughty year)
05-12.08.2007
13-20.08.2007
21-28.08.2007
29.08-
05.09.2007
NDVI is an indicator
of presence, density
and health of
vegetation
compared to a pixel
(1km2); the positive
values are colored in
shades of green to
dark green and
negative values are
colored in shades
from yellow to
brown, indicating a
lack of vegetation or
bad health.

Vegetation indices (cont.)
The NDVI spatial distribution obtained from MODIS data (MOD09A1): 05.08-
05.09.2014
05-12.08.2014
13-20.08.2014
21-28.08.2014
29.08-
05.09.2014
NDVI is an indicator
of presence, density
and health of
vegetation
compared to a pixel
(1km2); the positive
values are colored in
shades of green to
dark green and
negative values are
colored in shades
from yellow to
brown, indicating a
lack of vegetation or
bad health.

Vegetation indices (cont.)
The NDVI spatial distribution obtained from SPOT 7 data
NDVI is an indicator of
presence, density and
health of vegetation
compared to a pixel
(1km2); the positive values
are colored in shades of
green to dark green and
negative values are
colored in shades from
yellow to brown, indicating
a lack of vegetation or bad
health.

Vegetation indices (cont.)
• The Normalized Difference Water Index (NDWI) is a satellite-derived index from the Near-
Infrared (NIR) and Short Wave Infrared (SWIR) reflectance channels:
𝑁𝐷𝑊𝐼=(𝑁𝐼𝑅 −𝑆𝑊𝐼𝑅)/(𝑁𝐼𝑅+𝑆𝑊𝐼𝑅)
• where SWIR and NIR are spectral reflectance from short wave infrared band and near-
infrared regions, respectively.
• NDWI values range from -1.0 to 1.0. The common range for green vegetation is -0.1 to
0.4. This index increases with vegetation water content or from dry soil to free water.
• NDWI index is a good indicator of water content of leaves and is used for detecting and
monitoring the humidity of the vegetation cover. It is well known that during dry periods,
the vegetation is affected by water stress, which influence plant development and can
cause damage to crops. Because it is influenced by plants dehydration and wilting, NDWI
may be a better indicator for drought monitoring than NDVI. By providing near real-time
data related to plant water stress to the users can be improved water management,
particularly by irrigating agricultural areas affected by drought, according to water needs.

Vegetation indices (cont.)
The NDWI spatial distribution obtained from MODIS data (MOD09A1): 05.08-
05.09.2007 (droughty year)
05-12.08.2007
13-20.08.2007
21-28.08.2007
29.08-
05.09.2007
NDWI index is a
good indicator of
water content of
leaves; the positive
values (NDWI > 0.3)
are colored in
shades of green to
dark blue and
negative values
(NDWI < 0.2) are
colored in shades
from light green to
brown, indicating
vegetation affected
by water stress.

Vegetation indices (cont.)
The NDWI spatial distribution obtained from MODIS data (MOD09A1): 05.08-
05.09.2014
05-12.08.2014
13-20.08.2014
21-28.08.2014
29.08-
05.09.2014
NDWI index is a
good indicator of
water content of
leaves; the positive
values (NDWI > 0.3)
are colored in
shades of green to
dark blue and
negative values
(NDWI < 0.2) are
colored in shades
from light green to
brown, indicating
vegetation affected
by water stress.

Vegetation indices (cont.)
• The Normalized Difference Drought Index (NDDI) NDDI is a relatively new superior drought
indicator. It is calculated as the ratio of the difference between the normalized difference
vegetation index and normalized difference water index and their sum:
NDDI = (NDVI - NDWI) / (NDVI + NDWI)
• It combines information from visible, NIR, and SWIR channel. NDDI can offer an
appropriate measure of the dryness of a particular area, because it combines information
on both vegetation and water.
• NDDI had a stronger response to summer drought conditions than a simple difference
between NDVI and NDWI, and is therefore a more sensitive indicator of drought.
• This index can be an optimal complement to in-situ based indicators or for other indicators
based on remote sensing data.

Vegetation indices (cont.)
The NDDI spatial distribution obtained from MODIS data (MOD09A1): 05.08-
05.09.2007 (droughty year)
05-12.08.2007
13-20.08.2007
21-28.08.2007
29.08-
05.09.2007
NDDI had a stronger
response to summer
drought; NDDI > 0.4
values, colored in
shades from yellow
to red, are indicating
vegetation affected
drought.

Vegetation indices (cont.)
The NDDI spatial distribution obtained from MODIS data (MOD09A1): 05.08-
05.09.2014
05-12.08.2014
13-20.08.2014
21-28.08.2014
29.08-
05.09.2014
NDDI had a stronger
response to summer
drought; NDDI > 0.4
values, colored in
shades from yellow
to red, are indicating
vegetation affected
drought.

MODIS NDVI over Covasna county
21.07 - 13.08.2013
21.07 – 28.07.2013 29.07 – 5.08.2013 6.08 – 13.08.2013
Date Soil moisture
(mc/ha)
% CAu (Soil water supply
capacity)
Classes
10.07.2013 1216 76 %CAu Close to the optimal supply
20.07.2013 883 55 %CAu Satisfactory supply
31.07.2013 695 43 %CAu Moderate pedological drought
10.08.2013 548 34 %CAu Strong pedological drought
20.08.2013 667 42 %CAu Moderate pedological drought
The soil moisture and soil water supply capacity values recorded at
the agrometeorological station Sfantu Gheorghe.

MODIS NDVI evolution over Covasna county 29.07 - 5.08.2010; 2011; 2012 and 2013
Land cover/land use map
over Covasna Study Area
29.07 – 5.08.2012Moderate pedological drought
29.07 – 5.08.2010Close to the optimal supply
29.07 – 5.08.2011Satisfactory supply
29.07 – 5.08.2013Moderate pedological drought

MODIS NDVI-13.08.2012
Date Soil moisture
(mc/ha)
% CAu (Soil water
supply capacity)
Classes
10.07.2012 811 mc/ha 51 %CAu Satisfactory supply
20.07.2012 804 mc/ha 51 %CAu Satisfactory supply
31.07.2012 679 mc/ha 42 %CAu Moderate pedological drought
10.08.2012 636 mc/ha 40 %CAu Moderate pedological drought
20.08.2012 571 mc/ha 36 %CAu Moderate pedological drought
21.07 – 28.07.2012 29.07 – 5.08.2012 6.08 – 13.08.2012
NDWI
NDDI

Date Soil moisture (mc/ha) % CAu (Soil water supply capacity) Classes
10.07.2013 1216 76 %CAu Close to the optimal supply
20.07.2013 883 55 %CAu Satisfactory supply
31.07.2013 695 43 %CAu Moderate pedological drought
10.08.2013 548 34 %CAu Strong pedological drought
20.08.2013 667 42 %CAu Moderate pedological drought
21.07 – 28.07.2013 29.07 – 5.08.2013 6.08 – 13.08.2013
NDWI
NDDI
MODIS NDWI and NDDI over Covasna county on 21.07
-13.08.2013

The minimum values of NDVI NDWI and NDII are recorded in the period 20.07-
15.08.2013, due to the lack of precipitation and decrease of the in-soil moisture
reserve. For this period NDDI has maximum values between 0.2 - 0.4.
Analysis of vegetation state evolution with satellite-based indices
in Sfantu Gheorghe area on 24 April – 3 Dec. 2013

Using remote sensing data for drought monitoring
Conclusions
• The vegetation indexes extracted from satellite images, correlated with meteorological and
agrometeorological information, are good indicators of vegetation condition, in this case are
relevant for monitoring the beginning, duration and intensity of drought.
• Remote sensing techniques can enhance and improve the drought analysis, especially
considering the scarce availability of measured ground truth data.
• The advantage of multi-annual imagery availability allows the overlay and cross-checking of
doughty, normal or rainy years.
• GIS technologies offer the possibility of crossed-analysis between various data sources
such as vegetation indexes and CORINE land-cover classes.
• Referring to the entire image without offering information on how vegetation indices reflects
the behavior of various land-cover classes under drought stress.
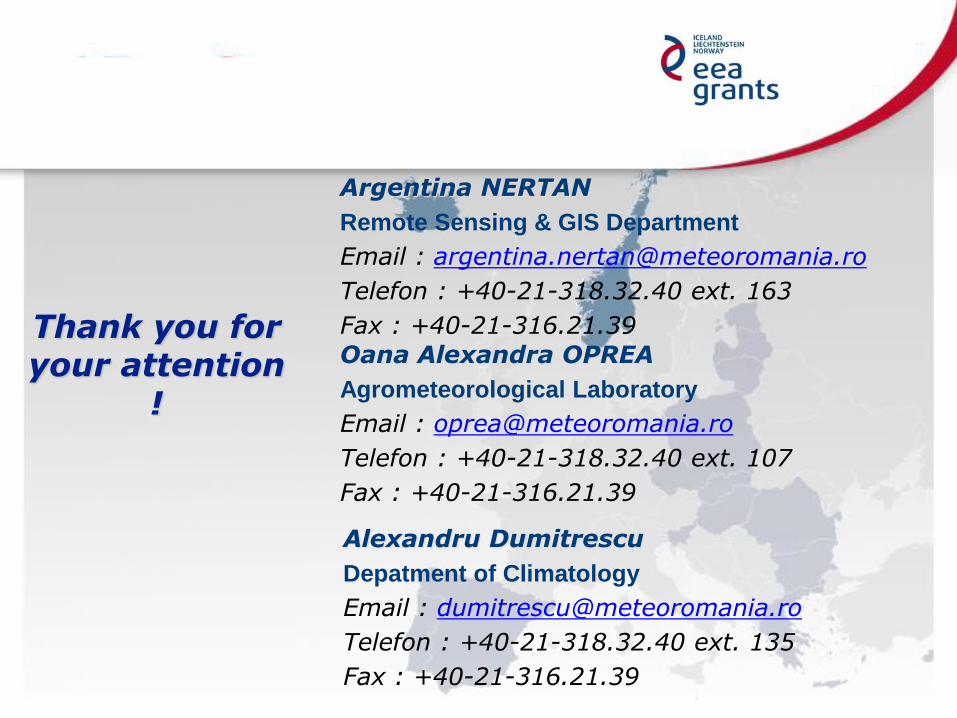
Thank you for your attention
!
Argentina NERTAN
Remote Sensing & GIS Department
Email : [email protected]
Telefon : +40-21-318.32.40 ext. 163
Fax : +40-21-316.21.39
Oana Alexandra OPREA
Agrometeorological Laboratory
Email : [email protected]
Telefon : +40-21-318.32.40 ext. 107
Fax : +40-21-316.21.39
Alexandru Dumitrescu
Depatment of Climatology
Email : [email protected]
Telefon : +40-21-318.32.40 ext. 135
Fax : +40-21-316.21.39