Operations Performance. Time, Trade-offs and Targeting.
37
Operations Performance
-
Upload
kristina-norton -
Category
Documents
-
view
216 -
download
0
Transcript of Operations Performance. Time, Trade-offs and Targeting.
Operations Performance

Time, Trade-offsand
Targeting

The relative importance of the market requirements and operations resource perspectives change over time,
how performance objectives trade-offs between each other and
operations focus can lead to exceptional performance
TRADE-OFFS
Performance objective APerf
orm
ance
obje
ctiv
e B
?Relative
importance of the
Operations Resource
perspective
Relative importance
of the Market
Requirements
perspective

Broad strategic objectives for a parcel delivery operation applied to stakeholder
groupsSociety
Increase employmentEnhance community well-beingProduce sustainable productsEnsure clean environment
CustomersAppropriate product or service specificationConsistent qualityFast deliveryDependable deliveryAcceptable price
SuppliersContinue businessDevelop supplier capabilityProvide transparent information
ShareholdersEconomic value from investmentEthical value from investment
EmployeesContinuous employmentFair payGood working conditionsPersonal development

Com
peti
tiveness
The operations function can provide a competitive advantage through its
performance at the five competitive objectives
Quality
Being RIGHT
Speed Being FAST
Dependability
Being ON TIME
Cost Being PRODUCTIVE
Being ABLE TO CHANGE
Flexibility

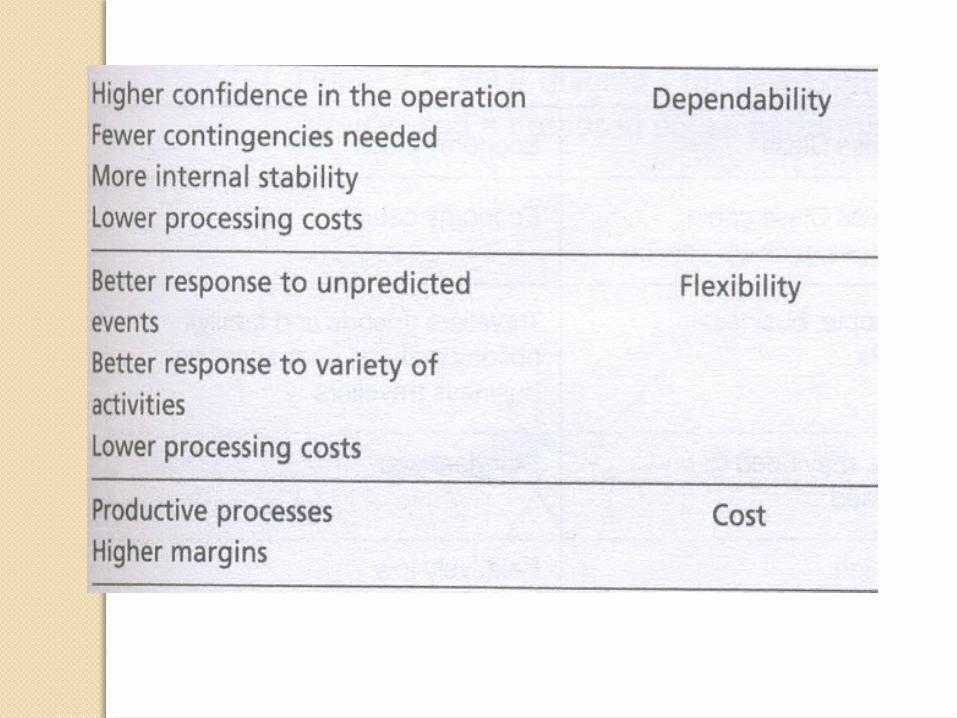
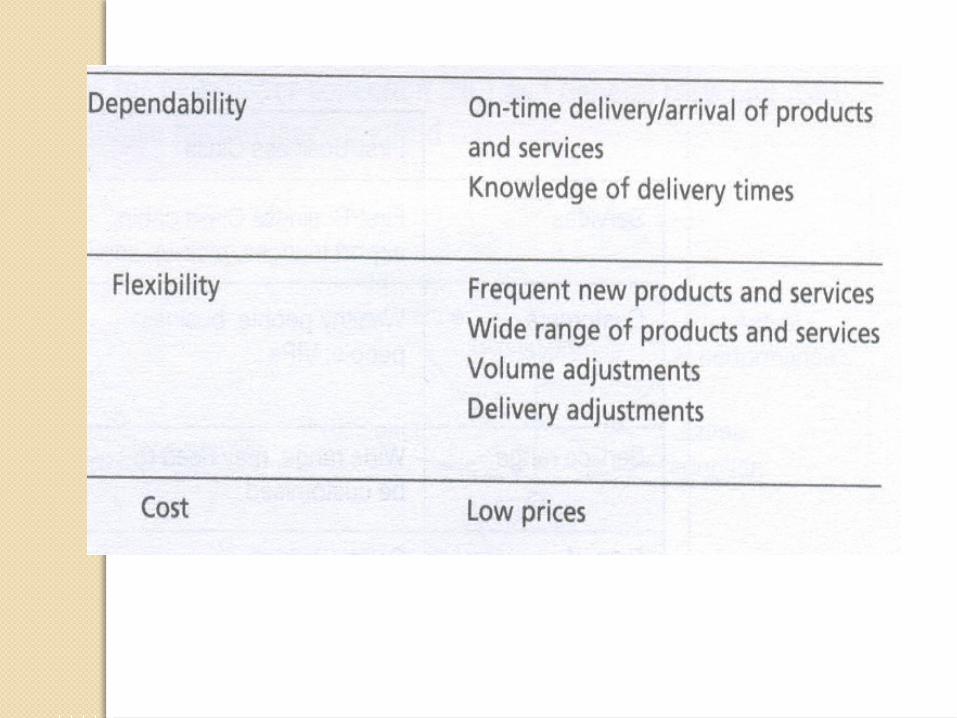
Internal and external benefits of excelling in each performance objective


‘Installed’ product/service fully
operational
End of coreprocessing
Start of coreprocessing
Request for product/service
Receipt ofinformation
Request forinformation
Awareness of need
MilestoneHospital Software producerPresentatio
n of symptoms
Visit to doctor for advice and
tests
Test information confirms diagnosis
Decide on surgery
Enter hospital for surgery
Procedure successfully
completed
Patient fully recovered
Installation time
Waiting time
Enquiry time
Core processing time
Customer decision time
Enquiry decision time Asks for
specification and estimates
Receives proposal
Places order
Start of design and coding
Software ‘completed’
Software fully debugged and working
Customer decides new software is needed
Significant ‘milestone’ times for the delivery of two products/services
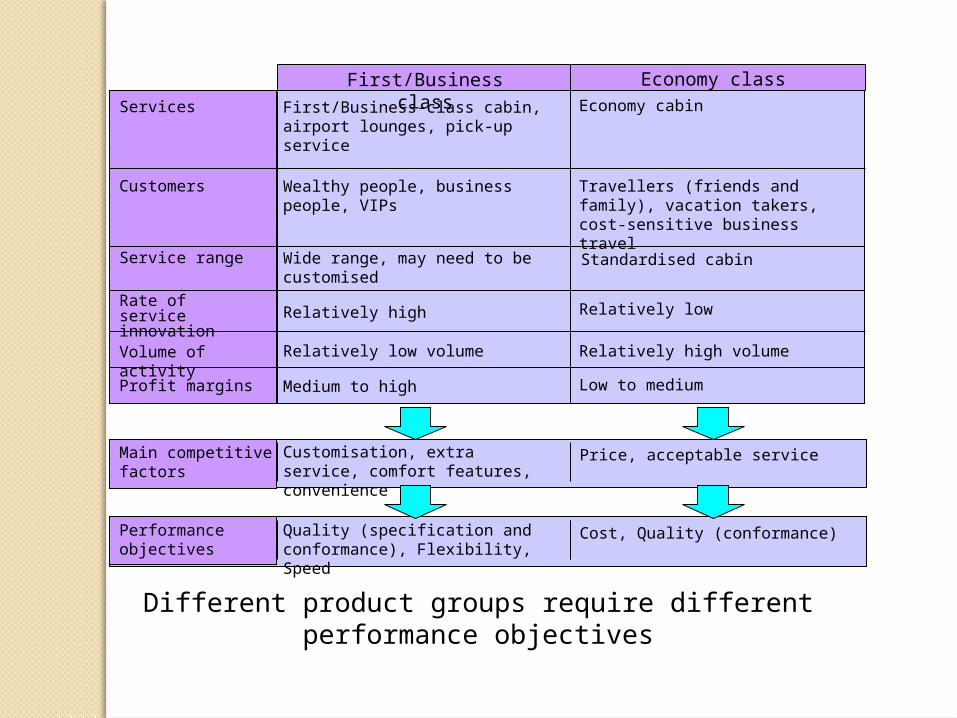
First/Business-class cabin,airport lounges, pick-up service
Economy cabin
Wealthy people, businesspeople, VIPs
Travellers (friends and family), vacation takers, cost-sensitive business travel
Wide range, may need to be customised
Standardised cabin
Relatively high Relatively low
Relatively low volume Relatively high volume
Medium to high Low to medium
First/Business class Economy class
Customisation, extra service, comfort features, convenience
Quality (specification andconformance), Flexibility, Speed
Price, acceptable service
Cost, Quality (conformance)
Services
Customers
Service range
Rate of service innovation
Volume of activity
Profit margins
Main competitive factors
Performance objectives
Different product groups require different performance objectives

Polar diagrams are particularly useful when summarizing any company’sperformance objectives.
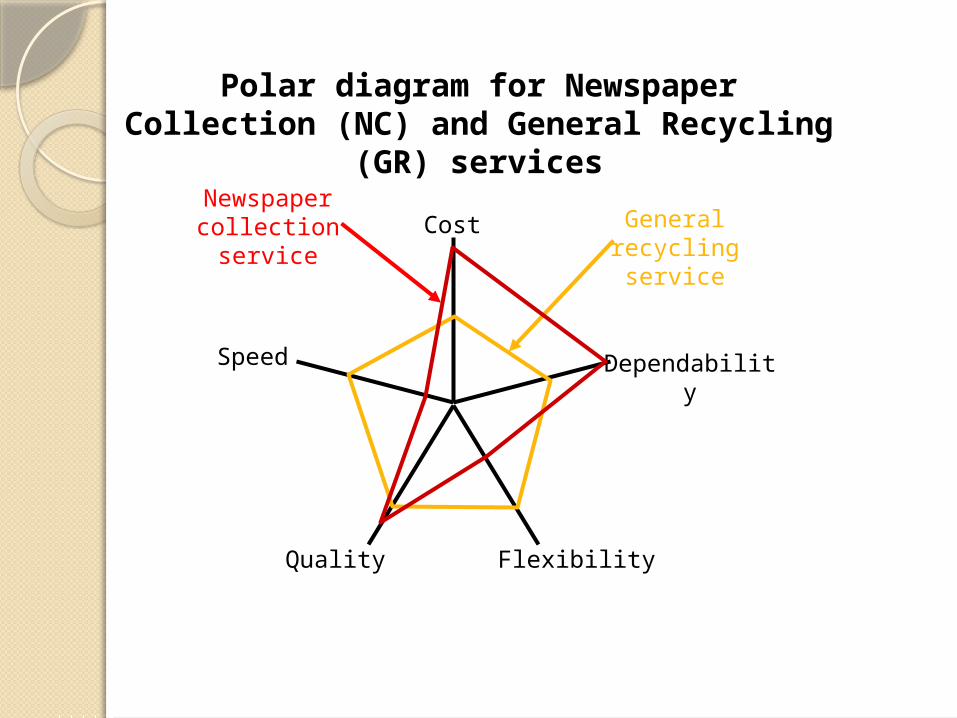
Cost General recycling service
Polar diagram for Newspaper Collection (NC) and General Recycling (GR)
services
Dependability
FlexibilityQuality
Newspaper collection service
Speed

ReassuranceActual
performance
Crime reduction
Crime detection
Working with criminal justice
agencies
Required performance
Efficiency
Polar diagram for a proposed police performance method

The effects of the product/service life cycle on operations performance objectives
Sale
s volu
me
Customers
Competitors
Dominant operations
performance objectives
Introduction into
market
Growth in market
acceptanceMaturity of
market, sales level off Decline as
market become
saturatedInnovators
Early adopters
Bulk of market
Laggard
Likely order winners
Few /none
Increasing numbers
Stable numbers
Declining numbers
Product/service specification
Availability Low priceDependable supply
Low price
Likely order qualifiers
QualityRange
PriceRange
RangeQuality
Dependable supply
FlexibilityQuality
SpeedDependabilityQuality
CostDependability
Cost

The effects of the product/service life cycle on the organisation
Sale
s volu
me
Introduction Growth Maturity Decline
Likely order winners
Product/service characteristics, performance or novelty
Availability of quality products/services
Low priceDependable
supply
Low price
Likely qualifiers
QualityRange
Price Range
QualityRange
Dependable
supply
Dominant operations
performance objectives
FlexibilityQuality
SpeedDependabilityQuality
CostDependability
Cost

Delights become Order winners and Order winners become Qualifiers
Adding DelightsOrder Winners gain more business the better you are
Low HighNegative
Positive
Neutral
Achieved performance
Com
peti
tive b
enefit
Time
Delights
Order winners
Qualifiers
Qualifiers are the ‘givens’ of doing business

What performance objectives are Qualifiers, Order Winners and Delights ?
Delights
Order winners
Qualifiers
Today Tomorrow
… and in the future ?
???
What is the operation doing today to develop the capabilities which will provide the ‘Delights’ of the future ?
The illustration of how performance objectives change over time used is that of VW.
One could then identify the various phases that the business may have gone through and the associated changes in the relative importance of performance objectives.

The VW Group operates 45 production plants in eleven European countries and a further seven countries in the Americas, Asia and Africa.
Around the world, more than 336,000 employees produce over 21,500 vehicles or are involved in vehicle-related services on every working day.

Operations strategy of volkswagenwerk
1920–2004Before 1939•Ferdinand Porshe - ‘People’s Car’ 1920s•Government support 1934 – plant on stream
1939•1939 War – plant turned to production of war vehicles•1948 Nordhoff put in charge
1948•Nordhoff takes half a strategy – people’s car•Adds emphasis on quality, technical, export, service standards
1949–1958•Intended strategy realised•Car ideal for post-war conditions•Rapid expansion in volume•No new models (work on new model halted in 1954)

1959–1964•Increased competition and changes in tastes•Response - increased advertising
- design started for 1500 •Original strategy unchanged in essentials 1960–1964• 1500 model introduced•Sales increased but profits squeezed
1965–1975•Pressures of competition become severe•New strategy from audi - front wheeled drive, stylish,
watercooled•Other lines dropped•Production rationalised on world basis•Marketing emphasised performance, reliability and service1976–1989•Golf established as market leader•Continued emphasis on technical excellence•Old designs periodically fashionable•Main European competitor seen as Fiat•Some pressure from Japanese manufacturing

1990–1996•Increasing pressure on costs from Japanese manufacturers•German labour costs and exchange rate are disadvantageous•Latterly European recession increases pressure•Cost cutting measures – East European plant – aggressive purchasing1997–2000•Developing separate branding strategies to occupy different market segments•Develop separate products from common platforms to reduce cost •Continue aggressive cost reduction and process improvement 2001•Modify common platform policy to ease brand erosion
2002/5•Renewed cost pressures focus attention on input costs also hit by scandals!!2006•Sales recovering, speculation over Russian plant
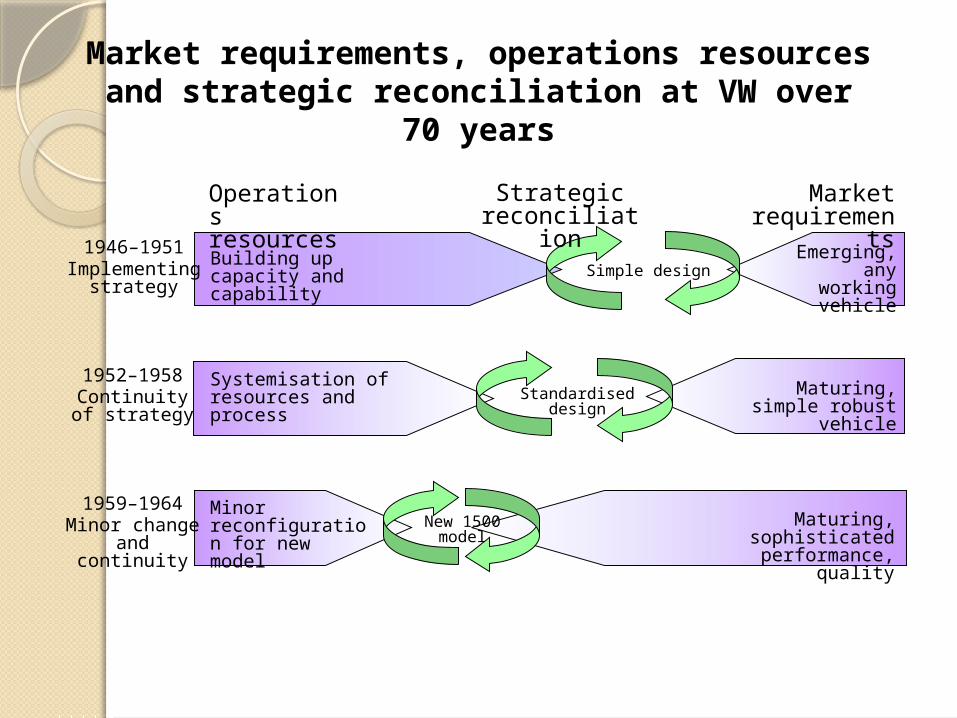
1946–1951Implementing
strategy
Building up capacity and capability Simple design
Standardised design
Systemisation of resources andprocess
Emerging, any
working vehicle
Maturing, simple robust vehicle
Minor reconfiguration for new model
Maturing, sophisticated
performance, quality
New 1500 model
Operations resources
Market requirement
s
1952–1958Continuity of
strategy
1959–1964Minor change and continuity
Strategic reconciliation
Market requirements, operations resources and strategic reconciliation at VW over 70
years

1965–1970Search for
viable strategy
Fragmented acquisition of new resources
Multiple new designs
Defined rangeAdapt best practices from enlarged group
Uncertain rejection of VW
traditional products
Clarifying around style, quality and
variety
Accommodate new models and acquisitions
Segmentation around performance, style
and variety
Product development
paths
Operations resources
Market requirement
s
1971–1975Emergent strategy
1976–1979Continuing with minor changes
Strategic reconciliation
Market requirements, operations resources and strategic reconciliation at VW over 70
years

1990–1996Major change
(internal)
Drastic reconfiguration to increase efficiency, reduce costs
Design for low- cost
manufacture
Common product
platforms
Continuous process improvement and cost reduction
Increasingly competitive
around price
Branding with price, quality,
andstyle
Lean process improvement and more low-cost locations
Increasingly competitive around
price and innovationModular design
Operations resources
Market requirement
s
1997–2000Implementing
strategy
2001–2007Implementing
strategy
Strategic reconciliation
Market requirements, operations resources and strategic reconciliation at VW over 70
years

Trade-offs
‘Do you want it good, or do you want it on Tuesday?’
‘No such thing as a free lunch.’
‘You can’t have an aircraft which flies at the speed of sound, carries 400 passengers and lands on an aircraft carrier. Operations are just the same.’ (Skinner)
‘Trade-offs in operations are the way we are willing to sacrifice one performance objective to achieve excellence in another.’

‘Trade-offs are all in the mind. Look at how we used to think about the trade-off between cost and quality when buying automobiles. It was assumed that you had to spend money in order to get a car without defects. The Japanese showed us that it is perfectly possible to get great quality for a low price at the same time. In fact, achieving an error-freeproduction process actually reduced the cost of manufacturing the vehicle and therefore reducedthe price that could be charged. It’s the same with all other types of trade-off isn’t it?’

Performance objectives differ for different operations with different strategies.
An obvious way of demonstrating this is to take two well-known companies in different parts of the same sector competing in different ways.
This is evident by contrasting a well-known low-cost airline such as Ryanair with Virgin Atlantic’s upper class service.

X
Cost efficiency
Vari
ety
A
C
D
B
The ‘efficient frontier’ A
X C
D
Cost efficiencyVari
ety
B
The new ‘efficient frontier’
B1
The ‘efficient frontier’ view
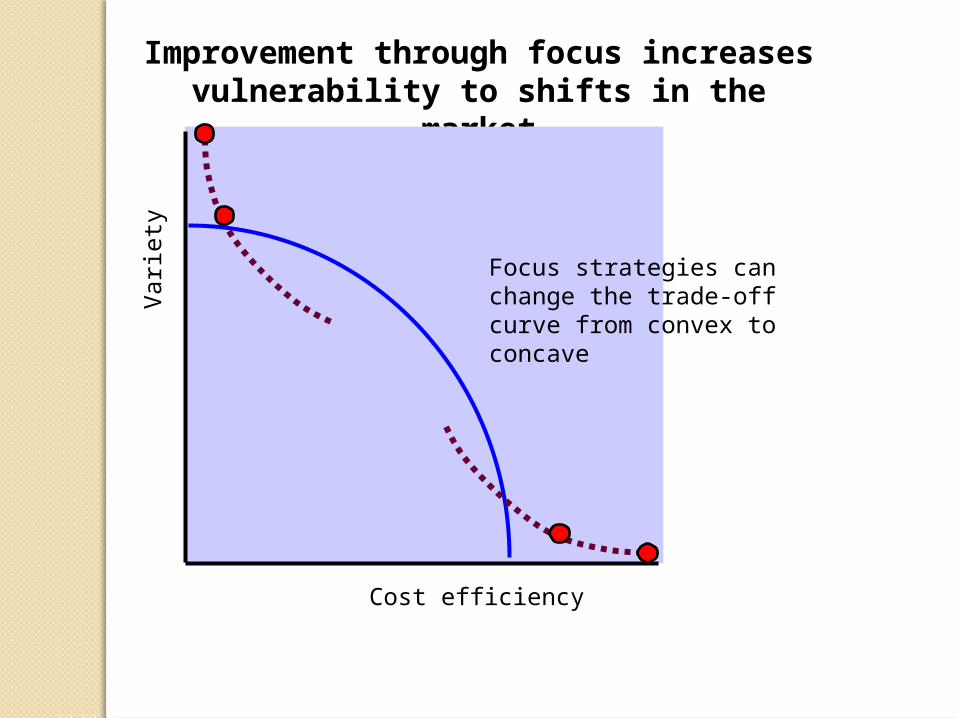
Improvement through focus increases vulnerability to shifts in the market
Cost efficiency
Vari
ety
Focus strategies can change the trade-off curve from convex to concave

Island
Army 1
Army 2
You are commanding Army 1, the objective is to capture the island. Army 2 has the
same objective

Island
Army 1
Army 2
Burning your bridges

In sum, there are four issues related to operations performance
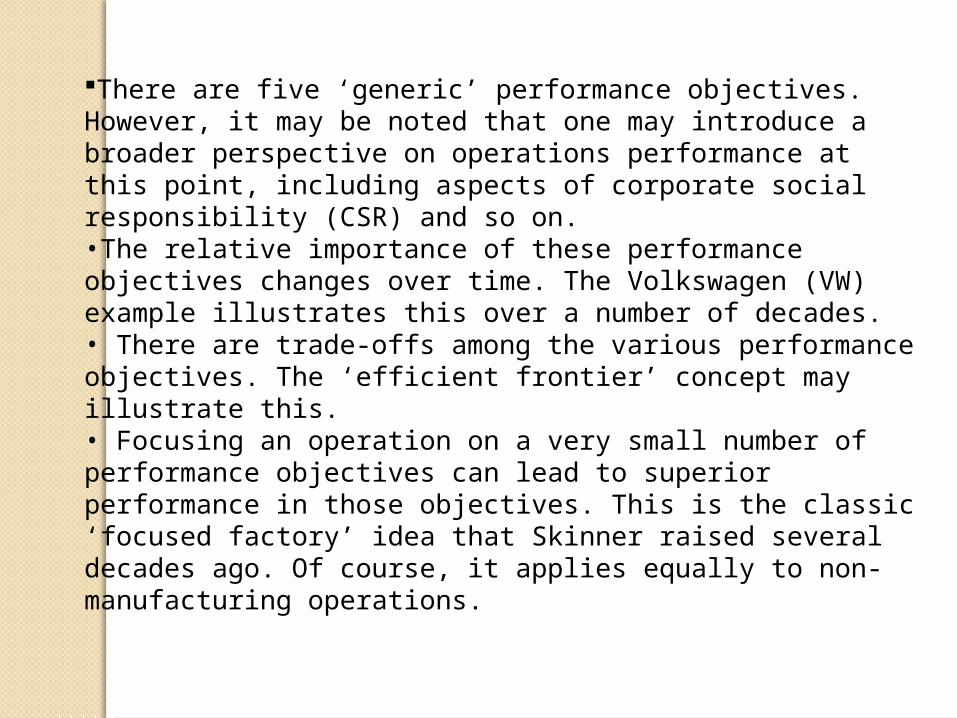
There are five ‘generic’ performance objectives. However, it may be noted that one may introduce a broader perspective on operations performance at this point, including aspects of corporate social responsibility (CSR) and so on.•The relative importance of these performance objectives changes over time. The Volkswagen (VW) example illustrates this over a number of decades. • There are trade-offs among the various performance objectives. The ‘efficient frontier’ concept may illustrate this. • Focusing an operation on a very small number of performance objectives can lead to superior performance in those objectives. This is the classic ‘focused factory’ idea that Skinner raised several decades ago. Of course, it applies equally to non-manufacturing operations.
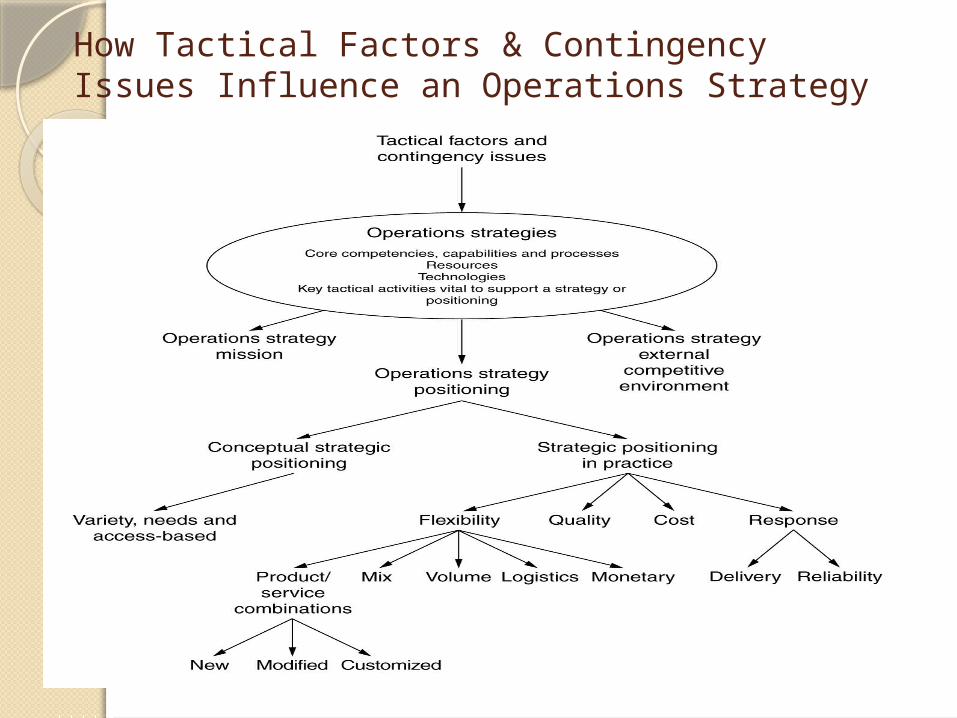
How Tactical Factors & Contingency Issues Influence an Operations Strategy