
OPERATIONS MANAGEMENT OPERATIONS AND PRODUCTIVITY $ Mo Money Mo Problems $
40
OPERATIONS MANAGEMENT OPERATIONS AND PRODUCTIVITY $ Mo Money Mo Problems $
-
date post
22-Dec-2015 -
Category
Documents
-
view
228 -
download
5
Transcript of OPERATIONS MANAGEMENT OPERATIONS AND PRODUCTIVITY $ Mo Money Mo Problems $
OPERATIONSMANAGEMENT
OPERATIONS
AND PRODUCTIVITY
$ Mo Money Mo Problems $
OUTLINE
What is Operations Management? The heritage of Operations Management Why study OM? What Operations Managers do?
Organizing to produce goods and services
Where are the OM jobs? Exciting new trends in Operations Management
Operations in the service sector
The Productivity challenge
LEARNING OBJECTIVES
When you complete this chapter, you should be able to:
Identify or Define: Production and productivity Operations Management (OM) What operations managers do Services
Describe or Explain: A brief history of operations management The future of the discipline Measuring productivity
WHAT IS OPERATIONS MANAGEMENT?
Operations Management is the set of activities that creates goods and services by transforming inputs into outputs
Operations Management focuses on carefully managing the processes to produce and distribute products and services.
AND PRODUCTION
Production is the creation of goods and services
SIGNIFICANT EVENTS IN OPERATIONS MANAGEMENT
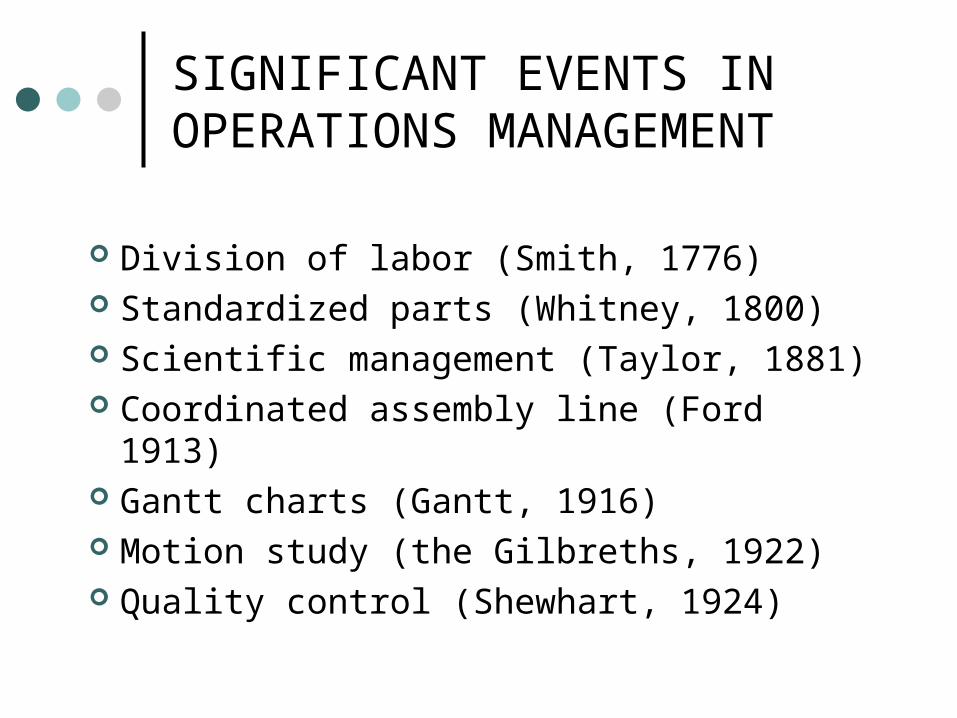
Division of labor (Smith, 1776) Standardized parts (Whitney, 1800) Scientific management (Taylor, 1881) Coordinated assembly line (Ford 1913) Gantt charts (Gantt, 1916) Motion study (the Gilbreths, 1922) Quality control (Shewhart, 1924)
SCIENTISTS
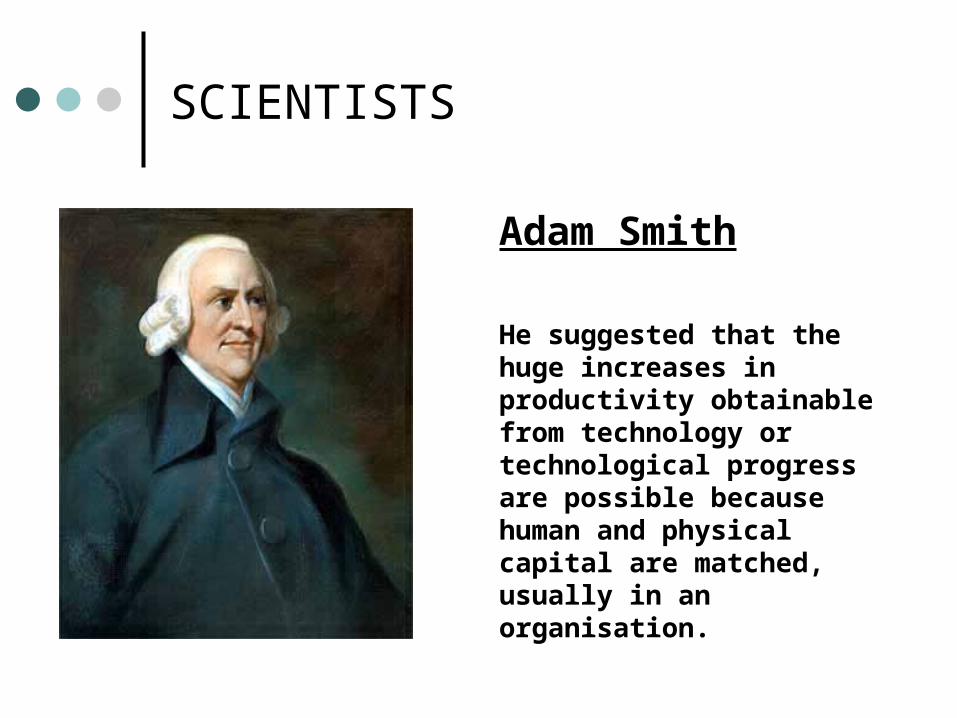
Adam Smith
He suggested that the huge increases in productivity obtainable from technology or technological progress are possible because human and physical capital are matched, usually in an organisation.
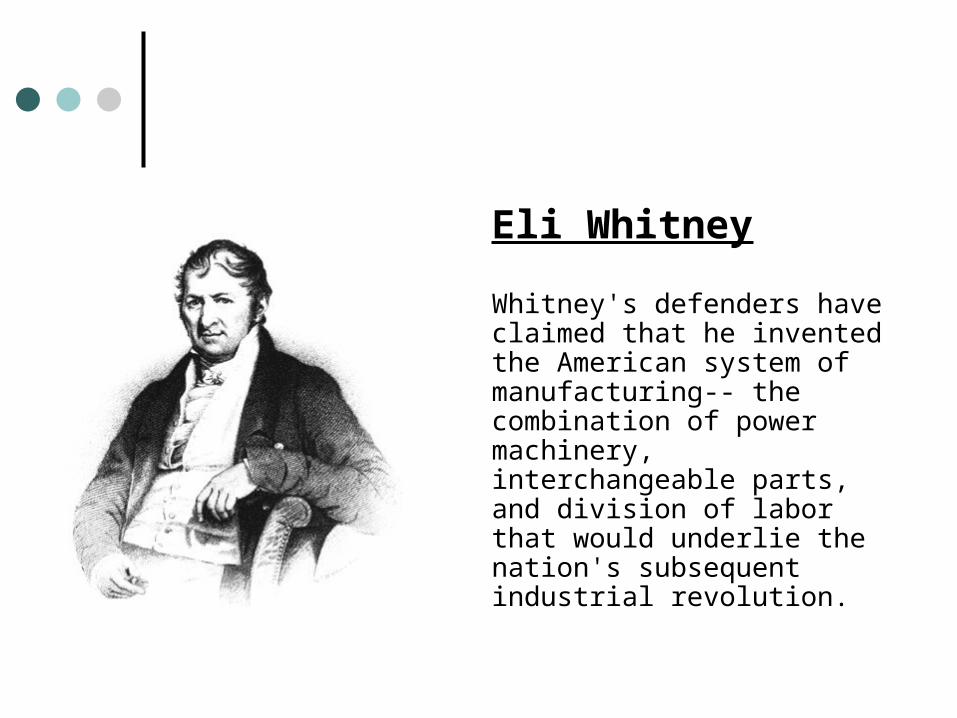
Eli Whitney
Whitney's defenders have claimed that he invented the American system of manufacturing-- the combination of power machinery, interchangeable parts, and division of labor that would underlie the nation's subsequent industrial revolution.
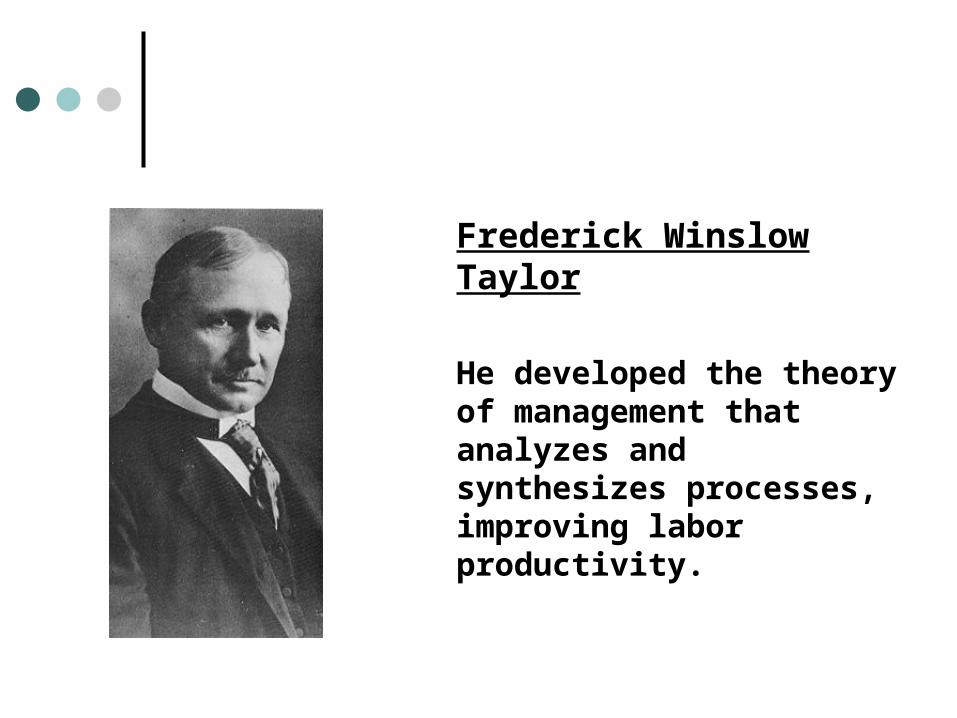
Frederick Winslow Taylor
He developed the theory of management that analyzes and synthesizes processes, improving labor productivity.
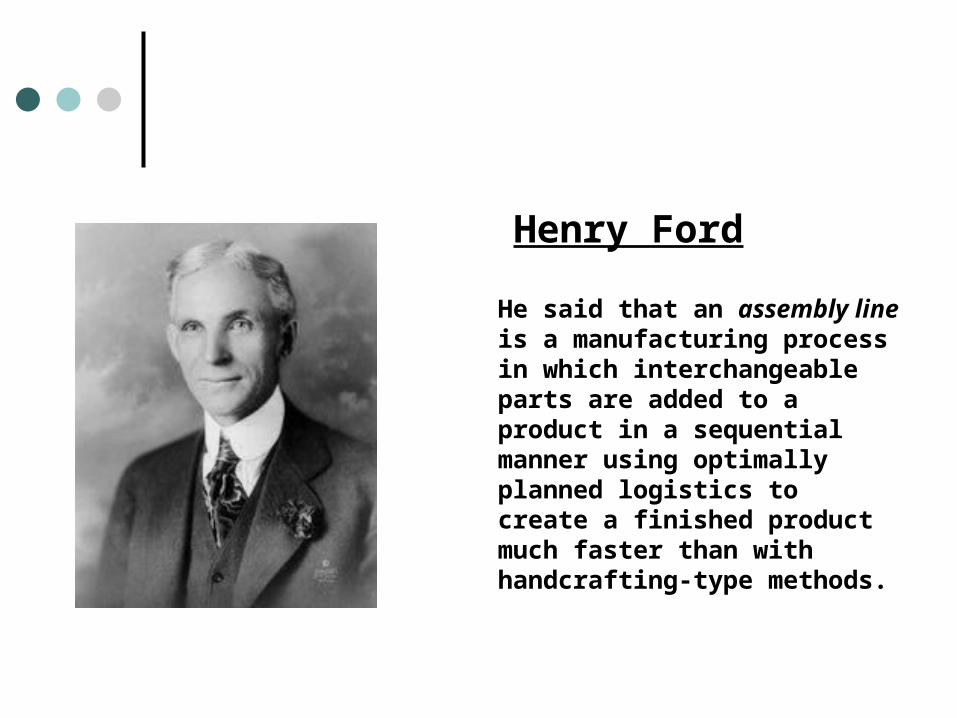
Henry Ford
He said that an assembly line is a manufacturing process in which interchangeable parts are added to a product in a sequential manner using optimally planned logistics to create a finished product much faster than with handcrafting-type methods.
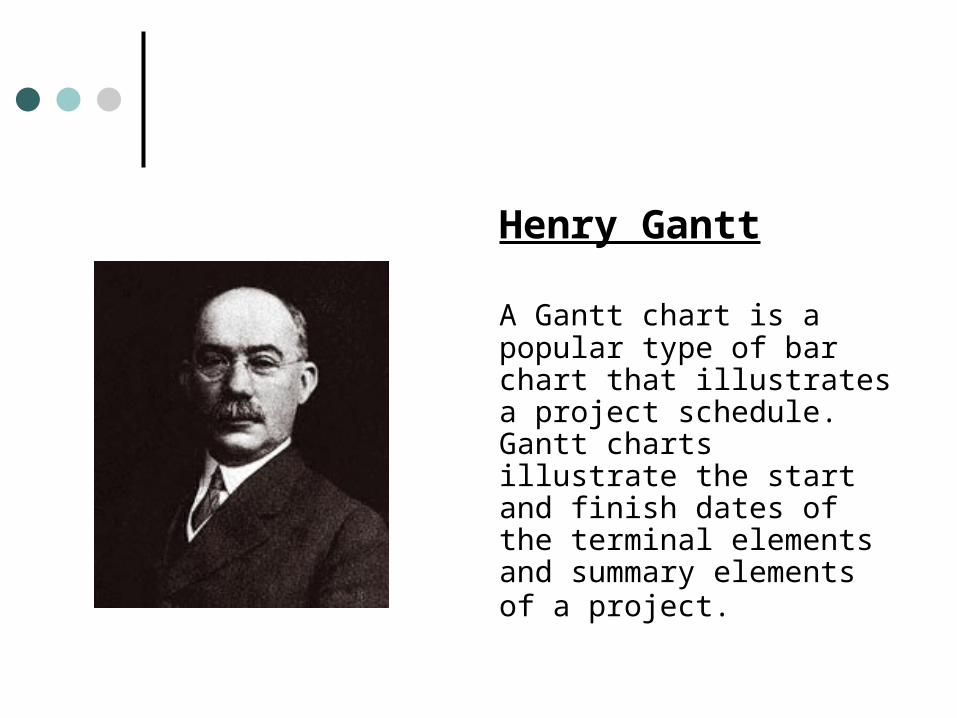
Henry Gantt
A Gantt chart is a popular type of bar chart that illustrates a project schedule. Gantt charts illustrate the start and finish dates of the terminal elements and summary elements of a project.
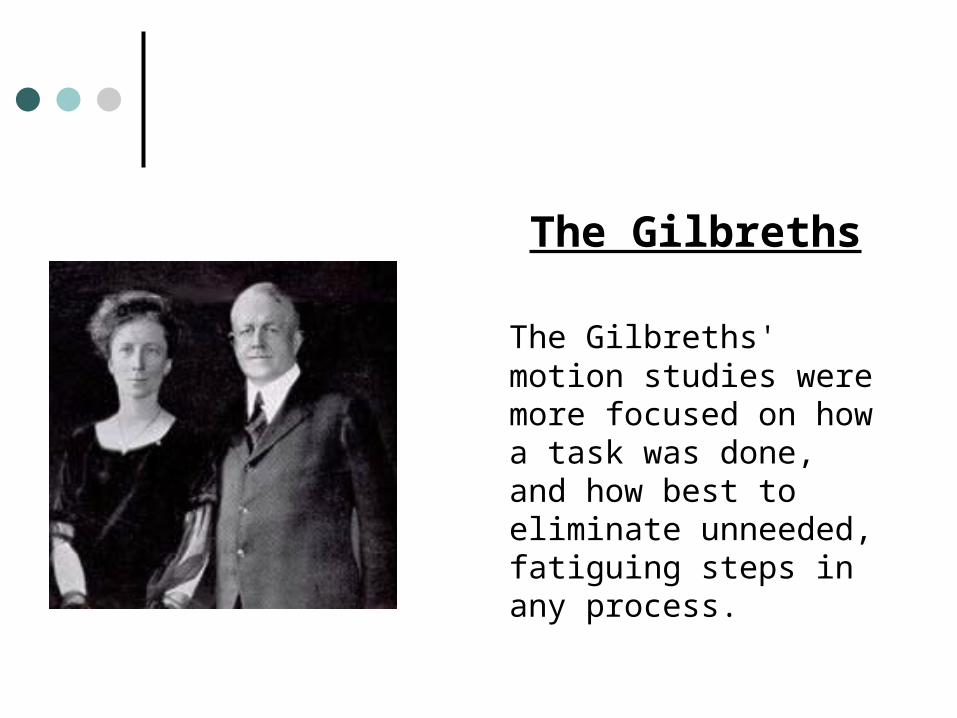
The Gilbreths
The Gilbreths' motion studies were more focused on how a task was done, and how best to eliminate unneeded, fatiguing steps in any process.
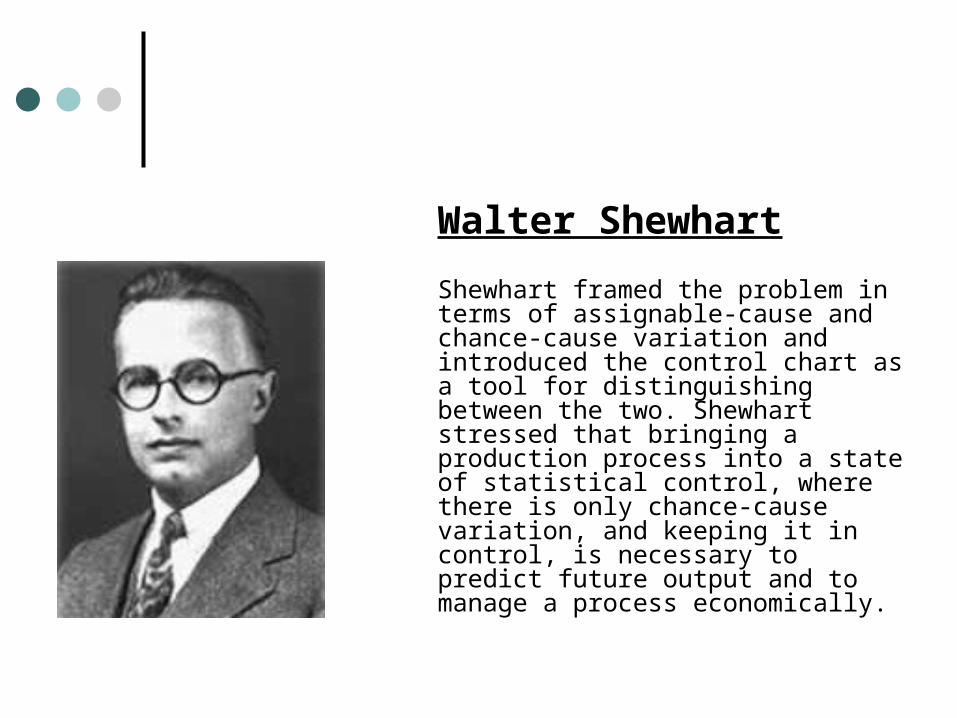
Walter Shewhart
Shewhart framed the problem in terms of assignable-cause and chance-cause variation and introduced the control chart as a tool for distinguishing between the two. Shewhart stressed that bringing a production process into a state of statistical control, where there is only chance-cause variation, and keeping it in control, is necessary to predict future output and to manage a process economically.
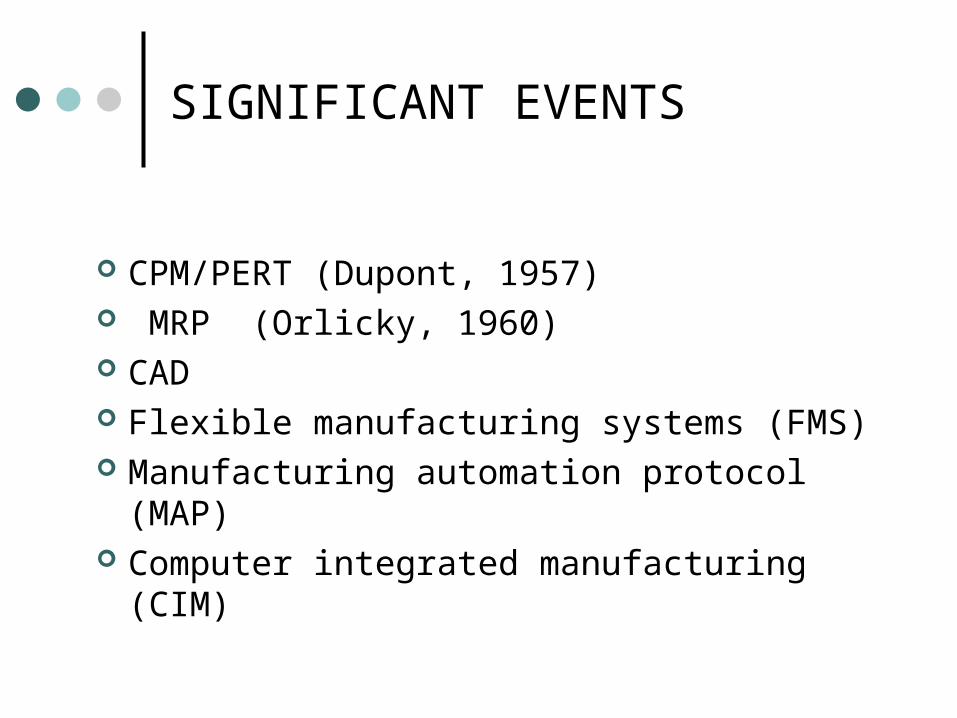
SIGNIFICANT EVENTS
CPM/PERT (Dupont, 1957) MRP (Orlicky, 1960) CAD Flexible manufacturing systems (FMS) Manufacturing automation protocol (MAP) Computer integrated manufacturing (CIM)
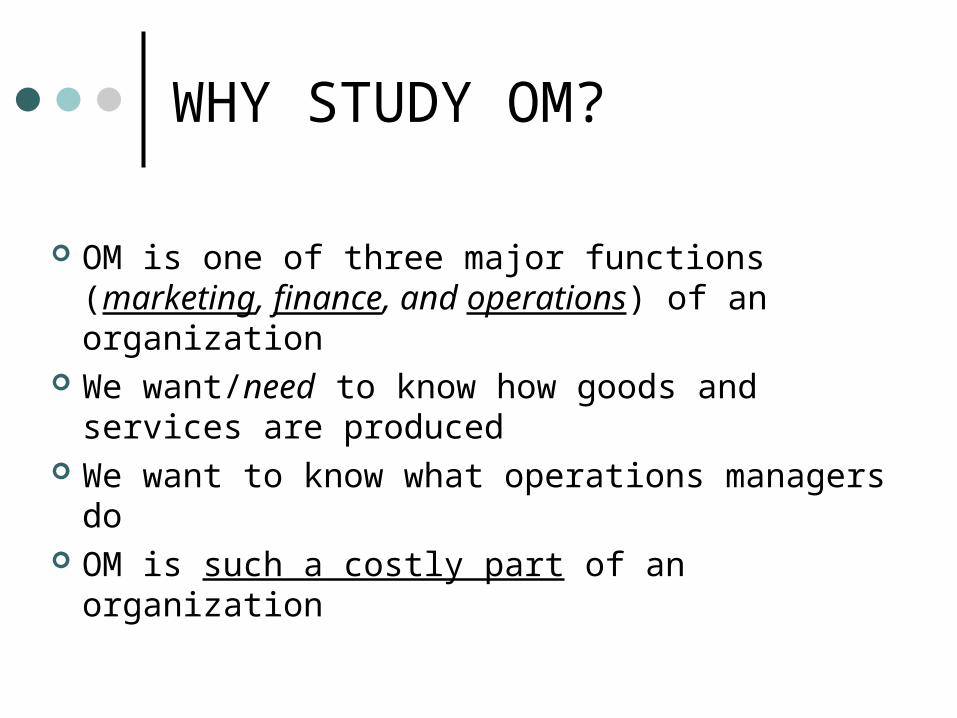
WHY STUDY OM?
OM is one of three major functions (marketing, finance, and operations) of an organization
We want/need to know how goods and services are produced
We want to know what operations managers do OM is such a costly part of an organization
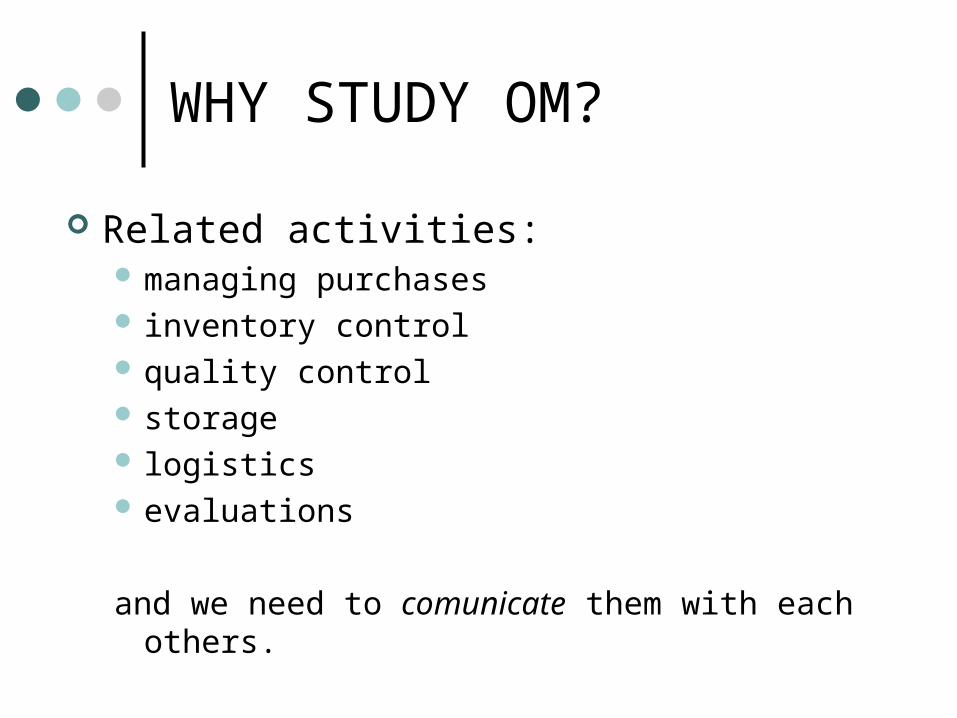
WHY STUDY OM?
Related activities: managing purchases inventory control quality control storage logistics evaluations
and we need to comunicate them with each others.
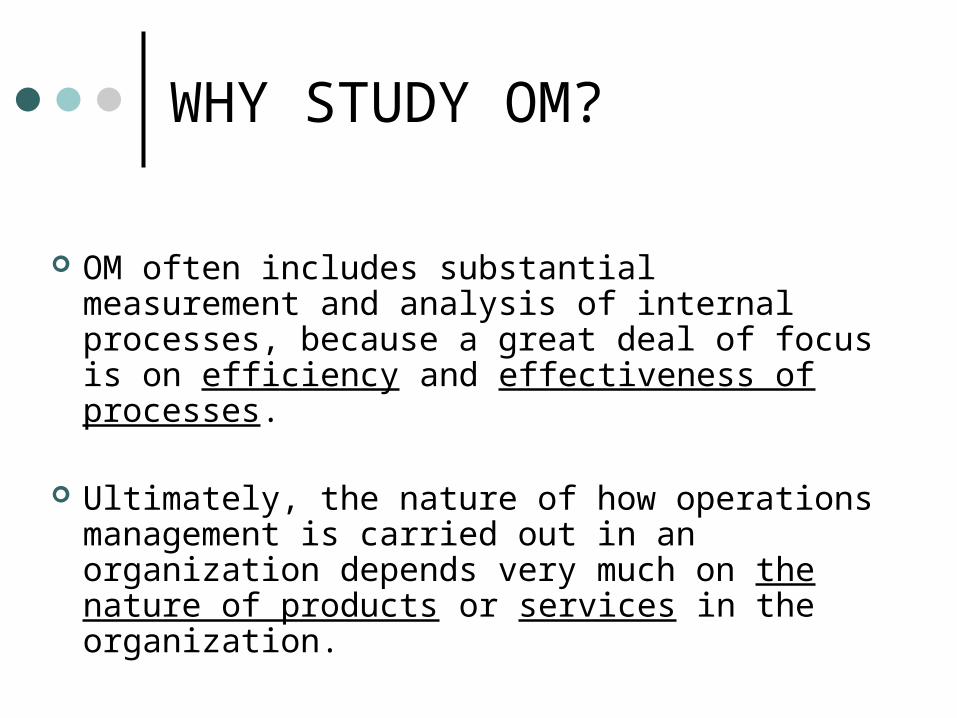
WHY STUDY OM?
OM often includes substantial measurement and analysis of internal processes, because a great deal of focus is on efficiency and effectiveness of processes.
Ultimately, the nature of how operations management is carried out in an organization depends very much on the nature of products or services in the organization.
WHAT OPERATIONS MANAGERS DO (by Henri Fayol):
Plan Organize Staff Lead Control
PLANNING
The process of deciding what to do. Effective planning seeks to answer questions such as:
What should the firm do? The output of this process are goals and objectives. When must the firm achieve these goals? The output is a schedule defining
milestones and due dates. Who is responsible for doing it? The outputs are assigned responsibilities. How should this be done? The outputs may be directions or plans of action. How should performance be measured? The output includes standards of
performance.
Planning is forward looking. When planning is operational, the planning horizon is shorter and the level of detail within is greater. When strategic, the planning horizon is long and done in less detail.
ANALYSING
The process of making sense of data that is often: poorly structured, incomplete, inconsistent, inaccurate, and/or available in overwhelming quantities.
Analysis supports the planning process byproviding the “facts” in useful formats that can then be used to evaluate business alternatives.
Analyzing also supports management’s control activity by providing the basis for corrective actions.
ORGANIZING
The process of building organization structures and interrelated task coordination teams. In the past, organizing dealt mostly with humans, but increasingly it involves data-getting:
the right person the right information in the right form at the right time
those factors are the key success in organization design.
DIRECTING/IMPLEMENTING
An action-oriented process that carries out the outputs of the first three management activities.
This is where money is made and lost (!). In this process, management expends
resources to perform the tasks defined by the planning process.
CONTROLLING
The process of measuring the results of the other four management activities.
Were the plans any good? Did the analysis provide meaningful information to the
other processes? How well did we organize our resources to get the job
done? How well did we do it?
We might even add, how well did we measure the performance of our control function?
10 CRITICAL DECISIONS
Service, product design Quality management Process, capacity design Location Layout design Human resources, job design. Supply-chain management Inventory management Scheduling Maintenance
SECTION OF OM
Procurement (Purchasing) Practices• reviews guidelines for buying various materials from
suppliers and vendors - materials, including computers, services from lawyers, insurance, etc.
Management Control and Coordinating Function• includes a broad range of activities to ensure that
organizational goals are consistently being met in an effective and efficient fashion
SECTION OF OM
Product and Service Management• the major activities involved in product and service
management are similar to those in operations management. However, operations management is focused on the operations of the entire organization, rather than managing a product or service.
Quality Management• is crucial to effective operations management,
particularly continuous improvement. More recent advancements in quality, such as benchmarking and Total Quality Management, have resulted in advancements to operations management as well.
SECTION OF OM
Inventory Management• Costs can be substantial to store and move
inventory. Innovative methods, such as Just-in-Time inventory control, can save costs and move products and services to customers more quickly.
Logistics and Transportation Management• is focused on the flow of materials and goods from
suppliers, through the organization and to the customers, with priority on efficiency and cost effectiveness.
SECTION OF OM
Facilities Management• depnds a great deal on effective management of facilities,
such as buildings, computer systems, signage, lighting, etc.
Configuration Management• It's important to track the various versions of products and
services. Consider the various versions of software that continually are produced, each with its own version number. Tracking these versions is configuration management.
Distribution Channels• The means of distribution depend very much on the nature of
the product or service.
ORGANISATIONAL FUNCTIONS
MarketingGets customers
Operationscreates product or service
Finance/AccountingObtains fundsTracks money
WHERE ARE THE OM JOBS?
Technology/methods Facilities/space utilization Strategic issues Response time People/team development Customer service Quality Cost reduction Inventory reduction Productivity improvement
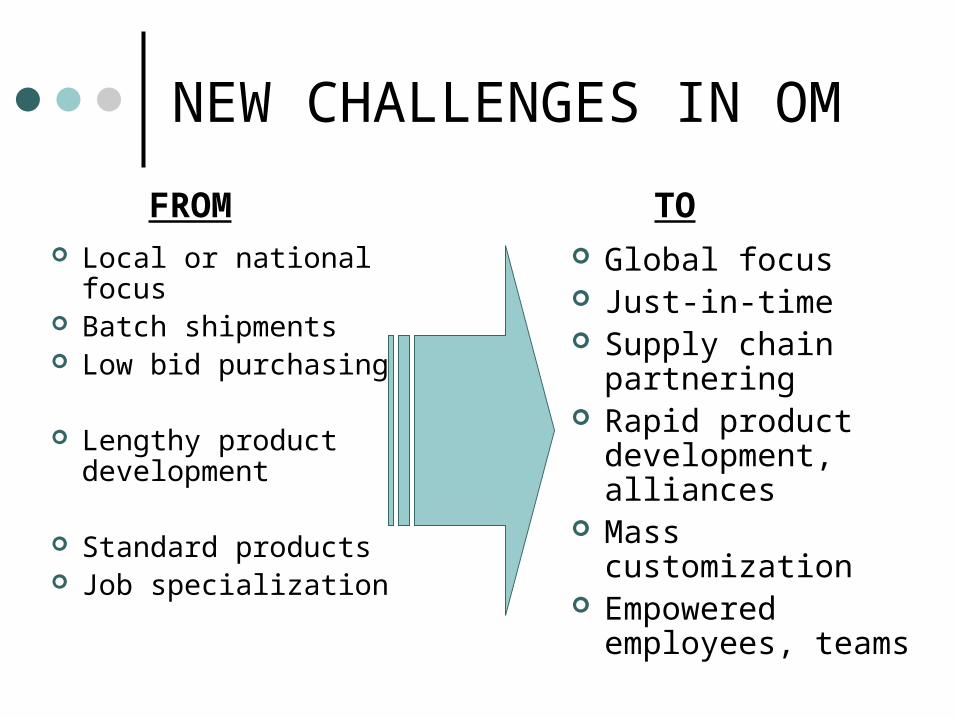
NEW CHALLENGES IN OM
Local or national focus
Batch shipments Low bid purchasing
Lengthy product development
Standard products Job specialization
Global focus Just-in-time Supply chain
partnering Rapid product
development, alliances
Mass customization Empowered
employees, teams
FROM TO
CHARACTERISTICS OF GOODS
Tangible product Consistent product definition Production usually separate from
consumption Can be inventoried Low customer interaction
CHARACTERISTICS OF SERVICES
Intangible product Produced & consumed at same time Often unique High customer interaction Inconsistent product definition Often knowledge-based Frequently dispersed
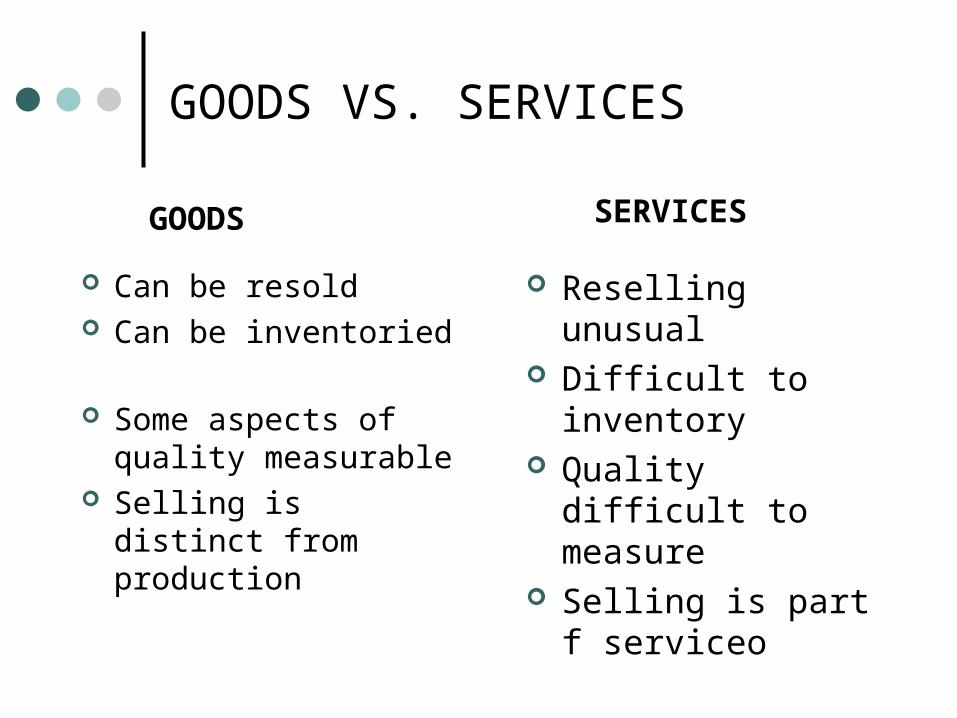
GOODS VS. SERVICES
Can be resold Can be inventoried
Some aspects of quality measurable
Selling is distinct from production
Reselling unusual Difficult to inventory Quality difficult to
measure Selling is part f
serviceo
GOODS SERVICES
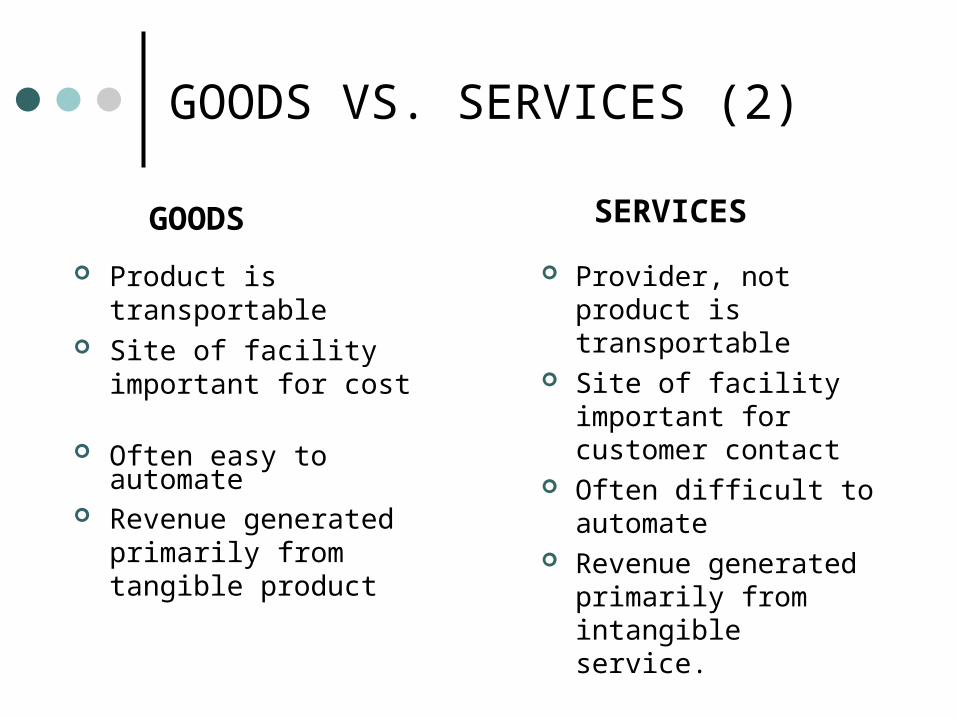
GOODS VS. SERVICES (2)
Product is transportable Site of facility important
for cost
Often easy to automate Revenue generated
primarily from tangible product
Provider, not product is transportable
Site of facility important for customer contact
Often difficult to automate
Revenue generated primarily from intangible service.
GOODS SERVICES
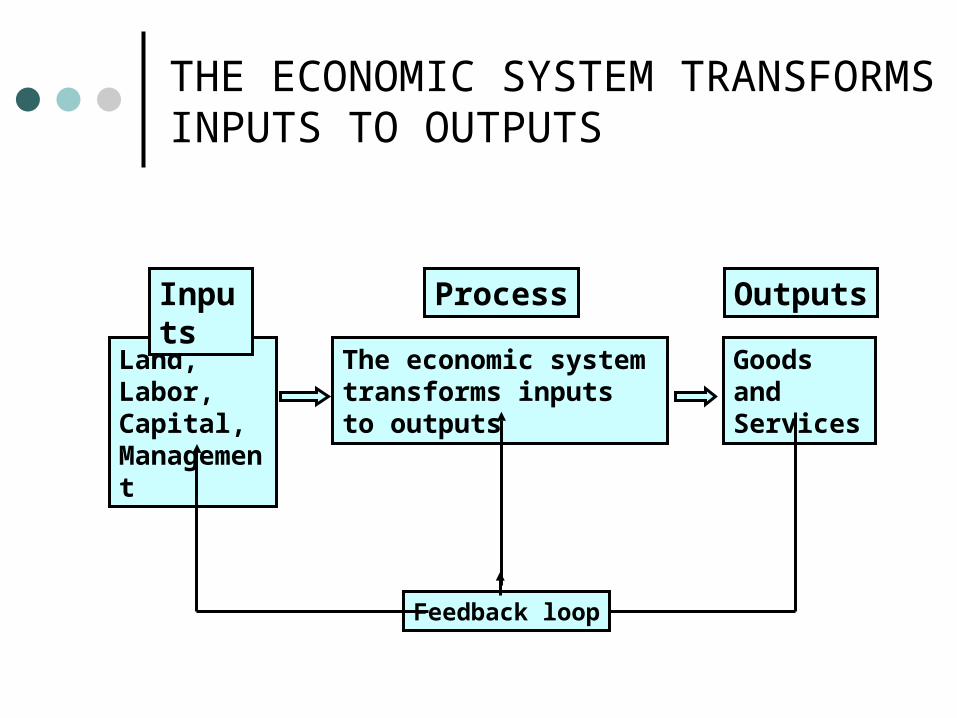
THE ECONOMIC SYSTEM TRANSFORMS INPUTS TO OUTPUTS
The economic system transforms inputs to outputs
Land, Labor, Capital, Management
Goods and Services
Feedback loop
Inputs Process Outputs
INPUTS / OUTPUTS
PRODUCTIVITY
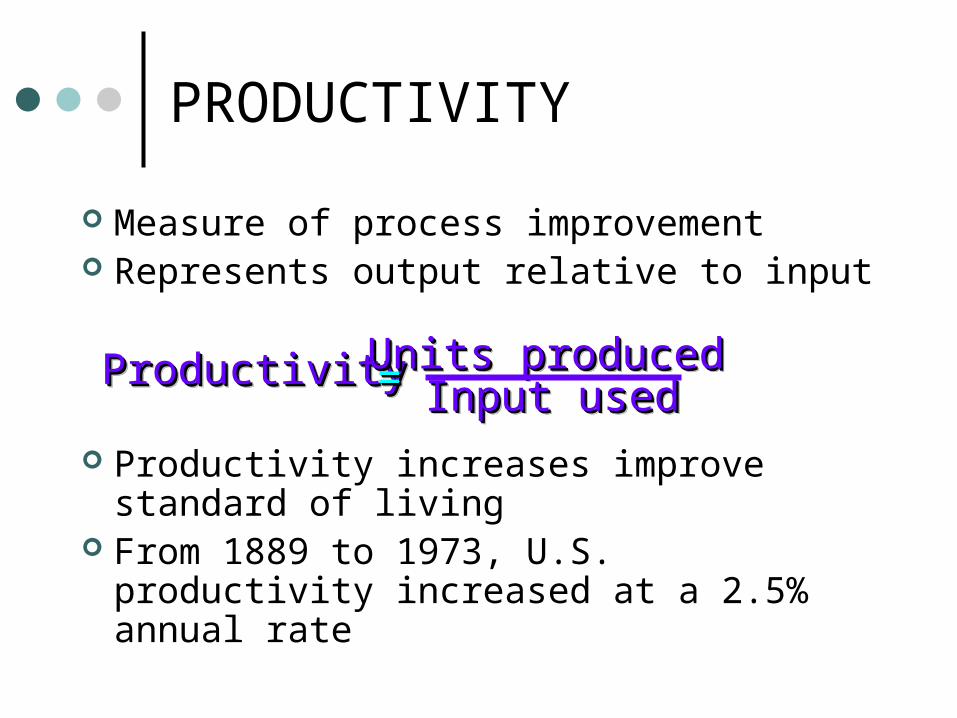
Measure of process improvement Represents output relative to input
Productivity increases improve standard of living
From 1889 to 1973, U.S. productivity increased at a 2.5% annual rate
ProductivityProductivityProductivityProductivity UnitsUnits producedproducedUnitsUnits producedproducedInput usedInput usedInput usedInput used= = = =
MEASUREMENT PROBLEMS
Quality may change while the quantity of inputs and outputs remains constant
External elements may cause an increase or decrease in productivity
Precise units of measure may be lacking
PRODUCTIVITY VARIABLES
Labor - contributes about 10% of the annual increase
Capital - contributes about 32% of the annual increase
Management - contributes about 52% of the annual increase
SERVICE PRODUCTIVITY
Typically labor intensive Frequently individually processed Often an intellectual task performed by
professionals Often difficult to mechanize Often difficult to evaluate for quality


