Operations Management - bms.lkbms.lk/download/HND/semester 4/OM/week 4/Session 4 - Quality...Total...
42
Session 4 – Managing Quality 2/9/2018 Operations Management
Transcript of Operations Management - bms.lkbms.lk/download/HND/semester 4/OM/week 4/Session 4 - Quality...Total...
Session 4 – Managing Quality
2/9/2018
Operations Management

The challenge for business today is to satisfytheir customers through the exceptionalquality performance of their processes.
Opening remarks …….
The challenge for business today is to satisfytheir customers through the exceptionalquality performance of their processes.
Session 4 – Leaning outcome
• Understand the importance of managing quality in an organisation.
• Define the (4) four major costs of quality.
• Explain the basic principles of Total Quality Management (TQM)
and Six Sigma.
• Understand the seven (7) Quality Management assessment Tools.
• Describe how to construct process control charts.

The totality of features and characteristics of aproduct or service that bears on its ability tosatisfy stated or implied needs
American Society for Quality
Defining Quality
The totality of features and characteristics of aproduct or service that bears on its ability tosatisfy stated or implied needs.

User-based – better performance, more features
Manufacturing-based – conformance to standards,making it right the first time
Product-based – specific and measurable attributes ofthe product
Quality - Different Views
User-based
Manufacturing-based
Product-based

What is “Quality”?(An experts’ views)
There are different definitions:
• Quality is defined from the customer‘s point of view asanything that enhances their satisfaction - Dr. EdwardDeming
• Fitness for use - those product features which meet theneeds of customers and thereby provide productsatisfaction. Freedom from deficiencies - Dr. JosephJuran
6

The Quality Gaps
Perceived quality is governed by the magnitude and direction of the gapbetween customers’ expectations and their perceptions of the product or service
7

Quality Management (QM)to
Total Quality Management (TQM)

From traditional quality inspection approach to TQM
9

TQM WheelTotal QualityManagement (TQM) asa philosophy stresses(3) three principles
The simple objectiveof TQM is “Do theright things, right thefirst time, everytime.”
The simple objectiveof TQM is “Do theright things, right thefirst time, everytime.”

The continual process improvementdrives an organization to be bothanalytical and creative in finding waysto become more competitive and moreeffective at meeting stakeholderexpectations.
Continual Improvement - KAIZAN)
The three important Principles in TQM
( P - D - C - A Cycle)
The continual process improvementdrives an organization to be bothanalytical and creative in finding waysto become more competitive and moreeffective at meeting stakeholderexpectations.

The three important Principles in TQM - Cont…
All employees participate in working toward common goals. High-performance work systems integrate continuous improvement effortswith normal business operations. Self-managed work teams are oneform of empowerment.
Total Employee Involvement
The customer ultimately determines the level of quality. No matter whatan organization does to foster quality. The customer determines whetherthe efforts were worthwhile.
Customer Satisfaction (Customer focus)

Prevention costs - reducing the potential for defects Appraisal costs - evaluating products, parts, and services Internal failure costs - producing defective parts or service
before delivery External costs - defects discovered after delivery
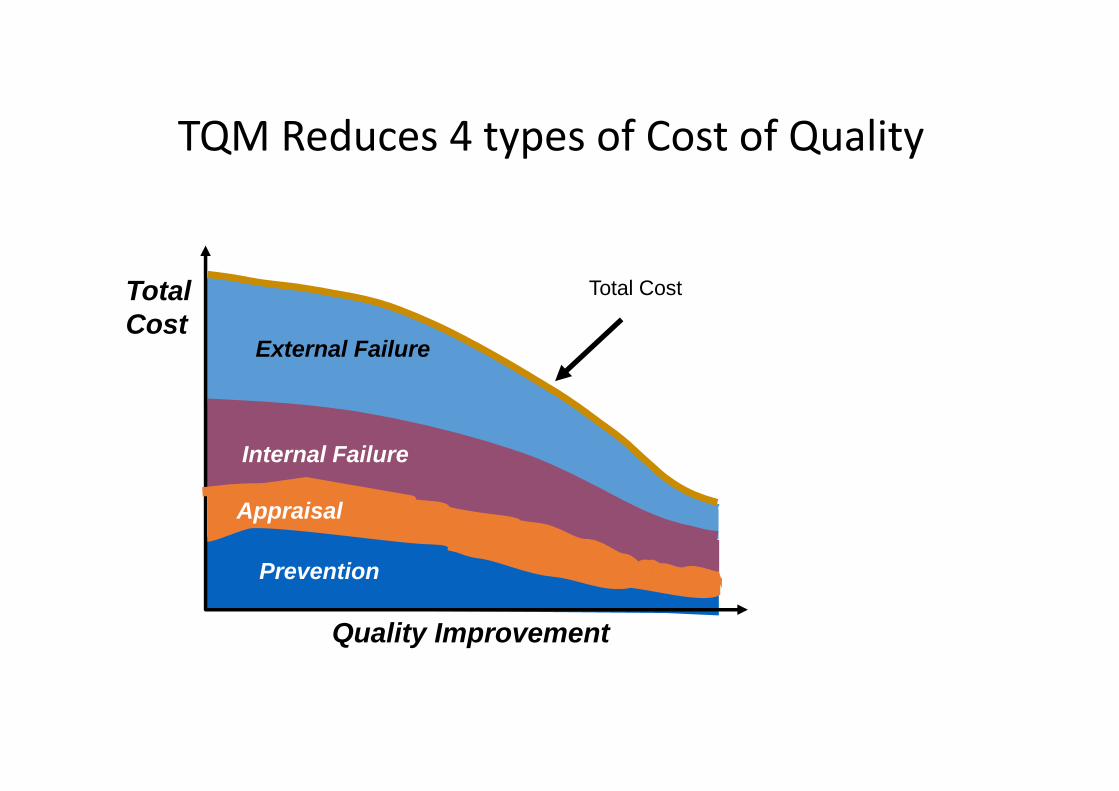
TQM Reduces 4 types of Cost of Quality
Prevention costs - reducing the potential for defects Appraisal costs - evaluating products, parts, and services Internal failure costs - producing defective parts or service
before delivery External costs - defects discovered after delivery
External Failure
Internal Failure
Prevention
TotalCost
Quality Improvement
Total Cost
TQM Reduces 4 types of Cost of Quality
Appraisal

How quality Mgt. reduces cost and increase revenue?
15

Why Total Quality Management (TQM) is Important?
This style of management can lead to:1. Increase company reputation.2. Decreased costs related to corrective or preventative maintenance.3. Maintaining good supplier relationships. (SCM)4. Reduces business risks.5. Better overall performance.6. Increasing the number of happy and loyal customers.7. Improve the competitiveness.
Total Quality Management (TQM) is an approach that organizations use toimprove their internal processes and increase customer satisfaction.

Eight Quality Management Principles by Deming
1. Customer Focus (Internal or External)• understand Customer NEEDs.• meet Customer REQUIREMENT• exceed Customer EXPECTATIONs
2. Leadership for quality improvement (Top Mgt. Commitment)
3. Involvement of People
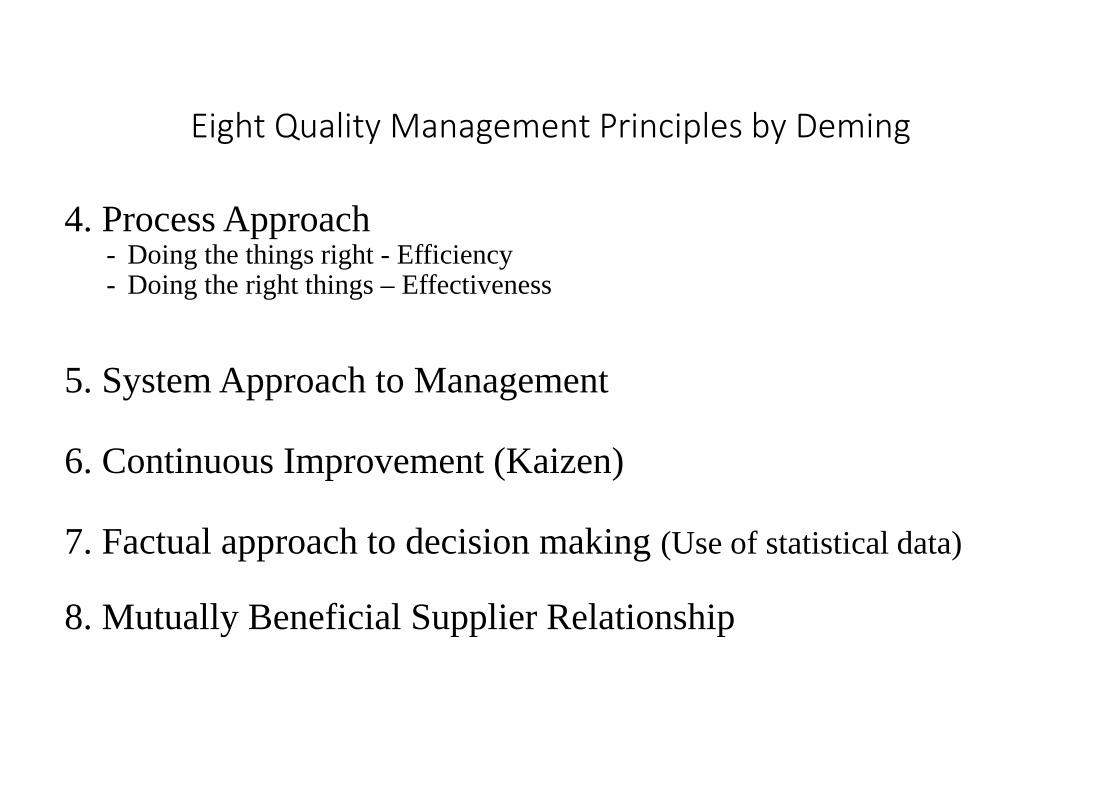
Eight Quality Management Principles by Deming
4. Process Approach- Doing the things right - Efficiency- Doing the right things – Effectiveness
5. System Approach to Management
6. Continuous Improvement (Kaizen)
7. Factual approach to decision making (Use of statistical data)
8. Mutually Beneficial Supplier Relationship

SIX SIGMA
Six Sigma - Approach
• A comprehensive and flexible management system for achieving,sustaining and maximizing business success by minimizing defects andvariability in process.
• The system is influenced by, other management improvement strategieslike; Total Quality Management and Zero Defects.
• Six Sigma seeks to improve business processes by removing the causes oferrors that lead to defects in a product or service.
• It accomplishes this by setting up a management system thatsystematically identifies errors and provides methods for eliminating them.

Major Aspects of Six Sigma
Statistical definition of a process that is 99.9997%capable, 3.4 defects for every one million opportunities(DPMO)A management system designed to improve efficiencies in
a business structure, reduce defects, lower costs, andimprove customer satisfaction
Slide 22 of 55
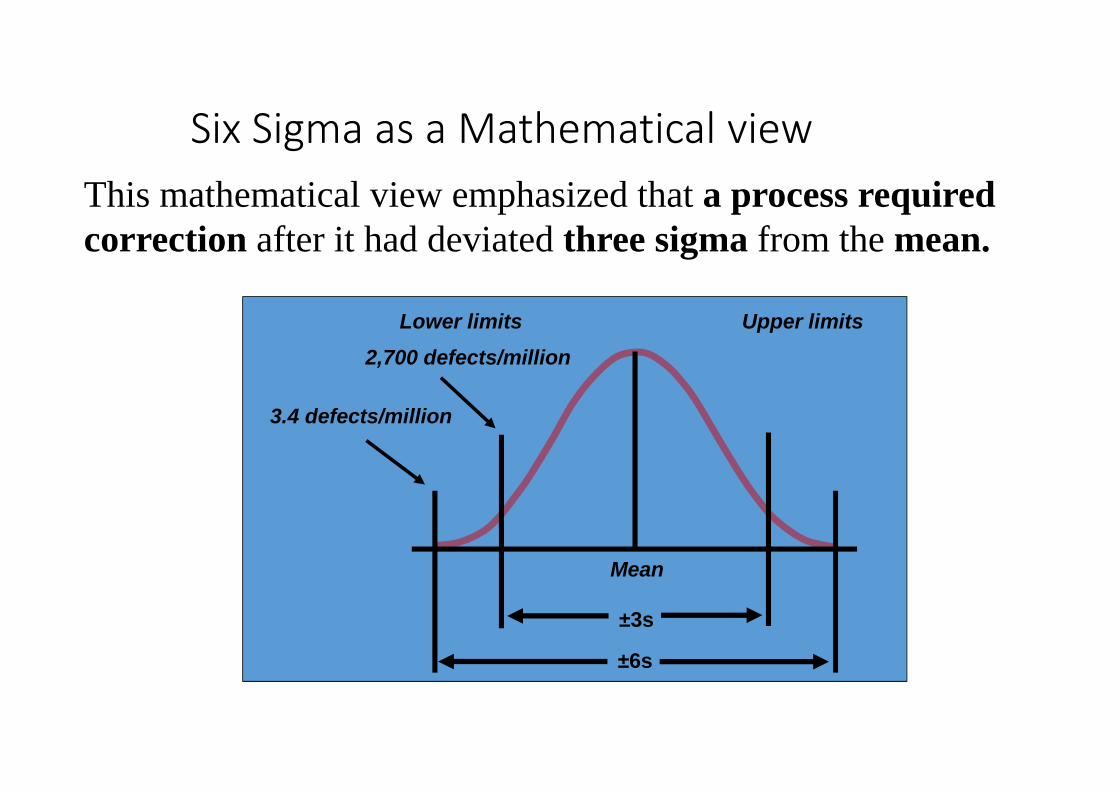
Six Sigma as a Mathematical viewThis mathematical view emphasized that a process requiredcorrection after it had deviated three sigma from the mean.
Mean
Lower limits Upper limits
3.4 defects/million
±6
2,700 defects/million
±3
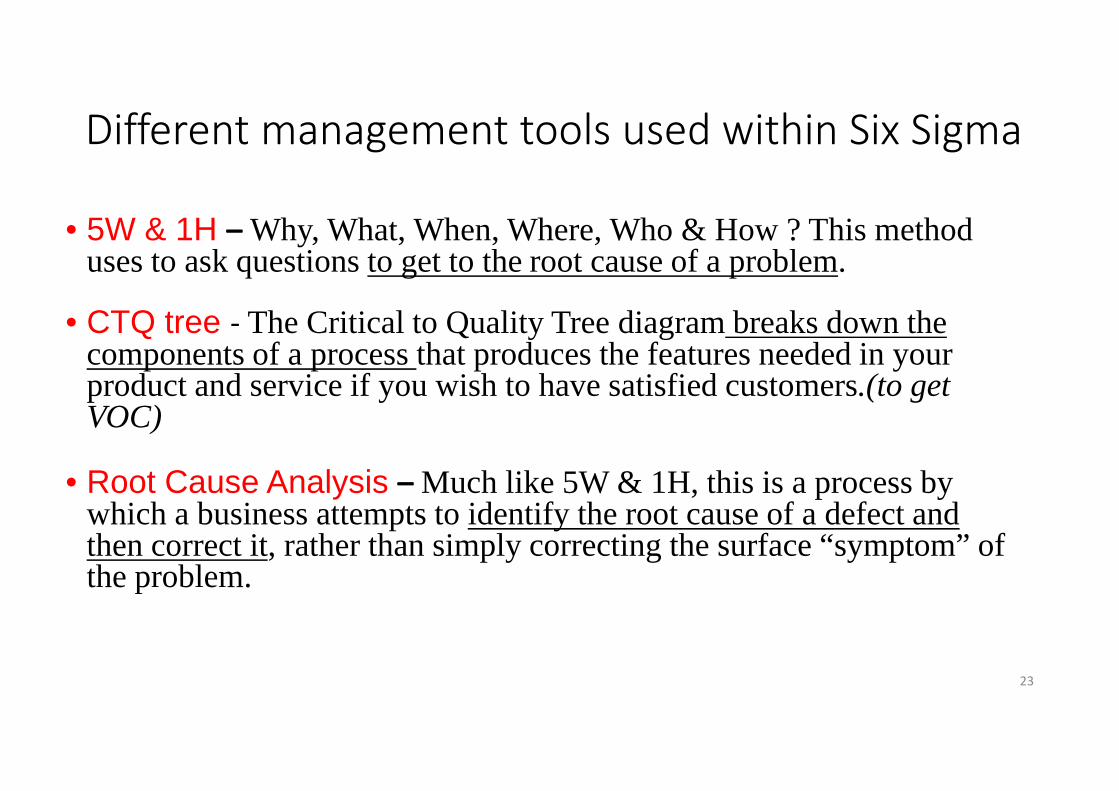
Different management tools used within Six Sigma
23
• 5W & 1H –Why, What, When, Where, Who & How ? This methoduses to ask questions to get to the root cause of a problem.
• CTQ tree - The Critical to Quality Tree diagram breaks down thecomponents of a process that produces the features needed in yourproduct and service if you wish to have satisfied customers.(to getVOC)
• Root Cause Analysis –Much like 5W & 1H, this is a process bywhich a business attempts to identify the root cause of a defect andthen correct it, rather than simply correcting the surface “symptom” ofthe problem.

Critical to Quality (CTQ) Tree – A model
The need : "Must be accessible on a smartphone."
Example : launching a new website
The quality driver : "Must display properly onsmartphone web browsers."
Use of CTQ to Identify the critical needs of yourcustomers (Get the customer voice)
The measurable requirement: "display as requiredon the five most popular smartphone webbrowsers.“ (This is CTQ for customer - VOC)

Methodologies of Six SigmaThere are two major methodologies used within Six Sigma:
This method is used for improvingexisting business processes.
DMAIC
• Define the problem and the project goals• Measure in detail the various aspects of
the current process• Analyze data to, among other things, find
the root defects in a process• Improve the process• Control how the process is done in the
future.
This method is used to createnew processes and new products
or services.
DMADV
• Define the project goals• Measure critical components of the process
and the product capabilities• Analyze the data and develop various
designs for the process, eventually pickingthe best one
• Design and test details of the process• Verify the design by running simulations
and a pilot program.

Seven (7) Quality Management Assessment Tools
26
Slide 27 of 55
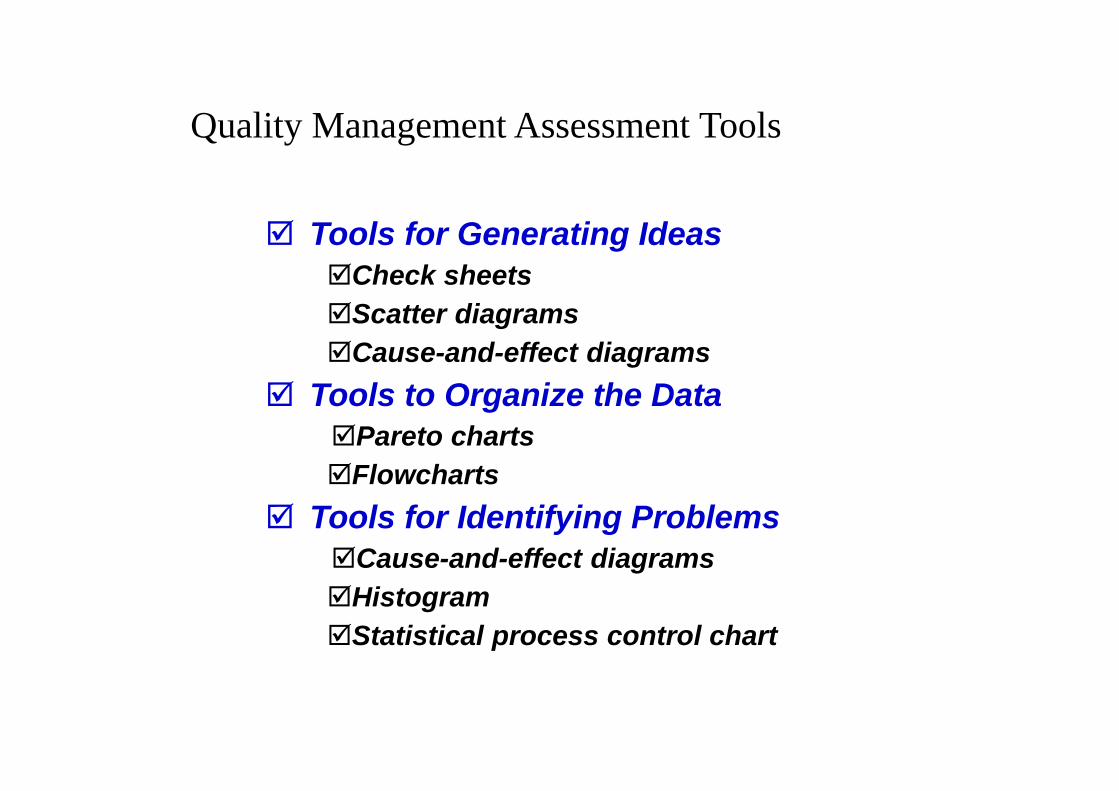
Tools for Generating IdeasCheck sheetsScatter diagramsCause-and-effect diagrams
Tools to Organize the DataPareto chartsFlowcharts
Tools for Identifying ProblemsCause-and-effect diagramsHistogramStatistical process control chart
Quality Management Assessment Tools

Slide 28 of 55
//
/ / /// /// ///// ////
//////
HourDefect 1 2 3 4 5 6 7 8
ABC
////
/
(1) Check Sheet: An organized method ofrecording data
Quality Management Assessment Tools

Slide 29 of 55
(2) Scatter Diagram: A graph of the valueof one variable vs. another variable
Absenteeism
Prod
uctiv
ity
Quality Management Assessment Tools

Slide 30 of 55
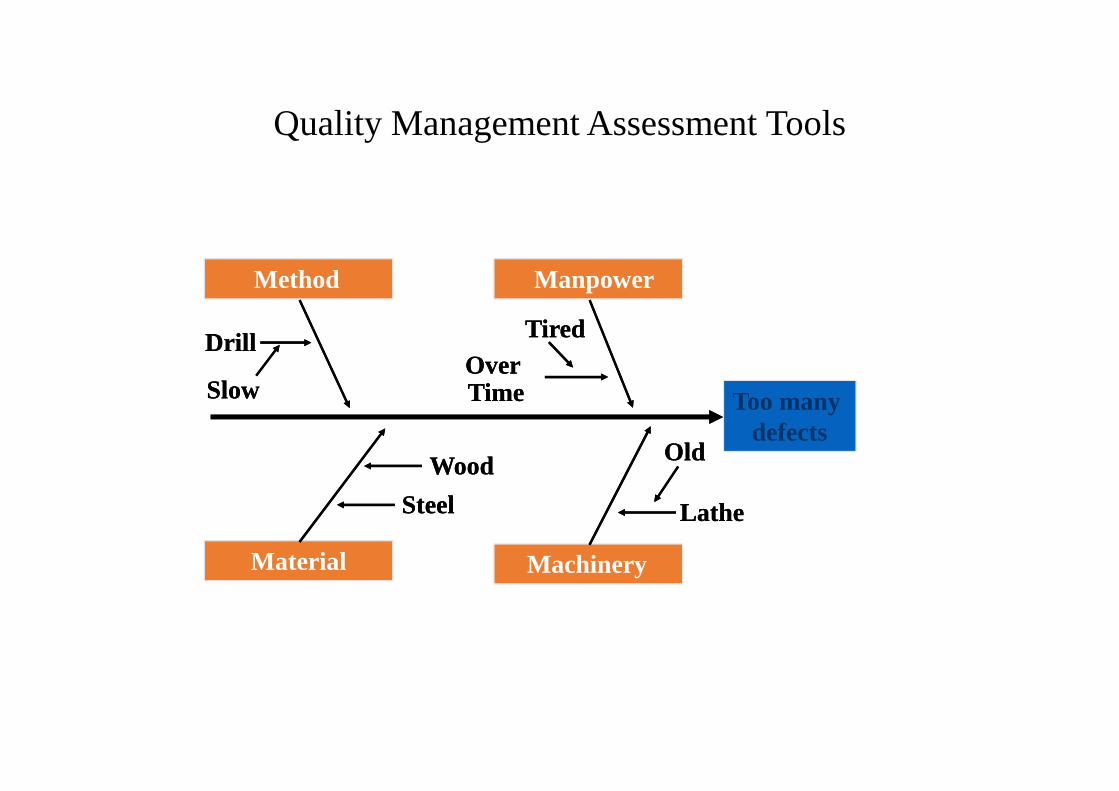
(3) Cause-and-Effect Diagram: A tool thatidentifies process elements (causes) thatmight effect an outcome
CauseMaterials Methods
Manpower Machinery
Effect
Quality Management Assessment Tools

Slide 31 of 55
Cause and Effect Diagram Example
Method Manpower
Material Machinery
Too manydefects
Too manydefects
Main Cause
Main Cause

Slide 32 of 55
Method Manpower
Material Machinery
DrillDrillOverOver
SteelSteel
WoodWood
LatheLathe
Too manydefects
Too manydefects
Sub-Cause
Quality Management Assessment Tools
Slide 33 of 55
Method Manpower
Material Machinery
DrillDrillOverOverTimeTime
SteelSteel
WoodWood
LatheLathe
Too manydefects
Too manydefects
TiredTired
OldOld
SlowSlow
Quality Management Assessment Tools

Slide 34 of 55
(4) Pareto Chart: A graph to identify and plotproblems or defects in descending order offrequency
Freq
uenc
y
Perc
ent
A B C D E
Quality Management Assessment Tools

Slide 35 of 55
Number ofoccurrences
Room ser. Check-in Pool hours Minibar Misc.72% 16% 5% 4% 3%
124 3 2
54
– 100– 93– 88
– 72
70 –
60 –
50 –
40 –
30 –
20 –
10 –
0 –
Freq
uenc
y (n
umbe
r)
Causes and percent of the total
Cum
ulat
ive
perc
ent
Data for October
Quality Management Assessment Tools
Slide 36 of 55
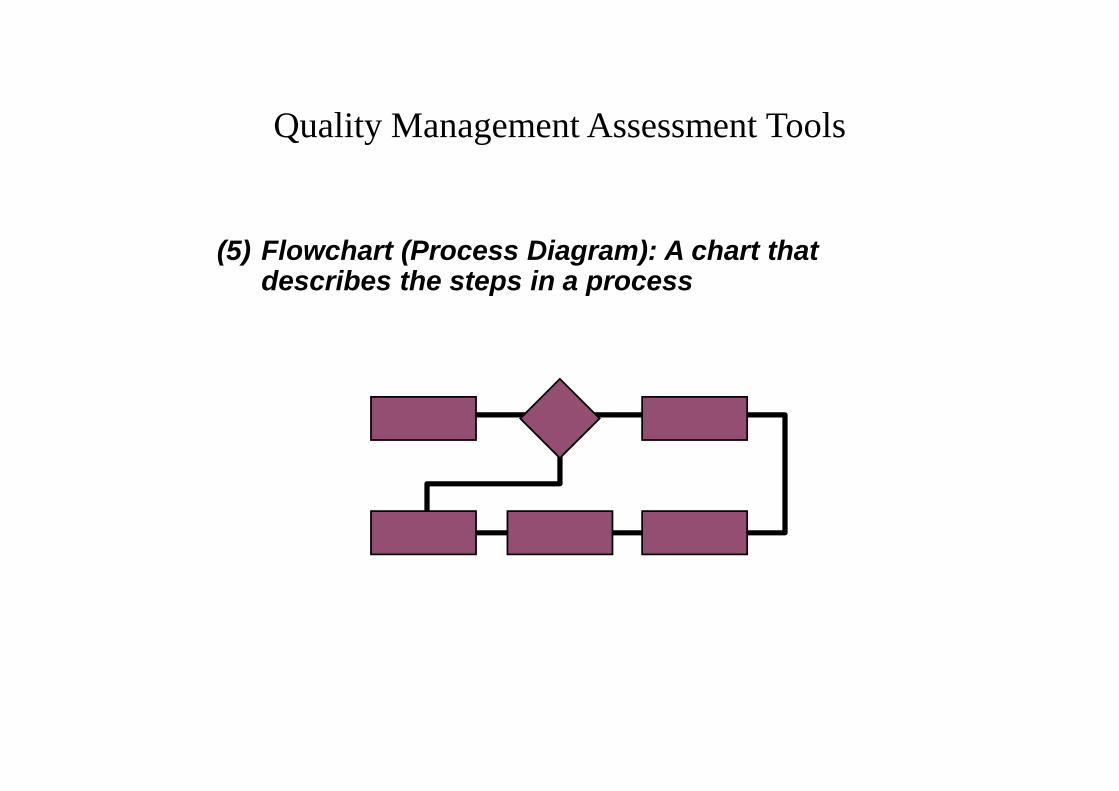
(5) Flowchart (Process Diagram): A chart thatdescribes the steps in a process
Quality Management Assessment Tools

Slide 37 of 55
MRI Flowchart1. Physician schedules MRI2. Patient taken to MRI3. Patient signs in4. Patient is prepped5. Technician carries out MRI6. Technician inspects film
7. If unsatisfactory, repeat8. Patient taken back to room9. MRI read by radiologist10. MRI report transferred to
physician11. Patient and physician discuss
11
10
20%
9
880%
1 2 3 4 5 6 7
Quality Management Assessment Tools

Slide 38 of 55
(6) Histogram: A distribution showing thefrequency of occurrences of a variable
Distribution
Repair time (minutes)
Freq
uenc
y
Quality Management Assessment Tools
Slide 39 of 55
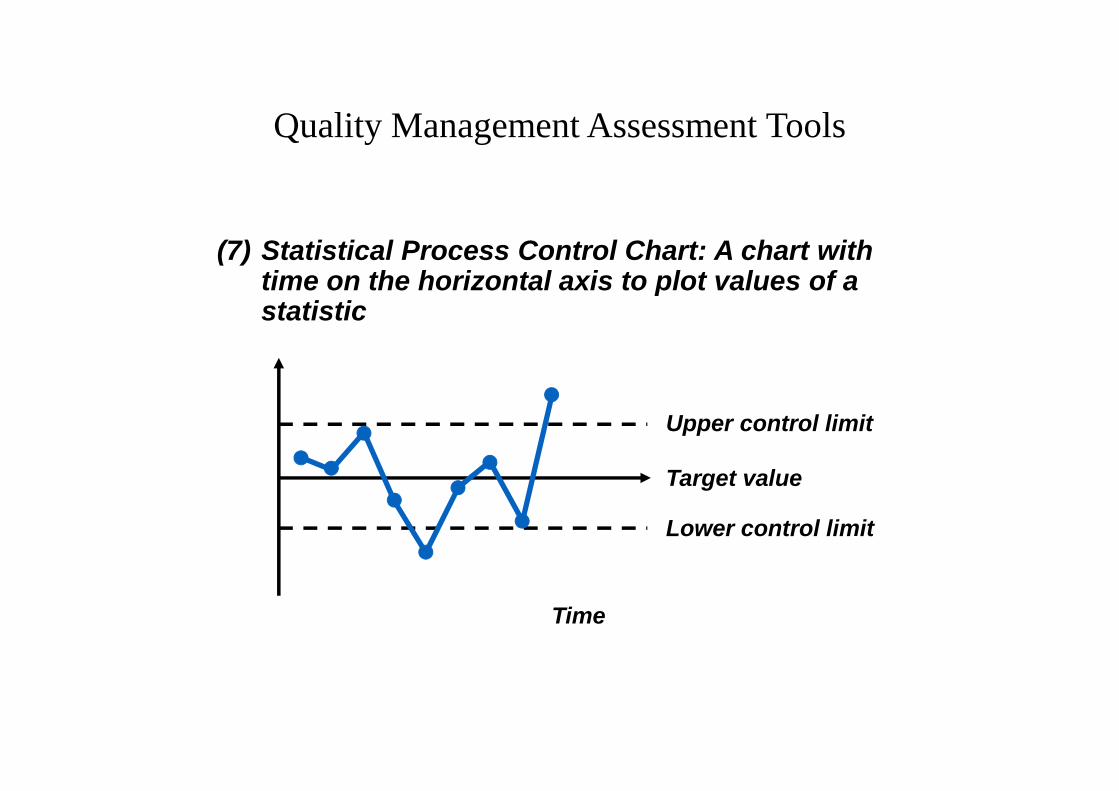
(7) Statistical Process Control Chart: A chart withtime on the horizontal axis to plot values of astatistic
Upper control limit
Target value
Lower control limit
Time
Quality Management Assessment Tools

Session 4 – Summary
• Understand the importance of managing quality in an organisation.
• Define the (4) four major costs of quality.
• Explain the basic principles of Total Quality Management (TQM)
and Six Sigma.
• Understand the seven (7) Quality Management assessment Tools
• Describe how to construct process control charts
Additional slide - & types of wastes in process

Waste (MUDA) Identification and waste elimination
7 types of wastes
42