
Operations Analysis Report Fire and Emergency Medical … Fire-EMS... · · 2014-08-07Workload by...
106
Operations Analysis Report Fire and Emergency Medical Services Ontario, Oregon July 2014 Submitted by and reply to: ICMA Center for Public Safety Management International City/County Management Association 777 North Capitol Street NE, Suite 500 Washington, DC 20002 [email protected] 202-962-3607 Copyright © 2014
Transcript of Operations Analysis Report Fire and Emergency Medical … Fire-EMS... · · 2014-08-07Workload by...

Operations Analysis Report Fire and Emergency Medical Services
Ontario, Oregon July 2014
Submitted by and reply to: ICMA Center for Public Safety Management
International City/County Management Association 777 North Capitol Street NE, Suite 500
Washington, DC 20002 [email protected]
202-962-3607 Copyright © 2014

Fire / EMS Operational Analysis Report, Ontario, Oregon page ii
General Information
About ICMA The International City/County Management Association (ICMA) is a 100-year-old nonprofit professional association of local government administrators and managers, with approximately 9,000 members located in 28 countries.
Since its inception in 1914, ICMA has been dedicated to assisting local governments in providing services to their citizens in an efficient and effective manner. Our work spans all of the activities of local government: parks, libraries, recreation, public works, economic development, code enforcement, brownfields, public safety, and a host of other critical areas.
ICMA advances the knowledge of local government best practices across a wide range of platforms, including publications, research, training, and technical assistance. Our work includes both domestic and international activities in partnership with local, state, and federal governments, as well as private foundations. For example, we are involved in a major library research project funded by the Bill & Melinda Gates Foundation and are providing community policing training in El Salvador, Mexico, and Panama with funding from the United States Agency for International Development. We have personnel in Afghanistan helping to build wastewater treatment plants and have teams working with the United States Southern Command (SOUTHCOM) in Central America on conducting assessments and developing training programs for disaster preparedness.
ICMA Center for Public Safety Management The ICMA Center for Public Safety Management (ICMA/CPSM), one of four centers within ICMA’s U.S. Programs Division, provides support to local governments in the areas of police, fire, emergency medical services (EMS), emergency management, and homeland security. In addition to providing technical assistance in these areas, we also represent local governments at the federal level and are involved in numerous projects with the U.S. Department of Justice and the U.S. Department of Homeland Security.
ICMA/CPSM is also involved in police and fire chief selection, assisting local governments in identifying these critical managers through original research, the identification of core competencies of police and fire managers, and assessment center resources.
Our local government technical assistance includes workload and deployment analysis, using operations research techniques and credentialed experts to identify workload and staffing needs and best practices. We have conducted approximately 140 such studies in 90 communities ranging in size from 8,000 population (Boone, Iowa) to 800,000 population (Indianapolis, Indiana).
Thomas Wieczorek is the Director of the Center for Public Safety Management. Leonard Matarese is the Director of Research & Project Development.

Fire / EMS Operational Analysis Report, Ontario, Oregon page iii
Methodology The ICMA Center for Public Safety Management team follows a standardized approach to conducting analyses of fire, police, and other departments involved in providing services to the public. We have developed this approach by combining the experience sets of dozens of subject matter experts in the areas of police, fire, and EMS. Our collective team has several hundred years of experience leading and managing public safety agencies, and conducting research in these areas for cities in and beyond the United States.
The reports generated by the operations and data analysis team are based upon key performance indicators that have been identified in standards and safety regulations and by special interest groups such as the International Association of Fire Chiefs (IAFC), the International Association of Fire Fighters (IAFF), and the Association of Public-Safety Communication Officials International, and through ICMA’s Center for Performance Measurement. These performance measures have been developed following decades of research and are applicable in all communities. For this reason, the data yield similar reporting formats, but each community’s data are analyzed on an individual basis by the ICMA specialists and represent the unique information for that community.
The ICMA team begins most projects by extracting calls for service and raw data from a public safety agency’s computer-aided dispatch system. The data are sorted and analyzed for comparison with nationally developed performance indicators. These performance indicators (e.g., response times, workload by time, multiple-unit dispatching) are valuable measures of agency performance regardless of departmental size. The findings are shown in tables and graphs organized in a logical format. Despite the size and complexity of the documents, a consistent approach to structuring the findings allows for simple, clean reporting. The categories for the performance indicators and the overall structure of the data and documents follow a standard format, but the data and recommendations are unique to the organization under scrutiny.
The team conducts an operational review in conjunction with the data analysis. The performance indicators serve as the basis for the operational review. The review process follows a standardized approach comparable to that of national accreditation agencies. Before the arrival of an on-site team, agencies are asked to provide the team with key operational documents (policies and procedures, asset lists, etc.). The team visits each city to interview fire agency management and supervisory personnel, rank-and-file officers, and local government staff.
The information collected during the site visits and through data analysis results in a set of observations and recommendations that highlight the strengths, weaknesses, and opportunities of—and threats to—the organizations and operations under review. To generate recommendations, the team reviews operational documents; interviews key stakeholders; observes physical facilities; and reviews relevant literature, statutes and regulations, industry standards, and other information and/or materials specifically included in a project’s scope of work.
The standardized approach ensures that the ICMA Center for Public Safety Management measures and observes all of the critical components of an agency, which in turn provides substance to benchmark against localities with similar profiles. Although agencies may vary in size, priorities,

Fire / EMS Operational Analysis Report, Ontario, Oregon page iv
and challenges, there are basic commonalities that enable comparison. The approach also enables the team to identify best practices and innovative approaches.
In general, the standardized approach adopts the principles of the scientific method: We ask questions and request documentation upon project start-up; confirm accuracy of information received; deploy operations and data analysis teams to research each unique environment; perform data modeling; share preliminary findings with the jurisdiction; assess inconsistencies reported by client jurisdictions; follow up on areas of concern; and communicate our results in a formal written report.
ICMA/CPSM Project Contributors Thomas J. Wieczorek, Director Leonard A. Matarese, Director of Research and Project Development Steven Knight, Ph.D., Senior Manager for Fire and EMS Mike Iacona, Public Safety Associate Dov N. Chelst, Ph.D., Director of Quantitative Analysis Gang Wang, Ph.D., Senior Quantitative Analyst Sarita Vasudevan, Quantitative Analyst Dennis Kouba, Editor

Fire / EMS Operational Analysis Report, Ontario, Oregon page v
Contents General Information ........................................................................................................................ii
About ICMA ................................................................................................................................................... ii
ICMA Center for Public Safety Management ................................................................................................ ii
Methodology ................................................................................................................................................ iii
ICMA/CPSM Project Contributors ................................................................................................................ iv
Contents ........................................................................................................................................... v
Tables ............................................................................................................................................. vii
Figures ........................................................................................................................................... viii
Executive Summary ......................................................................................................................... 1
Priority Recommendations ........................................................................................................................... 2
Governance and Administration ..................................................................................................... 6
City of Ontario ............................................................................................................................................... 6
Ontario Fire Department .............................................................................................................................. 8
Staffing and Deployment ........................................................................................................................ 9
Organizational Processes .............................................................................................................. 13
Time Allocation ........................................................................................................................................... 13
Succession Planning .................................................................................................................................... 14
Education and Training Programs ............................................................................................................... 16
Essential Resources ....................................................................................................................... 19
Fire Prevention/Fire Investigation/Public Education .................................................................................. 19
Emergency Communications ...................................................................................................................... 20
External System Relationships/Mutual Aid ................................................................................................ 23
Regional Hazardous Material Emergency Response Team .................................................................. 24
Assessment and Planning ............................................................................................................. 25
Strategic Planning/Goals and Objectives .................................................................................................... 25
Performance Measurement ........................................................................................................................ 26
Community Risk Assessment and Emergency Management Planning ....................................................... 31
Fire Preplanning ................................................................................................................................... 32
Risk Management/Fire Fighter Health & Fitness ................................................................................. 33
Infrastructure ................................................................................................................................ 35
Fixed Facilities/Capital Vehicles .................................................................................................................. 35

Fire / EMS Operational Analysis Report, Ontario, Oregon page vi
Operational Response and Workload ........................................................................................... 37
Operational Category Call Types ................................................................................................................. 38
Operational Unit Deployment Time ............................................................................................................ 42
Workload by Individual Unit—Calls and Total Time Spent .................................................................. 44
Analysis of Busiest Hours ............................................................................................................................ 52
Operational Response Times ...................................................................................................................... 53
Appendix: Ontario Fire Department Data Analysis ...................................................................... 59
Introduction ................................................................................................................................................ 59
Methodology ............................................................................................................................................... 59
Aggregate Call Totals and Dispatches ......................................................................................................... 61
Workload by Individual Unit—Calls and Total Time Spent ......................................................................... 73
Analysis of Busiest Hours ............................................................................................................................ 78
Dispatch Time and Response Time ............................................................................................................. 80
Attachment I: Workload of County Ambulances ........................................................................................ 93
Attachment II: Workload of Administrative Units ...................................................................................... 94
Attachment III: Property and Content Loss Analysis for Structure and Outside Fire Calls ......................... 95
Attachment IV: Actions Taken Analysis for Structure and Outside Fire Calls ............................................. 96
Attachment V: Correspondence between NFIRS Incident Type and Call Type........................................... 97

Fire / EMS Operational Analysis Report, Ontario, Oregon page vii
Tables TABLE 1: The Five GASB Performance Indicators ....................................................................................... 27 TABLE 2: OFD Apparatus Inventory ............................................................................................................ 36 TABLE 3: Call Types ..................................................................................................................................... 39 TABLE 4: Annual Deployed Time by Call Type ............................................................................................. 43 TABLE 5: Call Workload by Unit .................................................................................................................. 45 TABLE 6: Total Annual and Daily Average Number of Runs by Call Type and Unit ..................................... 46 TABLE 7: Property and Content Loss Analysis for Structure & Outside Fire Calls ...................................... 49 TABLE 8: Actions Taken Analysis for Structure and Outside Fire Calls ....................................................... 50 TABLE 9: Calls by Hour of Day ..................................................................................................................... 51 TABLE 10: Frequency Distribution of the Number of Calls ......................................................................... 52 TABLE 11: Average Dispatch, Turnout, Travel, and Response Times of First Arriving Unit, by Call Type ... 54 TABLE 12: 90th Percentile Dispatch, Turnout, Travel, and Response Times of First Arriving Unit, by Call Type ............................................................................................................................................................. 55 TABLE D1: Call Types ................................................................................................................................... 61 TABLE D2: Calls by Hour of Day ................................................................................................................... 69 TABLE D3: Number of Ontario Fire Department Units Dispatched to Calls................................................ 71 TABLE D4: Annual Deployed Time by Call Type .......................................................................................... 72 TABLE D5: Call Workload by Unit ................................................................................................................ 73 TABLE D6: Deployed Minutes by Hour of Day ............................................................................................ 74 TABLE D7: Total Annual and Daily Average Number of Runs by Call Type and Unit .................................. 76 TABLE D8: Daily Average Deployed Minutes by Call Type and Unit ........................................................... 77 TABLE D9: Frequency Distribution of the Number of Calls ......................................................................... 78 TABLE D10: Top 10 Hours with the Most Calls Received ............................................................................ 79 TABLE D11: Average Dispatch, Turnout, Travel, and Response Times of First Arriving Unit, by Call Type 81 TABLE D12: 90th Percentile Dispatch, Turnout, Travel, and Response Times of First Arriving Unit, by Call Type ............................................................................................................................................................. 83 TABLE D13: Average Dispatch, Turnout, Travel, and Response Times of First Arriving Unit, by Hour of Day .................................................................................................................................................................... 85 TABLE D14: Cumulative Distribution Function (CDF) of Response Time of First Arriving Unit for EMS Calls .................................................................................................................................................................... 88 TABLE D15: Average Response Time for Structure and Outside Fire Calls by First Arriving Unit ............... 89 TABLE D16: Cumulative Distribution Function (CDF) of Response Time of First Arriving Units for Structure and Outside Fire Calls ................................................................................................................................. 92

Fire / EMS Operational Analysis Report, Ontario, Oregon page viii
Figures FIGURE 1: City of Ontario Organizational Chart ............................................................................................ 7 FIGURE 2: Ontario Fire Department Organizational Chart ........................................................................... 9 FIGURE 3: Time Allocation Model ............................................................................................................... 14 FIGURE 4: Six-Step Succession Planning Model .......................................................................................... 16 FIGURE 5: Hazmat Regional Team Response Area Boundaries: ................................................................. 24 FIGURE 6: Performance Measure Program Logic Model ............................................................................ 29 FIGURE 7: Ontario Fire Station #1 and Ontario City Limits ......................................................................... 37 FIGURE 8: EMS and Fire Calls by Type ........................................................................................................ 40 FIGURE 9: Plotting of Fire and EMS Runs .................................................................................................... 41 FIGURE 10: Low-Risk Fire Response ............................................................................................................ 47 FIGURE 11: Moderate Risk Fire Response .................................................................................................. 48 FIGURE 12: Calls by Hour of Day ................................................................................................................. 50 FIGURE 13: Fire Propagation Curve ............................................................................................................ 56 FIGURE 14: 240/360/480-Second Response Bleed Layers from the OFD Main Fire Station ...................... 57 FIGURE D1: EMS and Fire Calls by Type ...................................................................................................... 62 FIGURE D2: EMS Calls by Type and Duration .............................................................................................. 64 FIGURE D3: Fire Calls by Type and Duration ............................................................................................... 66 FIGURE D4: Average Calls per Day, by Month ............................................................................................ 68 FIGURE D5: Calls by Hour of Day ................................................................................................................. 69 FIGURE D6: Deployed Minutes by Hour of Day .......................................................................................... 74 FIGURE D7: Average Dispatch, Turnout, and Travel Times of First Arriving Unit, by EMS Call Type .......... 81 FIGURE D8: Average Dispatch, Turnout, and Travel Times of First Arriving Unit, by Fire Call Type ........... 82 FIGURE D9: Average Dispatch, Turnout, Travel, and Response Time of First Arriving Unit, by Hour of Day .................................................................................................................................................................... 84 FIGURE D10: Cumulative Distribution Function (CDF) of Response Time of First Arriving Unit for EMS calls .................................................................................................................................................................... 86 FIGURE D11: Frequency Distribution Chart of Response Time of First Arriving Unit for EMS Calls ........... 87 FIGURE D12: Cumulative Distribution Function (CDF) of Response Time of First Arriving Units for Structure and Outside Fire Calls ................................................................................................................. 90 FIGURE D13: Frequency Distribution Chart of Response Time of First Arriving Unit for Structure and Outside Fire Calls ........................................................................................................................................ 91

Fire / EMS Operational Analysis Report, Ontario, Oregon page 1
Executive Summary ICMA was retained by the city of Ontario, Oregon, to perform an operational analysis of the city’s fire department. The analysis is intended to provide the city with an unbiased review of fire services provided by the Ontario Fire Department (hereinafter, OFD, also known as Ontario Fire & Rescue). This report is the result of the ICMA analysis and is accompanied by recommendations for ways to improve efficiencies and effectiveness in the delivery of services.
This report provides strategic planning points from which the city and the OFD can further develop and implement our recommendations for continuous department improvement. The report also provides some benchmarking of the city’s existing service delivery performance, which was derived from data provided to ICMA by the OFD. Benchmark performance information can be found in the data tables and the data analysis contained in this report.
To begin the review, the project staff asked the city and the fire department for certain documents, data, and information. The project staff used this information/data to familiarize themselves with the fire department’s structure, assets, and operations. The information provided was also used in conjunction with the performance data collected to determine the existing performance of the fire department.
The ICMA project management staff conducted one site visit for the purpose of observing fire department and agency-connected supportive operations; interviewing key city, fire department, and external service provider staff; and reviewing preliminary data and operations.
The ICMA team, while reviewing information and discussing operations with department members, always seeks first to understand the operations, then to identify ways the department can improve efficiency, effectiveness, and safety for both its members as well as the community it serves. ICMA found that the city of Ontario is not unique, in that it seeks to create a more efficient fire department within existing financial resources while properly and strategically planning for the future.
To ensure that our scope of review was comprehensive, ICMA conducted a series of personal interviews with the members of city council to obtain their feedback as to those areas we should include in our review. On the basis of all discussions, the concerns we uncovered can be summarized as follows:
• The necessity of a joint response of the fire unit and ambulance on all EMS calls.
• The effectiveness of the consolidated 911 dispatch operations.
• The extent of succession planning in the fire department with the pending retirement of the fire chief.
• The ability to screen nonemergency requests for assistance from the workload of emergency responders.

Fire / EMS Operational Analysis Report, Ontario, Oregon page 2
• The effective ratio of supervisors and managers to line personnel.
• The effectiveness of the existing staffing levels in meeting current and projected demand.
• Any potential for nepotism or inappropriate working relationships.
ICMA found OFD is at a crossroad in its evolution. Though the fire department appears effective in the delivery of first response emergency medical services (EMS) and fire services, its current capacity is very limited and many key areas—including training, prevention, and field operational capabilities— are not fully meeting the needs of the community. With the pending retirement of the fire chief (anticipated in June of 2015), there is an opportunity and necessity to develop an orchestrated plan for the fire department. ICMA believes that this visioning process should include employee, volunteer, and citizen participation, and should focus on the structure of an organization that is best suited in meeting the future needs of the community. We believe that this organizational redesign can take three approaches;
1. Maintain the current structure of operation while incorporating incremental changes that address key administrative and organizational shortfalls.
2. Reassign a number of full-time personnel to a 40-hour work schedule, focusing their work efforts on prevention, training, and administrative duties, along with emergency response, primarily during day-time hours and for more significant events. Shift after-hour response duties to a fully volunteer force or newly created public safety contingent (police and fire consolidation).
3. Defer all EMS responses to the private ambulance provider and limit the OFD to a fully volunteer operation that responds primarily to fires.
ICMA has assembled thirty-six recommendations that are listed below and also within the body of the report. These recommendations are based on best practices derived from the National Fire Protection Association (NFPA), the Center for Public Safety Excellence (CPSE), ICMA, the U.S. Fire Administration, the International Association of Emergency Managers(IAEM), and the Federal Emergency Management Agency (FEMA), to name a few, as well as the knowledge of ICMA reviewers. Priority recommendations as considered by ICMA are listed first. Additional recommendations follow these in the order they appear in the report.
Priority Recommendations • Formalize the role of duty officer into a permanent, promoted fire officer position (fire
lieutenant) who would assume supervisory duties for full-time and part-time line personnel.
• Consider the promotion and re-assignment of one full-time firefighter to a 40-hour assignment as fire captain, with the responsibility to oversee operational response, training, prevention, and other support duties.
• In the selection of a new fire chief, place strong emphasis on a background and direct experience in fire prevention and code enforcement activities.

Fire / EMS Operational Analysis Report, Ontario, Oregon page 3
• Designate the fire captain position, assigned to a 40-hour schedule, with the responsibility for the oversight of fire prevention, fire inspections, and the code review process, working in conjunction with the Ontario Building Department.
• Formalize a departmental policy that identifies and requires fire companies to conduct periodic inspections (in accordance with code stipulations) into high-hazard and target occupancies for the purpose of ensuring fire code compliance and to provide personnel with familiarity with target locations. Assign the oversight of this responsibility to one of the newly promoted fire lieutenants, reporting to the captain.
• Develop and implement an incident reporting requirement for the newly promoted fire lieutenants that ensures that all responses (fire, EMS, and other) have an associated incident report completed in a timely fashion. Assign one of the lieutenants as a quality assurance officer, reporting to the captain who is responsible for the review of the incident reporting process, ensuring that critical information is properly documented (i.e., call type, response times, action taken, occupancy type, personnel involved, units responding, fire loss, patient information, and etc.). This officer should produce a monthly summary report regarding response activities.
• Institute Emergency Medical Dispatching and Call Prioritization for EMS and fire response.
• Identify an alternative dispatching facility that can serve as an emergency backup for the Dispatch Center. Institute policies that test its operational readiness regularly.
• OFD should fully evaluate the types of workers’ compensation benefits and survivor benefits that are available for part-time and volunteer employees who may be seriously injured or killed when they are performing their assigned duties.
• OFD should consider a modification of its practice of following TVP units to the hospital after each call.
• OFD should monitor more closely the amount of time spent on fire calls, particularly mutual aid responses, and institute an effort to complete these assignments more quickly.
Recommendations: • Conduct a strategic planning process that scopes out the development of the Ontario Fire
Department for the next five years.
• Adopt a time allocation model; implement and monitor time allocation to ensure effective use of officer and staff time as it relates to achieving the organizational mission.
• Develop and implement a succession planning process that identifies and develops future leaders.
• Develop and implement a career path training and development program for career advancement that focuses on personal and professional development for promotion.
• Assign the new fire captain position the oversight of fire and EMS training within the organization. Prioritize as a duty of this new position the management and delivery of a

Fire / EMS Operational Analysis Report, Ontario, Oregon page 4
comprehensive training program that includes both cognitive and hands-on practical training. Utilize annual assessments of all personnel in both emergency medical services and fire suppression to monitor the quality of the training program and the skills maintenance of full-time and part-time personnel
• Consider a modification to the recruitment and selection of new firefighters so as to utilize a testing and screening process focusing on new candidates who have achieved Firefighter I & II certification along with EMT-I certification.
• With the creation of the fire lieutenant position on each shift, build into this new job description a full regimen of training responsibilities and minimum performance measures regarding training that complies with ISO, Department of Public Safety, and Malheur County EMS training criteria.
• Provide oversight and require the development of prefire planning for critical structures and place these documents on the mobile data computers (MDCs) of responding units for rapid retrieval during response. Assign the oversight of this responsibility to one of the newly promoted fire lieutenants, reporting to the captain.
• Develop and utilize performance measures to monitor critical operations of the Dispatch Center.
• Develop a quality assurance process that reviews dispatcher performance and compliance regarding EMD, Call Prioritization, and Pre-arrival Instructions.
• Once the Dispatch Center is fully operational, evaluate the staffing levels and workload issues to ensure efficiency and operational effectiveness, particularly when only a single dispatcher is on duty.
• Build more structure into the Dispatch Center’s User Board, establishing its role to review critical system performance and the monthly monitoring of the Center’s activities.
• Consider the creation of an “Executive Board” or “Steering Committee” that is smaller in number of members (four to five maximum) and has greater oversight and review of Dispatch Center performance.
• Consider placement of the dispatch supervisor as an ad hoc member of the User Board/Executive Board.
• The OFD should develop and implement a performance measure reporting system that expands the type of measurement it employs, including a program logic model.
• Performance measures should be developed for each department activity, and should link to the strategic and comprehensive planning documents and fiscal/budget documents.
• OFD and the city of Ontario should undertake a comprehensive effort in developing emergency preparedness efforts, specifically developing a citywide Emergency Operations Plan (EOP) and a Continuity of Operations Plan (COOP), and should undertake a complete review of critical municipal structures and contingency planning in the event of some type of partial or full compromise of these facilities.

Fire / EMS Operational Analysis Report, Ontario, Oregon page 5
• OFD should develop and institute annual medical screenings and an ongoing fitness assessment process for its operational personnel. Further, OFD should consider a partnering effort with neighboring jurisdictions in providing medical screening and fitness assessments to it personnel.
• OFD and the city of Ontario should consider the purchase of a transport-capable ambulance that can be co-utilized by TVP to ensure the viability of transport operations in both the city and the rural fire district.
• OFD should consider raising its level of EMT care to an Intermediate level on a daily basis.
• The OFD should develop performance measures for those critical tasks it can implement on low- and moderate-risk incidents; regularly train on these measures; and evaluate each member in the department annually against established benchmarks for the purpose of continuous process improvement.
• The OFD should evaluate options that dispatches either an OFD unit or a TVP ambulance on the initial response to those minor emergency incidents or public assists that have been determined through a medical priority dispatching process implemented at the MCSO communications center.
• OFD should monitor more closely the turnout time of Rescue-1 across all shifts, with a clear directive as to the expectation for turnout time.
• The OFD should develop performance measures specific to fire operations, including: the percent of fires contained to room of origin; percent of fires contained to building of origin; target goals for call processing time; target goals for turnout time; target goals for access time; target goals for set-up time; target goals for travel time; and target goals for total response time. It is further recommended that the results of these performance measures be reported with explanation in an annual report.

Fire / EMS Operational Analysis Report, Ontario, Oregon page 6
Governance and Administration
City of Ontario Located on the banks of the Snake River, at the Idaho border, Ontario is the largest city in Malheur County, Oregon. Ontario is the principal city of the Ontario, OR-ID metropolitan Statistical Area, located on Interstate 84, approximately 50 miles southwest of Boise, Idaho. Ontario is comprised of 5.2 square miles of land area and serves as a regional center for the predominately farming area
that surrounds the city. The 2010 U.S. Census estimates the population of Ontario was 11,366.
The region’s primary industry is agriculture, with its primary crops being russet potatoes, sugar beets, and onions. The Heinz Frozen Food Company (formally Ore-Ida), processes an estimated 600 million pounds of 75 different potato products each year.
Ontario has a council/manager form of government. This form of government combines the political leadership of elected officials in the form of a city council with the
managerial experience of an appointed city administrator.1 Pursuant to Chapter III, of the Ontario Charter of 1985, the city council is comprised of a mayor and six council members who are all elected at-large for four-year terms. In each odd year council members elect a council president who serves as mayor during absences.
Section 4.1 of the Ontario City Charter provides that the city manager is the chief administrative officer of the city, and is appointed by the council to administer the affairs of the city.
Ontario is typical of many cities and towns across the United States in that it operates its own police and fire departments; community development, and leisure agencies; and the internal functions of finance and human resources. Figure 1 illustrates the organizational chart for the city of Ontario, Oregon.
1 Ontario Charter of 1985, Oregon

Fire / EMS Operational Analysis Report, Ontario, Oregon page 7
FIGURE 1: City of Ontario Organizational Chart
Citizens of Ontario
City Council Mayor
6 Councilors
Boards and Committees
City Manager
Human Resources City Recorder Airport/ Economic
Development
Recreation PLANNING & ZONING
Police Fire
Services Accounting Accounts Payable Billing & Collections Budget & Audit Customer Service Payroll Purchasing Utility Billing
Services Fire Haz-Mat Rural Fire Medical Public Education
Services Patrol Officers Student Resource Officers Task Force Ordinance Enforcement
Services Building Official Planning/Zoning Administrator Planning Technician
Services Recreation Programs
Finance

Fire / EMS Operational Analysis Report, Ontario, Oregon page 8
Ontario Fire Department The Ontario Fire Department (OFD, or Ontario Fire & Rescue) is a combination fire and emergency medical services (EMS) department. The OFD responds to calls for service from its main fire station, which is located in a portion of the city hall complex on SW 4th Street. The city maintains a second fire station, which is located at 3288 SW 4th Avenue. This second facility was built in 2010, and provides storage space for additional apparatus and also houses the hazardous materials response units, which serve as part of Oregon’s regional response network. Fire station #2 is not a permanently staffed facility.
The Ontario Fire Department employs seven full-time firefighters, one fire chief, and a civilian administrative assistant. In order to supplement this full-time staffing, the department maintains a complement of seven part-time relief fire fighters who fill in for vacancies when a full-time firefighter is absent. In addition, relief firefighters are called in during major alarms. Relief firefighters are paid an hourly rate (approximately $15/hour) for coverage assignments, training, or for emergency recalls. Relief firefighters who meet a 600-hour qualifying status are also eligible for employer contributions into the Oregon Public Employees Retirement System (PERS). The department currently utilizes thirteen volunteer associate members who fulfill a number of administrative and support tasks for the volunteer fire association.
The seven full-time firefighters work a 24/48 hour rotational schedule, with three shift assignments. The OFD maintains a minimum of two personnel on duty at all times. All full-time employees are classified as firefighters and their salaries and benefits are specified in a collective bargaining agreement between the city of Ontario and Local 3464 of the International Association of Firefighters (IAFF).
The department responds to fire and EMS events and also provides hazardous materials response, water rescue, and wildland/grass fire response. The fire chief responds to all major incidents along with on-duty staffing and during larger events the department relies on the response of off-duty personnel and part-time personnel. The department’s involvement in fire prevention activities are limited with the city’s building department responsible for most code enforcement, plans review, and fire safety inspections. The fire chief works closely with the building department to ensure that the requirements of the fire code are met and has direct involvement in the CO process when fire protection systems are required. On-duty personnel regularly provide public education outreach efforts to school children and host frequent tours within the fire station. Duty personnel also assist the State Fire Marshal in the inspections of state licensed facilities (Schools, Hospitals, Government Buildings, State Institutions, etc.). Figure 2 illustrates the OFD chart of the organization.

Fire / EMS Operational Analysis Report, Ontario, Oregon page 9
FIGURE 2: Ontario Fire Department Organizational Chart
Staffing and Deployment During the period covered by this study, OFD operated a single frontline response apparatus (Rescue-1), which is a rescue-pumper that provides initial response to all incidents within city limits. The fire chief also staffs a command vehicle (Unit 105-Ford Expedition) which responds to all incidents of significance. For responses outside city limits, into the Rural Fire Protection District, on-duty personnel respond on one of several engines or brush vehicles that have been funded under contract by the protection district. The Rural Fire Protection District encompasses an area that is 110 square miles in size and generates about 10 percent of the department’s total call volume. In addition, OFD operates multiple reserve and wildland units. The department also operates a number of specialty units (Hazmat Recon, Hazmat Team Response, and Communications), which are placed into service and staffed when needed. The department’s minimum daily staffing is two personnel. Firefighters are dual certified as either EMT-B (Basic) or EMT-I (Intermediate). OFD does not permanently designate an officer who is in charge of Rescue-1’s activities. Instead, on a rotating basis one of the assigned firefighters assumes the role of “duty officer” and is in charge of the unit for that day. In discussions with the personnel, we found that this appears to be a very loose designation and both on-duty individuals work jointly in making decisions on their course of action and how they mitigate problems.

Fire / EMS Operational Analysis Report, Ontario, Oregon page 10
The Ontario Fire department provides EMS services in a tiered response with Treasure Valley Paramedics (TVP), which is a nonprofit privately owned corporation. OFD operates as a Quick Response Unit (QRU) under the guidance of the Malheur County Ambulance Service Area (ASA), and its Medical Director, Dr. Morris Smith. TVP provides paramedic services and OFD provides its quick response at the EMT-B or EMT-I level, depending on the qualification the employees on duty at any given time. The Malheur County Ambulance Service Area Plan sets response time criteria for both TVP and OFD units. TVP units must respond within eight minutes of receiving notification from the Malheur Sherriff’s Office 911 Dispatch Center on 90 percent of all emergency responses. OFD units are expected to arrive within four minutes of receiving notification, 90 percent of the time.
The fire chief oversees the daily operations of the agency and reports directly to the city manager. He also plays a key role in the operation of the Ontario Rural Fire Protection District#7-302, responsible for emergency response in the district and managing a number of its administrative and financial matters. The fire chief is assisted by an administrative assistant (40-hour clerical) and utilizes two part-time assistant chiefs and one part-time training officer in managing the administrative functions of the organization. In addition, one firefighter has been designated as the hazmat coordinator and he coordinates the training and regional response activities of the hazardous materials response team. OFD does not have a fire marshal or fire inspectors, subsequently the responsibilities for fire plans review, inspections, and code enforcement are handled by the city’s building official. The fire chief assists the building official in the exercise of these duties. OFD utilizes a part-time employee who serves as the OFD’s training officer. The training officer plays a critical role in developing and monitoring the completion of required training activities for both fire and EMS activities. The department hosts weekly training sessions (Tuesday evening) and periodic weekend drills for all part-time, full-time, and volunteer associates. The training officer coordinates these activities and jointly with the fire chief provides documentation to both the Oregon Department of Public Safety Standards and Training and Malheur County EMS regarding the completion of required training for OFD employees and volunteers.
The collateral duties and support activities of a modern fire service organization are time-consuming and entail significant responsibility. The ultimate responsibility for ensuring that the organization is proficient in delivering emergency services, complies with training and safety requirements, and maintains proper personnel practices rests with the fire chief and the city of Ontario. In our estimation, the Ontario system provides insufficient support to the fire chief in fulfilling these key functions and subsequently many essential duties are being carried out in a manner that is less than proficient.
The Ontario system is at an important crossroad in its evolution and ICMA believes there is an ideal opportunity to take steps in the next six months that will set the course for how the system will operate into the foreseeable future. With the pending retirement of the fire chief (anticipated in June of 2015), there is an opportunity and necessity to forge an orchestrated plan, with employee, volunteer, and citizen participation, that moves the organization to a design that is best suited for

Fire / EMS Operational Analysis Report, Ontario, Oregon page 11
the future needs of the community. We believe the organizational redesign can take three approaches;
1. Maintain the current structure of operation while incorporating incremental changes that address key administrative and organizational shortfalls.
2. Reassign a number of full-time personnel to a 40-hour work schedule, focusing their work efforts on prevention, training, and administrative duties, along with emergency response during day-time hours. Shift after-hour response duties to a fully volunteer force or newly created public safety contingent (police and fire).
3. Defer all EMS responses to the private ambulance provider and move the OFD to a fully volunteer operation that responds primarily to fires.
Each of these options will affect service delivery in the city and will impact relationships with the rural fire district, mutual aid partners and TVP. It is critical that Ontario’s municipal leaders fully evaluate the potential impacts of these changes before moving in one direction or the other. In our experience, the best scoping process available to redesign a fire department’s organization, clarify its mission, and achieve its stated objectives, is through a strategic planning process. In short, the objective of the strategic planning process is to “define what an organizations wants to be,” and then stipulate in a formal, written plan, “how to get there.” The key to this process is built upon two main components; First; the participation of key stakeholders in the visioning process, and second; the formal adoption of the plan by the legislative body that oversees the department’s operation. ICMA believes strongly that Ontario would benefit greatly in conducting a strategic planning process for the fire department. We provide a detailed overview of the strategic planning process in the Assessment and Planning section of this report.
In pursuing this outcome, ICMA has identified a number of organizational issues that should be addressed regardless of the approach taken. These include the following;
• The absence of a formal and permanent supervisory structure within the firefighting crews.
• Little emphasis by the department on fire prevention and code enforcement.
• The absence of a full-time training officer.
• No command/supervisory staff ranks between the chief and line personnel.
• The absence of adopted performance measures for the department.
• Poor records management and incident report writing.
• The financial involvement of the fire chief and administrative assistant in the budgetary oversight, purchasing, and recordkeeping of the Rural Fire Protection District.
Recommendations:

Fire / EMS Operational Analysis Report, Ontario, Oregon page 12
• Formalize the role of duty officer into a permanent, promoted fire officer position (fire lieutenant), who would assume supervisory duties for full-time and part-time line personnel.
• Conduct a strategic planning process that scopes out the development of the Ontario Fire Department for the next five years.
• Consider the reassignment and promotion of one full-time firefighter to a 40-hour assignment as fire captain, with the responsibility to oversee operational response, training, prevention, and other support duties.
• In the selection of the new fire chief place, strong emphasis on a background and direct experience in fire prevention and code enforcement activities.
• Re-evaluate the working relationship of the fire chief and administrative assistant in the financial matters of the Rural Fire Protection District.

Fire / EMS Operational Analysis Report, Ontario, Oregon page 13
Organizational Processes
Time Allocation To effectively operate in an organization, an employee must understand his or her role in the organization and more importantly, how he or she should allocate their time during and work effort. Understanding this concept is essential in an organization such as the OFD, which has a compact organizational chart. Managers, supervisors, and firefighters have a responsibility to understand their organizational roles and responsibilities, and to perform the tasks related to these roles and responsibilities. One would not expect the fire chief to operate as a frontline service provider. Conversely, one would not expect a first-line firefighter to spend as much time as the fire chief, planning for the future of the organization. In this way, each level of the organization has a different set of priorities and employees at each level should allocate their time accordingly.
Figure 3 illustrates the components of efficient time allocation in the public sector. In this illustration, three segments of organizational time allocation are central to achieving the goals and objectives of any organization and, more importantly, to enabling the organization to fulfill its mission and realize its vision: (1) operating the system; (2) improving the system; and (3) creating the future.
Operating the system is that time during the workday that an organizational member is implementing service deliverables, touching those components of the organization that make it go. Improving the system is the time during the workday that an organizational member spends seeking ways to make service deliverables and organizational components more efficient, or, more simply put, better. Creating the future is that critical piece of time allocation when an organizational member develops goals and objectives that link to strategic planning and considers the vision of the organization in a way that focuses on successful, effective outcomes.
Time allocation has specific relevance and application to OFD because of the absence of first-level supervision for field personnel (fire lieutenant) and no midlevel officer ranks to provide command and program support. ICMA recommends the creation of three fire lieutenant positions for field operations and one 40-hour fire captain position for program management and field response when needed. Ideally, even in a compact organization such as the OFD, it is critical that the appropriate time be spent at the appropriate level in the organization to continuously make improvements and provide the necessary oversight. The addition/promotion of these personnel can be achieved from the existing seven full-time firefighters, with no anticipated increase in the number of full-time employees.
ICMA believes that the addition of these key positions and the structure they provide will improve productivity in several critical areas (training, prevention, volunteer oversight, and emergency response). ICMA supports, as recommended above, the creation of an officer level for field operations (lieutenant) and the position of captain between the line personnel and fire chief to assist in correcting the time allocation imbalance that currently exists. The creation of the captain position is especially important considering the pending retirement of the fire chief. This position

Fire / EMS Operational Analysis Report, Ontario, Oregon page 14
will provide continuity during the transition period when a new fire chief is hired and if needed the captain may assume the role of interim fire chief.
FIGURE 3: Time Allocation Model
Recommendation: • Adopt a time allocation model; implement and monitor time allocation to ensure effective
use of officer and staff time as it relates to achieving the organizational mission.
Succession Planning Our analysis of the OFD did not identify a clear organizational succession plan. Additionally, there is not a career path or training program that outlines expectations to help to prepare staff for advancement at various levels in the organization. With the absence of the fire lieutenant and captain positions, there are no promotional processes or stated training requirements for these positions. It is important for the organization to implement programs that identify the future leaders of the organization and provide career experience in the types of duties and responsibilities that are needed for leadership in the organization. A key to this is to develop and implement a formal succession plan. Succession planning is a systematic approach to developing potential successors to ensure organizational leadership stability. Successful succession planning identifies, develops, and nurtures potential future leaders. It is critical for the long-term success of any organization that such a process be in place and ongoing.
Critical to the success of succession planning is the engagement and commitment of the senior leaders to the program, as well as a commitment of other members of the organization to their own personal and professional development. To be a part of the succession plan, one must commit to

Fire / EMS Operational Analysis Report, Ontario, Oregon page 15
one’s own professional development process to be able to compete for and fill critical organizational leadership roles. Figure 4 illustrates one example of a succession plan.
The Ontario Fire Department is particularly in need of a formal succession plan because of the planned retirement of the fire chief in June 2015. There currently is not an individual who holds a midlevel management position in the organization. The fire service is unique in its structure in that midlevel officers provide both program oversight, planning, and visioning for the organization and at the same time they provide command and control functions during emergencies. Both aspects are critical to a public safety organization and they have even more application in Ontario because of the pending retirement of the fire chief. Ideally, a candidate for any officer level in the department is experienced and has the foundational technical and formal education and training to be successful with each new level. To ensure this and to ensure that OFD is preparing future officers, a formal program that identifies those foundational technical and organizational courses germane to each level in the organization should be selected and implemented. ICMA realizes this may have to be discussed and agreed upon with the bargaining unit; however, ICMA strongly supports the utility of this planning.
According to Kramer,2 “education and training in the fire service are complemented by an equally important third factor: experience. A healthy mix of all three is required for an effective fire officer, but as he or she moves through a career, the mix and the proportion of each tend to vary, with education becoming more and more important over time.”
2 Joseph R. Bachtler and Thomas F. Brennan, eds. The Fire Chief’s Handbook, 5th edition. (Saddle Brook, NJ: Fire Engineering Books, 1995), 328.

Fire / EMS Operational Analysis Report, Ontario, Oregon page 16
FIGURE 4: Six-Step Succession Planning Model
From United States Office of Personnel Management, HCAAF Systems, 2005.
Recommendations: • Develop and implement a succession planning process that identifies and develops future
leaders.
• Develop and implement a career path training and development program for career advancement that focuses on personal and professional development for promotion.
Education and Training Programs A part-time employee serves as the training officer for the OFD and is responsible to the fire chief to ensure training is conducted across all operational shifts for the seven full-time firefighters and the twenty-five part-time personnel and volunteers. The department considers training a priority, and strives to complete one to two hours of training each week. Departmental guidelines require a 50 percent attendance rate for full-time and part-time personnel at the weekly training drills. All employees and volunteers are paid for attending training sessions. ISO recommends upwards of twenty hours each month for fire-related training. In 2007, an ISO (Insurance Services Office) review of the OFD was done and it determined that OFD averages 3.47 hours per month in company

Fire / EMS Operational Analysis Report, Ontario, Oregon page 17
training for its members.3 This level of participation received less than 20 percent of the points allocated in this category of the rating. ISO reviews a number of fire training activities, including;
• Training drills.
• Company training.
• Classes for officers.
• Driver and operator training.
• New driver operator training.
• Training on hazardous materials.
• Recruit training.
• Prefire planning inspections.
• Records.
During the ISO review, OFD received 2.16 points out of a possible 9 points for its training activities. What was even more noteworthy were those training functions in which OFD received no points (Training Records and Prefire Planning Inspections). In only two areas (Library & Training Manuals and New Drive Operator Training) did OFD receive maximum credit for its training efforts. OFD has made a concerted effort to improve the volume of training activities and the reporting of these functions. It is estimated that the number of training hours delivered has increased to approximately 14 hours per month in 2013. ICMA did however receive internal concern among full-time personnel and the fire chief that the proper training is not being completed. In addition, it was noted that training drills involving area mutual aid partners and Treasure Valley Paramedics were needed as a focus of future training activities. As a part-time employee, the training officer, though capable, is often challenged in providing the critical and overarching management of a comprehensive training program. Training is an important function in a fire service operation. OFD is experiencing much difficulty in meeting minimum training needs in both its firefighting and EMS efforts.
As the current requirement for a probationary firefighter (new hire) is to possess Basic Firefighter certification (in accordance with the state of Oregon, Department of Public Safety Standards and Training) and EMT-B certification (in accordance with the state of Oregon Health Authority-EMS and Trauma Systems and local requirements), most new hires are obtained from the ranks of part-time employees with OFD. The state of Oregon does not have a training or certification mandate for firefighters operating within the state. Training requirements are a municipal responsibility and the state provides voluntary guidelines to assist local government in this decision making. Though the city of Ontario provides for an open, competitive process for new firefighters, when openings occur they are usually filled from employees who have served in a part-time capacity. OFD has a lengthy training and probationary period for its part-time fire fighters that spans a two-year period. This training process is done entirely in-house and is supervised by duty personnel and part-time fire 3 Public Protection Summary Report, Insurance Services Office, Inc.-November 13, 2007.

Fire / EMS Operational Analysis Report, Ontario, Oregon page 18
fighters. At the conclusion of this effort part-time employees are qualified as “relief workers” and have completed Fire Fighter I & II task books along with achieving EMT-B Certification.
Recommendations: • Assign the new fire captain position the oversight of fire and EMS training within the
organization. Prioritize as a duty of this new position the management and delivery of a comprehensive training program that includes both cognitive and hands-on practical training. Utilize annual assessments of all personnel in both emergency medical services and fire suppression to monitor the quality of the training program and the skills maintenance of full-time and part-time personnel
• Consider a modification to the recruitment and selection of new firefighters to utilize a testing and screening process focusing on new candidates who have achieved Firefighter I & II certification along with EMT-I certification.
• With the creation of the fire lieutenant position on each shift, build into this new job description a full regimen of training responsibilities and minimum performance measures regarding training that complies with ISO, Department of Public Safety, and Malheur County EMS training criteria.

Fire / EMS Operational Analysis Report, Ontario, Oregon page 19
Essential Resources
Fire Prevention/Fire Investigation/Public Education Fire suppression and response, although necessary in minimizing property damage, have little impact on preventing fires. Rather, public fire education, fire prevention, and built-in fire protection and notification systems are essential elements in protecting citizens from death and injury due to fire. OFD enforces the 2010 edition of the Oregon Fire Code as adopted according to city of Ontario Code of Ordinances. Chapter 5-2-2 of the city’s code further identifies the fire chief, fire marshal, and fire inspector with authority to enforce the provisions of the fire code.
The fire prevention program in Ontario is managed by the building department with assistance from the fire chief. The fire chief signs off on all certificates of occupancy (CO’s) in which fire protection systems are required by the fire code. The Chief is involved in all pre-reviews with developers to insure that fire code provision are properly injected into the process. Line personnel have had minimal involvement in the pre-fire planning process or in conducting in-service company inspections. On a periodic basis, line personnel accompany the Deputy State Fire Marshal on required inspections (i.e., schools, state institutions and other licensed facilities). Annual or biennial inspections and maintenance inspections of non-licensed commercial or residential properties, typically done by fire personnel, are currently not being done in Ontario.
Arson investigation is managed by the duty officer with assistance from the fire chief if needed. Origin and cause is the responsibility of the duty officer. If arson is suspected, the investigation will be initiated by the duty officer with assistance from the Ontario Police Department. In more extensive cases involving large fire loss or deaths, the Deputy State Fire Marshall along with the Ontario State Police Arson Unit may be called in to manage the investigation.
The OFD public education program is primarily an outreach by fire companies that focuses on school children. The department presents safety programs to first grade students in the spring each year and second grade students in the fall. The department participates in area and business safety programs upon request and also sponsors fire station visits and tours in which safety messages are provided. The department has an active smoke detector give-away program and often provides smoke detector battery exchanges when requested.
Recommendations: • Designate the fire captain position, assigned to a 40-hour schedule, with the responsibility
for the oversight of fire prevention, fire inspections, and the code review process, working in conjunction with the Ontario Building Department.
• Formalize a departmental policy that identifies and requires fire companies to conduct periodic inspections (in accordance with code stipulations) into high-hazard and target occupancies for the purpose of ensuring fire code compliance and to provide personnel with familiarity with target locations. Assign the oversight of this responsibility to one of the newly promoted fire lieutenants, reporting to the captain.

Fire / EMS Operational Analysis Report, Ontario, Oregon page 20
• Provide oversight and require the development of prefire planning for critical structures and place these documents on the mobile data computers (MDCs) of responding units for rapid retrieval during response. Assign the oversight of this responsibility to one of the newly promoted fire lieutenants, reporting to the captain.
• Develop and implement an incident reporting requirement for the newly promoted fire lieutenants that ensures that all responses (fire, EMS, and other) have an associated incident report completed in a timely fashion. Assign one of the lieutenants as a quality assurance officer, reporting to the captain, who is responsible for the review the incident reporting process, ensuring that critical information is properly documented (i.e., call type, response times, action taken, occupancy type, personnel involved, units responding, fire loss, patient information, and etc.). This officer should produce a monthly summary report regarding response activities.
Emergency Communications
The OFD receives its emergency communication services from the Malheur County Sherriff’s Office. The 9-1-1 Center is located in the Sheriff’s Headquarters in Vale. The Center serves as a regional PSAP for Malheur County, Ontario, and Nyssa. It also provides police, fire, and EMS dispatching for OPD, OFD, Treasure Valley Paramedics, Vale PD and FD, Nyssa PD and FD, Jordan Valley Fire and BLM.
At the time of the ICMA interviews the city of Ontario and Malheur County were finalizing an interlocal agreement for dispatching services. The proposed agreement identified an annual fee for police and fire dispatching services at $237,090, plus any 9-1-1 excise tax the city receives for the operation of a 9-1-1 Center (estimated to be $54,792 in 2014). The agreement establishes a 9-1-1 User Board to guide the efforts of the Center and to address any problems in the Center’s operation. The User Board consists of fire, police, and ambulance representatives receiving service from the Center. It is estimated that the User Board will consist of approximately twelve to thirteen members. Funding for Center operations and capital expenses is derived from a formula that is based on the population served of the various member agencies.
The proposed staffing for the Center is a minimum of two personnel; however, during a four-hour time frame from 3:00 a.m. until 7:00 a.m., the Center will be staffed with only one person. Ontario police dispatchers who provided dispatching service prior to the consolidation with the Sheriff’s Office have been transferred to the Sheriff’s Office and afforded the benefits and seniority as defined in a separate agreement regarding these transfers.
The Center appears professionally run and its dispatchers are experienced employees. At the time of our visit a new dispatching supervisor was being considered, but had not yet been named. When fully consolidated the Center will service an estimated service population of 31,313, of which nearly 53 percent (16,545) are located in the incorporated cities of Adrian, Jordan Valley, Nyssa, Ontario, and Vale. Malheur County covers nearly 10,000 square miles in land area.

Fire / EMS Operational Analysis Report, Ontario, Oregon page 21
The Center does not have a designated back-up dispatch center in case of an emergency, equipment failure, or another situation that would require the Center to go off-line. The facility is secure, and auxiliary generators are on site to ensure uninterrupted operations during power outages. All radio and telephone communications are recorded and the Center utilizes a CMI/JusticeWeb computer-aided dispatch (CAD) system. These systems are primarily a police system, but have applications for fire and EMS. The Center does not incorporate any call screening or call prioritization. It provides some pre-arrival instructions for medical emergencies but any modification for response is done at the emergency responder level and not on the basis of patient inquiries conducted by the Center. The Center does not do any quality assurance or review of dispatcher performance to ensure that procedures are followed or performance measures are achieved.
The Center has the capacity to expand its use of emergency medical dispatching (EMD) into its dispatching operations for Ontario and Treasure Valley Paramedics. EMD is a systematic process in which dispatchers utilize a predefined series of questions to determine the severity of the call. EMD also provides guidance to dispatch personnel in their ability to provide pre-arrival instructions (first aid and safety instructions). EMD in its optimum application recommends an altered level of response based on the severity of the call. EMD systems have improved system efficiency in managing EMS workloads in many jurisdictions across the nation. This type of call screening and altered response can have application in Ontario and in joint responses with Treasure Valley Paramedics. As we will be showing in our review of response activities among these agencies, nearly 95 percent of all EMS responses result in an emergency response from both agencies. This level of emergency response is much higher than we would anticipate if an EMD call screening process were implemented. Proper call screening and prioritization could reduce this response activity markedly. This then would improve the safety of the responders as well as improve unit efficiency and availability.
Typically the EMD call screening process categorizes responses into four levels of severity:
• Alpha: Non-life-threatening where time will not affect patient outcome (e.g., Band-Aids and non-acute illness).
• Beta: Non-life-threatening where time may affect outcome (e.g., acute illness, minor fractures, and/or immobilizing injuries due to pain).
• Charlie: Potentially life-threatening where time may affect outcome (e.g., major fractures or blunt trauma).
• Delta: Life-threatening of highest priority (e.g., cardiac arrest or respiratory difficulty/arrest.).
These determinants can also foster an altered emergency response mode. Typically the breakdown of these response modes is as follows:
• Alpha: Single BLS response, no lights or sirens.
• Beta: Single BLS response, light and sirens.
• Charlie: ALS and BLS Response, one unit with lights and sirens.

Fire / EMS Operational Analysis Report, Ontario, Oregon page 22
• Delta: Priority ALS Response, all units responding with lights and sirens.
There are a number of fire call categories in which units respond in a nonemergency mode (no lights or sirens). These nonemergency responses are substantial and account for more than 50 percent of the total fire responses. The categories for this low-level response include:
• Residential automatic fire alarms (with no smoke or fire reported).
• Fire investigations.
• Smoke investigations.
• Wires down/wires arcing.
• Public assists.
• Police assists.
• Hazardous condition investigations.
• Occupancy overcrowding investigation.
Malheur County is fortunate in that it has a Medical Director in Dr. Morris Smith who is available to support EMD activities and build the capacity and efficiency of the dispatching services provided by the Center. Any efforts that expand the call screening and call prioritization process must be accompanied with a formal quality assurance process that reviews the performance of call takers regarding pre-arrival directives or call prioritization. OFD personnel have indicated that only on “patient lift” call types do they alter their response and downgrade to a nonemergency response.
The dispatch process is the first line of response in prehospital emergency medical care. The ability to dispatch the most appropriate resources to an incident is a proven method in ensuring optimum efficiency. With the limited resources available in Ontario and the heavy reliance on mutual aid and the recall of off-duty personnel, it is imperative that the dispatching process be as efficient as possible.
Recommendations: • Develop and utilize performance measures to monitor critical operations of the Dispatch
Center.
• Institute Emergency Medical Dispatching and Call Prioritization for EMS and Fire Response.
• Develop a quality assurance process that reviews Dispatcher performance and compliance regarding EMD, Call Prioritization and Pre-Arrival Instructions.
• Identify an alternative dispatching facility that can serve as an emergency backup for the Dispatch Center. Institute policies that test its operational readiness regularly.
• Once the Dispatch Center is fully operational, evaluate the staffing levels and workload issues to ensure efficiency and operational effectiveness, particularly when only a single dispatcher is on duty.

Fire / EMS Operational Analysis Report, Ontario, Oregon page 23
• Build more structure into the Dispatch Center’s User Board, establishing its role to review critical system performance and the monthly monitoring of the Center’s activities.
• Consider the creation of an “Executive Board” or “Steering Committee” that is smaller in number of members (four to five maximum) and has greater oversight and review of Dispatch Center performance.
• Consider placement of the dispatch supervisor as an ad hoc member of the User Board/Executive Board.
External System Relationships/Mutual Aid Local governments use many types of intergovernmental agreements to enhance fire protection and EMS services. These arrangements take many shapes and forms and range from a simple automatic response agreement that will respond a single unit to a minor vehicle accident or EMS call, to a more complex regional hazardous materials team or a helicopter trauma service that involves multiple agencies and requires a high level of coordination. It is important that fire departments are able to quickly access extra and/or specialized resources in the aftermath of a disaster or other large-scale event. In addition, because these types of incidents do not respect jurisdictional boundaries, they often require coordinated response. Sharing specialized capabilities also helps departments reduce costs without impacting service delivery. All of these situations point to the need for good working relationships with other fire and EMS organizations.
In addition, having interoperable communications, such as the linking of CAD systems and unit-to-unit communications, is essential for providing a cohesive and coherent approach to interagency cooperative services. Currently, the OFD as a member of the Snake River Valley Fire Chief’s Association, is party to that association’s mutual aid agreement that includes 26 departments in Southeastern Oregon and Southwestern Idaho. In 2013 a total of 36 mutual aid assists (32 given and 4 received) were recorded. These calls are typically the more substantive type incidents and on average can last upwards of three hours per incident. OFD works most closely with the cities of Vale, Nyssa, Adrian, Payette, Weiser, and Fruitland. In addition, mutual aid responses between neighboring rural fire protection districts occur periodically. In the event of large-scale emergencies, the Oregon Conflagration Act (ORS 476.510) and the Oregon Emergency Response System (OERS) can be utilized to obtain statewide assistance. These agreements and the interoperability they provide represent best practices and are a necessity given the limited available resources in the area.

Fire / EMS Operational Analysis Report, Ontario, Oregon page 24
Regional Hazardous Material Emergency Response Team The Ontario Fire Department has entered into an intergovernmental agreement with the Oregon State Fire Marshal’s Office for providing hazardous materials response. OFD is responsible for response with qualified technicians into Hazardous Materials Region #14 of the State of Oregon. Region 14 is the largest response region in the state, encompassing an estimated 20,000 square miles. The state of Oregon provides OFD with a hazardous materials response vehicle, equipment, and supplies for its services. A total of thirteen personnel have been trained in accordance with state of Oregon guidelines as hazardous materials technicians. Five of these personnel are full-time firefighters with OFD and eight team members are part-time personnel. Under the terms of the agreement, team members must undergo periodic training and maintain a training task book documenting the training received. All costs associated with employee training, including full employee benefit costs, are paid by the state of Oregon. Team members must also undergo an annual medical screening and fitness evaluation as part of the compliance standards.
In 2013 the OFD Regional Hazardous Materials Response Team responded to seven incidents within Region-14. An OFD firefighter serves as the coordinator for the team and is responsible for training and reporting compliance as indicated in the IGA. Hazardous Materials Team members receive additional pay for maintaining their certifications and receive overtime for off-duty training and response. Figure 5 shows the Oregon Regional Team Response Area Boundaries.
FIGURE 5: Hazmat Regional Team Response Area Boundaries:

Fire / EMS Operational Analysis Report, Ontario, Oregon page 25
Assessment and Planning
Strategic Planning/Goals and Objectives The development of a long-range strategic plan for fire protection and prevention activities involves three key steps. The first step is to generate an assumption of what the community will look like at the end of the planning process. Second, the department needs to assess realistically the strengths and weaknesses of the existing fire protection system to include codes, standards, and ordinances relating to fire prevention efforts, public safety education programs, and emergency response capability. The third and final step is to project the needed capabilities and capacity of the fire protection system and its fire department component as the community changes.4 This process helps to ensure that an adequate level of resources, including staffing and equipment, are allocated to meet the community’s needs for the services delivered by the fire department as efficiently as possible. A strategic plan also assists the department in matching resources with available revenues.
Defining clear goals and objectives for any organization through a formal strategic planning document establishes a resource that any member of the organization, or those external to the organization, can view and determine in what direction the organization is heading, and as well how the organization is planning to get there.
In a strategic plan, it is essential that clear and achievable goals and objectives for each program area are developed. Each program area must then:
1. Define its goals.
2. Translate the goals into measurable indicators of goal achievement.
3. Collect data on the indicators for those who have utilized the program.
4. Compare the data on program participants and controls in terms of goal criteria.5
Objectives should be SMART, an acronym that stands for specific, measurable, ambitious/attainable, realistic, and time-bound. Additionally, these goals should link back to fiscal planning goals and be utilized in these documents.
The OFD does not have a strategic plan. ICMA recommends the following steps be completed in developing this critical process6:
Develop a vision of the community: Working with the community development department, develop a comprehensive vision of what Ontario will look like in the short term and throughout the strategic planning process.
4 Fire Protection Handbook, Twentieth Edition, Volume II (National Fire Protection Association, 2008), 12-5. 5 Grover Starling, Managing the Public Sector, (Cengage Learning, 2010), 287. 6 McNamara, C. (1996-2007) Basic Overview of Various Strategic Planning Models. Adapted from the Field Guide to Nonprofit Strategic Planning and Facilitation.( Minneapolis, MN: Authenticity Consulting, LLC).

Fire / EMS Operational Analysis Report, Ontario, Oregon page 26
Look inwardly: Conduct an organizational Strengths, Weaknesses, Opportunities, and Threats (SWOT) analysis and include the results in the strategic planning process.
Monitor and update the plan: Regulalrly reflect on the extent to which the goals are being met and whether action plans are being implemented. Perhaps the most important feedback is positive feedback from customers, both internal and external.
Performance Measurement Fire suppression, prevention programs, and EMS delivery needs to be planned and managed to achieve specific, agreed-upon results. This requires establishing intended results and a set of goals for the activities of any given program to achieve these results. Determining how well an organization or program is doing requires that these goals be measurable and that they are measured against desired results. This is the goal of performance measurement.
Simply defined, performance measurement is the ongoing monitoring and reporting of progress toward pre-established goals. Performance measurement captures data about programs, activities, and processes, and displays data in standardized ways that help communicate to service providers, customers, and other stakeholders how well the agency is performing in key areas. Performance measurement provides organizations with tools to assess performance and identify areas in need of improvement. In short, what gets measured gets done.
The need to continually assess performance requires adding new words and definitions to the fire service lexicon. Fire administrators need to be familiar with the different tools available and the consequences of their use. In Managing the Public Sector, business professor Grover Starling applies the principles of performance measurement to the public sector. He writes that the consequences to be considered for any given program include:
Administrative feasibility: How difficult will it be to set up and operate the program?
Effectiveness: Does the program produce the intended effect in the specified time? Does it reach the intended target group?
Efficiency: How do the benefits compare with the costs?
Equity: Are the benefits distributed equitably with respect to region, income, gender, ethnicity, age, and so forth?
Political feasibility: Will the program attract and maintain key actors with a stake in the program area?7
Performance measurement systems vary significantly among different types of public agencies and programs. Some systems focus primarily on efficiency and productivity within work units, whereas others are designed to monitor outcomes produced by major public programs. Still others track the
7 Starling, Managing the Public Sector, 396.

Fire / EMS Operational Analysis Report, Ontario, Oregon page 27
quality of services provided by an agency and the extent to which citizens are satisfied with these services.
Within the fire service, performance measures tend to focus on inputs (the amount of money and resources spent on a given program or activity) and short-term outputs (the number of fires in the community, for instance). One of the goals of any performance measurement system should be also to include efficiency and cost-effectiveness indicators, as well as explanatory information on how these measures should be interpreted. The types of performance measures are shown in Table 1.
TABLE 1: The Five GASB Performance Indicators Category Definition
Input indicators These are designed to report the amount of resources, either financial or other (especially personnel), that have been used for a specific service or program.
Output indicators These report the number of units produced or the services provided by a service or program.
Outcome indicators These are designed to report the results (including quality) of the service.
Efficiency (and cost-effectiveness) indicators
These are defined as indicators that measure the cost (whether in dollars or employee hours) per unit of output or outcome.
Explanatory information This includes a variety of information about the environment and other factors that might affect an organization’s performance.
From Harry P. Hatry et al., eds. Service Efforts and Accomplishments Reporting: Its Time Has Come (Norwalk, CT: GASB, 1990).
One of the most important elements of performance measurement within the fire service is to describe service delivery performance in a way that both citizens and those providing the service have the same understanding. The customer will ask, “Did I get what I expected?” the service provider will ask, “Did I provide what was expected?”
Ensuring that the answer to both questions is “yes” requires alignment of these expectations and the use of understandable terms. The author of the “Leadership” chapter of the 2012 edition of ICMA’s Managing Fire and Emergency Services “Green Book” explains how jargon can get in the way:
Too often, fire service performance measures are created by internal customers and laden with jargon that external customers do not understand. For example, the traditional fire service has a difficult time getting the public to understand the implications of the “time temperature curve” or the value of particular levels of staffing in the suppression of fires. Fire and emergency

Fire / EMS Operational Analysis Report, Ontario, Oregon page 28
service providers need to be able to describe performance in a way that is clear to customers, both internal and external. In the end, simpler descriptions are usually better.8
The OFD produces a limited number of measurements with regard to its activities. The department does not utilize published goals or periodic measures regarding response activities, inspections, fire loss, public education, or other associated departmental activities. For instance, it collects and reports typical fire department data on response activities but does not regularly produce statistical reporting regarding other components of service activities, including fire loss, inspections, public education, and department communication. The capturing of response time data in whole minute increments—as is done currently—is completely ineffective in monitoring this critical measure. These data should be developed and reported in ways that link department goals to specific target rates or percentages that justify program budgets and service delivery levels.
To accomplish this linkage, other forms of performance measures, particularly service-quality and customer-satisfaction measures, should be incorporated into the system. Staff throughout the organization should participate in developing performance measures. In addition to helping facilitate department wide buy-in, this could provide an opportunity for upper management to better understand what the line staff believes to be critical goals—and vice versa. For the same reason, the process of developing performance measures should include citizen and volunteer input, which the city has with regard to service level preferences. Translating this advice from the citizens into performance measures will link the citizens and business community to the department, and will articulate clearly if their expectations are being met.
Establishing a performance management system within the framework of an overall strategic plan would help city management and elected officials gain a better understanding of what the OFD is trying to achieve. Building any successful performance management system that measures more than outputs requires a consistent model. Figure 6 illustrates a successful program logic model9 designed to build consistent performance measures and should be linked to the performance measure indicators shown in Table 1 to build a successful performance measurement system.
8 I. David Daniels, “Leading and Managing,” in Managing Fire and Emergency Services (Washington, DC: 2012), 202. 9 Shows the logic by which program activities are expected to lead to targeted outcomes. Theodore Poister, Measuring Performance in Public and Nonprofit Organizations (San Francisco, CA: 2003), 35.

Fire / EMS Operational Analysis Report, Ontario, Oregon page 29
FIGURE 6: Performance Measure Program Logic Model10
Program logic component definitions:
• Type of Measure: identify the type of indicator to be measured.
• Program Activities: the provision of services provided by this program area.
• Outputs: the results of or how much is produced from the program activities.
• Initial/Intermediate Outcomes: substantive changes/improvements/benefits of the program as measured against the program goal.
• Long-term Outcomes: satisfy the stated Goal—links to the Budget/Strategic Plan.
ICMA has identified this shortfall in the OFD and recommends that Ontario undertake a concerted effort to develop performance measures throughout the organization. The following are a number of performance measures that may be considered:
Operations:
• Response Times (Fire & Fractile/Average/Frequency of Excessive Times)
○ Alarm handling
○ Turnout times
10 Poister, Measuring Performance in Public and Nonprofit Organizations, 44.

Fire / EMS Operational Analysis Report, Ontario, Oregon page 30
○ Travel times
○ On-Scene time
○ Call duration
○ Cancelled en route
○ Response times of units responding to a “General Alarm”
○ Number of personnel responding to a “General Alarm”
• Workload Measures
○ Emergency vs. Nonemergency responses
○ Response to automatic fire alarms/frequency and outcomes
○ Company inspections/area-occupancy familiarization
○ Smoke detector distribution(installations & follow-up)
○ Prefire planning
○ Public education–contact hours/numbers by age group
○ Volunteer participation (emergency and support activities)
• Outcome Measures
○ EMS/save rates/action taken
○ Fire loss/limit of fire spread–point of origin, room of origin, etc.
○ On-duty injuries/workers’ compensation claims
○ Lost time–sick/injury
○ Vehicle accidents
○ Equipment lost or broken
○ Fitness performance
Training:
• Fire and EMS hours
• Volunteer and part-time employees participating in training activities
• Officer development
• Specialty training
• Professional development/formal education/certifications
Prevention:
• Plans review (numbers/valuation/completion time)
• Inspections (new and existing)

Fire / EMS Operational Analysis Report, Ontario, Oregon page 31
○ Numbers
○ Completion time
○ Violations (found/corrected)
○ Quantification by type of violation and occupancy type
• Fire Investigations
○ Numbers and determinations
○ Arson arrests/convictions
○ Fire deaths/injuries (demographics/occupancy type/cause & origin)
○ Fire loss (structure & contents)
Miscellaneous:
• Customer Service Surveys
○ Following emergency response
○ Public assist
○ Inspections (prevention and company)
○ Public education
○ In-service training (student assessments)
Recommendations: • The OFD should develop and implement a performance measure reporting system that
expands the type of measurement it employs, including a program logic model.
• Performance measures should be developed for each department activity, and should link to the strategic and comprehensive planning documents and fiscal/budget documents.
Community Risk Assessment and Emergency Management Planning The city of Ontario is not very adept in its emergency planning and community risk assessment. ICMA has found the caliber of emergency planning and its level of specificity in Ontario to be nearly nonexistent, with little emphasis or focus on this critical area of preparedness. The city does not have an Emergency Operations Plan (EOP). The city operates within the Malheur County’s EOP, but has made few preparations for disruptions within the system and contingency plans for key areas of facilities. The city has not developed a Continuity of Operations Plan (COOP). A back-up facility for the consolidated 9-1-1 Sheriff’s Communications Center has not been identified. There are few prefire planning documents for critical structures or target hazards (hospitals, schools, adult living facilities, correctional institutions, etc.). The city does not have formal planning documents

Fire / EMS Operational Analysis Report, Ontario, Oregon page 32
regarding severe weather emergencies or flooding. This level of preparedness and the degree of importance afforded these critical concerns has not been a priority in the city of Ontario.
Community risk and vulnerability assessment are essential elements in a fire department’s planning process. According to a National Fire Protection Association (NFPA) paper on assessing community vulnerability, fire department operational performance is a function of three considerations: resource availability/reliability, department capability, and operational effectiveness.11 These elements can be further defined as:
Resource availability/reliability: The degree to which the resources are ready and available to respond.
Department capability: The ability of the resources deployed to manage an incident.
Operational effectiveness: The product of availability and capability. It is the outcome achieved by the deployed resources or a measure of the ability to match resources deployed to the risk level to which they are responding.
The community risk and vulnerability assessment evaluates the community as a whole, and with regard to property types. It is used to measure all property and the risk associated with that property and then segregates the property as either a high, medium, or low hazard. According to the NFPA Fire Protection Handbook, these hazards are defined as:
High-hazard occupancies: Schools, hospitals, nursing homes, explosives plants, refineries, high-rise buildings, and other high life-hazard or large fire-potential occupancies.
Medium-hazard occupancies: Apartments, offices, and mercantile and industrial occupancies not normally requiring extensive rescue by firefighting forces.
Low-hazard occupancies: One-, two-, or three-family dwellings and scattered small business and industrial occupancies.12
Fire Preplanning In addition to examining communitywide risk and vulnerability, the OFD should examine specific risk and vulnerability on the basis of its critical occupancies. Risk assessment and vulnerability analysis are not new to the fire service, as the NFPA 1620 Standard, Recommended Practice for Pre-Incident Planning, identifies the need to utilize both written narrative and diagrams to depict the physical features of a building, its contents, and any built-in fire protection systems. The occupancies that are typically specified for pre-incident plans or “preplans” are as follows:
• Large assembly
• Educational 11 Fire Service Deployment, Assessing Community Vulnerability: From http://www.nfpa.org/assets/files/pdf/urbanfirevulnerability.pdf 12 National Fire Service Data Summit Proceedings, U.S. Department of Commerce, NIST Tech Note 1698, May 2011.

Fire / EMS Operational Analysis Report, Ontario, Oregon page 33
• Health care
• Detention and correction
• High-rise residential
• Residential board and care (assisted living)
• Mercantile
• Business
• Industrial
• Warehouse and storage.
Our evaluation has found OFD to be deficient in these preplanning efforts. Preplans that existed were not on any schedule for update or periodic review. The most recent Insurance Services Office (ISO) review (2010) of the city found its fire preplanning efforts to be substandard. In this rating, OFD received zero (o) points out of a possible 15 points available in this category. It was apparent that little or no effort was focused on improving this performance since the 2010 ISO evaluation was completed.
Risk Management/Fire Fighter Health & Fitness In addition to examining community risk and vulnerability, OFD should examine the internal risk and vulnerability of its personnel. NFPA 1500; Standard for a Fire Department Occupational Safety and Health Program (2007), recommends the development of a separate risk management plan for fire department personnel in response to their work environment. In order for this process to be effective, the following components must be included in the risk management plan:
Risk identification: Actual or potential hazards.
Risk evaluation: The potential for occurrence of a given hazard and the severity of its consequences.
Prioritizing risk: The degree of hazard based upon the frequency and severity of occurrence.
Risk control: Solutions for eliminating or reducing real or potential hazards by implementing an effective control measure.
Risk monitoring: Evaluation of effectiveness of risk control measures.
NFPA 1582: Standard on Comprehensive Occupational Medical Program for Fire Departments, (2013), and NFPA 1583: Standard on Health-Related Fitness Programs for Fire Department Members, (2008) provide guidance to fire departments with regard to medical screening standards and annual fitness requirements for its members. ICMA found that OFD conducts fitness assessments that correspond to local fire and EMS workloads. The department is in development of an annual medical screening process for nonhazmat team members. Hazmat team members undergo annual medical screening in accordance with Oregon State Fire Marshal guidelines.

Fire / EMS Operational Analysis Report, Ontario, Oregon page 34
The risk management plan establishes a standard of safety for the daily operations of the OFD and a guideline for employee medical health and fitness. This standard of safety establishes the parameters within which the OFD should conduct all activities during emergency and nonemergency operations. The intent is for all members to operate within this standard or plan of safety and not deviate from this process. Through this effort accidents can be minimized and employee lost time reduced. Because of the heavy utilization of both part-time and volunteer personnel, it is important that OFD fully evaluate the fitness levels of the volunteers and part-time employees. Special consideration should be focused on the types of health insurance, workers’ compensation, and survivor benefits that are afforded non-full-time employees in the event of injury or death.
Recommendations: • OFD and the city of Ontario should undertake a comprehensive effort in developing
emergency preparedness efforts, specifically developing a citywide Emergency Operations Plan (EOP) and a Continuity of Operations Plan (COOP), and should undertake a complete review of critical municipal structures and contingency planning in the event of some type of partial of full compromise of these facilities.
• OFD should develop and institute annual medical screenings and an ongoing fitness assessment process for its operational personnel. Further, OFD should consider a partnering effort with neighboring jurisdictions in providing medical screening and fitness assessments to it personnel.
• OFD should fully evaluate the types of workers’ compensation benefits and survivor benefits that are available for part-time and volunteer employees who may be seriously injured or killed when they are performing their assigned duties.

Fire / EMS Operational Analysis Report, Ontario, Oregon page 35
Infrastructure
Fixed Facilities/Capital Vehicles The OFD operates out of a single station located in the center of the city. The facility was constructed in the 1970s as part of the city hall complex and houses seven fire apparatus. Fire Station #2 is located in the western section of the city and can house up to ten fire apparatus. This facility is used primarily for the storage of apparatus and is not staff with response personnel. Both facilities are very well kept and there was an apparent pride and attention given to the maintenance and upkeep of these facilities. Both fire stations have auxiliary power and diesel exhaust evacuation systems. Station # 1 has washing machines designed for heavy turnout equipment and bio-waste disposal.
Fire Station #1 houses both the administrative offices and the operational component of the department. A single rescue-engine operates out of this facility with a crew of two career personnel. Currently, the administrative function consists of the fire chief and a civilian administrative assistant. The department has seven response apparatus, including wildland units and tenders that are housed at Station #1.
As noted above, the OFD operates an array of vehicles including heavy fire apparatus, wildland units, an aerial apparatus, and staff vehicles. The OFD fleet is relatively new, and the apparatus appear well maintained. One of the full-time firefighters is responsible for fleet maintenance and he works in conjunction with the city’s fleet services staff and local vendors in keeping the apparatus in a ready state. The OFD does not have a formal replacement plan for its apparatus. The Rural Fire Protection District allocates $40,000 annually for apparatus and equipment replacement. This allocation is placed into an apparatus/equipment reserve fund and as of the date of this report this fund had in excess of $230,000. The fund is carried over from year to year and is available for apparatus and equipment purchases as needed and determined by the fire chief. This allocation is in addition to the $111,000 annual contract fee paid to the city for response service into the protection district. Table 2 is a listing of the current OFD response fleet.

Fire / EMS Operational Analysis Report, Ontario, Oregon page 36
TABLE 2: OFD Apparatus Inventory
Unit Type Make Year Age Rescue 1 Rescue/Pumper Kenworth-Pierce 2009 5 Years Engine 101 Type 1/Pumper Pierce 1996 18 Years Engine 102 Wildland/Brush Ford-F250 2000 14 Years Engine 103 Type 1/ Pumper Pierce-Saber 2012 2 Years Engine 105 Command Ford Expedition 2003 11 Years Truck 109 Aerial Ladder Seagraves 110’ 1987 27 Years Unit 125 Rehab Ford E-350 1996 18 Years Tender 155 Tender Kenworth-Pierce 2005 9 Years Engine 156 Wildland/Brush Dodge-5500 2014 0 Years Engine 157 Wildland/Brush Dodge-5500 2009 5 Years Engine 158 Type I/Pumper Pierce Arrow 1982 32 Years Tender 159 Tender International Pierce 2010 4 Years Hazmat 14A Specialty Chevrolet 2009 5 Years Hazmat 14B Semi International 2008 6 Years Hazmat Trailer Trailer/Storage 16’ Trailer 2009 5 Years Mass Casualty Trailer/Storage 19’ Trailer 2001 13 Years
Ontario does not operate nor does it maintain in its fleet a transport-capable rescue vehicle or ambulance similar to what is operated by TVP. Because of the codependence that exists between TVP and the city of Ontario, ICMA recommends that the city consider a future purchase that would add an ambulance to its fleet. Arrangements should be considered that allows the co-utilization of this equipment during periods of heavy call volume or when TVP ambulances are unavailable or out of service because of mechanical problems. The TVP fleet is extremely aged and TVP representatives indicated they had difficulty maintaining the readiness of their fleet. The addition of a transport-capable ambulance to the OFD fleet will ensure the availability of this vital resource for both the city and rural fire district usage.
Recommendations: • OFD and the city of Ontario should consider the purchase of a transport-capable ambulance
that can be co-utilized by TVP to ensure the viability of transport operations in both the city and the rural fire district.

Fire / EMS Operational Analysis Report, Ontario, Oregon page 37
Operational Response and Workload The Ontario Fire Department provides fire and EMS services from its primary fire station, which is located at 444 SW 4th Street. The city is approximately 5.2 square miles in area. In addition, OFD has entered into a service contract with the Ontario Rural Fire Protection District and assumes service responsibilities to an additional 110 square miles of predominately rural rangeland and sparsely populated farms surrounding city limits. The city’s population is estimated to be 11,200 residents, with frequent daytime surges due to the commerce generated by the many service outlets and business establishments that are located along Oregon Highway 20 and Interstate 84. In addition, the Union Pacific railroad has a north-south line passing through the city and frequent freight trains travel through city limits.
FIGURE 7: Ontario Fire Station #1 and Ontario City Limits
The OFD responds to emergency calls received through the Malheur County Sheriff’s Office Communications Center, which serves as the city’s 9-1-1 Public Safety Answering Point (PSAP). Ontario entered into a service contract with the Malheur County Sheriff’s Office and shifted its dispatch responsibilities from the Ontario Police Department to the Sheriff’s Office in early 2014. During the 12-month period of this study from January 1, 2013 through December 31, 2013, dispatch services were provided by the Ontario Police Dispatch Center. Thus, the data report and statistical analysis was obtained from data provided by the Ontario Police Dispatch Center. The transition between dispatch centers was ongoing during the ICMA site visit in April 2014.
OFD units responded to 1,901 calls that originated from within city limits and the Rural Fire Protection District. It is estimated that 90 percent of the call activity originated within city limits and the remaining 10 percent of the calls originated from the rural fire district. Of the total calls, 21

Fire / EMS Operational Analysis Report, Ontario, Oregon page 38
were structure fire calls and 89 were classified as other or outside fire calls (wildland, grass, trash, dumpster, vehicle, etc.). There were 25 incidents classified as “hazardous conditions” and 1,579 calls (83.1 percent) classified as emergency medical incidents (including motor vehicle accidents). The remaining 137 calls (7.3 percent) were classified as public service, good intent, and false alarms. In addition, OFD responded to 32 incidents that originated in mutual aid jurisdictions. On approximately 18 calls, OFD units were cancelled en route to the call, prior to arrival.
Operational Category Call Types Nationwide, fire departments are responding to more EMS calls and fewer fire calls, particularly significant fire calls that result in active firefighting operations. Improved building construction, code enforcement, automatic sprinkler systems, and aggressive public education programs have contributed to a decrease in serious fires and, more importantly, fire deaths among civilians. In addition, the incidence of fires is greatly influenced by demographics; lower income earners and rental vs. owned properties have a higher occurrence of fire on a national basis. Another interesting trend ICMA continues to evaluate is the frequency of true emergencies vs. nonemergency or public assist calls. Our findings nationally (based on ICMA fire data reports) are indicating that in some jurisdictions more than 50 percent of all responses (fire, EMS, and other) are nonemergency in nature. This factor is critical when calculating response time data, determining staffing levels, and identifying appropriate deployment strategies.
The Ontario Fire Department operates as the quick response unit (QRU) in a two-tiered EMS delivery system. OFD operates in tandem with Treasure Valley Paramedics (TVP), which serves as the advanced life support (ALS) or paramedic provider in the Ontario Ambulance Service Area (ASA). OFD provides basic life support (BLS) either at the EMT-Basic or EMT-I level. EMT-I is considered an “Intermediate” level of care and allows practitioners trained and equipped to provide a higher level of care that involves the administration of intravenous fluids and certain drugs. In addition, EMT-I’s can perform some advanced levels of airway management and are trained in additional diagnostic skills. OFD provides both EMT-Basic and EMT-I levels of care. This service delivery option is altered depending on the individual on duty and their level of training. In a two-tiered delivery system, the QRU (typically fire departments) provide first responder care at the EMT or EMT-I level. The QRU is designed to arrive first on scene, assess and stabilize the patient, and then assist the ALS provider in the delivery of ALS care and transport. On most EMS calls in Ontario, both the OFD and TVP unit are dispatched and each responds in an emergency mode (lights and sirens)
The key to improved efficiency with regard to deploying emergency resources is best achieved through a more robust call prioritization process at the 9-1-1 dispatch center. The ability for call takers to accurately screen calls and then assign the most appropriate unit(s) can pay substantial dividends in the following ways:
• Increased unit availability.

Fire / EMS Operational Analysis Report, Ontario, Oregon page 39
• Reduced wear and tear on the vehicles.
• Reduced fuel costs.
• Reduced vehicle maintenance.
• Reductions in the potential for vehicle accidents.
In addition to having fewer units respond during minor incidents or public assists, there is also the ability to respond these units at slower speeds, without using lights and sirens, and obeying all traffic signals. We believe that OFD, in conjunction with the Malheur County Sheriff’s Office Communications Center, can adjust its response patterns so that on minor or nonemergency incidents either an OFD or a TVP unit responds and that unit may respond in a nonemergency mode. Table 3 depicts the specific call types and number of calls responded to by OFD.
TABLE 3: Call Types
Call Type Number of Calls
Calls per Day
Call Percentage
Cardiac and stroke 131 0.4 6.9 Seizure and unconsciousness 132 0.4 6.9 Breathing difficulty 105 0.3 5.5 Overdose and psychiatric 77 0.2 4.1 MVA 7 0.0 0.4 Fall and injury 106 0.3 5.6 Illness and other 1,021 2.8 53.7
EMS Total 1,579 4.3 83.1 Structure fire 21 0.1 1.1 Outside fire 89 0.2 4.7 Hazard 25 0.1 1.3 False alarm 60 0.2 3.2 Good intent 36 0.1 1.9 Public service 41 0.1 2.2
Fire Total 272 0.7 14.3 Mutual aid 32 0.1 1.7 Canceled 18 0.0 0.9
Total 1,901 5.2 100.0
Observations: • The department received an average of 5.2 calls per day, including mutual aid and canceled
calls.
• EMS calls for the year totaled 1,579 (83 percent of all calls), averaging 4.3 per day.
• Fire calls for the year totaled 272 (14 percent of all calls), averaging 0.7 per day.

Fire / EMS Operational Analysis Report, Ontario, Oregon page 40
• Structure and outside fire calls combined for a total of 110 calls during the year, averaging one call every 3.3 days.
FIGURE 8: EMS and Fire Calls by Type
Figure 9 shows demand maps that illustrate the distribution of fire and EMS incidents that occurred during the study period. The plotting of these incidents and the distribution they represent do not

Fire / EMS Operational Analysis Report, Ontario, Oregon page 41
indicate any anomaly or concentration of alarms that would necessitate additional resources or facility relocations. Call activity is most concentrated in the center of the city and effectively serviced by the existing station location.
FIGURE 9: Plotting of Fire and EMS Runs
Observations: • A total of 21 structure fire calls accounted for 8 percent of the fire category total.
• A total of 89 outside fire calls accounted for 33 percent of the fire category total.
• False alarm calls were 22 percent of the fire category total.

Fire / EMS Operational Analysis Report, Ontario, Oregon page 42
• Illness and other calls were the largest EMS call category, accounting for 65 percent of the EMS category total.
• Cardiac or stroke calls were 8 percent of the EMS category total.
Recommendations: • OFD should consider raising its level of EMT care to an Intermediate level on a daily basis.
Operational Unit Deployment Time The time a unit is deployed on a single call is referred to as deployed time and indicates the workload of that particular unit. This can be measured as productive emergency response time over a shift period. In the case of the OFD, this measurement is extremely critical because only one unit is available on a daily basis, and if additional units are placed in service there are additional costs and delays in assembling off-duty staffing through a general alarm. An analysis of the OFD response data shows that on average EMS calls lasted 31.6 minutes and fire calls lasted 52.6 minutes. It was interesting to note that mutual aid/automatic aid calls lasted a longer amount of time, on average 172.8 minutes.
OFD has established the practice of following the TVP ambulance to the hospital on every call and then remaining at this facility during the off-loading of the patient in order to obtain patient information and replenish supplies. Because of this practice, EMS call durations are significantly higher, perhaps as much as 10 minutes on each call. Given the proximity of St. Alphonsus Medical Center, ICMA recommends that an alternative method of exchanging supplies and patient information be established. Only in extraordinary cases involving critical patient care (CPR, airway management, multiple patients, etc.) or when patient lifting requires additional assistance, should OFD follow TVP units to the hospital.
Table 4 provides details on the annual deployed time by call type.

Fire / EMS Operational Analysis Report, Ontario, Oregon page 43
TABLE 4: Annual Deployed Time by Call Type
Call Type
Average Deployed Minutes per Run
Annual Hours
Percent of Total Hours
Deployed Hours
per Day
Annual Number of Runs
Runs per Day
Cardiac and stroke 38.5 85 6.4 0.2 132 0.4 Seizure and unconsciousness 45.0 100 7.6 0.3 133 0.4 Breathing difficulty 34.0 60 4.6 0.2 106 0.3 Overdose and psychiatric 32.8 43 3.2 0.1 78 0.2 MVA 38.8 5 0.3 0.0 7 0.0 Fall and injury 31.3 56 4.2 0.2 107 0.3 Illness and other 28.7 502 38.2 1.4 1,049 2.9
EMS Total 31.6 849 64.6 2.3 1,612 4.4 Structure fire 109.2 104 7.9 0.3 57 0.2 Outside fire 44.5 89 6.8 0.2 120 0.3 Hazard 113.0 74 5.6 0.2 39 0.1 False alarm 13.9 14 1.1 0.0 62 0.2 Good intent 17.0 11 0.9 0.0 40 0.1 Public service 34.5 25 1.9 0.1 43 0.1
Fire Total 52.6 317 24.1 0.9 361 1.0 Mutual aid 172.8 147 11.2 0.4 51 0.1 Canceled 3.4 1 0.1 0.0 19 0.1
Total 38.6 1,314 100.0 3.6 2,043 5.6 Note: Each dispatched unit is a separate "run." As multiple units are dispatched to a call, there are more runs than calls. Therefore, the department responded to 5.2 calls per day and had 5.6 runs per day.
Observations: • Total deployed time for the year, or deployed hours, was 1,314 hours. This is the total
deployment time of all OFD units deployed on all type of calls, including 147 hours spent on mutual aid. The deployed hours for all units combined averaged approximately 3.6 hours per day.
• Mutual aid calls lasted on average 172.8 minutes, or nearly three hours for each mutual aid response.
• There were 2,043 runs, including 51 runs dispatched for mutual aid calls. The daily average was 5.6 runs for all units combined.
• Fire category calls accounted for 24.1 percent of the total workload.
• There were 177 runs for structure and outside fire calls, with a total workload of 192.8 hours. This accounted for 14.7 percent of the total workload. The average deployed time for structure fire calls was 109.2 minutes (one hour and 49 minutes), and the average deployed

Fire / EMS Operational Analysis Report, Ontario, Oregon page 44
time for outside fire calls was 44.5 minutes. ICMA believes that these times are much higher than those typically observed in other jurisdictions (usually about 20 minutes).
• EMS calls accounted for 64.6 percent of the total workload. The average deployed time for EMS calls was 31.6 minutes. This call duration is higher than the call durations we typically see for fire departments operating as a first responder with a private provider doing transports (The usual deployed time is typically about 20 minutes). The deployed hours for all units dispatched to EMS calls averaged 2.3 hours per day.
Recommendations: • OFD should consider a modification of its practice of following TVP units to the hospital
after each call.
• OFD should monitor more closely the amount of time spent on fire calls, particularly mutual aid responses, with an effort to complete these assignments more quickly.
Workload by Individual Unit—Calls and Total Time Spent In this section, the actual time spent by each unit on calls is reported in two types of statistics: workload and runs. A dispatch of a unit is defined as a run; thus one call might include multiple runs. The deployed time of a run is from the time a unit is dispatched through the time a unit is cleared. We ran into a significant problem in tabulating response times and unit activities. All time stamps were recorded at the minute—and not the seconds—level. The impact of this for workload calculations is minimal. However, we would like to acknowledge that the variance of estimated response time and actual response time at the incident level could be up to two minutes because of this issue with the time stamps. Even though the average of response time reported in this report could be reasonable, the 90th percentile and cumulative distribution function of response time requires improved accuracy.
Another critical problem in reporting unit activities was that in both CAD and NFIRS a narrative field was used to record unit-level responses. The incident table only recorded dispatch data of the primary responding unit. Subsequently, secondary units that responded were not identified and the records showing critical information are not tracked, i.e., personnel assigned, the time stamp of response activities (en route, arrival, etc.) and action taken.
Finally, there is no common incident number to link CAD and National Fire Incident Reporting System (NFIRS) data, which are typically used to cross-validate and leverage both data sets. In this report, we used identical address records and approximate call received times to match CAD and NFIRS incidents to analyze NFIRS incident type, action taken, and property and content loss data.

Fire / EMS Operational Analysis Report, Ontario, Oregon page 45
TABLE 5: Call Workload by Unit
Station Unit Type Unit ID
Average Deployed Minutes per Run
Annual Number of Runs
Annual Hours
Runs per Day
Deployed Hours
per Day
1
Pumper 101 119.4 17 33.8 NA NA Brush 102 132.7 17 37.6 NA NA
Pumper 103 96.2 23 36.9 NA NA Pumper/Tender 155 128.9 29 62.3 NA NA
Brush 157 62.5 85 88.5 NA NA Tender 159 110.5 17 31.3 NA NA
Rescue Pumper R1 31.5 1,837 963.1 5.0 2.6
2 Aerial 109 240.5 2 8.0 NA NA
Hazmat HM14A 208.2 5 17.4 NA NA Hazmat HM14B 191.2 11 35.1 NA NA
Observations: • Rescue Pumper R1 was the unit deployed the most often and had the most deployed hours.
It averaged 5.0 runs and 2.6 hours of deployed time per day. It accounted for 74 percent of deployed hours and 90 percent of total department runs.
• Two pumpers (101 and 103) combined made 40 runs in a year.
• Two brush trucks (102 and 157) combined made 102 runs in a year.
• Two hazmat units (HM14A and HM14B) combined made 16 runs in a year.
• Two tender units (155 and 159) made 46 runs in a year.

Fire / EMS Operational Analysis Report, Ontario, Oregon page 46
TABLE 6: Total Annual and Daily Average Number of Runs by Call Type and Unit
Station Unit Unit Type EMS Structure
Fire Outside
Fire Hazard False Alarm
Good Intent
Public Service
Mutual aid Canceled Total
Runs per Day
1
101 Pumper 0 6 0 1 0 0 1 9 0 17 NA
102 Brush 0 3 6 3 0 0 1 4 0 17 NA
103 Pumper 3 10 4 1 0 1 0 3 1 23 NA
155 Pumper/Tender 0 6 8 1 1 1 1 11 0 29 NA
157 Brush 43 7 17 1 1 3 4 8 1 85 NA
159 Tender 0 5 8 0 0 0 0 4 0 17 NA
R1 Rescue Pumper 1,565 18 77 19 60 35 35 11 17 1,837 5.0
2 109 Aerial 0 1 0 0 0 0 0 1 0 2 NA
HM14A Hazmat 0 0 0 5 0 0 0 0 0 5 NA
HM14B Hazmat 1 1 0 8 0 0 1 0 0 11 NA
Observations: • Rescue Pumper R1 made 90 percent of the department’s total runs and averaged 5.0 runs per day.
• All other units combined made 206 runs, an average of 0.6 runs per day.

Fire / EMS Operational Analysis Report, Ontario, Oregon page 47
Essentially the OFD serves as a first response fire agency, due to the current resources it deploys. With a single unit responding, staffed with two personnel, any fire or rescue event of any significance requires either a mutual aid response or a general recall of off-duty personnel (typically both). Figures 10 and 11 illustrate the resources required in two different risk scenarios (low and moderate). On the basis of this comparison, OFD would require outside assistance for nearly all calls except EMS responses for single patients.
FIGURE 10: Low-Risk Fire Response
Figure 10 represents critical task elements for a low-risk structure fire with no occupants in the structure. Some jurisdictions add additional response resources to meet and in some cases exceed the specifics of national benchmarking, such as National Fire Protection Association (NFPA) 1710, Standard for the Organization and Deployment of Fire Suppression Operations, Emergency Medical Operations, and Special Operations to the Public by Career Departments, 2010 Edition.
Figure 11 is intended to illustrate the foundational critical tasks associated with a moderate risk fire response, and is not intended to recommend that the city of Ontario add staffing to meet these critical tasks in a stand-alone fire department. The OFD relies on mutual aid from neighboring jurisdictions and often institutes a general recall to bring in off-duty personnel to meet these service demands.

Fire / EMS Operational Analysis Report, Ontario, Oregon page 48
FIGURE 11: Moderate Risk Fire Response
As already discussed, during the data study period conducted by ICMA, the OFD responded to a total of 18 structure fires. One fire, occurring at the Heinz-Ore-Ida processing plant, had a significant fire loss. This one event caused an estimated $8 million in damage. This high-loss event involved significant fire damage to the building and the destruction of some large automated processing equipment. In looking at the remaining 20 structure fires, their combined structure and content loss was estimated to be $245,200. ICMA found that in 14 of the structure fires was actual fire damage recorded. For all structure fires, excluding the Heinz-Ore-Ida incident, the average combined structure and content loss was $12,260 per incident.
It is hard to equate the quality of fire protection and agency effectiveness with such a limited data set. Excluding the Heinz-Ore-Ida incident, the only factual determination that ICMA can make is that the fire loss experience in Ontario in the period evaluated was somewhat lower than the national trends. In comparison with other similar communities, an analysis done in 2012 by the National Fire Protection Agency (NFPA) found that the average loss per structure fire (including contents) was $20,006 in 2011.13 The average Ontario fire loss in 2013 (excluding the Heinz-Ore-Ida incident) was an estimated 60 percent of the national average. This is somewhat surprising given the limited number of personnel and equipment involved in an initial response and the demographics of the community.
Table 7 depicts property and content loss for fire incidents as reported to ICMA by the OFD.
13 Michael Karter. “Fire Loss in the United States, 2011”. National Fire Protection Association (Quincy, MA), 23

Fire / EMS Operational Analysis Report, Ontario, Oregon page 49
TABLE 7: Property and Content Loss Analysis for Structure & Outside Fire Calls
Call Type
Property Loss Content Loss
Loss Value Number of Calls Loss Value
Number of Calls
Structure fire $1,652,000 15 $7,193,200 12 Outside fire $237,500 17 $3,550 3
Total $1,889,500 32 $7,196,750 15
Note: Fire loss estimates were modified in June of 2014 after ICMA received revised loss information from the Heinz-Ore-Ida fire. This analysis only includes calls with property loss or content loss greater than 0.
Observations: • Out of 21 structure fire calls, 15 calls (71 percent) had recorded property loss, with total
recorded loss (property and contents) value of $8,845,200. The structure fire call with the largest property loss occurred in a manufacturing facility located at 175 NE 6th Ave (Heinz-Ore-Ida), with a recorded loss of $8,000,000 ($1.4 million-structural and $6.4 million in contents).
• Out of 89 outside fire calls, 17 calls (19 percent) had recorded property loss (content and property), with total loss value of $241,050.
Another measure of workload for fire-related incidents is what actions the fire department took after arrival on the scene. Of specific interest is the number of reports in which action taken was missing. This occurred on approximately 31 occasions. The action of nonreporting or under-reporting was characteristic of many aspects of the OFD. ICMA attributes this to the extensive use of part-time employees and the absence of a dedicated fire officer on each shift with clear responsibility to ensure that all reporting is carried out properly.

Fire / EMS Operational Analysis Report, Ontario, Oregon page 50
TABLE 8: Actions Taken Analysis for Structure and Outside Fire Calls
Action Taken
Number of Calls Structure
fire Outside
fire Fire control or extinguishment, other 1 5 Extinguishment by fire service personnel 15 40 Salvage & overhaul 3 1 Ventilate 1 0 Fires, rescues & hazardous conditions 0 1 Information, investigation & enforcement, other 0 3 Investigate 0 5 Investigate fire out on arrival 1 3 Missing 0 31
Total 21 89
One last piece regarding workload is when calls for service are occurring. Figure 12 illustrates calls for service by hour of day.
FIGURE 12: Calls by Hour of Day

Fire / EMS Operational Analysis Report, Ontario, Oregon page 51
TABLE 9: Calls by Hour of Day
Two-Hour Interval
Hourly Call Rate EMS Fire Total
0-1 0.12 0.03 0.15 2-3 0.09 0.01 0.11 4-5 0.09 0.02 0.11 6-7 0.12 0.03 0.14 8-9 0.19 0.04 0.23
10-11 0.24 0.02 0.26 12-13 0.22 0.03 0.25 14-15 0.23 0.03 0.26 16-17 0.27 0.03 0.30 18-19 0.22 0.05 0.27 20-21 0.21 0.05 0.25 22-23 0.17 0.04 0.21
Calls per Day 4.33 0.75 5.07
Note: Average calls per day shown are the sum of each column multiplied by two, since each cell represents two hours.
Observations: • Hourly call rates averaged between 0.11 calls and 0.30 calls per hour.
• Call rates were highest during the day between 8:00 a.m. and 10:00 p.m., averaging between 0.23 and 0.30 calls per hour. The rate peaked between 4:00 p.m. and 6:00 p.m., when it averaged 0.30 calls per hour.
• Call rates were lowest between midnight and 8:00 a.m., averaging between 0.11 and 0.15 calls per hour. This is equivalent to an average of one call in the eight-hour period.

Fire / EMS Operational Analysis Report, Ontario, Oregon page 52
Analysis of Busiest Hours There is significant variability in the number of calls from hour to hour. One special concern relates to the availability of fire and EMS resources during the heaviest workload periods. We tabulated the data for each of the 8,760 hours in the year. Approximately once every two days, the OFD responded to two calls in an hour. It is not sufficiently clear as to the impact of this call volume. Obviously, with one unit operational, simultaneous calls results in either a delay in response or the need for a general recall to staff additional units. Given the high percentage of EMS calls compared to fire calls it is likely that when a simultaneous call occurs, it involves an EMS incident. If two EMS calls occur simultaneously, the OFD and TVP unit can split up and handle both calls. However, given that the average duration of each EMS call at 31.6 minutes it is very likely that when two calls occur in a given hour, they are not overlapping. Subsequently, our recommendation to reduce the frequency with which OFD follows the TVP unit to the hospital has even greater merit.
TABLE 10: Frequency Distribution of the Number of Calls
Number of Calls in an
Hour Frequency Percentage 0 7,055 80.5 1 1,526 17.4 2 164 1.9 3 13 0.1 4 2 0.0
Observations: • 97.9 percent of the time there is one call or less in any given hour.
• The most calls that occurred in the same hour were four calls, and this happened twice in 2013.
• There were 13 times in 2013 when three calls occurred in the same hour.
• Two calls in the same hour occurred 164 times, once every 2.2 days.

Fire / EMS Operational Analysis Report, Ontario, Oregon page 53
Operational Response Times This section presents dispatch and response time statistics for different call types and units. The main focus is the dispatch and response time of the first arriving OFD unit. However, for structure and outside fire calls, we also analyze the response time of the second arriving units when these times are recorded.
Different terms are used to describe the components of response time: Dispatch processing time is the difference between the unit dispatch time and call received time of the first arriving unit. Turnout time is the difference between the unit time en route and the unit dispatch time. Travel time is the difference between the unit on-scene arrival time and the time en route. Response time is the difference between the on-scene arrival time and call received time. Since the time stamps in CAD were recorded at the minute level, the variance between our estimated and actual dispatch/turnout/travel/response times could be up to two minutes.
In this section, a total of 1,023 calls (55 percent of fire and EMS calls) with complete unit dispatch time, unit en route time, and unit on-scene arrival time were used in the analysis. Here again, the level of reporting was less than optimum. Nearly half of all incident reporting had incomplete time segments. We typically see incomplete reporting in our analyses, but the level of incomplete reporting in Ontario needs to be noted, with a recommendation that emphasis be placed on improvement. The average dispatch time was 1.5 minutes. The average turnout time was 1.9 minutes, and the average travel time was 3.4 minutes. The average response time for EMS calls was 6.6 minutes, and the average response time for fire category calls was 7.8 minutes. The average response time for structure fire calls was 7.1 minutes. The average response time for outside fire calls was 8.8 minutes. The 90th percentile dispatch time was 2.0 minutes.
According to NFPA 1710, Standard for the Organization and Deployment of Fire Suppression Operations, Emergency Medical Operations, and Special Operations to the Public by Career Departments, 2010 Edition, the alarm processing time or dispatch time should be less than or equal to 60 seconds 90 percent of the time. This standard also states that the turnout time should be less than or equal to 80 seconds (1.33 minutes) for fire and special operations 90 percent of the time, and travel time shall be less than or equal to 240 seconds for the first arriving engine company 90 percent of the time. The standard further states the initial first alarm assignment should be assembled on scene in 480 seconds 90 percent of the time. NFPA 1710 response time criterion is a benchmark for service delivery and not an ICMA recommendation.
The 90th percentile measurement, often referred as a “Fractile Response,” is a more conservative and stricter measure of total response time. Most fire agencies are unable to meet this standard. Simply explained, for 90 percent of calls, the first unit arrives within a specified time, and if measured, the second and third unit. Table 11 details the OFD’s average dispatch, turnout, travel, and total response times of first arriving fire units for fire category calls. Table 12 includes the 90th percentile response time, which as indicated is a stricter evaluation of performance.

Fire / EMS Operational Analysis Report, Ontario, Oregon page 54
TABLE 11: Average Dispatch, Turnout, Travel, and Response Times of First Arriving Unit, by Call Type
Call Type Dispatch
Time Turnout
Time Travel Time
Response Time
Sample Size
Cardiac and stroke 1.4 1.7 3.2 6.4 70 Seizure and unconsciousness 1.3 1.6 3.3 6.2 72 Breathing difficulty 1.4 1.9 3.9 7.1 55 Overdose and psychiatric 1.5 1.6 3.2 6.3 47 MVA 1.5 1.0 2.0 4.5 2 Fall and injury 1.4 2.0 3.1 6.6 56 Illness and other 1.5 1.9 3.3 6.6 596
EMS Total 1.4 1.9 3.3 6.6 898 Structure fire 1.4 2.4 3.3 7.1 11 Outside fire 2.1 2.1 4.7 8.8 39 Hazard 1.6 2.2 3.0 6.8 11 False alarm 1.7 1.9 3.0 6.6 34 Good intent 2.1 2.4 3.3 7.7 19 Public service 2.3 1.8 5.6 9.6 11
Fire Total 1.9 2.1 3.8 7.8 125 Total 1.5 1.9 3.4 6.7 1,023
Observations: • The average dispatch time was 1.5 minutes.
• The average turnout time was 1.9 minutes.
• The average travel time was 3.4 minutes.
• The average response time for EMS calls was 6.6 minutes.
• The average response time for fire category calls was 7.8 minutes.
• The average response time for structure fire calls was 7.1 minutes.
• The average response time for outside fire calls was 8.8 minutes.

Fire / EMS Operational Analysis Report, Ontario, Oregon page 55
TABLE 12: 90th Percentile Dispatch, Turnout, Travel, and Response Times of First Arriving Unit, by Call Type
Call Type Dispatch
Time Turnout
Time Travel Time
Response Time
Sample Size
Cardiac and stroke 2.0 3.0 5.0 9.0 70 Seizure and unconsciousness 2.0 3.0 5.0 8.3 72 Breathing difficulty 2.0 3.4 7.0 11.0 55 Overdose and psychiatric 3.0 3.0 4.0 8.9 47 MVA 2.0 1.0 2.9 4.9 2 Fall and injury 2.0 4.0 4.0 9.2 56 Illness and other 2.0 3.0 5.0 10.0 596
EMS Total 2.0 3.0 5.0 10.0 898 Structure fire 2.0 3.0 6.0 10.0 11 Outside fire 6.0 3.0 9.0 13.5 39 Hazard 3.0 3.0 4.0 8.0 11 False alarm 3.0 4.0 5.0 10.0 34 Good intent 3.0 4.0 8.0 14.0 19 Public service 4.0 2.8 9.0 15.0 11
Fire Total 3.0 3.4 8.0 13.0 125 Total 2.0 3.0 5.0 10.0 1,023
Note: A 90th percentile value of 8.0 indicates that the total response time was less than 8.0 minutes for 90 percent of all calls. Unlike averages, the 90th percentile response time is not equal to the sum of the 90th percentile of dispatch time, turnout time, and travel time.
Observations: • The 90th percentile dispatch time was 2.0 minutes.
• The 90th percentile turnout time was 3.0 minutes.
• The 90th percentile travel time was 5.0 minutes.
• The 90th percentile response time for EMS calls was 10.0 minutes.
• The 90th percentile response time for fire category calls was 13.0 minutes.
• The 90th percentile response time for structure fire calls was 10.0 minutes.
• The 90th percentile response time for outside fire calls was 13.5 minutes.
Response times are typically the primary measurement in evaluating fire and EMS services. However most deployment models have been built around a four-minute initial response time for EMS and an eight-minute full-force response for fire. Though these times have validity, the actual impact of a speedy response time is limited to very few incidents. For example, in a full cardiac arrest, analysis shows that successful outcomes are rarely achieved if basic life support (CPR) is not

Fire / EMS Operational Analysis Report, Ontario, Oregon page 56
initiated within four minutes or less. However, cardiac arrests occur very infrequently, on average in 1 percent to 1.5 percent of all EMS incidents. Based on this statistic, the number of full cardiac arrests in Ontario in 2013 would be estimated to be 2.4 occurrences. There are also other incidents that are truly life threatening and the time of response can clearly impact the outcomes. These involve full drowning, electrocutions, and severe trauma (gunshot wounds, stabbings, motor vehicle accidents, farm equipment accidents, etc.). Again, the frequency of these types of calls is very limited.
Regarding response times for fire incidents, the criteria is based on a concept called “flashpoint” or “flashover.” This is an occurrence in which super-heated gasses from a fire are released rapidly, causing the fire to burn freely and become so volatile that the fire reaches an explosive state. In this situation, usually after an extended period of time (eight to twelve minutes), the fire expands rapidly and is much more difficult to contain. Again these situations are very limited and do not occur with any great frequency; however, when this does occur it presents greater challenges for initial arriving fire suppression companies. When the fire does reach this extremely hazardous state, larger and more destructive fire occurs. In looking at the fire loss statistics and the number of structure fires, it is not likely that Ontario units have experienced many flashover events in 2013. Many factors influence these outcomes, but the reality is that these are infrequent occurrences. Figure 13 illustrates this phenomenon and its potential impact on firefighters and fire extinguishment as the fire propagation curve.
FIGURE 13: Fire Propagation Curve

Fire / EMS Operational Analysis Report, Ontario, Oregon page 57
There have been no documented studies that have made a direct correlation between response times and outcomes in fire and EMS events. No one has been able to show that a four-minute response time is measurably more effective than a six-minute response time. The logic has been “faster is better,” but this has not been substantiated by any detailed analysis or real-time applications. So in looking at response times and building a deployment system around a defined standard (i.e., a four-minute response time),it will be hard to effectively measure the actual outcomes achieved at this level of response compared to either a six-, eight-, or ten-minute response time.
ICMA noted that OFD does not use performance measures in assessing its operation. In fact, there is a marked deficiency in many of the key reporting processes utilized within the OFD system. We think the system will be more apt to achieve community expectations and improve its measurements of key outcomes if such measures are developed and monitored on a regular basis.
Understanding response time capability is an essential planning tool. To illustrate this spatial perspective, Figure 14 shows the OFD response area and the anticipated OFD travel time bleeds as derived from a geographic information system (GIS). The figure uses GIS mapping to illustrate travel-time probabilities, showing 240-second, 360-second, and 480-second travel time bleed comparisons, respectively. These comparisons are made by road network from OFD’s main fire station and do not include alarm handling time or turn-out times.
FIGURE 14: 240/360/480-Second Response Bleed Layers from the OFD Main Fire Station Red=240 seconds/Green = 360 seconds/Blue=480 seconds

Fire / EMS Operational Analysis Report, Ontario, Oregon page 58
Observations from Figure 14 indicate that the majority of the city is within the 240-second travel time window and perhaps 90 percent of the city area is within the 360-second time window. It is also clear from this graphic the anticipated travel times to the Ontario Rural Fire Protection District would be 360 seconds or greater.
Recommendations: • The OFD should develop performance measures for those critical tasks it can implement on
low- and moderate-risk incidents; regularly train on these measures; and evaluate each member in the department annually against established benchmarks for the purpose of continuous process improvement.
• The OFD should evaluate options that dispatches either an OFD unit or a TVP ambulance on the initial response to those minor emergency incidents or public assists that have been determined through a medical priority dispatching process implemented at the MCSO communications center.
• OFD should monitor more closely the turnout time of Rescue-1 across all shifts, with a clear directive as to the expectation for turnout time.
• The OFD should develop performance measures specific to fire operations, including that percent of fires contained to room of origin; percent of fires contained to building of origin; target goals for call processing time; target goals for turnout time; target goals for access time; target goals for set-up time; target goals for travel time; and target goals for total response time. It is further recommended that the results of these performance measures be reported with explanation in an annual report.

Fire / EMS Operational Analysis Report, Ontario, Oregon page 59
Appendix: Ontario Fire Department Data Analysis
Introduction This data analysis was prepared as a key component of the study of the Ontario Fire Department (OFD, also known as Ontario Fire & Rescue). This analysis examines all calls for service between January 1, 2013, and December 31, 2013, as recorded in the Ontario Police Dispatch Center.
This analysis is divided into four sections: the first section focuses on call types and dispatches; the second section explores time spent on calls and workload of individual units; the third section presents analysis of the busiest hours in a year; and the fourth section provides a response time analysis.
During the period covered by this study, the department staff consisted of both full-time and volunteer firefighters. The full-time firefighters primarily staff the rescue pumper (R1). The agency primarily utilizes part-time (paid on call) personnel to supplement full-time staffing. When needed, the part-time personnel can staff nine units, including two pumpers, two brush trucks, two tenders, one aerial, and two hazmat units.
During the study period, the OFD responded to 1,901 calls, including 32 mutual aid calls. The total combined yearly workload (deployed time) for all units was 1,314 hours. The average estimated dispatch time was 1.5 minutes and the average response time was 6.7 minutes. The 90th percentile dispatch time was 2.0 minutes and the 90th percentile response time was 10.0 minutes.
Methodology In this report, we analyze calls and runs. A call is an emergency service request or incident. A run is a dispatch of a unit. Thus, a call might include multiple runs.
We received computer-aided dispatch (CAD) data and OFD’s National Fire Incident Reporting System (NFIRS) data. We evaluated and cross-validated CAD and NFIRS data and primarily used CAD data in this report. It is noted that the city has entered into an agreement with the Malheur County Sheriff’s Office to provide dispatching service in the future. We encountered three significant issues with the data in compiling this report, and which caused some limitations to this report. We strongly recommend the agency address these issues in the new dispatching process:
• All time stamps were recorded at the minute—and not the seconds—level. The impact of this for workload calculations is minimal. However, we would like to acknowledge that the variance of estimated response time and actual response time at the incident level could be up to two minutes because of this issue with the time stamps. Even though the average of response time reported in this report could be reasonable, the 90th percentile and cumulative distribution function of response time should be used with caution.
• Both CAD and NFIRS use a narrative field to record unit-level responses. The incident table only recorded dispatch data of the primary responding unit. We had to invest a significant amount of resources to parse the narrative data to conduct OFD’s workload and response

Fire / EMS Operational Analysis Report, Ontario, Oregon page 60
time analysis in this report. Without parsed unit-level responses, the agency’s total workload will be understated, and we cannot analyze workload by unit, identify the number of dispatched units by call type, nor the workload of county ambulances responding to OFD calls.
• Currently, there is no common incident number to link CAD and NFIRS data and which could be used to cross-validate and leverage both data sets. In this report, we used identical address records and approximate call received times to match CAD and NFIRS incidents to analyze NFIRS incident type, action taken, and property and content loss data.
We removed four duplicated CAD calls, which occurred at the same address and within a five minute interval. A total of two incidents to which administrative units (chief vehicle and part-time assistant chief) were the sole responders are not included in the analysis sections of the report. Nevertheless, the workload of administrative units is documented in Appendix I.
We classified the calls in a series of steps. We first used the NFIRS mutual aid field to accurately identify mutual aid calls. Then, we used NFIRS incident type to assign EMS, MVA, fire category, and canceled call types. Lastly, for NFIRS EMS calls, we used the CAD dispatch call description to assign detailed EMS categories. The classification between NFIRS incident type and call type is documented in Appendix IV.
In this report, mutual aid and canceled calls are included within the introductory summary and workload analysis. However, they are not included in duration and response time analysis.

Fire / EMS Operational Analysis Report, Ontario, Oregon page 61
Aggregate Call Totals and Dispatches In this report, each citizen-initiated emergency service request is a call. During the year studied, OFD responded to 1,901 calls. Of these, 21 were structure fire calls and 89 were outside fire calls. Each dispatched unit is a separate "run." As multiple units are dispatched to a call, there are more runs than calls. The department’s total runs and workload are reported in the second section of this section, in Tables D4 through D8.
TABLE D1: Call Types
Call Type Number of Calls
Calls per Day
Call Percentage
Cardiac and stroke 131 0.4 6.9 Seizure and unconsciousness 132 0.4 6.9 Breathing difficulty 105 0.3 5.5 Overdose and psychiatric 77 0.2 4.1 MVA 7 0.0 0.4 Fall and injury 106 0.3 5.6 Illness and other 1,021 2.8 53.7
EMS Total 1,579 4.3 83.1 Structure fire 21 0.1 1.1 Outside fire 89 0.2 4.7 Hazard 25 0.1 1.3 False alarm 60 0.2 3.2 Good intent 36 0.1 1.9 Public service 41 0.1 2.2
Fire Total 272 0.7 14.3 Mutual aid 32 0.1 1.7 Canceled 18 0.0 0.9
Total 1,901 5.2 100.0
Observations: • The department received 5.2 calls, including mutual aid and canceled calls.
• EMS calls for the year totaled 1,579 (83 percent of all calls), averaging 4.3 per day.
• Fire calls for the year totaled 272 (14 percent of all calls), averaging 0.7 per day.
• Structure and outside fire calls combined for a total of 110 calls during the year, averaging one call every 3.3 days.

Fire / EMS Operational Analysis Report, Ontario, Oregon page 62
FIGURE D1: EMS and Fire Calls by Type

Fire / EMS Operational Analysis Report, Ontario, Oregon page 63
Observations: • A total of 21 structure fire calls accounted for 8 percent of the fire category total.
• A total of 89 outside fire calls accounted for 33 percent of the fire category total.
• False alarm calls were 22 percent of the fire category total.
• Illness and other calls were the largest EMS call category, accounting for 65 percent of the EMS category total.
• Cardiac or stroke calls were 8 percent of the EMS category total.

Fire / EMS Operational Analysis Report, Ontario, Oregon page 64
FIGURE D2: EMS Calls by Type and Duration
Note: Duration of a call is defined as the longest deployed time of all OFD units responding to the same call.

Fire / EMS Operational Analysis Report, Ontario, Oregon page 65
Observations: • A total of 1,528 EMS category calls (97 percent) lasted less than one hour, 42 EMS category
calls (3 percent) lasted between one and two hours, and 9 EMS category calls (1 percent) lasted more than two hours. On average, there was one EMS category call per week that lasted more than one hour.
• A total of 126 cardiac and stroke calls (96 percent) lasted less than one hour, and 5 cardiac and stroke calls (4 percent) lasted more than an hour.

Fire / EMS Operational Analysis Report, Ontario, Oregon page 66
FIGURE D3: Fire Calls by Type and Duration
Note: Duration of a call is defined as the longest deployed time of all OFD units responding to the same call.

Fire / EMS Operational Analysis Report, Ontario, Oregon page 67
Observations: • A total of 241 fire category calls (89 percent) lasted less than one hour, 13 fire category calls
(5 percent) lasted between one and two hours, and 18 fire category calls (7 percent) lasted more than two hours.
• A total of 10 structure fires (48 percent) lasted less than one hour, 6 structure fires (29 percent) lasted between one and two hours, and 5 structure fires (24 percent) lasted more than two hours.
• A total of 83 outside fires (93 percent) lasted less than one hour, 2 outside fires (2 percent) lasted between one and two hours, and 4 outside fires (4 percent) lasted more than two hours.
• A total of four public service calls and one good intent call lasted more than one hour.

Fire / EMS Operational Analysis Report, Ontario, Oregon page 68
FIGURE D4: Average Calls per Day, by Month
Observations: • Average calls per day ranged from a low of 4.33 calls per day in April 2013 to a high of 5.86
calls per day in September 2013. The highest monthly average was 35 percent greater than the lowest monthly average.
• Average EMS calls per day ranged from a low of 3.63 calls per day in April 2013 to a high of 4.73 calls per day in September 2013.
• Average fire calls per day ranged from a low of 0.39 calls per day in May 2013 to a high of 1.23 calls per day in July 2013.
• The most calls received in a single day occurred on December 12, 2013, which saw 14 calls. Those 14 calls included 11 EMS calls, 1 structure fire call, 1 false alarm call, and 1 public service call.

Fire / EMS Operational Analysis Report, Ontario, Oregon page 69
FIGURE D5: Calls by Hour of Day
TABLE D2: Calls by Hour of Day
Two-Hour Interval
Hourly Call Rate EMS Fire Total
0-1 0.12 0.03 0.15 2-3 0.09 0.01 0.11 4-5 0.09 0.02 0.11 6-7 0.12 0.03 0.14 8-9 0.19 0.04 0.23
10-11 0.24 0.02 0.26 12-13 0.22 0.03 0.25 14-15 0.23 0.03 0.26 16-17 0.27 0.03 0.30 18-19 0.22 0.05 0.27 20-21 0.21 0.05 0.25 22-23 0.17 0.04 0.21
Calls per Day 4.33 0.75 5.07
Note: Average calls per day shown are the sum of each column multiplied by two, since each cell represents two hours.

Fire / EMS Operational Analysis Report, Ontario, Oregon page 70
Observations: • Hourly call rates averaged between 0.11 calls and 0.30 calls per hour.
• Call rates were highest during the day between 8:00 a.m. and 10:00 p.m., averaging between 0.23 and 0.30 calls per hour. The rate peaked between 4:00 p.m. and 6:00 p.m., when it averaged 0.30 calls per hour.
• Call rates were lowest between midnight and 8:00 a.m., averaging between 0.11 and 0.15 calls per hour. This is equivalent to an average of one call in the eight-hour period.

Fire / EMS Operational Analysis Report, Ontario, Oregon page 71
TABLE D3: Number of Ontario Fire Department Units Dispatched to Calls
Call Type Number of Units
One Two Three Four Five Total Cardiac and stroke 131 0 0 0 0 131 Seizure and unconsciousness 131 1 0 0 0 132 Breathing difficulty 104 1 0 0 0 105 Overdose and psychiatric 77 0 0 0 0 77 MVA 7 0 0 0 0 7 Fall and injury 106 0 0 0 0 106 Illness and other 996 25 0 0 0 1,021
EMS Total 1,552 27 0 0 0 1,579 Structure fire 6 2 6 6 1 21 Outside fire 75 4 5 3 2 89 Hazard 17 5 1 1 1 25 False alarm 58 2 0 0 0 60 Good intent 32 4 0 0 0 36 Public service 39 2 0 0 0 41
Fire Total 227 19 12 10 4 272 Mutual aid 16 13 3 0 0 32 Canceled 17 1 0 0 0 18
Total 1,812 60 15 10 4 1,901 Percentage 95.3 3.2 0.8 0.5 0.2 100
Note: Hazmat units are included.
Observations: • Overall, four or five units were dispatched to 14 fire category calls.
• On average, 1.3 units were dispatched per fire category call.
• For fire category calls, one unit was dispatched 83 percent of the time, two units were dispatched 7 percent of the time, three units were dispatched 4 percent of the time, four units were dispatched 4 percent of the time, and five units were dispatched 1 percent of the time.
• For structure fire calls, one unit was dispatched six times, two units were dispatched twice, three units were dispatched six times, four units were dispatched six times, and five units were dispatched once.
• For outside fire calls, one unit was dispatched to 84 percent of the calls, and four or five units were dispatched five times.
• For EMS category calls, one unit was dispatched 98 percent of the time, and two units were dispatched only 27 times.

Fire / EMS Operational Analysis Report, Ontario, Oregon page 72
TABLE D4: Annual Deployed Time by Call Type
Call Type
Average Deployed Minutes per Run
Annual Hours
Percent of Total Hours
Deployed Hours
per Day
Annual Number of Runs
Runs per Day
Cardiac and stroke 38.5 85 6.4 0.2 132 0.4 Seizure and unconsciousness 45.0 100 7.6 0.3 133 0.4 Breathing difficulty 34.0 60 4.6 0.2 106 0.3 Overdose and psychiatric 32.8 43 3.2 0.1 78 0.2 MVA 38.8 5 0.3 0.0 7 0.0 Fall and injury 31.3 56 4.2 0.2 107 0.3 Illness and other 28.7 502 38.2 1.4 1,049 2.9
EMS Total 31.6 849 64.6 2.3 1,612 4.4 Structure fire 109.2 104 7.9 0.3 57 0.2 Outside fire 44.5 89 6.8 0.2 120 0.3 Hazard 113.0 74 5.6 0.2 39 0.1 False alarm 13.9 14 1.1 0.0 62 0.2 Good intent 17.0 11 0.9 0.0 40 0.1 Public service 34.5 25 1.9 0.1 43 0.1
Fire Total 52.6 317 24.1 0.9 361 1.0 Mutual aid 172.8 147 11.2 0.4 51 0.1 Canceled 3.4 1 0.1 0.0 19 0.1
Total 38.6 1,314 100.0 3.6 2,043 5.6 Note: Each dispatched unit is a separate "run." As multiple units are dispatched to a call, there are more runs than calls. Therefore, the department responded to 5.2 calls per day and had 5.6 runs per day.
Observations: • Total deployed time for the year, or deployed hours, was 1,314 hours. This is the total
deployment time of all OFD units deployed on all type of calls, including 147 hours spent on mutual aid. The deployed hours for all units combined averaged approximately 3.6 hours per day.
• There were 2,043 runs, including 51 runs dispatched for mutual aid calls. The daily average was 5.6 runs for all units combined.
• Fire category calls accounted for 24.1 percent of the total workload.
• There were 177 runs for structure and outside fire calls, with a total workload of 192.8 hours. This accounted for 14.7 percent of the total workload. The average deployed time for structure fire calls was 109.2 minutes (one hour and 49 minutes), and the average deployed time for outside fire calls was 44.5 minutes.
• EMS calls accounted for 64.6 percent of the total workload. The average deployed time for EMS calls was 31.6 minutes. The deployed hours for all units dispatched to EMS calls averaged 2.3 hours per day.

Fire / EMS Operational Analysis Report, Ontario, Oregon page 73
Workload by Individual Unit—Calls and Total Time Spent In this section, the actual time spent by each unit on calls is reported in two types of statistics: workload and runs. A dispatch of a unit is defined as a run; thus one call might include multiple runs. The deployed time of a run is from the time a unit is dispatched through the time a unit is cleared.
TABLE D5: Call Workload by Unit
Station Unit Type Unit ID
Average Deployed Minutes per Run
Annual Number of Runs
Annual Hours
Runs per Day
Deployed Hours
per Day
1
Pumper 101 119.4 17 33.8 NA NA Brush 102 132.7 17 37.6 NA NA
Pumper 103 96.2 23 36.9 NA NA Pumper/Tender 155 128.9 29 62.3 NA NA
Brush 157 62.5 85 88.5 NA NA Tender 159 110.5 17 31.3 NA NA
Rescue Pumper R1 31.5 1,837 963.1 5.0 2.6
2 Aerial 109 240.5 2 8.0 NA NA
Hazmat HM14A 208.2 5 17.4 NA NA Hazmat HM14B 191.2 11 35.1 NA NA
Observations: • Rescue Pumper R1 was the unit deployed the most often and had the most deployed hours.
It averaged 5.0 runs and 2.6 hours of deployed time per day. It accounted for 74 percent of deployed hours and 90 percent of total department runs.
• Two pumpers (101 and 103) combined made 40 runs in a year.
• Two brush trucks (102 and 157) combined made 102 runs in a year.
• Two Hazmat units (HM14A and HM14B) combined made 16 runs in a year.
• Two tender units (155 and 159) made 46 runs in a year.

Fire / EMS Operational Analysis Report, Ontario, Oregon page 74
FIGURE D6: Deployed Minutes by Hour of Day
TABLE D6: Deployed Minutes by Hour of Day
Two-Hour Interval EMS Fire Total
0-1 3.4 3.3 6.6 2-3 3.8 2.0 5.8 4-5 3.1 1.5 4.7 6-7 3.5 0.5 4.0 8-9 6.4 0.9 7.3
10-11 7.9 2.6 10.5 12-13 6.3 3.1 9.4 14-15 7.0 1.9 8.9 16-17 8.9 0.8 9.7 18-19 8.4 2.6 10.9 20-21 6.3 2.8 9.1 22-23 4.9 4.1 9.0
Daily Total 139.6 52.1 191.7 Note: Daily totals shown equal the sum of each column multiplied by two, since each cell represents two hours.

Fire / EMS Operational Analysis Report, Ontario, Oregon page 75
Observations: • Hourly deployed minutes were highest during the day between 10:00 a.m. and midnight,
averaging between 8.9 minutes and 10.9 minutes per hour. Average deployed minutes peaked between 6:00 p.m. and 8:00 p.m., averaging 10.9 minutes per hour.
• Hourly deployed minutes were the lowest between midnight and 10:00 a.m., averaging between 4.0 minutes and 7.3 minutes per hour.

Fire / EMS Operational Analysis Report, Ontario, Oregon page 76
TABLE D7: Total Annual and Daily Average Number of Runs by Call Type and Unit
Station Unit Unit Type EMS Structure
Fire Outside
Fire Hazard False Alarm
Good Intent
Public Service
Mutual aid Canceled Total
Runs per Day
1
101 Pumper 0 6 0 1 0 0 1 9 0 17 NA
102 Brush 0 3 6 3 0 0 1 4 0 17 NA
103 Pumper 3 10 4 1 0 1 0 3 1 23 NA
155 Pumper/Tender 0 6 8 1 1 1 1 11 0 29 NA
157 Brush 43 7 17 1 1 3 4 8 1 85 NA
159 Tender 0 5 8 0 0 0 0 4 0 17 NA
R1 Rescue Pumper 1,565 18 77 19 60 35 35 11 17 1,837 5.0
2 109 Aerial 0 1 0 0 0 0 0 1 0 2 NA
HM14A Hazmat 0 0 0 5 0 0 0 0 0 5 NA
HM14B Hazmat 1 1 0 8 0 0 1 0 0 11 NA
Observations: • Rescue Pumper R1 made 90 percent of the department’s total runs and averaged 5.0 runs per day.
• All other units combined made 206 runs, an average of 0.6 runs per day.

Fire / EMS Operational Analysis Report, Ontario, Oregon page 77
TABLE D8: Daily Average Deployed Minutes by Call Type and Unit
Station Unit Unit Type EMS Structure
Fire Outside
Fire Hazard False Alarm
Good Intent
Public Service
Mutual aid Canceled Total
Fire Category
Calls Percentage
1
101 Pumper 0.0 1.6 0.0 0.2 0.0 0.0 0.4 3.4 0.0 5.6 100.0
102 Brush 0.0 1.2 1.7 1.0 0.0 0.0 0.0 2.3 0.0 6.2 100.0
103 Pumper 0.4 3.3 0.5 0.4 0.0 0.1 0.0 1.4 0.0 6.1 93.1
155 Pumper/Tender 0.0 1.6 1.9 0.2 0.1 0.0 0.1 6.2 0.0 10.2 100.0
157 Brush 4.3 2.6 3.1 0.6 0.1 0.1 0.3 3.5 0.0 14.6 70.8
159 Tender 0.0 1.5 2.1 0.0 0.0 0.0 0.0 1.5 0.0 5.1 100.0
R1 Rescue Pumper 134.7 4.3 5.3 2.1 2.2 1.6 2.8 5.1 0.1 158.3 14.9
2 109 Aerial 0.0 0.6 0.0 0.0 0.0 0.0 0.0 0.7 0.0 1.3 100.0
HM14A Hazmat 0.0 0.0 0.0 2.9 0.0 0.0 0.0 0.0 0.0 2.9 100.0
HM14B Hazmat 0.2 0.2 0.0 4.8 0.0 0.0 0.5 0.0 0.0 5.8 96.0
Observations: • Rescue Pumper R1 made 73 percent of the department workload. It averaged 158 minutes (two hours, and 38 minutes) of work
per day.
• On average, all other units combined were deployed for 58 minutes per day.

Fire / EMS Operational Analysis Report, Ontario, Oregon page 78
Analysis of Busiest Hours There is significant variability in the number of calls from hour to hour. One special concern relates to the fire and EMS resources available for hours with the heaviest workload. We tabulated the data for each of the 8,760 hours in the year. Approximately once every two days, the Ontario Fire Department responded to two to four calls in an hour. We report the top ten hours with the most calls received and discuss the top two hours.
TABLE D9: Frequency Distribution of the Number of Calls
Number of Calls in an
Hour Frequency Percentage 0 7,055 80.5 1 1,526 17.4 2 164 1.9 3 13 0.1 4 2 0.0
Observations: • The most calls that occurred in the same hour were four calls, and this happened twice in a
year.
• There were 13 times in the year when three calls occurred in the same hour.
• Two calls in the same hour occurred 164 times.
• On average, two or more calls occurred in the same hour once every two days.

Fire / EMS Operational Analysis Report, Ontario, Oregon page 79
TABLE D10: Top 10 Hours with the Most Calls Received
Hour Number of Calls
Number of Runs
Total Deployed
Hours 7/4/2013, 10 p.m. to 11 p.m. 4 5 1.3 12/6/2013, 9 a.m. to 10 a.m. 4 4 1.7 1/22/2013, 1 p.m. to 2 p.m. 3 6 2.8 4/6/2013, 8 p.m. to 9 p.m. 3 4 1.2 1/17/2013, 4 p.m. to 5 p.m. 3 3 1.0 2/21/2013, 1 p.m. to 2 p.m. 3 3 0.8 2/23/2013, 4 p.m. to 5 p.m. 3 3 0.9 6/8/2013, 5 p.m. to 6 p.m. 3 3 1.0 6/11/2013, 11 a.m. to 12 p.m. 3 3 2.0 6/16/2013, 8 a.m. to 9 a.m. 3 3 1.1
Note: The combined workload is the total deployed minutes spent responding to calls received in the hour, and which may extend into the next hour or hours.
Observations: • The hour with the most calls received was 10:00 p.m. to 11:00 p.m. on July 4, 2013. The
four calls involved five individual dispatches. The combined workload was 1.3 hours. The four calls included three outside fire calls, and one good intent call. The longest outside fire call lasted 33 minutes. The good intent call lasted 13 minutes.
• During the hour from 9:00 a.m. to 10:00 a.m. on December 6, 2013, four calls involving four individual dispatches occurred. The combined workload was 1.7 hours. The four calls included one cardiac and stroke call, one breathing difficulty call, one overdose and psychiatric call, and one public service call. The longest call was the overdose and psychiatric call, and it was responded to by brush truck 157 and lasted 53 minutes. The other three calls were responded to by rescue pumper R1, and they lasted between 10 and 23 minutes.

Fire / EMS Operational Analysis Report, Ontario, Oregon page 80
Dispatch Time and Response Time This section presents dispatch and response time statistics for different call types and units. The main focus is the dispatch and response time of the first arriving OFD units. However, for structure and outside fire calls, we also analyze the response time of the second arriving units.
Different terms are used to describe the components of response time: Dispatch processing time is the difference between the unit dispatch time and call received time of the first arriving unit. Turnout time is the difference between the unit time en route and the unit dispatch time. Travel time is the difference between the unit on-scene arrival time and the time en route. Response time is the difference between the on-scene arrival time and call received time. Since all time stamps in CAD were recorded at minute level, the variance between our estimated and actual dispatch/turnout/travel/response times could be up to two minutes.
In this section, a total of 1,023 calls (55 percent of fire and EMS calls) with complete unit dispatch time, unit en route time, and unit on-scene arrival time were used in the analysis. The average dispatch time was 1.5 minutes. The average turnout time was 1.9 minutes, and the average travel time was 3.4 minutes. The average response time for EMS calls was 6.6 minutes, and the average response time for fire category calls was 7.8 minutes. The average response time for structure fire calls was 7.1 minutes. The average response time for outside fire calls was 8.8 minutes. The 90 percent dispatch time was 2.0 minutes.

Fire / EMS Operational Analysis Report, Ontario, Oregon page 81
TABLE D11: Average Dispatch, Turnout, Travel, and Response Times of First Arriving Unit, by Call Type
Call Type Dispatch
Time Turnout
Time Travel Time
Response Time
Sample Size
Cardiac and stroke 1.4 1.7 3.2 6.4 70 Seizure and unconsciousness 1.3 1.6 3.3 6.2 72 Breathing difficulty 1.4 1.9 3.9 7.1 55 Overdose and psychiatric 1.5 1.6 3.2 6.3 47 MVA 1.5 1.0 2.0 4.5 2 Fall and injury 1.4 2.0 3.1 6.6 56 Illness and other 1.5 1.9 3.3 6.6 596
EMS Total 1.4 1.9 3.3 6.6 898 Structure fire 1.4 2.4 3.3 7.1 11 Outside fire 2.1 2.1 4.7 8.8 39 Hazard 1.6 2.2 3.0 6.8 11 False alarm 1.7 1.9 3.0 6.6 34 Good intent 2.1 2.4 3.3 7.7 19 Public service 2.3 1.8 5.6 9.6 11
Fire Total 1.9 2.1 3.8 7.8 125 Total 1.5 1.9 3.4 6.7 1,023
FIGURE D7: Average Dispatch, Turnout, and Travel Times of First Arriving Unit, by EMS Call Type

Fire / EMS Operational Analysis Report, Ontario, Oregon page 82
FIGURE D8: Average Dispatch, Turnout, and Travel Times of First Arriving Unit, by Fire Call Type
Observations: • The average dispatch time was 1.5 minutes.
• The average turnout time was 1.9 minutes.
• The average travel time was 3.4 minutes.
• The average response time for EMS calls was 6.6 minutes.
• The average response time for fire category calls was 7.8 minutes.
• The average response time for structure fire calls was 7.1 minutes.
• The average response time for outside fire calls was 8.8 minutes.

Fire / EMS Operational Analysis Report, Ontario, Oregon page 83
TABLE D12: 90th Percentile Dispatch, Turnout, Travel, and Response Times of First Arriving Unit, by Call Type
Call Type Dispatch
Time Turnout
Time Travel Time
Response Time
Sample Size
Cardiac and stroke 2.0 3.0 5.0 9.0 70 Seizure and unconsciousness 2.0 3.0 5.0 8.3 72 Breathing difficulty 2.0 3.4 7.0 11.0 55 Overdose and psychiatric 3.0 3.0 4.0 8.9 47 MVA 2.0 1.0 2.9 4.9 2 Fall and injury 2.0 4.0 4.0 9.2 56 Illness and other 2.0 3.0 5.0 10.0 596
EMS Total 2.0 3.0 5.0 10.0 898 Structure fire 2.0 3.0 6.0 10.0 11 Outside fire 6.0 3.0 9.0 13.5 39 Hazard 3.0 3.0 4.0 8.0 11 False alarm 3.0 4.0 5.0 10.0 34 Good intent 3.0 4.0 8.0 14.0 19 Public service 4.0 2.8 9.0 15.0 11
Fire Total 3.0 3.4 8.0 13.0 125 Total 2.0 3.0 5.0 10.0 1,023
Note: A 90th percentile value of 8.0 indicates that the total response time was less than 8.0 minutes for 90 percent of all calls. Unlike averages, the 90th percentile response time is not equal to the sum of the 90th percentile of dispatch time, turnout time, and travel time.
Observations: • The 90th percentile dispatch time was 2.0 minutes.
• The 90th percentile turnout time was 3.0 minutes.
• The 90th percentile travel time was 5.0 minutes.
• The 90th percentile response time for EMS calls was 10.0 minutes.
• The 90th percentile response time for fire category calls was 13.0 minutes.
• The 90th percentile response time for structure fire calls was 10.0 minutes.
• The 90th percentile response time for outside fire calls was 13.5 minutes.

Fire / EMS Operational Analysis Report, Ontario, Oregon page 84
FIGURE D9: Average Dispatch, Turnout, Travel, and Response Time of First Arriving Unit, by Hour of Day

Fire / EMS Operational Analysis Report, Ontario, Oregon page 85
TABLE D13: Average Dispatch, Turnout, Travel, and Response Times of First Arriving Unit, by Hour of Day
Hour Dispatch
Time Turnout
Time Travel Time
Response Time
90th Percentile Response Time
Sample Size
0 1.6 2.3 3.9 7.8 11.0 43 1 2.0 2.8 3.5 8.4 11.0 25 2 1.4 3.3 3.7 8.5 13.0 32 3 1.8 3.6 4.8 10.2 17.0 16 4 1.6 3.8 3.5 8.8 12.0 25 5 1.7 3.6 3.0 8.3 10.0 25 6 1.5 2.6 3.4 7.5 11.0 33 7 1.4 1.8 3.9 7.2 16.0 43 8 1.4 1.3 3.4 6.1 7.5 38 9 1.4 1.6 3.8 6.8 11.0 44
10 1.3 1.5 3.5 6.3 8.0 50 11 1.6 1.5 3.0 6.1 10.0 44 12 1.4 1.3 2.8 5.6 7.0 49 13 1.5 1.4 3.0 5.8 8.0 43 14 1.3 1.7 3.1 6.0 9.0 43 15 1.5 1.3 4.9 7.7 20.0 48 16 1.2 1.6 3.0 5.8 9.0 52 17 1.4 1.5 3.1 6.0 8.3 66 18 1.2 1.5 2.8 5.6 7.4 52 19 1.6 1.6 3.1 6.2 9.0 51 20 1.8 1.4 3.8 7.0 12.0 50 21 1.6 1.6 3.3 6.5 9.0 57 22 1.7 2.2 2.9 6.8 9.2 51 23 1.5 2.3 3.0 6.8 9.0 43
Observations: • Average dispatch time was between 1.2 and 2.0 minutes.
• Average turnout time was between 1.3 and 3.8 minutes. It peaked between midnight and 7:00 a.m. and averaged between 2.3 and 3.8 minutes.
• Average travel time was between 2.8 and 4.9 minutes.
• Average response time was between 5.6 and 10.2 minutes. Between 1:00 a.m. and 6:00 a.m., the average response time peaked between 8.3 and 10.2 minutes.
• 90th percentile response time was between 7.0 and 20.0 minutes.
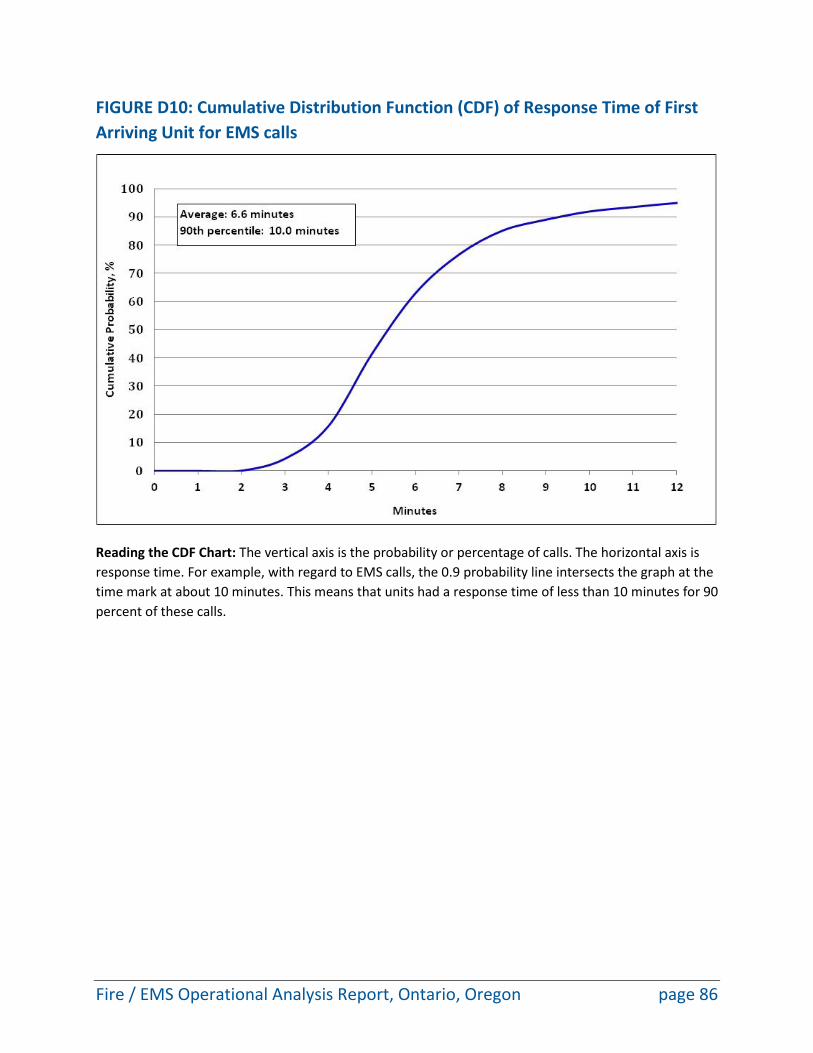
Fire / EMS Operational Analysis Report, Ontario, Oregon page 86
FIGURE D10: Cumulative Distribution Function (CDF) of Response Time of First Arriving Unit for EMS calls
Reading the CDF Chart: The vertical axis is the probability or percentage of calls. The horizontal axis is response time. For example, with regard to EMS calls, the 0.9 probability line intersects the graph at the time mark at about 10 minutes. This means that units had a response time of less than 10 minutes for 90 percent of these calls.

Fire / EMS Operational Analysis Report, Ontario, Oregon page 87
FIGURE D11: Frequency Distribution Chart of Response Time of First Arriving Unit for EMS Calls

Fire / EMS Operational Analysis Report, Ontario, Oregon page 88
TABLE D14: Cumulative Distribution Function (CDF) of Response Time of First Arriving Unit for EMS Calls
Response Time
(minute) Frequency Cumulative Percentage
0 - 1 0 0.0 1 - 2 1 0.1 2 - 3 38 4.3 3 - 4 104 15.9 4 - 5 230 41.5 5 - 6 193 63.0 6 - 7 123 76.7 7 - 8 76 85.2 8 - 9 35 89.1
9 - 10 26 92.0 10 - 11 14 93.5 11 - 12 13 95.0
> 12 45 100.0
Observations: • The average response time for EMS calls was 6.6 minutes.
• For 85 percent of EMS calls, the response time was less than or equal to 8.0 minutes.
• For 90 percent of EMS calls, the response time was less than 10.0 minutes.

Fire / EMS Operational Analysis Report, Ontario, Oregon page 89
TABLE D15: Average Response Time for Structure and Outside Fire Calls by First Arriving Unit
Unit Type
First Arriving
Unit
Outside Fire Structure Fire Total Response
Time Number of Calls
Response Time
Number of Calls
Response Time
Number of Calls
Rescue Pumper R1 7.0 32 7.0 9 7.0 41 Brush 157 14.6 6 7.5 2 12.8 8 Tender 159 30.0 1 NA 0 30.0 1
Total 8.8 39 7.1 11 8.4 50
Observations: • For outside fire calls, the average response time of the first arriving unit was 8.8 minutes.
• For outside fire calls, engine R1 was the first unit on scene most often and had an average response time of 7.0 minutes.
• For structure fire calls, the average response time of the first arriving unit was 7.1 minutes.
• For structure fire calls, engine R1 was the first unit on scene most often and had an average response time of 7.0 minutes.

Fire / EMS Operational Analysis Report, Ontario, Oregon page 90
FIGURE D12: Cumulative Distribution Function (CDF) of Response Time of First Arriving Units for Structure and Outside Fire Calls

Fire / EMS Operational Analysis Report, Ontario, Oregon page 91
FIGURE D13: Frequency Distribution Chart of Response Time of First Arriving Unit for Structure and Outside Fire Calls

Fire / EMS Operational Analysis Report, Ontario, Oregon page 92
TABLE D16: Cumulative Distribution Function (CDF) of Response Time of First Arriving Units for Structure and Outside Fire Calls
Response Time
(minute) Frequency Cumulative
Percent 0 - 1 0 0.0 1 - 2 0 0.0 2 - 3 2 4.0 3 - 4 7 18.0 4 - 5 7 32.0 5 - 6 7 46.0 6 - 7 4 54.0 7 - 8 3 60.0 8 - 9 6 72.0
9 - 10 4 80.0 10 - 11 2 84.0 11 - 12 1 86.0 12 - 13 2 90.0 13 - 14 1 92.0 14 - 15 0 92.0
> 15 4 100.0
Observations: • The average response time of the first arriving fire unit for structure and outside fire calls
was 8.4 minutes.
• 46 percent of the time, the first fire unit's response time was less than 6.0 minutes.
• 90 percent of the time, the first fire unit's response time was less than 13.0 minutes.

Fire / EMS Operational Analysis Report, Ontario, Oregon page 93
Attachment I: Workload of County Ambulances
Unit Number of Runs
Total Deployed
Hours M1 1,334 815.1 M2 243 167.7 M3 27 21.9 M4 1 1.0
Total 1,605 1,005.6 Daily Average 4.4 2.8
Observations: • County ambulances (M1-4) responded to 95 percent (1,499 out of 1,579) of EMS calls
together with OFD units.
• On average, county ambulances (M1-4) made 4.4 runs and spent 2.8 hours of deployed time per day for Ontario calls.

Fire / EMS Operational Analysis Report, Ontario, Oregon page 94
Attachment II: Workload of Administrative Units
Unit Unit
Description Number of Runs
Annual Hours
100 Fire Chief 54 81.4
110 Part Time Assistant Chief 2 2.9

Fire / EMS Operational Analysis Report, Ontario, Oregon page 95
Attachment III: Property and Content Loss Analysis for Structure and Outside Fire Calls
Call Type
Property Loss Content Loss
Loss Value Number of Calls Loss Value
Number of Calls
Structure fire $1,652,000 15 $7,193,200 12 Outside fire $237,500 17 $3,550 3
Total $1,889,500 32 $7,196,750 15 Note: This analysis only includes calls with property loss or content loss greater than 0.
Observations: • Out of 21 structure fire calls, 15 calls (71 percent) had recorded property loss, with total
recorded loss value of $152,000. The structure fire call with the largest content loss occurred in the Heinz-Ore-Ida factory located at 175 NE 6th Ave, with the recorded content loss of $6,400,000.
• Out of 89 outside fire calls, 17 calls (19 percent) had recorded property loss, with total loss value of $237,500.

Fire / EMS Operational Analysis Report, Ontario, Oregon page 96
Attachment IV: Actions Taken Analysis for Structure and Outside Fire Calls
Action Taken
Number of Calls Structure
fire Outside
fire Fire control or extinguishment, other 1 5 Extinguishment by fire service personnel 15 40 Salvage & overhaul 3 1 Ventilate 1 0 Fires, rescues & hazardous conditions 0 1 Information, investigation & enforcement, other 0 3 Investigate 0 5 Investigate fire out on arrival 1 3 Missing 0 31
Total 21 89

Fire / EMS Operational Analysis Report, Ontario, Oregon page 97
Attachment V: Correspondence between NFIRS Incident Type and Call Type
NFIRS Incident Type Incident Description Call Type
No of Calls
100 Fire, other Outside fire 8 111 Building fire Structure fire 17 113 Cooking fire, confined to container Structure fire 1 114 Chimney or flue fire, confined to chimney or flue Structure fire 1 118 Trash or rubbish fire, contained Structure fire 1 122 Fire in motor home, camper, recreational vehicle Structure fire 1 130 Mobile property (vehicle) fire, other Outside fire 1 131 Passenger vehicle fire Outside fire 12 137 Camper or recreational vehicle (RV) fire Outside fire 1 138 Off-road vehicle or heavy equipment fire Outside fire 2 140 Natural vegetation fire, other Outside fire 1 142 Brush or brush-and-grass mixture fire Outside fire 11 143 Grass fire Outside fire 5 150 Outside rubbish fire, other Outside fire 5 151 Outside rubbish, trash or waste fire Outside fire 5 154 Dumpster or other outside trash receptacle fire Outside fire 1 160 Special outside fire, other Outside fire 4 162 Outside equipment fire Outside fire 2 324 Motor vehicle accident with no injuries. MVA 1 352 Extrication of victim(s) from vehicle MVA 2
353 Removal of victim(s) from stalled elevator Illness and other 1
400 Hazardous condition, other Hazard 1 412 Gas leak (natural gas or LPG) Hazard 4 421 Chemical hazard (no spill or leak) Hazard 1 424 Carbon monoxide incident Hazard 1 444 Power line down Hazard 2 445 Arcing, shorted electrical equipment Hazard 1 480 Attempted burning, illegal action, other Hazard 6 500 Service Call, other Public service 3 522 Water or steam leak Public service 1 531 Smoke or odor removal Public service 4 551 Assist police or other governmental agency Public service 2 552 Police matter Public service 2 561 Unauthorized burning Public service 5 600 Good intent call, other Good intent 6

Fire / EMS Operational Analysis Report, Ontario, Oregon page 98
NFIRS Incident Type Incident Description Call Type
No of Calls
611 Dispatched & canceled en route Canceled 12 6111 Dispatched & canceled en route Canceled 6 631 Authorized controlled burning Good intent 4 650 Steam, other gas mistaken for smoke, other Good intent 1 651 Smoke scare, odor of smoke Good intent 25 700 False alarm or false call, other False alarm 2 710 Malicious, mischievous false call, other False alarm 1 715 Local alarm system, malicious false alarm False alarm 1 730 System malfunction, other False alarm 2 733 Smoke detector activation due to malfunction False alarm 6 735 Alarm system sounded due to malfunction False alarm 21 740 Unintentional transmission of alarm, other False alarm 1 743 Smoke detector activation, no fire - unintentional False alarm 1 744 Detector activation, no fire - unintentional False alarm 1 745 Alarm system activation, no fire - unintentional False alarm 17 746 Carbon monoxide detector activation, no CO False alarm 3
8002 Severe weather or natural disaster, other Public service 1 900 Special type of incident, other Public service 2 911 Citizen complaint Public service 5


