Operational and Treatment Practices to Prevent · PDF fileOPERATIONAL AND TREATMENT PRACTICES...
10
M56 AWWA MANUAL Chapter 8 177 Operational and Treatment Practices to Prevent Nitrification Janice Skadsen Y. Koby Cohen INTRODUCTION ____________________________________________ Operational and treatment measures for the prevention of nitrification are those design, operations, and monitoring approaches that are applied in chloraminated sys- tems to reduce or eliminate the occurrence of nitrification. Good operational practices are essential for preventing nitrification and providing high-quality drinking water to customers. This chapter discusses both advantages and disadvantages of treatment and operational protocols designed to prevent nitrification, and makes recommenda- tions that can help water utilities develop short- and long-term best operational prac- tices. The practices discussed are designed to help prevent nitrification from occurring in treatment plants and water distribution systems, including storage facilities. The recommendations in this chapter are based on real situations encountered by water utilities throughout the world. Some of the recommended approaches may or may not work at each utility due to differences in water quality, pipe materials, system demand, system configuration, and other utility-specific factors. Note that many of the prevention approaches discussed in this chapter coincide with general water quality management practices that most utilities are familiar with and use, such as distribution system flush- ing, storage facility turnover and cleaning, and good chemical feed control. This chapter also discusses alternative nontraditional approaches to nitrifica- tion prevention, including monochloramine residual boosting, blending of different
Transcript of Operational and Treatment Practices to Prevent · PDF fileOPERATIONAL AND TREATMENT PRACTICES...

M56AWWA MAnuAl
Chapter 8
177
Operational and Treatment Practices to Prevent Nitrification Janice Skadsen
Y. Koby Cohen
INTRODUCTION ____________________________________________Operational and treatment measures for the prevention of nitrification are those design, operations, and monitoring approaches that are applied in chloraminated sys-tems to reduce or eliminate the occurrence of nitrification. Good operational practices are essential for preventing nitrification and providing high-quality drinking water to customers. This chapter discusses both advantages and disadvantages of treatment and operational protocols designed to prevent nitrification, and makes recommenda-tions that can help water utilities develop short- and long-term best operational prac-tices. The practices discussed are designed to help prevent nitrification from occurring in treatment plants and water distribution systems, including storage facilities.
The recommendations in this chapter are based on real situations encountered by water utilities throughout the world. Some of the recommended approaches may or may not work at each utility due to differences in water quality, pipe materials, system demand, system configuration, and other utility-specific factors. Note that many of the prevention approaches discussed in this chapter coincide with general water quality management practices that most utilities are familiar with and use, such as distribution system flush-ing, storage facility turnover and cleaning, and good chemical feed control.
This chapter also discusses alternative nontraditional approaches to nitrifica-tion prevention, including monochloramine residual boosting, blending of different

178 NITRIFICATION PREVENTION AND CONTROL
Table 8-1 Key points from chapter 8
Ammonia Dosing and Feed Control
• Limit excess free ammonia leaving the treatment plant to as low as possible, at least <0.10 mg/L N, preferably <0.05 mg/L. This is a prerequisite for nitrification prevention. However, even tight control of excess free ammonia in the finished water has not always been effective and must be combined with other practices to minimize ammonia release in the distribution system to consistently help prevent nitrification.
• Maintain chlorine to ammonia-N weight ratio leaving the treatment plant between 4.5:1 and 5:1 in order to limit free ammonia.
• For ammonia addition needed for monochloramine formation, use aqua ammonia or anhydrous ammonia rather than dry ammonium sulfate. Dry ammonium sulfate tends to clump, thereby increasing manual labor and leading to potential underfeed or overfeed of ammonia. Anhydrous and aqua ammonia are relatively easy to use but require signifi-cant safety measures; anhydrous, in particular, is likely to be subject to security-based and health and safety regulations and therefore is less desirable than aqueous ammonia. Off-gassing issues must be considered when designing systems for both chemicals.
• Ammonia injection ports should be designed for several factors: redundancy, promotion of rapid mixing to form monochloramine, and prevention or removal of scaling.
• Provide good mixing of both chlorine and ammonia into the carrier water stream to properly control monochloramine formation. Carrier water is often softened to avoid precipitation and clogging of the ammonia feed system.
• Monitor the source water for ammonia concentrations and adjust the ammonia feed accordingly.
• Perform on-line monitoring for chlorine and grab sample analysis for ammonia residuals. The use of control loops to adjust feed rates may be beneficial.
Monochloramine Residual
• Maintain a minimum concentration of monochloramine leaving the treatment plant: recommend >2.0 mg/L.
• Keep the monochloramine concentration at all monitoring points in the distribution sys-tem at 1.0 mg/L or higher depending on system and site requirements. Based on experi-ence, several utilities have established internal goals of 1.0 to 2.0 mg/L monochloramine or higher for all distribution system sites.
Storage Facility Operation
• Minimize water age in storage facilities. Storage turnover is accomplished when a per-centage of the tank volume is being drawn and filled every day. The amount of turnover must be sufficient to remove old water and provide thorough mixing of the contents of the storage facility. It is generally recommended that a least 30 percent turnover be achieved daily. Utilities may adjust this goal based on water age determinations and water quality degradation observations.
• Maximize mixing and cycling in storage reservoirs and eliminate short-circuiting. By providing adequate mixing and eliminating stratification, it may be possible to reduce both water age and temperature, thus reducing the incidence of nitrification. There are numerous effective methods to improve water age in storage facilities, including adding mixers, modifying inlet and outlet structure, and increasing the fill time while main-taining sufficient inlet velocity. Modeling can be beneficial to understand storage perfor-mance and water age issues. These actions are discussed in more detail in chapter 10.
• Routinely inspect and clean storage tanks and reservoirs. Routine sediment removal and cleaning is a good operational practice that may decrease the extent and frequency of nitrification. Inspection and cleaning should be performed at least every five years.
• When repeated nitrification events occur within a storage facility that is not being used daily or sufficiently cycled, a thorough analysis of necessary versus available storage should be conducted. Decommissioning excess storage can provide a long-term solution to nitrification problems. Seasonal decommissioning may also be a practical approach to minimizing water age during periods of the year when demands are lower.
Table continued on next page.

OPERATIONAL AND TREATMENT PRACTICES TO PREVENT NITRIFICATION 179
Table 8-1 Key points from chapter 8
Distribution System Operation
• Decrease water age in the distribution system. Based on hydraulic modeling and water quality testing, areas of high water age can be identified and approaches to reducing that age can be developed. Examples of such actions include looping of water mains to elimi-nate dead-ends and proper sizing of water mains.
• Practice systematic flushing. A system-wide unidirectional flushing is better than con-ventional (limited areas) flushing as it improves removal of biofilms, removes a greater amount of sediment, and is less expensive per mile of flushed pipeline.
• Routinely flush dead-end and other low-flow areas. Routine flushing is an established practice for maintaining distribution system water quality in areas of high water age. Auto-flushing may be an approach to achieve routine flushing, which will minimize staff time. In a utility survey, hydrant flushing was rated as one of the most important per-ceived methods for prevention of nitrification. However, once nitrification is established, flushing alone may be limited in effectiveness at controlling nitrification.
• Evaluate periodic switch to free chlorine. Free chlorination is an effective strategy for controlling and even stopping nitrification episodes once they have begun but it has met with mixed success for nitrification prevention and can result in increases in disinfection byproduct concentrations. It is required by some states. It is likely to be more beneficial if combined with unidirectional flushing.
• Provide good corrosion control. Decreasing corrosion will decrease potential habitat and protection of AOB (ammonia oxidizing bacteria).
Alternative Nontraditional Approaches
• Evaluate increasing pH to >9. The use of pH control to prevent nitrification has met with mixed success and its impact on disinfection byproduct formation, chemical costs, corrosion, and scale formation should be assessed.
• Consider blending of waters. Blending can be either beneficial or detrimental regarding nitrification and water quality.
• Evaluate booster chloramination or booster chlorination (if sufficient ammonia present). Recombining free ammonia released from chloramine decay and demand can increase the monochloramine residual and reduce the ammonia available for nitrifying bacteria.
• Evaluate use of chlorite. Chlorite may be effective for nitrification prevention but has met with mixed success. The issue of adding a regulated substance to the drinking water for prevention of nitrification needs to first be resolved by regulatory agencies, the utility, and its customers.
• Evaluate use of UV in storage facilities. Very early work suggests that application of UVA may be a promising emerging approach for waterborne AOB, particularly in stor-age facilities. UV will not penetrate biofilm so it will only reduce waterborne organisms.
Holt et al. (1995) further examined the relationship between free ammonia and nitrification (as indicated by nitrite concentration, total chlorine concentration, and temperature) in a series of experiments in a test rig. Holt et al. observed simultane-ously a decrease in the total chlorine residual, an increase in temperature, a decrease in ammonia concentration to below the method detection limit, and a spike in nitrite concentration. Results from one of the test rigs depicting these water quality changes are shown in Figure 8-2.
To limit excess free ammonia, the proper weight ratio of chlorine to ammonia-N must be fed at the treatment plant when forming monochloramines. A weight ratio of 4.5:1 to 5:1 as chlorine to ammonia-N is generally recommended. Utility-specific chlo-rine demand and other water quality parameters must be considered when selecting the target ratio. In the 2008 AWWA survey of disinfection practices, the average and median chlorine to ammonia-N–feed ratios were 4.6:1 and 4.5:1, respectively, with a mean/median free ammonia target level entering distribution systems of 0.3 and 0.1 mg/L, respectively, in over 70 chloraminated systems. A lower ratio around 3:1 has been implicated in some occurrences of nitrification (Davis 1990; Negrin et al.
(continued)

180 NITRIFICATION PREVENTION AND CONTROL
water qualities, elevation of pH, application of chlorite/chlorine dioxide, and use of UV. Table 8-1 summarizes the recommendations. Implementing the operational practices recommended in this chapter will be a good starting point for maintaining water qual-ity in the distribution system at any utility, regardless of the type of disinfectant used.
UTILITY PRACTICES IMPACTING NITRIFICATION _________________In a survey of more than 50 U.S. utilities, Kirmeyer et al. (2004) examined the most commonly used methods for prevention of nitrification and utilities rating of effective-ness. Distribution system flushing, increasing the monochloramine residual, and modi-fying the chlorine to ammonia-N ratio were found to be the most commonly used pre-ventative methods and were perceived to be the most essential (Figure 8-1). However, the actual effectiveness of these approaches has been demonstrated to vary with the utility. Not all surveyed utilities had tried all of these approaches.
In a 2008 disinfection practices survey conducted by the AWWA Disinfection Systems Committee, more than seventy utilities responded to questions about chlora-mine applications and related nitrification control measures (Routt et al. 2008). The median chlorine to ammonia feed ratio was 4.5:1, with a 0.1 mg/L median free ammo-nia-N target level entering distribution systems. About half (55 percent) of respondents indicated that they did not experience problems with monochloramine losses in distri-bution systems attributed to nitrification. The rest reported monochloramine residual losses in limited areas (52 percent), widespread (6 percent), seasonally (36 percent), and/or year round (3 percent). Seventeen of 74 (23 percent) of chloraminated utilities reported temporary free chlorine conversions (i.e., one week to three months per year or for unspecified durations and frequencies) as compared with the rest (77 percent), which used monochloramine year round. Of those reporting nitrification control plans and remediation actions, 44 percent had implemented or planned system modifications to improve flow or reduce water age, 40 percent had implemented or were planning periodic conversion to free chlorine, 40 percent had flushed or planned to flush low-flow or problem areas, 37 percent had free chlorinated or planned to free chlorinate isolated areas or tanks, and 12 percent used or planned other methods including varying or increasing monochloramine residuals or unspecified measures (Routt et. al. 2008)
TRADITIONAL APPROACHES TO NITRIFICATION PREVENTION
Ammonia ControlProper control of ammonia is necessary to establish good monochloramine formation and to avoid excess ammonia that will provide a good nutrient source for growth of ammonia oxidizing bacteria (AOB).
Concentration and Ratio Proper control of ammonia and chlorine dosages is essential for the prevention of nitrification. Because AOB thrive on ammonia, limiting the residual free ammonia available for these bacteria can be one of the major control strategies for preventing nitrification. It is recommended that excess free ammonia should be kept at less than 0.10 mg/L, preferably less than 0.05 mg/L if possible. There have been numerous exam-ples of ammonia overfeed contributing to nitrification (Kirmeyer et al. 1995; Skadsen 1993; Davis 1990). In one study, reducing the free ammonia level from 0.11 mg/L to 0.05 mg/L correlated with a reduction in nitrite concentration, which was used as an indicator of nitrification (Holt et al. 1995).

OPERATIONAL AND TREATMENT PRACTICES TO PREVENT NITRIFICATION 181
0.00
0.05
0.0
0.1
0.2
0.3
0.4
0.5
0.6
0.7
0.10
0.15
Nitr
ite/A
mm
onia
Con
cent
ratio
n, m
g/L
as N
Chl
orin
e C
once
ntra
tion,
mg/
L; T
empe
ratu
re, ˚
C/5
0
01-M
ar-9
4
30-M
ar-9
4
03-M
ay-9
4
13-J
un-9
4
15-J
ul-9
4
17-A
ug-9
4
27-S
ep-9
4
01-N
ov-9
4
06-D
ec-9
4
17-J
an-9
5
17-F
eb-9
5
09-A
pr-9
5
11-M
ay-9
5
26-J
un-9
5
Conditions for Nitrification—Test Rig (Tap 3)
NitriteTotal ChlorineAmmoniaTemperature
Source: Holt et al., 1995
Figure 8-2 Correlations between free ammonia, temperature, total chlorine residual, and nitrite concentration.
Blend water
Implement pipe corrosion control
Chloramination booster stations
Modify treatment process other than disinfection
Chlorination booster stations
Modify water pH
Reservoir/tank cleaning
Improve chloramine stability
Reduce reservoir/tank storage (cycling)
Seasonal switch to free chlorine
Increase reservoir/tank mixing
Modify chlorine:ammonia ratio
Increase chloramine residual
Distribution system flushing
0% 10% 20% 30% 40% 50% 60% 70% 80% 90% 100%
EssentialVery EffectiveEffectiveSlightly EffectiveNot Effective
Source: Kirmeyer et al., 2004. Courtesy of Water Research Foundation.
Figure 8-1 Utility practices and perceptions regarding prevention of nitrification. Number of re-sponding utilities = 50.
182 NITRIFICATION PREVENTION AND CONTROL
1990; Wolfe et al. 1988). At the Metropolitan Water District of Southern California (MWDSC), maintaining a ratio of 5:1 has reduced the incidence of nitrification (Kirmeyer et al. 2004). One example of an on-line interactive spreadsheet that can be used to determine this ratio based on water quality parameters is available at: http://www.charlottesmith.us/documents.html#ExcelSpreadsheets. You will need to request a username and password. This can be done by sending an e-mail to [email protected] The selected ratio may be dependent on the pH of the finished water. At Sydney Water (Australia), the finished water pH is in the 7.8 to 8.5 range. At the lower end of this range, an increase in monochloramine decay rate has been observed when operating at a 5:1 chlorine to ammonia-N ratio. This effect is not apparent at the higher end of the pH range (pers. communication., Sydney Water 2005). This effect is well docu-mented in chloramine chemistry (Black & Veatch 2010).
Note that even tight control of excess free ammonia and maintenance of proper chlorine to ammonia-N ratio have not always been effective at preventing nitrifica-tion (Kirmeyer et al. 2004; Skadsen 1993; Negrin et al. 1990). This is due to the fact that monochloramines will decay or react with substances in the distribution system and release free ammonia, which will then support nitrification. Therefore, while maintaining a proper ratio and limiting excess ammonia at the treatment plant is a necessary operational practice, it must be combined with other practices that minimize the extent and rate of monochloramine decay and demand to consistently help prevent nitrification.
Types of Ammonia Different types of ammonia chemicals have different benefits and drawbacks that may impact the formation of monochloramines and thereby increase the potential for nitrification. In a 2003 survey of more than 50 chloraminated utilities, only 4 percent used dry ammonium sulfate, 2 percent added no ammonia as sufficient concentrations were present in the source water, 44 percent used aqua ammonia, and 50 percent used anhydrous ammonia (Kirmeyer et al. 2004). In a 2008 survey, just under half of utilities (8 of 18) using ammonia used anhydrous with just over half (10 of 18) using aqueous ammonia and none using dry ammonium sulfate (Routt et al. 2008)
The experiences of several utilities have shown that dry feed of ammonium sul-fate is harder to control and requires more maintenance than liquid feed of aqueous or anhydrous ammonia. In Ann Arbor, Michigan, the first attempt at forming monochlo-ramines used dry ammonium sulfate (pers. commun., Sanford 2005). The dry feeders routinely plugged and fed inaccurate amounts of dry product. This is likely due to the fact that ammonium sulfate is hydroscopic and therefore tends to form clumps, result-ing in poor dosage control. Due to the unreliability of the dry ammonia feed system, the Ann Arbor plant switched within a few months to anhydrous ammonia and was subse-quently able to maintain good monochloramine formation and dosing (pers. commun., Sanford 2005). The East Bay Municipal Utility District (EBMUD) had similar experi-ences with ammonium sulfate (pers. commun., Smith 2005). The chemical clumped in the hopper, requiring the operators to chop it up in order for it to pass through.
Also, there are limited manufacturers of ammonium sulfate and most of them are located in the eastern United States. If a utility is located far from the manufacturing facility, transportation costs and clumping during transportation should be taken into account. Ammonium sulfate may also be obtained in 100-lb bags; however, these bags still have clumping problems as well as intensive lifting requirements for the opera-tional staff. Due to all of these issues, it is not recommended that water utilities use dry ammonium sulfate to form monochloramines at their treatment facilities.

OPERATIONAL AND TREATMENT PRACTICES TO PREVENT NITRIFICATION 183
Liquid ammonium sulfate feed systems are still relatively new but recently are used more commonly in the water industry. Liquid ammonium sulfate is an odorless liquid with a vapor pressure similar to water (Kirmeyer et al. 2004). It is relatively stable and does not undergo chemical degradation over time. Liquid systems have mul-tiple advantages over aqua ammonia, including a lower vapor pressure that eliminates the need for a pressurized tank and off-gas adsorption, a higher ammonia content of 38 percent versus 20 percent, and systems do not need softened carrier water as they do not precipitate hardness (Kirmeyer et al. 2004). The handling and conveyance of liquid ammonium sulfate (LAS) is similar to that of aqua ammonia (Kirmeyer et al. 2004). The cost of liquid ammonium sulfate is variable and in some cases may be advantageous and in others more expensive; a cost analysis should be performed to assess this variable. The main advantage of LAS is its lower hazard and associated safety requirements.
Both anhydrous and aqua ammonia are relatively easy to use, but they do have potentially significant safety considerations. Off-gassing may occur and should be managed with ventilation and dedicated storage rooms. Industry surveys support that anhydrous and aqua ammonia are used about equally over the last couple of decades, with a trend toward aqua for more recent installations (Routt et. al. 2008). In general, aqua ammonia is safer than anhydrous because it consists of a lower 15 to 30 percent ammonia concentration by weight. A 20 percent concentration is typical in most sys-tems (Harms and Owen 2004). An example of an aqua ammonia feed system is shown in Figure 8-3. The system in this Figure includes a double-walled steel tank for ammo-nium hydroxide storage, stainless steel fill pipes with quick connects for the delivery truck, and a chemical injection pump.
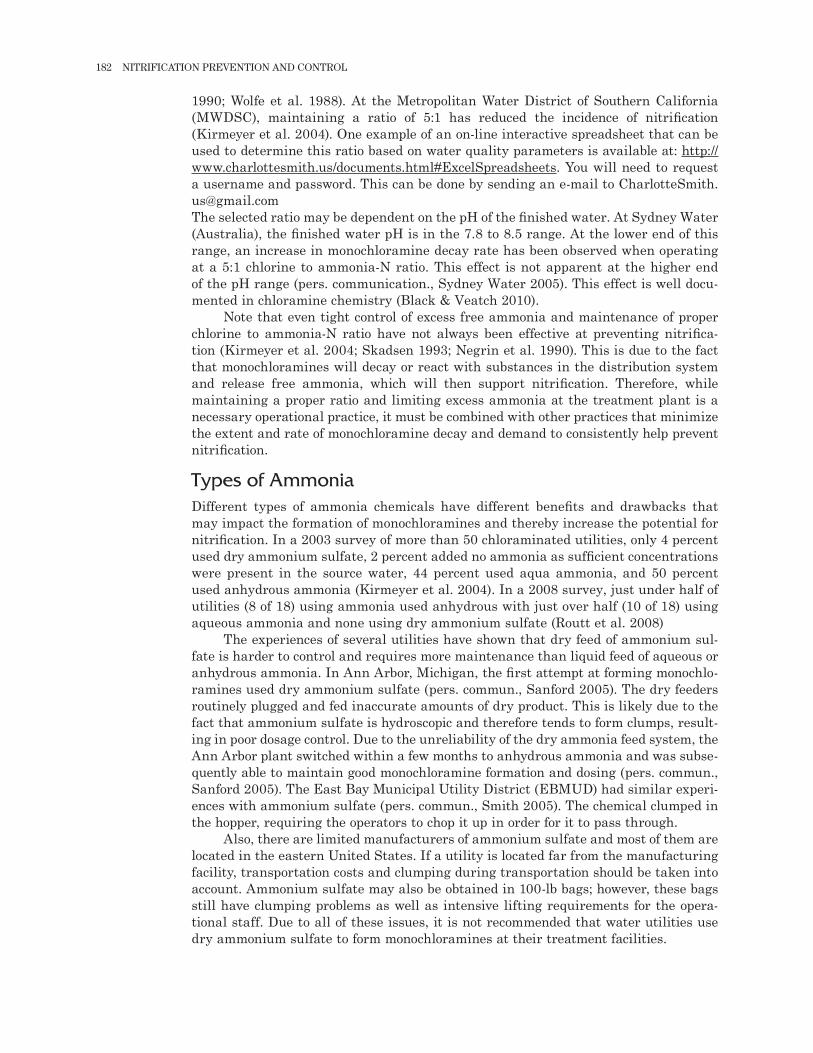
Anhydrous ammonia is a hazardous substance that requires special handling and extra equipment such as explosion-proof electrical switches and sensors to monitor ambient air ammonia level (Kirmeyer et al. 2004). Depending on the quantity stored, concentration, and local regulatory requirements, process safety management may be required. An example of an anhydrous ammonia feed system is shown in Figure 8-4. In the depicted system, a 1,000-gal nurse tank (bulk storage) with an ammonia vapor transfer pump (not shown) feeds two day tanks. The 500-gal day tanks are located on a platform scale for monitoring ammonia usage. Ammonia vapor is withdrawn through a vacuum regulator and applied to the water through ammonia injectors. Rotameters are used for flow control. Icing can occur on piping downstream of the regulator, and it may be necessary to locate the storage tanks in a heated room or provide heat trac-ing on outdoor piping. With increasing emphasis on security concerns, most utilities now favor the use of aqueous rather than anhydrous ammonia. The use of anhydrous ammonia may be addressed at some point in the future under USEPA’s Anti-Terrorism Standards, Chemical Facilities Anti-Terrorism Standards (CFATS) program.
Both high and low temperatures can create problems for control of ammonia feed. High ambient temperature may cause ammonia to off-gas and alter the ammonia con-centration. Therefore, both temperature control and proper exhaust ventilation will be important for ammonia storage. The ammonia supply lines will need to be insulated when the ammonia tank is located outside the facility to prevent the ammonia in the lines from overheating. In one utility using 19.4 percent aqua ammonia, vapor lock was observed in pumps and air gaps occurred in feed lines when the temperature was 85°F due to vaporization at high temperature (Harms and Owen 2004). Both ambi-ent temperature and sunlight exposure will be important factors to consider. Low temperatures can cause pressure drops and restrict feed rates (Harms and Owen 2004). Therefore, where low temperatures are experienced, indoor storage and tem-perature control will be important in order to maintain the proper ammonia feed rate. Alternatively, the tank and effluent line must be heated if stored outdoors in areas

184 NITRIFICATION PREVENTION AND CONTROL
Courtesy of Manchester Water Works (New Hampshire)
Figure 8-3 Example of an aqua ammonia (ammonium hydroxide) storage tank and metering pump.
OPERATIONAL AND TREATMENT PRACTICES TO PREVENT NITRIFICATION 185
where the temperature may drop below the ammonia freezing point. It is recommended that the utility always check with the local fire department on safety requirements before starting to handle ammonia in any form.
Ammonia Feed Systems: Operation and Maintenance There are several approaches used for forming monochloramines, and some of these practices may or may not help to prevent nitrification. These approaches include intro-ducing either chlorine or ammonia first or adding both simultaneously. In a survey of chloraminated utilities with 54 responses, it was found that 4 percent add ammonia first, 11 percent add chlorine and ammonia simultaneously, and 81 percent add chlo-rine first (Kirmeyer et al. 2004). In the same survey, it was also found that 4 percent of the utilities use multiple scenarios depending on water temperature. In the 2008 AWWA disinfection survey of chloraminated utilities with over seventy responses, it was found that 20 percent add ammonia first, 18 percent add chlorine and ammonia simultaneously, and 62 percent add chlorine first (Routt et.al. 2008)
Application of free chlorine before ammonia addition is the most frequently used approach for monochloramine formation. An appropriate free chlorine contact time is used to provide the necessary CT (disinfectant residual multiplied by the effective disinfectant contact time) to meet disinfection requirements of the Surface Water Treatment Rule (SWTR). This is a common choice of surface water utilities, provided
Courtesy of Ann Arbor Water Plant (Michigan)
Figure 8-4 Example of an anhydrous ammonia feed system

186 NITRIFICATION PREVENTION AND CONTROL
that disinfection byproducts (DBPs) can still be controlled, particularly for compliance with the Stage 2 Disinfectant/Disinfection Byproduct (D/DBP) Rules.
Depending on the treatment process, some utilities have found that a short free chlorine contact time (from a few minutes to a few hours) before ammonia application results in a more stable final monochloramine residual (Wilczak 2003b). In the 2008 AWWA disinfection survey, the median free chlorine contact time prior to ammonia addition was found to be one minute (Routt et al. 2008). In particular, this operational procedure has been recommended for plants using ozone followed by GAC filtration before chloramination. Further discussion of regulatory implications is provided in chapter 9.
In the case of simultaneous addition of chlorine and ammonia, disinfection effi-cacy will be solely dependent on monochloramine contact time and dosage, which is a less effective disinfectant than free chlorine. Therefore, many utilities that operate surface water treatment plants find this approach more challenging due to the need for additional contact time to meet disinfection requirements. In some cases, water utilities use strong disinfectants such as ozone or chlorine dioxide to meet the CT requirements and then add monochloramines prior to entry to the distribution system. Kirmeyer et al. (2004) recommended that even when adding chlorine and ammonia together, at least 5 ft of distance should separate the feed points to prevent the forma-tion of nitrogen trichloride.
It is generally not recommended to feed ammonia before chlorine as the free ammonia may encourage nitrification within the treatment plant processes (coagulation and sedimentation basins, filtration). For example, in Ann Arbor, Michigan, ammonia was fed prefiltration and chlorine postfiltration (due to the availability of feed points). This approach was effective when using sand media filtration beds, but after the filtration media was changed to granular activated carbon (GAC), nitrification in the filters occurred within two weeks. This nitrification resulted in the complete removal of the available free ammonia and stopped the monochloramine formation process (Skadsen 1993).
After nine years of successful chloramination, nitrification in the distribution system was observed for the first time in Ann Arbor following this filtration media change from sand to GAC. It was theorized that the AOB, which colonized the GAC filters, entered the distribution system and led to distribution system nitrification as well (Skadsen, 1993). In the Ann Arbor case, all ammonia was consumed, but in other instances, the impact of treatment processes on ammonia concentration can vary. Under these circumstances, it is possible to have inconsistent and variable concentra-tions of ammonia prior to chlorine application. This situation will greatly complicate process control and thereby make a utility more vulnerable to water quality problems and nitrification.
Scale buildup can be a continuous occurrence when using ammonia feeders. When the ammonia is injected into the water stream, the resulting pH increase can initiate a calcium carbonate precipitation reaction (Kirmeyer et al. 2004). This results in solid calcium carbonate forming on the injection equipment and in chemical feed lines. This typically occurs when the water contains 30 mg/L or more of hardness (as CaCO3) (Kirmeyer et al. 2004). The rate of scale buildup is proportional to the hardness of the water and must be considered when developing plant-specific maintenance guidelines (Kirmeyer et al. 2004). Examples of calcium carbonate buildup and removal are shown in Figure 8-5. This Figure shows mineral buildup next to the ammonia injection point on a static mixer and mineral buildup at the injection line fittings. The continuous buildup on the injectors will decrease the ammonia feed rate, potentially leading to breakpoint chlorination and a decrease in total residual chlorine (see chapter 9 for discussion of breakpoint chlorination and an example of the chlorine breakpoint curve).