operation management mba
28
CAMBRIDGE INSTITUTE OF TECHNOLOGY 1
Transcript of operation management mba

CAMBRIDGE INSTITUTE OF TECHNOLOGY
1

CAMBRIDGE INSTITUTE OF TECHNOLOGY
2
OPERATIONS MANAGEMENT
STUDY MATERIAL
Prof. Subramani LDepartment of Management StudiesCambridge Institute of TechnologyK. R. Puram, Bangalore – 560 036

CAMBRIDGE INSTITUTE OF TECHNOLOGY
3
Break Even Point:Total Revenue =Total cost =Fixed cost +Variable costTotal revenue = Selling price per unit (S)* Quanitity (Q)Variable cost = Variable cost per unit (V) * Quanitity (Q)Selling price per unit (S)* Quanitity (Q) = fixed cost (FC) + Variable cost per unit (V) * Quanitity (Q)S * Q = FC + V * Q → S * Q – V * Q = FC → Q(S – V) = FC
Break Even Chart: Selling price per unit = Rs 2 Variable cost per unit = Rs 1 Fixed Cost = Rs 5
Quantity Sales Fixed cost Variabe cost Total cost
0 0 5 0 5
1 2 5 1 6
2 4 5 2 73 6 5 3 8
4 8 5 4 9
5 10 5 5 10
6 12 5 6 11
7 14 5 7 12
8 16 5 8 13
9 18 5 9 14
10 20 5 10 15

CAMBRIDGE INSTITUTE OF TECHNOLOGY
4
Exercise Draw the Break Even Chart:

CAMBRIDGE INSTITUTE OF TECHNOLOGY
5
Problem 1: P ltd manufacturing kid Pen need a fixed cost of Rs 10,000 per year. Variable cost per unit is Rs 5 and selling price per unit Rs 10. Required
i. Break Even pointii. Number of pens to be sold to earn a profit of Rs 20,000.
iii. If Pltd could able to sell 3,000 units per yeat what is the profit.
Solution : i) Break Even pointContribution per unit = s – v = 10 – 5 = Rs 5
Problem 2:
I. Comput Fixed costII. Break even point
III. Find the sales to make profit of Rs 10,000
1, 00,000 =Rs 30,000
2010 2009Sales Rs 1,50,000 1,00,000Profit Rs 20,000 5,000

CAMBRIDGE INSTITUTE OF TECHNOLOGY
6
Problem 3: company has a fixed cost of Rs 20,000. It sells two products A and B, in the ratio of 2 units of A and 1 unit of B. Contribution is Rs I per unit of A and Rs 2 per unit of B. how many units of A and B would be sold at break even point.
Solution: Total Contribution for A (for 2 units) = contribution per unit * 2 = 1 * 2 = Rs 2
Total Contribution for B (for 1 units) = contribution per unit * 1 = 2 * 1 =Rs 2
Total contribution of A and B = Rs 4
Units of product A and B sold in the ratio 2:1
Break even quantity of A = 5000 * 2 =10,000 units
Break even quantity of B = 5000 * 1 =5,000 units

CAMBRIDGE INSTITUTE OF TECHNOLOGY
7
Forecasting: 3 years moving average:
week actual inventory 3years moving average/forecasts absolute deviation1 1002 1253 904 110 (90+125+100)/3= 105 55 105 (110+90+125)/3= 108.3 3.36 130 (105+110+90)/3= 101.7 28.37 85 (130+105+110)/3= 115 308 102 (85+130+105)/3= 106.7 4.79 110 (102+85+130)/3= 105.7 4.3
10 90 (110+102+85)/3= 99 911 105 (90+110+102)/3= 100.7 4.312 95 (105+90+110)/3= 101.7 6.713 115 (95+105+90)/3= 96.7 18.314 120 (115+95+105)/3= 105 1515 80 (120+115+95)/3= 110 3016 95 (80+120+115)/3= 105 1017 100 (95+80+120)/3= 98.3 1.7
sum of absolute deviation 170.65 years moving average
week actual inventory 5years moving average/forecasts absolute deviation
1 100
2 125
3 90
4 110
5 105
6 130 (105+110+90+125+100)/5= 106 24
7 85 (130+105+110+90+125)/5= 112 27
8 102 (85+130+105+110+90)/5= 104 2
9 110 (102+85+130+105+110)/5= 106.4 3.6
10 90 (110+102+85+130+105)/5= 106.4 16.4
11 105 (90+110+102+85+130)/5= 103.4 1.6
12 95 (105+90+110+102+85)/5= 98.4 3.4
13 115 (95+105+90+110+102)/5= 100.4 14.6
14 120 (115+95+105+90+110)/5= 103 17
15 80 (120+115+95+105+95)/5= 105 25
16 95 (80+120+115+95+105)/5= 103 8

CAMBRIDGE INSTITUTE OF TECHNOLOGY
8
17 100 (95+80+120+115+95)/5= 101 1
Sum of absolute deviation 143.67 years moving average:
Week actual inventory 7 years moving average/forecastsabsolute deviation
1 1002 1253 904 1105 1056 1307 858 102 (85+130+105+110+90+125+100)/7= 106.4 4.49 110 (102+85+130+105+110+90+125)/7= 106.7 3.3
10 90 (110+102+85+130+105+110+90)/7= 104.6 14.611 105 (90+110+102+85+130+105+110)/7= 104.6 0.412 95 (105+90+110+102+85+130+105)/7= 103.9 8.913 115 (95+105+90+110+102+85+130)/7= 102.4 12.614 120 (115+95+105+90+110+102+85)/7= 100.3 19.715 80 (120+115+95+105+95+110+102)/7= 105.3 25.316 95 (80+120+115+95+105+95+110)/7= 102.1 7.117 100 (95+80+120+115+95+105+95)/7= 100 0
Sum of absolute deviation 96.3Forecasted Demand for 18 week
3 years moving average = (100+95+80)/3=96.7
5 years moving average = (100+95+80+120+115)/5= 102
7 years moving average = (100+95+80+120+115+95+105)/7=101.4
If you are a business analyst suggest the best of the above three?
Compute MEAN ABSOLUE DEVIATION (MAD) = sum of absolute deviation/n
MAD 3 year = 170.6/14 = 12.19 → n=17-3 = 14
MAD 5 year = 143.6/ 12 = 11.96 → n=17-5 = 12
MAD 7 years = 96.3/ 10 = 9.63 → n=17-7 = 10
Forecaste demand = 101.4 since the MAD (error) is least

CAMBRIDGE INSTITUTE OF TECHNOLOGY
9
If you are asked to consider the recent 10 years forecast the demand for 18 week. (n=10) → 8 to 17
3 years moving average 5 years moving average 7 years moving average
Weekactual inventory Forecasts Deviation
actual inventory forecasts
absolute deviation
actual inventory forecasts
absolute deviation
8 102 106.7 4.7 102 104 2 102 106.4 4.49 110 105.7 4.3 110 106.4 3.6 110 106.7 3.310 90 99 9 90 106.4 16.4 90 104.6 14.611 105 100.7 4.3 105 103.4 1.6 105 104.6 0.412 95 101.7 6.7 95 98.4 3.4 95 103.9 8.913 115 96.7 18.3 115 100.4 14.6 115 102.4 12.614 120 105 15 120 103 17 120 100.3 19.715 80 110 30 80 105 25 80 105.3 25.316 95 105 10 95 103 8 95 102.1 7.117 100 98.3 1.7 100 101 1 100 100 0sum of absolute deviation 104 92.6 96.3
MEAN ABSOLUE DEVIATION (MAD)
104/10 =10.4
92.6/10 =9.26 96.3/10=9.63
5 years moving average is the best solution since MAD is least hence gorecast for 18 week = 102
Weighted Moving Average
3 years score (sum of year digit) = 1+2+3=6 w1=3/6 w2= 2/6 w3=1/6
W1+W2+W3 = 1 give more weightage for recent years
17 week forecast = 3/6*95+2/6*80+1/6*120= 94.12 and so on
18 week demand = 3/6*100+2/6*95+1/6*80 = 126.7
Sum of 5 years digits = 1+2+3+4+5 = 15
W1= 5/15 W2=4/15 W3=3/15 W4=2/15 W5=1/15
Forecast for 18 week = 5/15*95+4/15*80 + 3/15*120 + 2/15*115+1/15*95= 98.67 and so on
Forecast for 18 week = 5/15*100+4/15*95 + 3/15*80 + 2/15*120+1/15*115= 98.33

CAMBRIDGE INSTITUTE OF TECHNOLOGY
10
Exponential Smoothening Method:Ft = forecasted indamand for period t, the next peiod.Ft-1 = forecasted demand for period t-1, the prior periodAt-1 = Actual demand for period t-1, the prior periodα= smoothening constant from 0 to 1
Ft = Ft-1 +α (At-1 - Ft-1) ,α=0.1 Ft = Ft-1 +α (At-1 - Ft-1) ,α=0.2
weekActual Demand Forecasts
Abs. Deviation Forecasts
Abs. Deviation
1 85 85 85
2 102 85+0.1(85-85) 85 17 85 17
3 110 85+0.1(102-85) 86.7 23.3 88.4 21.6
4 90 86.7+0.1(110-86.7) 89 1 92.7 2.7
5 105 89+0.1(90-89) 89.1 15.9 92.2 12.8
6 95 89.1+0.1(105-89.1) 90.7 4.3 94.8 0.2
7 115 90.7+0.1(95-90.7) 91.1 23.9 94.8 20.2
8 120 91.1+0.1(115-91.1) 93.5 26.5 98.8 21.2
9 80 93.5+0.1(120-93.5) 96.2 16.2 103 23
10 95 96.2+0.1(80-96.2) 94.6 0.4 98.4 3.4
11 100 94.6+0.1(95-94.6) 94.6 5.5 97.7 2.3
Sum of Abs.Deviation 134 124.4Note: forecasted demand for period 1 = actual demand for period 1
MAD @0.1 = 134/10 = 13.4 12 week forecast = 94.6+0.1(100-94.6) = 95.14
MAD @0.2= 124/10 = 12.4 12 week forecast=97.7+0.2(100-97.7) = 98.16
Since MAD is least for α = 0.2 forecast is 98.16
Exponential Smoothening Trend /Seasonal Method: Exponential Smoothening Method:
St =Smoothed forecasted in period t.Tt =Trend estimate in period t.At =Actual demand in period t.FTt= Forecast with trend in period tα= smoothening constant from 0 to 1β= smoothening constant for the trend
FTt= St-1 + Tt-1
St = FTt + α (At - FTt)Tt= Tt-1+ β (FTt - FTt -1- Tt-1)α = 0.2 β = 0.3
Month t 1 2 3 4 5 6

CAMBRIDGE INSTITUTE OF TECHNOLOGY
11
sales '000 130 136 134 140 146 150
*** FT1 = A1= 130 and T1= (A6 - A1)/5 = (150 -130)/5 = 4
Month t At FTt + α (At - FTt) St
1 130 130 + 0 .2 (130-130) 130 step32 136 134 + 0.2 (136-134) 134.4 step63 134 138.4 + 0.2 (134-138.4) 137.52 step94 140 141.64 + 0.2 ( 140-141.64) 141.31 step125 146 145.17+ 0.2(146 - 145.17) 145.34 step156 150 149.1 + 0.2( 150 - 149.1) 149.28 step18
Month t At Tt-1+ β (FTt - FTt -1- Tt-1) Tt
1 130 4 step2
2 136 4 + 0.3 ( 134 - 130-4) 4 step5
3 134 4 + 0.3 (138.4 - 134 - 4) 4.12 step8
4 140 4.12 + 0.3 ( 141.64 - 138.4- 4.12) 3.86 step11
5 146 3.86 +0.3(145.17 - 141.64 - 3.86) 3.76 step14
6 150 3.76 + 0.3(149.1 - 145.17 - 3.76) 3.81 step17
Month t At St-1 + Tt-1 FTt1 130 130 step12 136 130 + 4 134 step43 134 134.4 + 4 138.4 step7 4 140 137.52 + 4.12 141.64 step105 146 141.31+ 3.86 145.17 step136 150 145.34+3.76 149.1 step 16
7 ---- 149.28+3.81 153.09 step 19

CAMBRIDGE INSTITUTE OF TECHNOLOGY
12
Regression Method:
Problem 1: An investigation into demand for colour TV sets in 5 cities has resulte in the following data:
Population In lakhs X 5 7 9 11 13Demand for TV in thousands Y 9 11 13 15 17
Fit a linear regression of Y on X and estimate the demand for CTV sets for two towns with population of 10 lakhs and 12 laks respectvely.
Solution:
-------------1
-------2
65 = 5a + 45 b----------------3
625= 45a + 445 b-----------4
Multiply equation 3 by 9
585 = 45a + 405b-----------5
Solve equation 4 and 5
40 = 40 b → b = 1
By putting the value of b in equation 3, we get
65 = 5a + 45*1 → 5a = 65-45 → 5a = 20 → a= 4
Regression equation of Y on:
Population =10 lakhs
X Y X² XY5 9 25 457 11 49 779 13 81 117
11 15 121 16513 17 169 221
∑X = 45
∑Y=65
∑X² = 445
=∑XY=625

CAMBRIDGE INSTITUTE OF TECHNOLOGY
13
Y = 4 + 1*10 = 14 thousand CTV sets
Population = 20 lakhs
Y = 4 + 1* 20 = 24 thousand CTV sets
Problem 3: project the trend of sales for the next 5 years from the follwing data:
Year(X) 2006 2007 2008 2009 2010Sales (‘000 units)(Y) 120 140 120 150 170
Fit a regression equation to the sales figures and estimate the sales for 2011
Solution:
-------------1
-------2
700 = 5a + (0) b → 5a = 700/5 → a = 140
110 = (0) a + 10 b → b=110/10 → b = 11
Regression equation of Y on X: → Y = 140 + 11X
Trend for the next five years
X (2011) = 2011 – 2008 =3 → Y = 140 + 11*3 = 140 + 33 → Y = 173 lakhs
X (2012) = 2012 – 2008=4 → Y = 140 + 11*4 = 140 + 44→ Y = 184 lakhs
X (2012) = 2013 – 2008 =5 → Y = 140 + 11*5= 140 + 55→ Y = 195 lakhs
X (2012) = 2014 – 2008 =6 → Y = 140 + 11*6 = 140 + 66→ Y = 206 lakhs
X (2012) = 2015 – 2008 =7 → Y = 140 + 11*7 = 140 + 77→ Y = 217 lakhs
Year X=year-2008 Y X² XY
2006 -2 120 4 -2402007 -1 140 1 -1402008 0 120 0 02009 1 150 1 1502010 2 170 4 340
∑X=0 ∑Y=700 ∑X²=10 ∑XY=110

CAMBRIDGE INSTITUTE OF TECHNOLOGY
14
Plant Location:
Problem1: A manufacture is considering four loations for anew plant. It has attempted tos study all costs at the various loaction and find that tah costs of the following items vary from one location to another. The firm will finance the new plant from deposits bearing 10 percent interest
A B C Dlabor (Rs per unit) 0.75 1.1 0.8 0.9plant (Crores) 0.46 0.39 0.4 0.48material @ equipment(Rs per Unit) 0.43 0.6 0.4 0.55Electricity per year (Rs) 30 26 30 28Water per year (Rs) 7 6 7 7transportation per unit (Rs) 0.02 0.1 0.1 0.05Taxes(per year)(Rs) 33 28 63 35
Determine the most suitable location(economically) for output volumes in the range of 50,000 to 130000 units
SOLUTION:
cost element A B C D10% Interest 4,60,00 3,90,000 4,00,000 4,80,000Electricity 30,000 26,000 30,000 28,000Water 7,000 6,000 7,000 7,000Taxes 33,000 28,000 63,000 35,000TOTAL FIXED COST 5,30,000 4,50,000 5,00,000 550,000Labour 0.75 1.1 0.8 0.9material @ equipment(Rs per Unit) 0.43 0.6 0.4 0.55transportation per unit (Rs) 0.02 0.1 0.1 0.05variable cost per unit 1.2 1.8 1.3 1.5variable cost for 50,00 units 60,000 90,000 65,000 75,000TOTAL COST For 50,000 units 5,90,000 5,40,000 5,65,000 6,25,000variable cost for 1,30,000 units 1,56,000 2,34,000 1,69,000 1,95,000TOTAL COST for 1,30,000 6,86,000 6,84,000 6,69,000 7,45,000variable cost for 1,0000 units 1,20,000 1,80,000 1,30,000 1,50,000TOTAL COST for 1,00,000 6,80,000 6,30,000 6,30,000 7,00,000

CAMBRIDGE INSTITUTE OF TECHNOLOGY
15
GRAPH
CAMBRIDGE INSTITUTE OF TECHNOLOGY
16
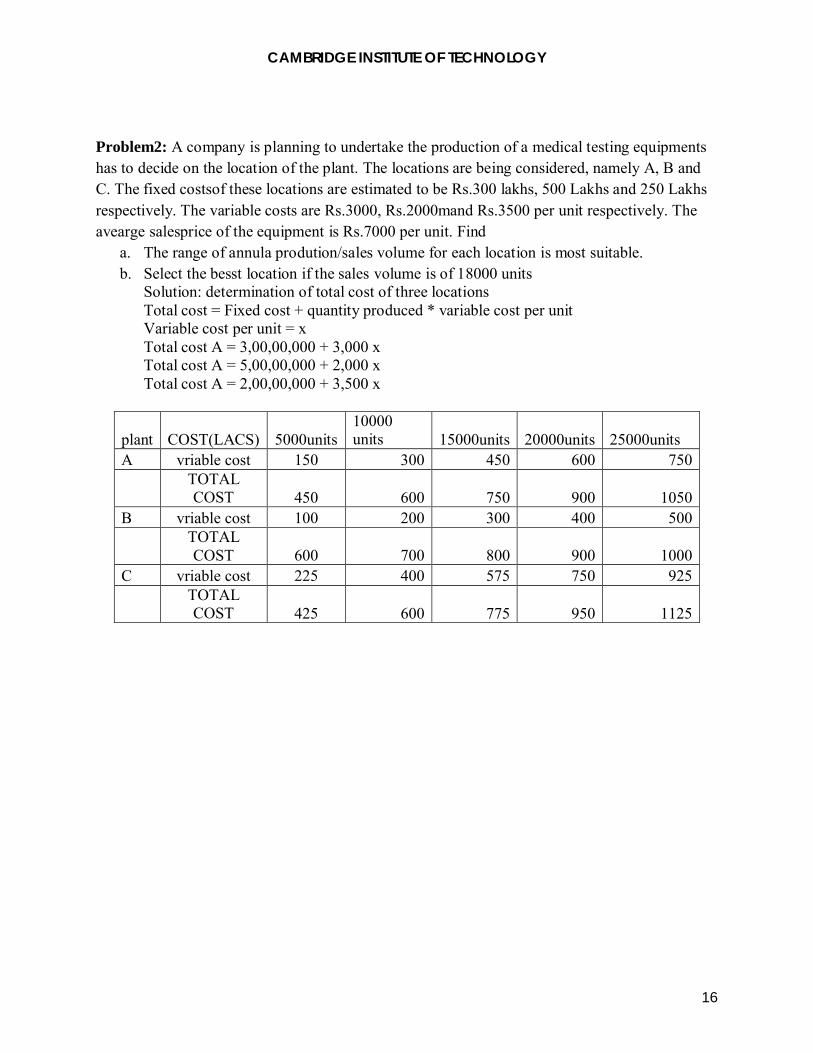
Problem2: A company is planning to undertake the production of a medical testing equipments has to decide on the location of the plant. The locations are being considered, namely A, B and C. The fixed costsof these locations are estimated to be Rs.300 lakhs, 500 Lakhs and 250 Lakhs respectively. The variable costs are Rs.3000, Rs.2000mand Rs.3500 per unit respectively. The avearge salesprice of the equipment is Rs.7000 per unit. Find
a. The range of annula prodution/sales volume for each location is most suitable.b. Select the besst location if the sales volume is of 18000 units
Solution: determination of total cost of three locationsTotal cost = Fixed cost + quantity produced * variable cost per unitVariable cost per unit = xTotal cost A = 3,00,00,000 + 3,000 xTotal cost A = 5,00,00,000 + 2,000 xTotal cost A = 2,00,00,000 + 3,500 x
plant COST(LACS) 5000units10000 units 15000units 20000units 25000units
A vriable cost 150 300 450 600 750TOTAL COST 450 600 750 900 1050
B vriable cost 100 200 300 400 500TOTAL COST 600 700 800 900 1000
C vriable cost 225 400 575 750 925TOTAL COST 425 600 775 950 1125

CAMBRIDGE INSTITUTE OF TECHNOLOGY
17
From the graph we can find that upto 22,000 units its economocal to use location C. for qauntity abve 22,000 A is preferred.
Plant Capacity:
Problem 1 A steel plant has a designed capacity of 50,000 units per day, effective capacity 40,000 units per day and an actual output of 36000 units per day. Compute the efficiency of the plant and utilisation.
Solution: efficiency = Actual output/efficiency capacity = 36000/40000 x 100 = 90%Utilization = Actual output/designed capacity = 36000/50000 x 100 = 72%
Problem 2. A manufacturing company has a product line consisting of five work stations in series. The indvidual workstation capacities are given. The out put of 500 units per shift.Work station A B C D E
Capacity/shift 600 650 650 550 600
Calculate i) system capacity ii) efficiency of the production line. i) System capacity/shift = 550 (lowest capacity among the given work sation) ii) Actual Capacity = 500System efficiency = Actual capacity/system capacity x 100= 500/550 x 100 = 90.91%
Problem3 A department works 8 hrs shifts, 250 days a year and has the usage data of the m/c, as given below.
Product annual demand std processing time
X 300 Units 4 hrs

CAMBRIDGE INSTITUTE OF TECHNOLOGY
18
Y 400 Uints 6 hrs
Z 500 units 3 hrsDetermine the number of machines required
Solution: Processing time required
Product annual demand
std processing time
processing time required
X 300 Units 4 hrs 1200
Y 400 Uints 6 hrs 2400
Z 500 units 3 hrs 1500
Total 5100
Annual production capacity of one m/c = 8 x 250 = 2000 hrs per year.
No.of m/c required = work load per year/ ppproduction capacity per year = 5100/2000 = 2.55 = 3 m/c
Problem .4 Machine A and B are both capable of processing the product. The following information is given
Particulartsmachine
Amachine
BInvestment 75000 80000interest on capital 10% 15%houraly charges Rs10 Rs8pieces produced per hour 5 8annual operating hours 2000 2000
Which m/c will give the lowest cost per unit of production, if it runs for the whole year? If only 4000 piesces are to be produced in ayear, which machine whould give the lowest cost per piece?Solution:
Particularts machine Amachine
BInterst Investment(Fixed Cost) 7500 8000houraly charges(Variable Cost) 20,000 16,000TOTAL COST 27,500 28,000
TOTAL OUTPUT10000 units
16,000 units
Unit cost Rs 2.75 Rs 1.75
If the out put is 4000 units per annumParticularts machine machine

CAMBRIDGE INSTITUTE OF TECHNOLOGY
19
A B
Interst Investment(Fixed Cost) 7500 8000houraly charges(Variable Cost) 8,000 4,000TOTAL COST 15,500 16,000TOTAL OUTPUT 4000 4000Unit cost Rs 3.89 Rs 4.00
Probem 5 : Machine A and B are both capable of processing the product. The following information is given
Particulartsmachine
Amachine
B
NvestmentRs
50,000Rs
80,000interest on capital 15% 15%houraly charges(Wages+Power) Rs10 Rs8No .pieces produced per hour 8 8annual operating hours 2000 2000
a) Which m/c will give the lowest cost per unit of production, if it runs for the whole year? b) If only 4000 pieces are to be produced in a year, which machine whould give the lowest
cost per piece?c) Will your answer to a) above vary if you informed that 12.5% of the output of machine B
gets rejected at the ispection satage. If so what would ne new solution.
Solution
Particularts machine A machine BInterst Investment(Fixed Cost) 7500 12,000houraly charges(Variable Cost) 20,000 16,000TOTAL COST 27,500 28,000
TOTAL OUTPUT5x2000=10000 units
8x200=16,000 units
Unit cost Rs 2.75 Rs 1.75if the out put is 4000 units per annumParticularts machine A machine BInterst Investment(Fixed Cost) 7500 800Operating hors Required 4000/8=500 4000/8=500hourally charges(Variable Cost) 10x500=5000 8x500=4000TOTAL COST 12,500 16,000TOTAL OUTPUT 4000 4000Unit cost Rs 3.125 Rs 4.00
Machine A give lowest Cost per unit.
If 12.5% o/p of machine b is rejected, annual productions from machine B
CAMBRIDGE INSTITUTE OF TECHNOLOGY
20
= 16,000 x (100-12.5)/100=14,000 units
Cost per unit=28,000/14,000= Rs 2
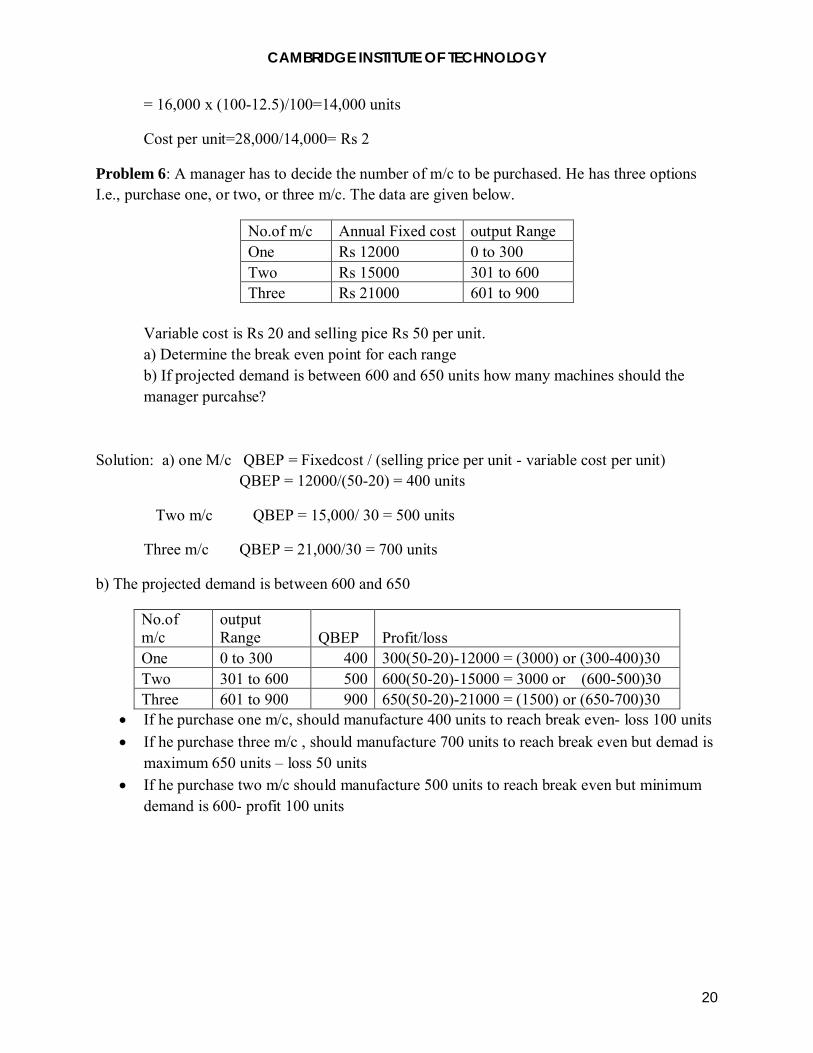
Problem 6: A manager has to decide the number of m/c to be purchased. He has three options I.e., purchase one, or two, or three m/c. The data are given below.
No.of m/c Annual Fixed cost output RangeOne Rs 12000 0 to 300Two Rs 15000 301 to 600Three Rs 21000 601 to 900
Variable cost is Rs 20 and selling pice Rs 50 per unit.a) Determine the break even point for each rangeb) If projected demand is between 600 and 650 units how many machines should the manager purcahse?
Solution: a) one M/c QBEP = Fixedcost / (selling price per unit - variable cost per unit)QBEP = 12000/(50-20) = 400 units
Two m/c QBEP = 15,000/ 30 = 500 units
Three m/c QBEP = 21,000/30 = 700 units
b) The projected demand is between 600 and 650
No.of m/c
output Range QBEP Profit/loss
One 0 to 300 400 300(50-20)-12000 = (3000) or (300-400)30Two 301 to 600 500 600(50-20)-15000 = 3000 or (600-500)30Three 601 to 900 900 650(50-20)-21000 = (1500) or (650-700)30
If he purchase one m/c, should manufacture 400 units to reach break even- loss 100 units
If he purchase three m/c , should manufacture 700 units to reach break even but demad is maximum 650 units – loss 50 units
If he purchase two m/c should manufacture 500 units to reach break even but minimum demand is 600- profit 100 units

CAMBRIDGE INSTITUTE OF TECHNOLOGY
21
Employee Productivity:
Productivity = Actual production/standard production
Problem1: In particular plant there are10 workers manufacturting a single product and output per month cosisting of 25 days of that particular product is 300. How much is the monthly productivity.
Monthly productivity per worker=300/10=30 units
Problem 2: There are two industires a Aand B manufacturing spark plug. The standard time per piece is 15 minutes. The o/p is 30 and 20 respectively per shift of 8 hours. Find the Productivity of each per shift of 8 hours. What is the expectd production of each per week consisting of 6 days?
Solution:Productivity per shift = 8x60/15=32 pcs.Productivity of A = 30/32=93.75%Productivity B =20/32=5/8=62.50%Production per week of industry A = 30x16=480 nos.Production per week of industry A = 20x6=120 nos.
Problem 3: The follwing data is avialble for machine in manufacturing unit:
hours workedper day 8working days per month 25numbers of operators 1

CAMBRIDGE INSTITUTE OF TECHNOLOGY
22
standard minutes per unit of productionmachine time 22opertor time 8total time per unit 30
i) If plant opearted at 75% eficiency, ant the opereators is workink at 100% efficency, what is the oput per month?ii) If machine productivity is increased 10% over existing lvel, what will bw the out per month?iii) If opetaors efficeiency is reduced by 20% over existing level, wghat will be the out put per month?a) Hours workedper day = 8
Working days per month =25
Hours worked per month = 25 x 8 = 200 hrs.
Machine time = 22 minutes
Operator time =8 min
Total time per unit = 30 min =1/2 hrs
No. of units produced/month/operator = 200/(1/2)= 400
Monthly production = 400 x 75/100 = 300 units
b) Productivity incresed by 10 %
Machine time = 22 x 100/(100+10) = 20 minutes
Total time = 20 + 8 = 28 minutes
No. of units produced/month/operator = (200 x 60/28) = 428.57 units
Monthly production = 428.57 x 75/100 = 321 units
c) If operators efficiency reduced by 20%
Operator time = 8 x (100+20)/100 = 9.2 minutes
Total time = 22 + 9.2 = 31.2 minutes
No. of units produced/month/operator = (200 x 60/31.2) = 379.74
Monthly production = 379.74 x 75/100 = 285 units
Problem 4: the folwing data avialble for a manufactring uint
no of operators 15daily working hors 8No of working days pe month 25Std. production per month 300 units

CAMBRIDGE INSTITUTE OF TECHNOLOGY
23
std.labor per month 8The follwing information available for august man days lost due to absentizm 30unit produced 240idle time 276 man hours
Find the following: Percent absentisma) Efficiency of utilisation labourb) Productive efficiency labourc) Over all productivity of labour interms of units prduced per man per month
Solution: No. of man days = 15 x 25 = 375Total working hours = 375 x 8 = 3,000 hrsHours lost in abzentism = 30 x 8 = 240 hrs.
a) Percent abentism = (240/3000) x 100 = 8%b) Efficiency of utilisation labour = std labour hours to produce 240 units/ total labour hours
= (240 x 8)/3000 x 100 = 64%
c) Productive efficiency labour
std labour hours to produce 240 units = 240 x 8 =1920 labour hours
Total loss in time = Loss due to absentism + Iddletime = 30 x 8 + 276 = 516 hrs.
Actual Labour Hours = 1920 + 516 = 2484 Hrs.
Efficiency of Lbour = Std.labour hrs./Actual Labour hrs. = 1920/2484 x 100 = 77.30%
d) 15 men produce 300 units,
std. labour productivity = 300 / 20 units = 20 units
In August, over all productivty = 240 /15 = 16 unitss
Productivity Reduces By = (25-16)/25 x 100 = 25
Problem 5: A factory can manufacture rwo products A and B by using of two materials P or Q. A is expected to sell at Rs 70 per unit and B at Rs 30 per unit.
Material P Material Qout put A 200 units 400 units B 300 units 200 unitsRaw materal usage 1,000 kg 1,000 kg
labour usage 300 man hours250 man hours
electricit consumption 1000 kwhr 1500kwhrcost of raw materal/kg Rs 20 Rs 30labou per manhour Rs 5 Rs 5electricty/kwhr Rs 1.5 Rs 1.5

CAMBRIDGE INSTITUTE OF TECHNOLOGY
24
Compare the productivity of material, labour, and lectrial energy in using material P and Q. comment on the relative advantage of using either of the materials.
Sales value P = 200 x 70+300 x 30 = Rs 23,000
Sales value P = 400 x 70+200 x 30 = Rs 34,000
Productivity = value of output/value of input
raw material productivity = sales value output/value of raw material used 23000/(1000x20)=1.150 34000/30000=1.133labour productivity = sales vaue output/ value of labour 23000/(300x5)= 15.333 34000/(25x5)=27.2electrical energy Prod = sales value output/ vakue of electrial energy 23000/(1000x1.5)=15.333 34000/(1500x1.5)=15.111
Raw materials and electriacl energy productivity almost same for P and Q, but labour prodctvity is better for P than Q
Control charts
Control chart for mean - chart
Where
= sum of sample mean
K = No. of samples
Where standard deviation is known -
Upper Control limit (LCL) = Lower Control Limit =
N= total number of items in a sample
�p = standard deviaation of population
Where standard deviation is not given –
CAMBRIDGE INSTITUTE OF TECHNOLOGY
25
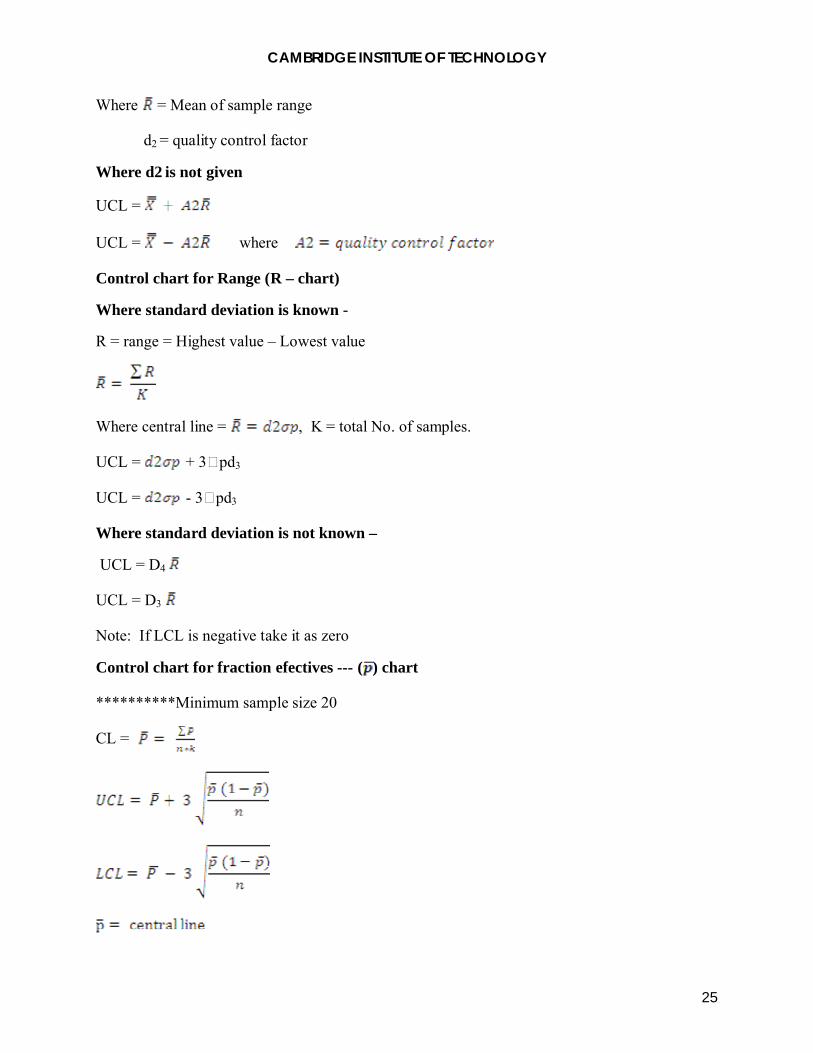
Where = Mean of sample range
d2 = quality control factor
Where d2 is not given
UCL =
UCL = where
Control chart for Range (R – chart)
Where standard deviation is known -
R = range = Highest value – Lowest value
Where central line = , K = total No. of samples.
UCL = + 3�pd3
UCL = - 3�pd3
Where standard deviation is not known –
UCL = D4
UCL = D3
Note: If LCL is negative take it as zero
Control chart for fraction efectives --- ( ) chart
**********Minimum sample size 20
CL =
CAMBRIDGE INSTITUTE OF TECHNOLOGY
26
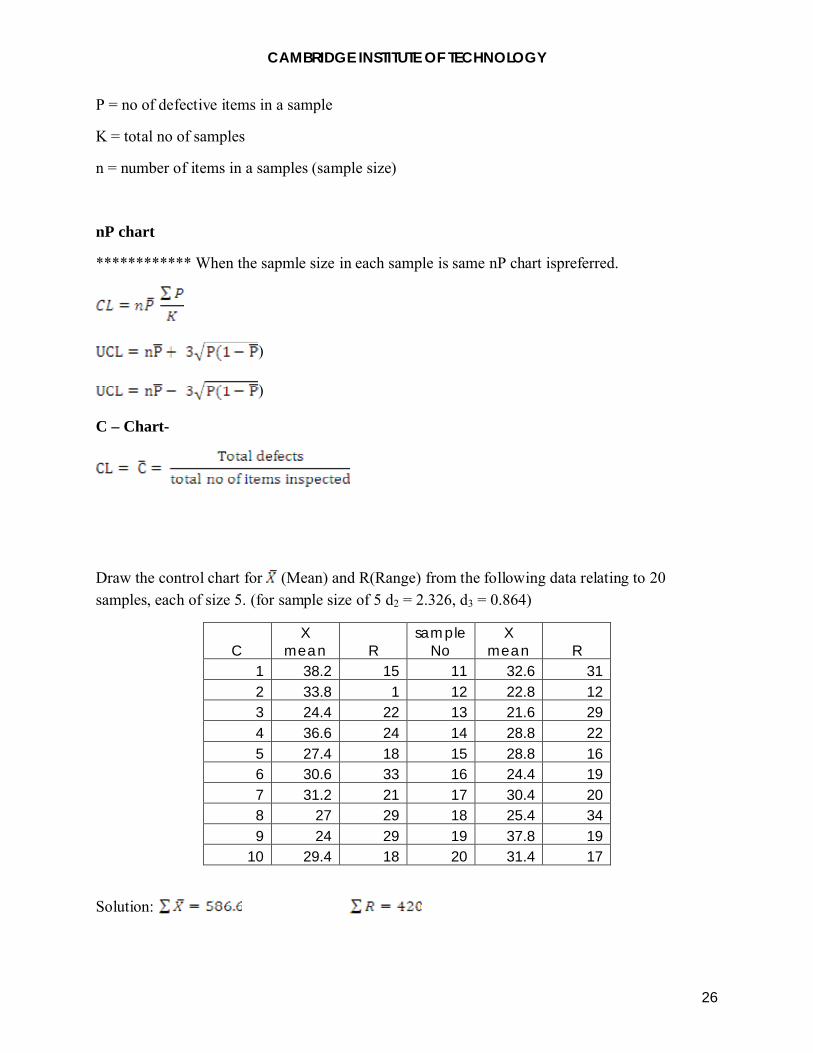
P = no of defective items in a sample
K = total no of samples
n = number of items in a samples (sample size)
nP chart
************ When the sapmle size in each sample is same nP chart ispreferred.
)
)
C – Chart-
Draw the control chart for (Mean) and R(Range) from the following data relating to 20 samples, each of size 5. (for sample size of 5 d2 = 2.326, d3 = 0.864)
CX
mean Rsample
NoX
mean R1 38.2 15 11 32.6 312 33.8 1 12 22.8 123 24.4 22 13 21.6 294 36.6 24 14 28.8 225 27.4 18 15 28.8 166 30.6 33 16 24.4 197 31.2 21 17 30.4 208 27 29 18 25.4 349 24 29 19 37.8 19
10 29.4 18 20 31.4 17
Solution:

CAMBRIDGE INSTITUTE OF TECHNOLOGY
27
Upper Control limit (LCL) =
Lower Control Limit =
= 29.35 – 12.11 = 17.23
Plot Chart-

CAMBRIDGE INSTITUTE OF TECHNOLOGY
28