
Operating Instructions EB 8388 EN
40
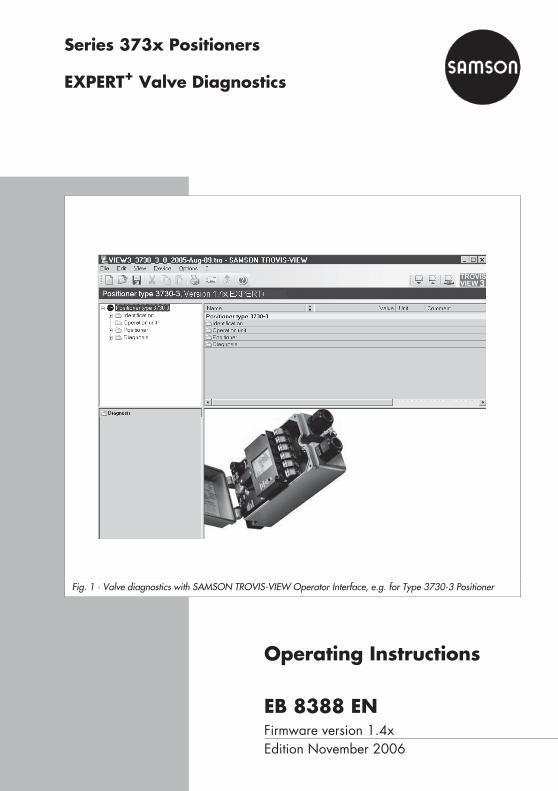
Series 373x Positioners EXPERT + Valve Diagnostics Operating Instructions EB 8388 EN Firmware version 1.4x Edition November 2006 Fig. 1 · Valve diagnostics with SAMSON TROVIS-VIEW Operator Interface, e.g. for Type 3730-3 Positioner
Transcript of Operating Instructions EB 8388 EN
Series 373x Positioners
EXPERT+ Valve Diagnostics
Operating Instructions
EB 8388 ENFirmware version 1.4xEdition November 2006
Fig. 1 · Valve diagnostics with SAMSON TROVIS-VIEW Operator Interface, e.g. for Type 3730-3 Positioner
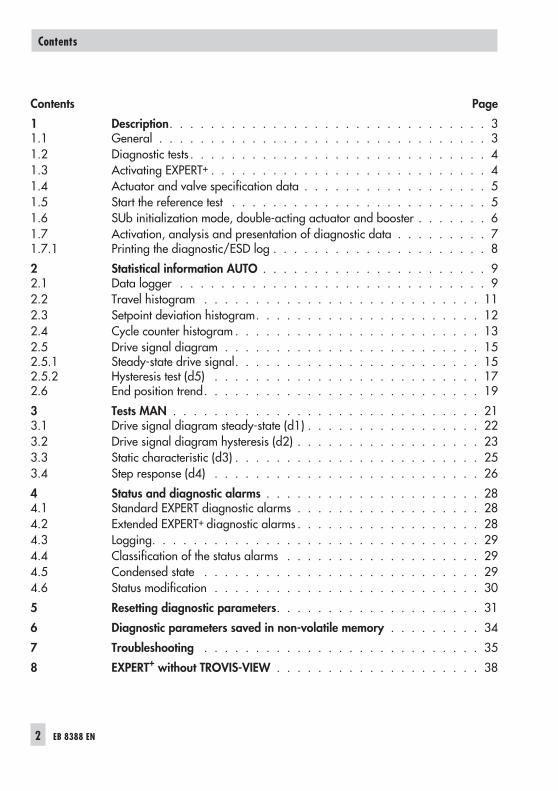
Contents Page
1 Description. . . . . . . . . . . . . . . . . . . . . . . . . . . . . . . 31.1 General . . . . . . . . . . . . . . . . . . . . . . . . . . . . . . . . 31.2 Diagnostic tests . . . . . . . . . . . . . . . . . . . . . . . . . . . . . 41.3 Activating EXPERT+ . . . . . . . . . . . . . . . . . . . . . . . . . . . 41.4 Actuator and valve specification data . . . . . . . . . . . . . . . . . . 51.5 Start the reference test . . . . . . . . . . . . . . . . . . . . . . . . . 51.6 SUb initialization mode, double-acting actuator and booster . . . . . . . 61.7 Activation, analysis and presentation of diagnostic data . . . . . . . . . 71.7.1 Printing the diagnostic/ESD log . . . . . . . . . . . . . . . . . . . . . 8
2 Statistical information AUTO . . . . . . . . . . . . . . . . . . . . . . 92.1 Data logger . . . . . . . . . . . . . . . . . . . . . . . . . . . . . . 92.2 Travel histogram . . . . . . . . . . . . . . . . . . . . . . . . . . . 112.3 Setpoint deviation histogram. . . . . . . . . . . . . . . . . . . . . . 122.4 Cycle counter histogram . . . . . . . . . . . . . . . . . . . . . . . . 132.5 Drive signal diagram . . . . . . . . . . . . . . . . . . . . . . . . . 152.5.1 Steady-state drive signal. . . . . . . . . . . . . . . . . . . . . . . . 152.5.2 Hysteresis test (d5) . . . . . . . . . . . . . . . . . . . . . . . . . . 172.6 End position trend. . . . . . . . . . . . . . . . . . . . . . . . . . . 19
3 Tests MAN . . . . . . . . . . . . . . . . . . . . . . . . . . . . . . 213.1 Drive signal diagram steady-state (d1) . . . . . . . . . . . . . . . . . 223.2 Drive signal diagram hysteresis (d2) . . . . . . . . . . . . . . . . . . 233.3 Static characteristic (d3) . . . . . . . . . . . . . . . . . . . . . . . . 253.4 Step response (d4) . . . . . . . . . . . . . . . . . . . . . . . . . . 26
4 Status and diagnostic alarms . . . . . . . . . . . . . . . . . . . . . 284.1 Standard EXPERT diagnostic alarms . . . . . . . . . . . . . . . . . . 284.2 Extended EXPERT+ diagnostic alarms . . . . . . . . . . . . . . . . . . 284.3 Logging. . . . . . . . . . . . . . . . . . . . . . . . . . . . . . . . 294.4 Classification of the status alarms . . . . . . . . . . . . . . . . . . . 294.5 Condensed state . . . . . . . . . . . . . . . . . . . . . . . . . . . 294.6 Status modification . . . . . . . . . . . . . . . . . . . . . . . . . . 30
5 Resetting diagnostic parameters. . . . . . . . . . . . . . . . . . . . 31
6 Diagnostic parameters saved in non-volatile memory . . . . . . . . . 34
7 Troubleshooting . . . . . . . . . . . . . . . . . . . . . . . . . . . 35
8 EXPERT+ without TROVIS-VIEW . . . . . . . . . . . . . . . . . . . . 38
2 EB 8388 EN
Contents
1 Description
1.1 General
These instructions EB 8388 EN supplementthe standard mounting and operating in-structions of the positioners:
Type Standard EB
3730-2 EB 8384-2 EN
3730-3 EB 8384-3 EN
3730-4 EB 8384-4 EN
3730-5 EB 8384-5 EN
3731-3 EB 8387-3 EN
EXPERT+ is an optional diagnostic firmwareintegrated in the positioner which allows thepredictive, status-oriented maintenance ofpneumatic control valves. Refer to section1.3 on how to activate this option.
EXPERT+ upgrades the standard EXPERT di-agnostics firmware incorporated in thepositioner. The upgraded version providesextended functions to pinpoint valve param-eters that have worsened, allowing the userto plan predictive maintenance and servicework before malfunctions can affect the pro-cess, causing unscheduled plant shutdowns.
EXPERT+ records the valve faults in auto-matic mode while the process is runningand issues alarms on the required mainte-nance work. In addition, numerous tests canbe performed in manual mode to pinpointemerging faults.Owing to the numerous diagnostic tests,EXPERT+ is able to generate classified statusalarms on the state of the control valve.
The EXPERT+ diagnostics are completely in-tegrated in the positioner. Data required fordiagnostics are compiled automatically andthe test data are analyzed in automatic ormanual mode in the positioner itself. The re-sulting data are used to issue classified sta-tus alarms.
The diagnostics data, results and statusalarms are available over the DD (DeviceDescription). All the necessary referencegraphs are automatically plotted after thepositioner has been initialized and areavailable when required.
After performing the basic settings at thepositioner using the rotary pushbutton, theTROVIS-VIEW3 or DTM software allow theparameters to be viewed and setconveniently.
Type Integration
3730-2 TROVIS-VIEW3
373x-3 TROVIS-VIEW3, DD, DTM
3730-4 TROVIS-VIEW3, DD, DTM
3730-5 TROVIS-VIEW3, DD
The following sections contain a descriptionon how to operate the diagnostics over theTROVIS-VIEW3 software.
Note!All the parameter settings that are changedover the operator interface must also bedownloaded onto the positioner to allowthem to become effective.
EB 8388 EN 3
Description
Note!The optional integrated solenoid valve isimplemented by a forced venting function inTypes 3731-x Positioners.
1.2 Diagnostic tests
There are two main groups of diagnostictests available.
Statistical information AUTO
These tests are performed while the processis running (automatic mode) without disrupt-ing the process.Activated tests are automatically performedwhen they are triggered by their start condi-tion (e.g. data logger and drive signal dia-gram hysteresis).Other tests are already performed in thebackground without being activated (e.g.histograms, cycle counter, drive signalsteady-state and end position trending).
Tests MAN
These tests should not be performed whilethe process is running (i.e. in manual modeinstead) as the positioner cannot follow thereference variable at the same time.The valve is moved to a certain position de-fined by the test settings and the valve maymove through its full range.
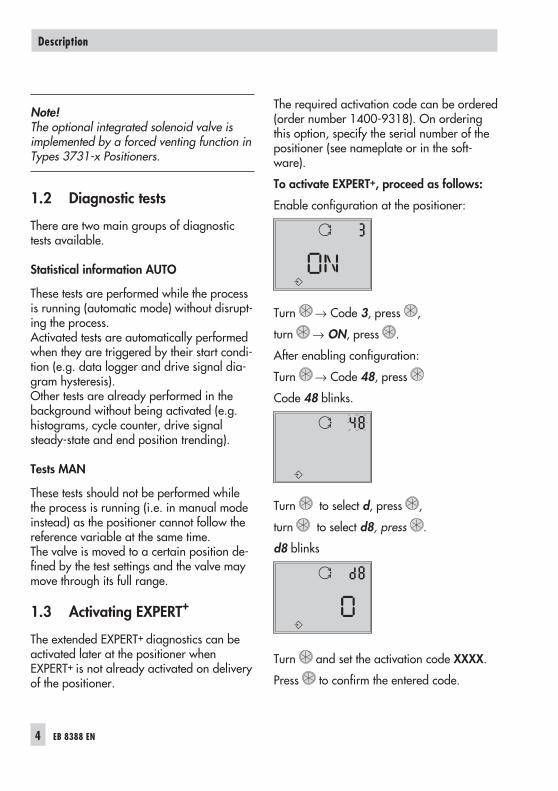
1.3 Activating EXPERT+
The extended EXPERT+ diagnostics can beactivated later at the positioner whenEXPERT+ is not already activated on deliveryof the positioner.
The required activation code can be ordered(order number 1400-9318). On orderingthis option, specify the serial number of thepositioner (see nameplate or in the soft-ware).
To activate EXPERT+, proceed as follows:
Enable configuration at the positioner:
Turn → Code 3, press ,
turn → ON, press .
After enabling configuration:
Turn → Code 48, press
Code 48 blinks.
Turn to select d, press ,
turn to select d8, press .
d8 blinks
Turn and set the activation code XXXX.
Press to confirm the entered code.
4 EB 8388 EN
Description
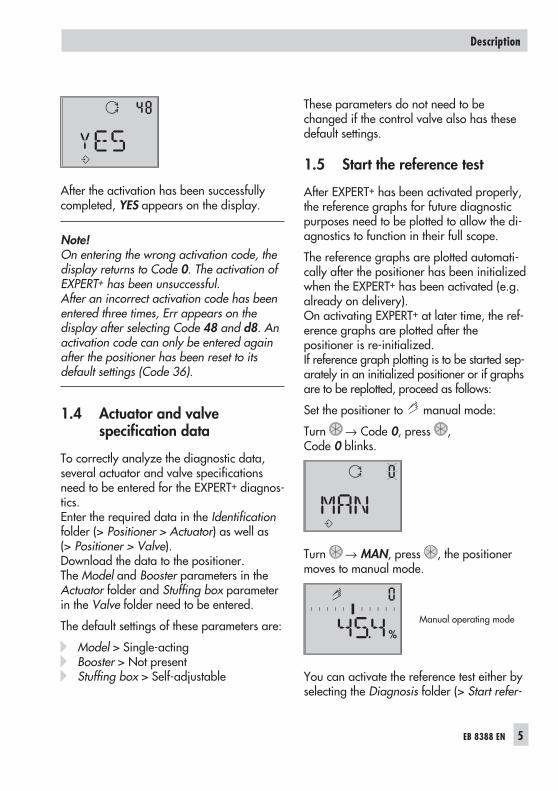
After the activation has been successfullycompleted, YES appears on the display.
Note!On entering the wrong activation code, thedisplay returns to Code 0. The activation ofEXPERT+ has been unsuccessful.After an incorrect activation code has beenentered three times, Err appears on thedisplay after selecting Code 48 and d8. Anactivation code can only be entered againafter the positioner has been reset to itsdefault settings (Code 36).
1.4 Actuator and valvespecification data
To correctly analyze the diagnostic data,several actuator and valve specificationsneed to be entered for the EXPERT+ diagnos-tics.Enter the required data in the Identificationfolder (> Positioner > Actuator) as well as(> Positioner > Valve).Download the data to the positioner.The Model and Booster parameters in theActuator folder and Stuffing box parameterin the Valve folder need to be entered.
The default settings of these parameters are:
� Model > Single-acting� Booster > Not present� Stuffing box > Self-adjustable
These parameters do not need to bechanged if the control valve also has thesedefault settings.
1.5 Start the reference test
After EXPERT+ has been activated properly,the reference graphs for future diagnosticpurposes need to be plotted to allow the di-agnostics to function in their full scope.
The reference graphs are plotted automati-cally after the positioner has been initializedwhen the EXPERT+ has been activated (e.g.already on delivery).On activating EXPERT+ at later time, the ref-erence graphs are plotted after thepositioner is re-initialized.If reference graph plotting is to be started sep-arately in an initialized positioner or if graphsare to be replotted, proceed as follows:
Set the positioner to manual mode:
Turn → Code 0, press ,Code 0 blinks.
Turn → MAN, press , the positionermoves to manual mode.
Manual operating mode
You can activate the reference test either byselecting the Diagnosis folder (> Start refer-
EB 8388 EN 5
Description
ence test) and right-click the parameter toselect Execute, or, alternatively, start the ref-erence test at the positioner itself by select-ing Code 48 as follows:
Enable configuration at the positioner:
Turn → Code 3,
turn → ON, press .
After enabling configuration:
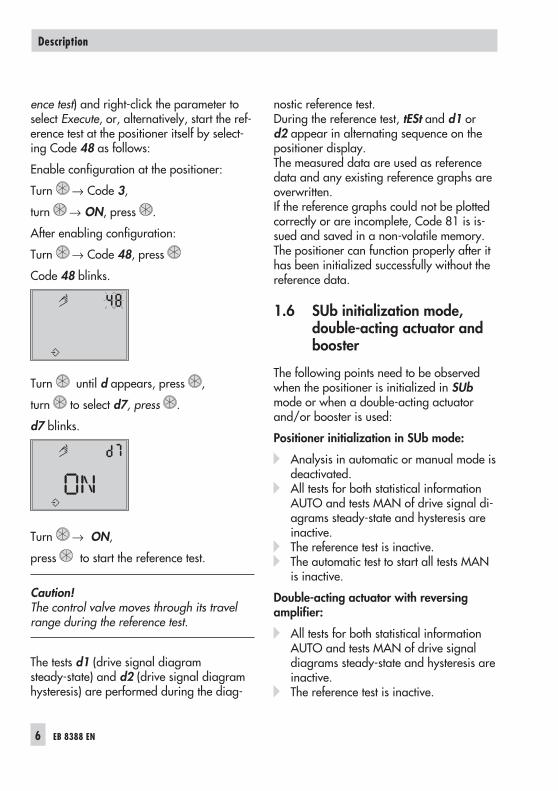
Turn → Code 48, press
Code 48 blinks.
Turn until d appears, press ,
turn to select d7, press .
d7 blinks.
Turn → ON,
press to start the reference test.
Caution!The control valve moves through its travelrange during the reference test.
The tests d1 (drive signal diagramsteady-state) and d2 (drive signal diagramhysteresis) are performed during the diag-
nostic reference test.During the reference test, tESt and d1 ord2 appear in alternating sequence on thepositioner display.The measured data are used as referencedata and any existing reference graphs areoverwritten.If the reference graphs could not be plottedcorrectly or are incomplete, Code 81 is is-sued and saved in a non-volatile memory.The positioner can function properly after ithas been initialized successfully without thereference data.
1.6 SUb initialization mode,double-acting actuator andbooster
The following points need to be observedwhen the positioner is initialized in SUbmode or when a double-acting actuatorand/or booster is used:
Positioner initialization in SUb mode:
� Analysis in automatic or manual mode isdeactivated.
� All tests for both statistical informationAUTO and tests MAN of drive signal di-agrams steady-state and hysteresis areinactive.
� The reference test is inactive.� The automatic test to start all tests MAN
is inactive.
Double-acting actuator with reversingamplifier:
� All tests for both statistical informationAUTO and tests MAN of drive signaldiagrams steady-state and hysteresis areinactive.
� The reference test is inactive.
6 EB 8388 EN
Description
Booster:
� The analysis of the tests for both statisti-cal information AUTO and tests MAN ofdrive signal diagrams is inactive.
1.7 Activation, analysis andpresentation of diagnosticdata
All diagnostic tests which do not compiledata automatically in the background (datalogger, drive signal diagram hysteresis)must be activated to start them.To start these tests, select the correspondingtest order (> Start data logger or Start test)and right-click the parameter to select Exe-cute to activate the test.
Note!The tests in statistical information AUTO inautomatic mode can only be activated whenthe positioner is in automatic operatingmode.
To activate the tests MAN in manual mode,the positioner must first be set to manualmode over Code 0.
Canceling diagnostic tests
There are two ways to cancel an active test:
� On the TROVIS-VIEW operator interface,select the corresponding folder (> Stoptest) to cancel the test. The positionerthen moves to the previously set operat-ing mode and to the travel value previ-ously set (manual mode) or returns to thereference variable (automatic mode).
� Press once to cancel the tests MANd1 (drive signal diagram steady-state)d2 (drive signal diagram hysteresis)d3 (static characteristic)d4 (step response),and the test in statistical informationAUTOd5 (drive signal diagram hysteresis)as well as the reference test overCode 48.
On canceling a test (d1 to d4), thepositioner moves to the fail-safe position.The positioner only goes into automaticmode on canceling test d5.The reference graphs must be plotted beforethe tests for drive signal diagramssteady-state and hysteresis in manual modecan be analyzed.
Note!The analysis of raw data in automatic modeis started after the positioner has been incontrolled operation for over one hour (afterinitialization).This does not apply to the end position trendtest and the dynamic stress factor in thecycle counter histogram as their analysisstarts directly after controlled operationbegins.
Alarms generated from the tests MAN aremarked TEST.If the electrical auxiliary power is too low,the test being performed is ended and thepositioner moves to the fail-safe position.Upon failure of the auxiliary power, tests intests MAN and statistical information AUTOmust be restarted due reasons of safety.
EB 8388 EN 7
Description
However, the test in statistical informationAUTO drive signal diagram hysteresis re-mains activated.In the event that the solenoid valve(Type 3730-x) is triggered or the forcedventing function (Type 3731-x) is activated,active tests are stopped and the positionermoves to the fail-safe position.
However, the test in statistical informationAUTO drive signal diagram hysteresis re-mains activated.In the event that the solenoid valve(Type 3730-x) is triggered or the forcedventing function (Type 3731-x) is activated,active tests are stopped and the positionermoves to the fail-safe position.
1.7.1 Printing the diagnostic/ESDlog
The Print command allows you to print out adiagnostic log of individual tests or the en-tire diagnosis.
The diagnostic log includes a title page anda list of all the data points including all theirvalues and properties.
The title page contains all key informationfor clear identification of the printed log (de-vice type, file name, time and date of cre-ation, time and date of the last change andTROVIS-VIEW version).
Select Print in the File menu to add furtherinformation.
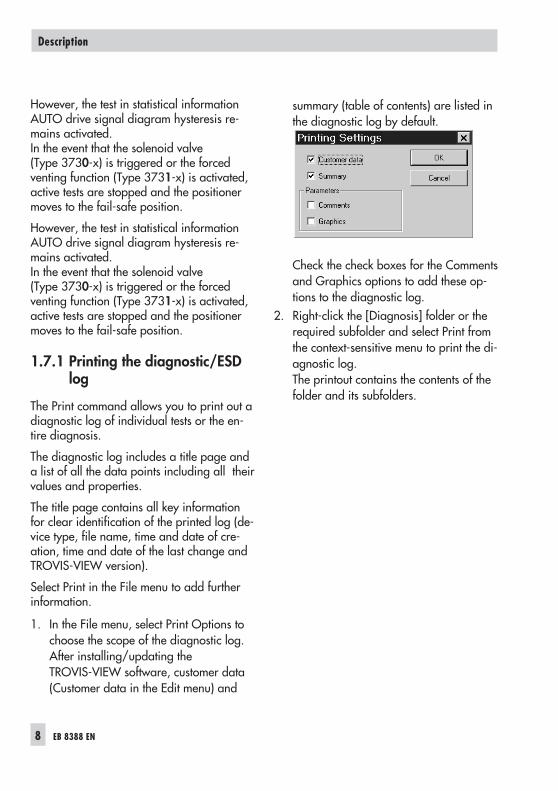
1. In the File menu, select Print Options tochoose the scope of the diagnostic log.After installing/updating theTROVIS-VIEW software, customer data(Customer data in the Edit menu) and
summary (table of contents) are listed inthe diagnostic log by default.
Check the check boxes for the Commentsand Graphics options to add these op-tions to the diagnostic log.
2. Right-click the [Diagnosis] folder or therequired subfolder and select Print fromthe context-sensitive menu to print the di-agnostic log.The printout contains the contents of thefolder and its subfolders.
8 EB 8388 EN
Description
2 Statistical information AUTO
The signals x, w and y need to be analyzedon a more precise basis to obtain advanceddiagnostic information also over the valve,actuator and pneumatic air supply. Thepositioner compiles raw data for this pur-pose.The signals are plotted, stored and analyzedwhile the process is running. In addition, anadditional underlayed hysteresis test detectsany changes in friction.The diagnostic tests do not have any affecton the positioner’s control performance.
2.1 Data logger
The data logger allows the reference vari-able w, controlled variable x in relation tothe working range, drive signal y andsetpoint deviation e to be plotted over time.The measured data are saved in an FIFOmemory with a capacity to save 100 datapoints in the positioner.In addition to the permanent plotting of
data, the plotting can be automatically trig-gered when a start condition is fulfilled. Thetravel condition (setpoint) or the optional in-tegrated solenoid valve (optional integratedforced venting) can be used to trigger thedata logger.The data logger is completely integrated intothe positioner.The software is only necessary for activationand to set the parameters.In addition, the measured data can beviewed as a graph or in a list by selectingUpload from Device in the Device menu orby clicking on the device toolbar.
Note! Upon disconnection of the auxiliarypower or upon changing the operatingmode, the test is inactive and must be reacti-vated.
Data logging
Select Data logger folder (> Selection) andselect Permanent or Trigger and set the Scanrate parameter. Right-click the Start data
EB 8388 EN 9
Statistical information AUTO
Fig. 2 · Statistical information AUTO
logger parameter and select Execute to startdata logging.
Permanent data logging
The variables w, x, y, and e are logged ac-cording to the adjusted scan rate and savedin the FIFO memory which always stores thelast 100 measured data points of each vari-able.
Triggered data logging
On selecting Trigger in the Selection param-eter, the data logger records the measureddata permanently in the background. A trig-gering event leads to the last 100 measureddata points being stored together with thepretrigger time and leads to the data log-ging of the triggering condition.The following parameters can be changedfor this function:
� Trigger status:Triggered by the travel condition(setpoint) and/or solenoid valve condi-tion (forced venting)
� Start value:Limit indicating from which travel condi-tion (setpoint) the data logger should betriggered
� Logging limit:Indicating whether data logging shouldstart when the travel condition (setpoint)exceeds or falls below the start value.
Travel condition (setpoint)
Note!The valve position is used as the travelcondition in positioners in ESD version.
Select Trigger status parameter and selectStart trigger via travel condition (setpoint).Activate data logging by selecting Start data
10 EB 8388 EN
Statistical information AUTO
Fig. 3 · Data logger
logger parameter and select Execute.The triggering event starts data loggingwhen the start value exceeds or falls belowan entered value.Enter the required value at which data log-ging should be triggered in relation to thesetpoint in the Start value parameter.Select whether data logging should startwhen the entered value exceeds or falls be-low the start value in the Logging limit pa-rameter.After being triggered, the variables w, x, yand e are logged at the adjusted scan rateand saved in the FIFO memory.Additionally, there is a pretrigger time avail-able to allow the variables to be stored thatwere logged before the triggered event.Enter the required pretrigger time byright-clicking the parameter and selectingModify. However, the pretrigger time en-tered may not be higher than the maximumpretrigger time determined by thepositioner. This maximum pretrigger time isshown in the Max. pretrigger time parame-ter. The data logging finishes automaticallyas soon as the maximum memory capacityof 100 measured data points for each vari-able including the pretrigger time isreached.
Solenoid valve condition (forced venting)
Select Trigger status parameter and selectStart via solenoid valve condition (forcedventing). Activate data logging by selectingStart data logger parameter and select Exe-cute to start data logging as soon as the in-tegrated solenoid valve is triggered or theforced venting function is activated.Similar to the travel condition (setpoint), thevariables w, x, e and y are logged at theadjusted scan rate and saved in the FIFO
memory on triggering.Additionally, there is a pretrigger time avail-able to allow the variables to be stored thatwere logged before the triggered event.Enter the required pretrigger time byright-clicking the parameter and selectingModify. However, the pretrigger time en-tered may not be higher than the maximumpretrigger time determined by thepositioner. The data logging finishes auto-matically as soon as the maximum memorycapacity of 100 measured data points foreach variable including the pretrigger timeis reached.
Travel (setpoint) or solenoid valve condition(forced venting)
Select Trigger status parameter and selectStart via travel (setpoint)/solenoid valvecondition (forced venting). Activate datalogging by selecting Start data logger pa-rameter and select Execute. The triggeringevent starts data logging when the valvetravel (setpoint)/solenoid valve conditions(forced venting) are met.The measured data are plotted over time ingraphs. In addition, the compiled measureddata are stored in the Measured valuesfolder (see Fig. 3).
2.2 Travel histogram
The valve travel histogram is a statisticalanalysis of the plotted valve travel.The histogram provides information, for ex-ample, about where the valve mainly worksduring its service life and whether it shows arecent trend concerning changes in its work-ing range.The valve travel is recorded and assigned tovalve travel classes. The distribution showing
EB 8388 EN 11
Statistical information AUTO
how often the valve travel remains within aclass is shown in per cent. The result is pre-sented as a bar graph.
The Travel histogram folder containslong-term data, i.e. measured data are up-dated cyclically (scan rate 1 s) over the en-tire positioner service life and stored every24 hours in the positioner’s non-volatilememory for long-term monitoring.The Number of measurement values param-eter shows the total amount of classifiedmeasured data points previously recorded.The Average value x long parameter con-tains the class in which the travel remainedon average the most.In order to be able to recognize anyshort-term changes in valve travel properly,the last 100 measured data points arestored at a scan rate (default: 1 s) in anon-volatile memory. The scan rate can bechanged in the Scan rate short time param-
eter. On changing the scan rate, old data inthe short-term histogram are deleted.
The Average values x short parameter con-tains the average class assignment for thelast 100 measured data points stored in thenon-volatile memory.Data can be reset in the Status messagesfolder.
2.3 Setpoint deviation histogram
The setpoint deviation histogram contains astatistical analysis of any setpoint deviationsrecorded. This provides a summary of howoften and to which level a setpoint deviationhas occurred during the positioner servicelife and whether it shows a recent trend con-cerning the setpoint deviation.The setpoint deviation is recorded and as-signed to predetermined level classes. Thepercentages showing how often the setpointdeviation remains within a class is presented
12 EB 8388 EN
Statistical information AUTO
Fig. 4 · Travel histogram
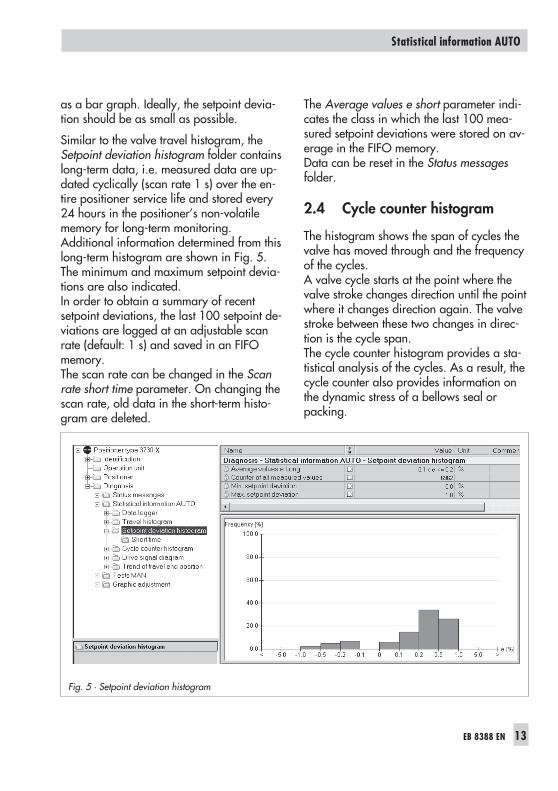
as a bar graph. Ideally, the setpoint devia-tion should be as small as possible.
Similar to the valve travel histogram, theSetpoint deviation histogram folder containslong-term data, i.e. measured data are up-dated cyclically (scan rate 1 s) over the en-tire positioner service life and stored every24 hours in the positioner’s non-volatilememory for long-term monitoring.Additional information determined from thislong-term histogram are shown in Fig. 5.The minimum and maximum setpoint devia-tions are also indicated.In order to obtain a summary of recentsetpoint deviations, the last 100 setpoint de-viations are logged at an adjustable scanrate (default: 1 s) and saved in an FIFOmemory.The scan rate can be changed in the Scanrate short time parameter. On changing thescan rate, old data in the short-term histo-gram are deleted.
The Average values e short parameter indi-cates the class in which the last 100 mea-sured setpoint deviations were stored on av-erage in the FIFO memory.Data can be reset in the Status messagesfolder.
2.4 Cycle counter histogram
The histogram shows the span of cycles thevalve has moved through and the frequencyof the cycles.A valve cycle starts at the point where thevalve stroke changes direction until the pointwhere it changes direction again. The valvestroke between these two changes in direc-tion is the cycle span.The cycle counter histogram provides a sta-tistical analysis of the cycles. As a result, thecycle counter also provides information onthe dynamic stress of a bellows seal orpacking.
EB 8388 EN 13
Statistical information AUTO
Fig. 5 · Setpoint deviation histogram
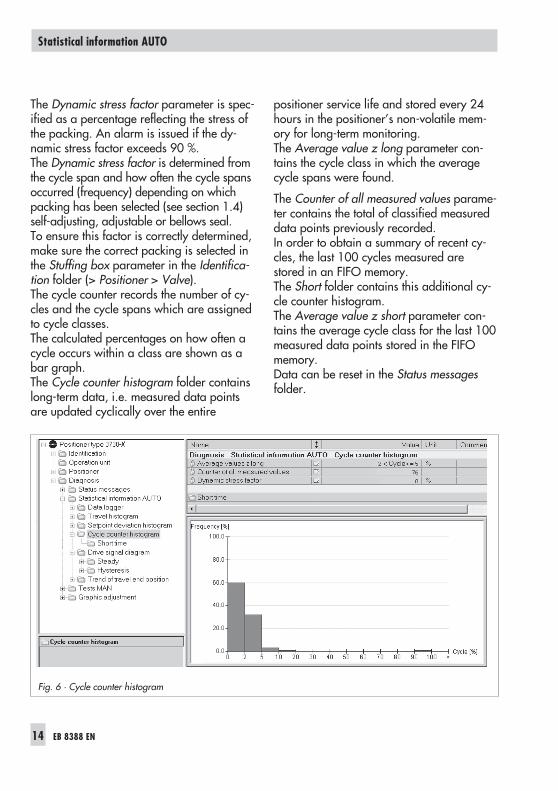
The Dynamic stress factor parameter is spec-ified as a percentage reflecting the stress ofthe packing. An alarm is issued if the dy-namic stress factor exceeds 90 %.The Dynamic stress factor is determined fromthe cycle span and how often the cycle spansoccurred (frequency) depending on whichpacking has been selected (see section 1.4)self-adjusting, adjustable or bellows seal.To ensure this factor is correctly determined,make sure the correct packing is selected inthe Stuffing box parameter in the Identifica-tion folder (> Positioner > Valve).The cycle counter records the number of cy-cles and the cycle spans which are assignedto cycle classes.The calculated percentages on how often acycle occurs within a class are shown as abar graph.The Cycle counter histogram folder containslong-term data, i.e. measured data pointsare updated cyclically over the entire
positioner service life and stored every 24hours in the positioner’s non-volatile mem-ory for long-term monitoring.The Average value z long parameter con-tains the cycle class in which the averagecycle spans were found.
The Counter of all measured values parame-ter contains the total of classified measureddata points previously recorded.In order to obtain a summary of recent cy-cles, the last 100 cycles measured arestored in an FIFO memory.The Short folder contains this additional cy-cle counter histogram.The Average value z short parameter con-tains the average cycle class for the last 100measured data points stored in the FIFOmemory.Data can be reset in the Status messagesfolder.
14 EB 8388 EN
Statistical information AUTO
Fig. 6 · Cycle counter histogram
2.5 Drive signal diagram
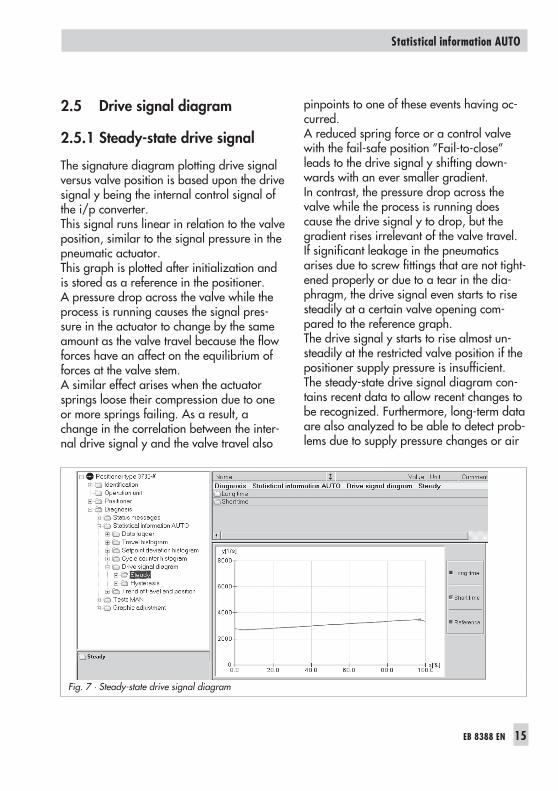
2.5.1 Steady-state drive signal
The signature diagram plotting drive signalversus valve position is based upon the drivesignal y being the internal control signal ofthe i/p converter.This signal runs linear in relation to the valveposition, similar to the signal pressure in thepneumatic actuator.This graph is plotted after initialization andis stored as a reference in the positioner.A pressure drop across the valve while theprocess is running causes the signal pres-sure in the actuator to change by the sameamount as the valve travel because the flowforces have an affect on the equilibrium offorces at the valve stem.A similar effect arises when the actuatorsprings loose their compression due to oneor more springs failing. As a result, achange in the correlation between the inter-nal drive signal y and the valve travel also
pinpoints to one of these events having oc-curred.A reduced spring force or a control valvewith the fail-safe position ”Fail-to-close”leads to the drive signal y shifting down-wards with an ever smaller gradient.In contrast, the pressure drop across thevalve while the process is running doescause the drive signal y to drop, but thegradient rises irrelevant of the valve travel.If significant leakage in the pneumaticsarises due to screw fittings that are not tight-ened properly or due to a tear in the dia-phragm, the drive signal even starts to risesteadily at a certain valve opening com-pared to the reference graph.The drive signal y starts to rise almost un-steadily at the restricted valve position if thepositioner supply pressure is insufficient.The steady-state drive signal diagram con-tains recent data to allow recent changes tobe recognized. Furthermore, long-term dataare also analyzed to be able to detect prob-lems due to supply pressure changes or air
EB 8388 EN 15
Statistical information AUTO
Fig. 7 · Steady-state drive signal diagram
leaks in the pneumatics before they have animpact on the process.The measured data allows the followingproblems to be detected and the associatedalarms to be issued:
� Air leakage in the pneumatics� Spring force reduced� Changes in supply pressure
The valve position and its associated drivesignal y are measured after the pressureconditions have settled (steady-state). Eachpair of measured data points recorded isassigned to a valve position class. Theaverage drive signal y is calculated for eachclass. The stored data can be read.
The reference data required are plotted andstored after initialization.
Long-term monitoring
The long-term monitoring involves the aver-age drive signal y for each valve positionclass being determined from all measureddata points per valve position class.The Long-term folder contains a table of thevalve position classes with the associatedaverage drive signal y.
Short-term monitoring
The short-term monitoring involves the aver-age drive signal y determined from the lastmeasured data points per valve positionclass. This allows short-term changes in ac-tuator pressure to be pinpointed at variousvalve positions.The Differential drive signal and Valve posi-tions folders contain a table of the last tenmeasured data points.
Graphs
The Steady-state folder contains a commongraph for long-term, short-term and refer-ence data. The graph plotted using the ref-erence data covers the full range of thevalve.The data for long-term and short-term moni-toring are recorded online while the processis running, and therefore, the graphs do notnecessarily cover the full range of the valve.Reference values are used in cases where nodata could be compiled for valve positions xas the valve did not move to those positionsor a steady-state could not be reached.The diagram allows changes in drive signaly at the corresponding valve positions to beeasily recognized. Changes in pressure arealso evident as the drive signal y is propor-tional to the actuator pressure.Data can be reset in the Status messagesfolder.
Test requirements:A successfully plotted reference graph isnecessary to record and analyze the data.Refer to section 1.6 in case a double-actingactuator with reversing amplifier or abooster is used or SUb initialization mode isset.
Note!The valve can be moved through its travelrange in manual mode, during plant shut-down or when the process allows it by se-lecting Drive signal diagram steady in TestMAN to check the results or statements de-termined in automatic mode in the Statusmessage folder (> Extended).
16 EB 8388 EN
Statistical information AUTO
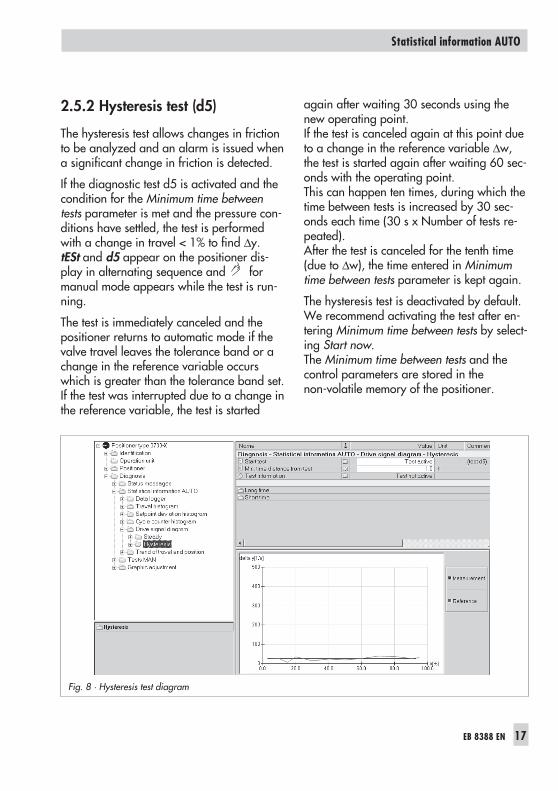
2.5.2 Hysteresis test (d5)
The hysteresis test allows changes in frictionto be analyzed and an alarm is issued whena significant change in friction is detected.
If the diagnostic test d5 is activated and thecondition for the Minimum time betweentests parameter is met and the pressure con-ditions have settled, the test is performedwith a change in travel < 1% to find ∆y.tESt and d5 appear on the positioner dis-play in alternating sequence and formanual mode appears while the test is run-ning.
The test is immediately canceled and thepositioner returns to automatic mode if thevalve travel leaves the tolerance band or achange in the reference variable occurswhich is greater than the tolerance band set.If the test was interrupted due to a change inthe reference variable, the test is started
again after waiting 30 seconds using thenew operating point.If the test is canceled again at this point dueto a change in the reference variable ∆w,the test is started again after waiting 60 sec-onds with the operating point.This can happen ten times, during which thetime between tests is increased by 30 sec-onds each time (30 s x Number of tests re-peated).After the test is canceled for the tenth time(due to ∆w), the time entered in Minimumtime between tests parameter is kept again.
The hysteresis test is deactivated by default.We recommend activating the test after en-tering Minimum time between tests by select-ing Start now.The Minimum time between tests and thecontrol parameters are stored in thenon-volatile memory of the positioner.
EB 8388 EN 17
Statistical information AUTO
Fig. 8 · Hysteresis test diagram
Long-term monitoring
The measured results ∆y are classified ac-cording to the valve position x in the valveposition classes. The average value ∆y pervalve position class is determined from allthe measured data.The Long-term folder contains a table of theresults.
Short-term monitoring
To provide a short-term trend, the last tenvalve positions x and the associated ∆y val-ues are saved in the Short-term folder(> Valve position and Difference signaldrive).
Graphs
The Hysteresis folder contains a graph withtwo curves plotted. The Measurement curveshows the measured data recorded forlong-term monitoring and the Referencecurve shows the reference data recorded af-ter initialization.The graph plotted using the reference datacovers the full range of the valve.The data for long-term monitoring are re-corded online while the process is running,and therefore, the graphs do not necessarilycover the full range of the valve.Reference values are used in cases where nodata could be compiled for valve classes.If the test has not yet been activated, thegraph for the reference data is representedby a straight line.
The diagram allows changes in ∆y with thecorresponding valve positions to berecognized.Changes in friction are highlighted as ∆y isproportional to the actuator pressure which,in turn, is a measurement for friction. A
change in friction leads to an alarm beingissued.
Test requirements:The test is possible in relation to the travelrange between 2 and 98 %.
� A successfully plotted reference graph isnecessary in order to analyze the fric-tion.
� The test can only be started when the tol-erance band (Code 19) or Positionerfolder (> Error control > Tolerance band)is greater than 1 %.
� The characteristic type (Code 20) mustbe set to Linear in order to record thedata.
� Refer to section 1.6 in case a double-act-ing actuator with reversing amplifier or abooster is used or the SUb initializationmode is set.
Note!The valve can be moved through its travelrange in manual mode, during plantshutdown or when the process allows it byselecting Drive signal diagram hysteresis inTest MAN to check the results or statementsdetermined in automatic mode in the Statusmessage folder (> Extended).
18 EB 8388 EN
Statistical information AUTO
The following parameters are changed dur-ing hysteresis test/d5 correspondingly:
� Lower x-range value (Code 8): 0 %� Upper x-range value (Code 9): 100 %� Lower/upper x-limit (Code 10/11): OFF� Setpoint cutoff w decrease/increase
(Code 14/15): OFF� Pressure limit (Code 16): Active pressure
limit is raised one stage higher� W-ramp OPEN/CLOSED (Code 21/22):
Variable
Data can be reset in the Status messagesfolder.
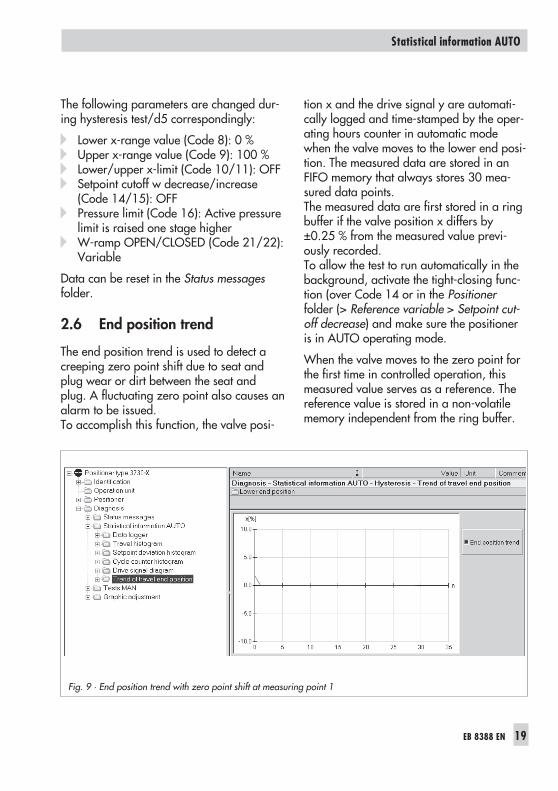
2.6 End position trend
The end position trend is used to detect acreeping zero point shift due to seat andplug wear or dirt between the seat andplug. A fluctuating zero point also causes analarm to be issued.To accomplish this function, the valve posi-
tion x and the drive signal y are automati-cally logged and time-stamped by the oper-ating hours counter in automatic modewhen the valve moves to the lower end posi-tion. The measured data are stored in anFIFO memory that always stores 30 mea-sured data points.The measured data are first stored in a ringbuffer if the valve position x differs by±0.25 % from the measured value previ-ously recorded.To allow the test to run automatically in thebackground, activate the tight-closing func-tion (over Code 14 or in the Positionerfolder (> Reference variable > Setpoint cut-off decrease) and make sure the positioneris in AUTO operating mode.
When the valve moves to the zero point forthe first time in controlled operation, thismeasured value serves as a reference. Thereference value is stored in a non-volatilememory independent from the ring buffer.
EB 8388 EN 19
Statistical information AUTO
Fig. 9 · End position trend with zero point shift at measuring point 1

An alarm is generated after a change inzero point or when a zero point shift outsideof the zero point limit is detected.Enter the zero point limit in the Positionerfolder (> Error control > Zero point limit) orover Code 48 in the positioner, selecting d5(default setting 5 %).
Note!The valve end position is also logged whenthe valve moves to the fail-safe position overthe forced venting option and with anactuator with AIR TO OPEN.
Graph versions
Select Trend of valve end position folder toview a graph of the recorded end positions.The reference value is represented by astraight line in the graph.The graph highlights a trend and a changein the end position.
The Lower end position folder contains atable of the measured data (valve position x,drive signal y) with time stamp.Data and the reference value can be reset inthe Status messages (> Reset) folder.
20 EB 8388 EN
Statistical information AUTO
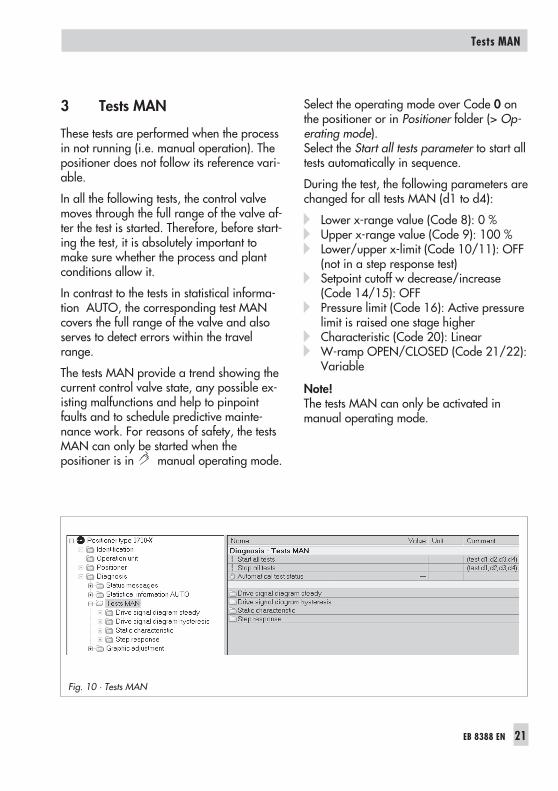
3 Tests MAN
These tests are performed when the processin not running (i.e. manual operation). Thepositioner does not follow its reference vari-able.
In all the following tests, the control valvemoves through the full range of the valve af-ter the test is started. Therefore, before start-ing the test, it is absolutely important tomake sure whether the process and plantconditions allow it.
In contrast to the tests in statistical informa-tion AUTO, the corresponding test MANcovers the full range of the valve and alsoserves to detect errors within the travelrange.
The tests MAN provide a trend showing thecurrent control valve state, any possible ex-isting malfunctions and help to pinpointfaults and to schedule predictive mainte-nance work. For reasons of safety, the testsMAN can only be started when thepositioner is in manual operating mode.
Select the operating mode over Code 0 onthe positioner or in Positioner folder (> Op-erating mode).Select the Start all tests parameter to start alltests automatically in sequence.
During the test, the following parameters arechanged for all tests MAN (d1 to d4):
� Lower x-range value (Code 8): 0 %� Upper x-range value (Code 9): 100 %� Lower/upper x-limit (Code 10/11): OFF
(not in a step response test)� Setpoint cutoff w decrease/increase
(Code 14/15): OFF� Pressure limit (Code 16): Active pressure
limit is raised one stage higher� Characteristic (Code 20): Linear� W-ramp OPEN/CLOSED (Code 21/22):
Variable
Note!The tests MAN can only be activated inmanual operating mode.
EB 8388 EN 21
Tests MAN
Fig. 10 · Tests MAN
3.1 Drive signal diagramsteady-state (d1)
As described in detail in section 2.5 on thedrive signal diagram, the drive signal y plot-ted versus valve position x allows the follow-ing changes at the control valve to be recog-nized (and an alarm issued):
� Air leakage in the pneumatics� Spring force reduced� Changes in the supply pressure
This test (tESt d1) causes the valve to movethrough the travel range to allow the resultsand alarms issued in automatic mode to beaccurately checked.After starting the test, the valve is moved tovarious fixed valve positions x distributedover the full range of the valve.
The drive signal y is measured for eachvalve position x and stored in the positionermemory. The necessary data set for the ref-erence graph is automatically plotted andstored directly after initialization. The starttime for the reference graph is stored with areference time stamp in the positioner’snon-volatile memory.Any further measurement is stored as a re-peated measurement. Previously recordedrepeated measurements stored in thepositioner are overwritten. However, notethat you can upload previous repeated mea-surements to a PC before starting a new test.While the test is active, d1 and tESt appearon the positioner display in alternating se-quence and indicates manual operatingmode.
22 EB 8388 EN
Tests MAN
Fig. 11 · Drive signal diagram steady-state
Viewing the recorded parameters:
The Drive signal diagram steady-state foldercontains the reference and repeated mea-surements plotted in a graph.The individual measured points are saved inthe corresponding subfolders:> Reference valve position> Reference drive signal> Repetition value of valve position> Repetition value of drive signal.
Test requirements:
� A successfully plotted reference graphand repetition lines are necessary in or-der to analyze the data.If a reference graph still has not beenplotted on starting the test, this test isadopted as the reference.
� Refer to section 1.6 in case a double-act-ing actuator with reversing amplifier or abooster is used or SUb initializationmode is set.
3.2 Drive signal diagramhysteresis (d2)
Similar to the corresponding test in auto-matic mode, this test (tESt d2) is used to an-alyze the change in friction forces.However, unlike the test in automatic mode,this test causes the valve to move to definedvalve positions over the full range of thevalve, and determines ∆y for each valve po-sition.The valve is made to move to fixed nodes ofthe valve position x and the valve position isramped up (< 1 %) correspondingly.The drive signal y and the change in valveopening are analyzed during this test phaseconcerning changes in ∆y for changes in di-rection, to precisely check the results oralarms issued in automatic mode.
To enable a test, the tolerance band (Code19 or in Positioner folder (> Error control)must be greater than 1 % (default: 5 %).
If the valve cannot move to a certain valveposition node or the setpoint leaves the tol-erance band during the test, an alarm isgenerated in Test information and the test iscanceled.The necessary data set for the referencegraph is automatically plotted and stored di-rectly after initialization. The start time forthe reference graph is stored with a refer-ence time stamp in the non-volatile memoryof the positioner.Any further measurement is stored as a re-peated measurement. Previously recordedrepeated measurements stored in thepositioner are overwritten. However, youcan upload previous repeated measure-ments to a PC before you start a new test.
EB 8388 EN 23
Tests MAN
While the test is active, d2 and tESt appearon the positioner display in alternating se-quence. indicates manual operatingmode.
Viewing the recorded parameters:
The Drive signal diagram hysteresis foldercontains a graph with referencemeasurements and the last measurementperformed plotting the change in drive sig-nal ∆y versus the valve position x. The Refer-ence valve position subfolder contains a listof the valve positions that the valve movedto.The recorded ∆y are saved in the corre-sponding subfolders:> Reference hysteresis> Repetition value of hysteresis.
Test requirements:
� A successfully plotted reference graphand repeated measurements are neces-sary in order to analyze the data.If a reference graph still has not beenplotted on starting the test, this test isadopted as the reference.
� Refer to section 1.6 in case a double-act-ing actuator with reversing amplifier or abooster is used or the SUb initializationmode is set.
24 EB 8388 EN
Tests MAN
Fig 12 · Drive signal diagram hysteresis
3.3 Static characteristic (d3)
The static performance of the control valve isaffected by the friction hysteresis and theelastic processes in the valve stem packing.The static characteristic is plotted to checkthe static performance. The analysis ofminimum, maximum and average deadband parameters allows the control loop tobe evaluated.To accomplish this, the reference variable wis commanded in small steps and the re-sponse of the controlled variable x is plottedafter waiting a predetermined period oftime.This test (tESt d3) allows the full range of thevalve to be recorded in manual mode.
It is also possible to define a test range byselecting the Start and End parameters. Theascendent and descendent are plotted withinthe test range.100 measured points are plotted at themaximum, i.e. max. 50 measured points areavailable for the ascendent and the descen-dent.The step height and the number of measur-ing points are determined automatically bythe adjusted test range. The dead zone isanalyzed by a step height smaller than0.2 %.The setpoint difference that causes a mini-mal change in the valve position x is termeddead band. It is recorded and analyzed inthe positioner for each step.
EB 8388 EN 25
Tests MAN
Fig. 13 · Static characteristic
Fig. 13 lists the settings and information pa-rameters.
While the test is active, d3 and tESt appearon the positioner display in alternating se-quence. indicates manual operatingmode.
Viewing the recorded parameters:
The Static characteristic folder contains agraph of the measured points, plotting thevalve position x versus the reference vari-able.The Measured values subfolder (>Valve po-sition x) and (> Reference variable w) con-tain a table of the individual correspondingmeasured points.
Data can be reset in the Status messagesfolder.
Test requirements:
� The starting point must be smaller thanthe final point.The dead band is analyzed if the stepheight is smaller than 0.2 %.
3.4 Step response (d4)
The dynamic valve performance can be ex-amined by recording the step responses.Usually, two steps in reference variable areperformed and the course of the valve posi-tion x and the drive signal y are plotted untila steady state is reached. This test is storedand analyzed in the positioner.The reference variable w, the setpoint devia-tion e and time t are also stored and ana-lyzed.The default setting is two steps with the firststep usually starting at a defined start valueand ending at a defined end value.After a certain delay, the second step is per-formed, starting at the end value of the firststep and ending at the defined start value ofthe first step.The data are automatically analyzed in thepositioner after the test is completed. Param-eters such as overshoot, dead time, T63,T98, rise time and settling time are deter-mined separately for each step.
Refer to Fig. 14 for the setting and informa-tion parameters.
The following analysis parameters are deter-mined separately for each step:
> Overshoot (relative to the step height) in %> Dead time> T63> T98> Rise time> Settling time.
While the test is active, d4 and tESt appearon the positioner display in alternating se-quence. indicates manual operatingmode.
26 EB 8388 EN
Tests MAN
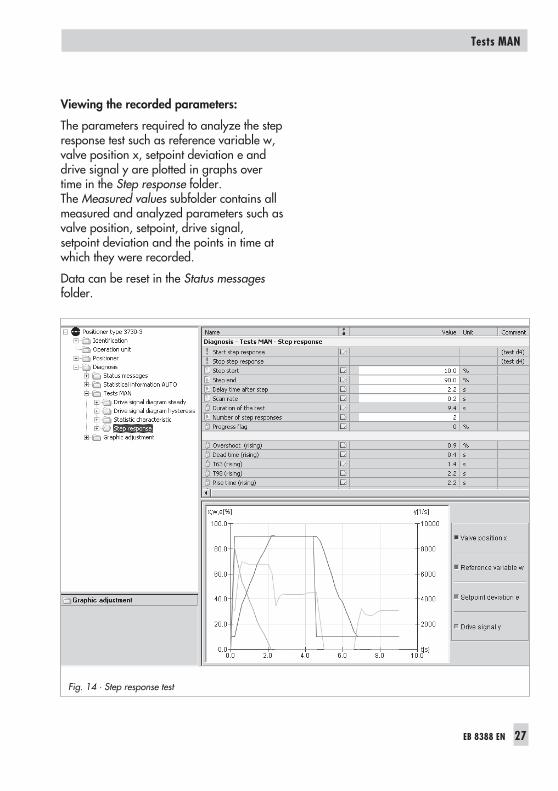
Viewing the recorded parameters:
The parameters required to analyze the stepresponse test such as reference variable w,valve position x, setpoint deviation e anddrive signal y are plotted in graphs overtime in the Step response folder.The Measured values subfolder contains allmeasured and analyzed parameters such asvalve position, setpoint, drive signal,setpoint deviation and the points in time atwhich they were recorded.
Data can be reset in the Status messagesfolder.
EB 8388 EN 27
Tests MAN
Fig. 14 · Step response test
4 Status and diagnostic alarms
4.1 Standard EXPERT diagnosticalarms
The standard EXPERT diagnostics providesinformation about positioner states such asoperating hours counter, process monitor-ing, number of zero calibrations andinitializations, total valve travel, tempera-ture, initialization diagnostics, zero/controlloop errors, etc.
In addition, the standard EXPERT diagnosticsgenerates diagnostic and status alarmswhich allow faults to be pinpointed quicklywhen a fault occurs.The diagnostic and status alarms issued byEXPERT appear on the positioner displayand can also be viewed in TROVIS-VIEWsoftware in the Diagnosis folder (> Statusmessages).Alarms are classified in the following maingroups:
� Status� Operation� Hardware� Initialization� Data memory� Temperature
Further information on the positioner status(e.g. limit switches, tight-closing function)and the parameters (e.g. characteristics) aredisplayed in the Positioner folder).
The following folders contain particularly in-formative data for valve diagnostics:
� Positioner folder (process data)Information on the current process vari-ables, condensed status, operatingmode, limit switch, temperature.
The Trend Viewer function (activate TrendViewer in the View menu) allows processvariables to be shown in one or moregraphs.To proceed, drag and drop the requiredprocess variable into the graph.
� Positioner folder (> Error control)Information on total travel with a freelydefined limit
� Positioner folder (> Start-up > Initializa-tion)List of initialization errors which can alsobe found in the Diagnosis folder (> Sta-tus messages).
4.2 Extended EXPERT+ diagnosticalarms
Further status alarms are generated from theextensive information gained in the diagnos-tic tests of EXPERT+ which provide the userwith information covering the whole controlvalve (see table below).
These status alarms can be viewed in the Di-agnosis folder (> Extended).An active diagnostic alarm issued byEXPERT+ appears on the positioner displayover Code 79.
28 EB 8388 EN
Status and diagnostic alarms
4.3 Logging
The last thirty alarms (EXPERT/ EXPERT+) arestored in the positioner with a time-stamp(logged by the operating hours counter).However, it is important to note that thesame alarm is only logged once when it firstoccurs.
The alarms stored can be viewed in the Log-ger folder.Entries can be reset in the Reset folder.
4.4 Classification of the statusalarms
Any event or alarm is assigned a status.The following states listed in the table beloware possible:
4.5 Condensed state
To provide a better overview, the state of thepositioner is summarized in a condensedstatus which is made up from a summary ofall classified positioner alarms.
Note!If an event is classified as “No message”,this event does not have any affect on thecondensed status of the positioner.
The condensed status is displayed in the en-gineering tool as well as on the positionerdisplay as in the table below.Furthermore, the condensed state is issuedat the fault alarm output. Refer to the mount-ing and operating instructions of thepositioner for further details.
EB 8388 EN 29
Status and diagnostic alarms
Individual status alarm Engineering toolTROVIS-VIEW/DTM
Inactive status_ok.ico
Active · “No message”classification status_on.ico
Active · “Maintenancerequired/Maintenancedemanded“ classification
status_main.ico
Active · “Functioncheck“ classification status_funct.ico
Active · “Maintenancealarm“ classification status_critic.ico
Status alarm Engineering toolTROVIS-VIEW/DTM
Devicedisplay
“Maintenancealarm” status_critic.ico
“Maintenancerequired/Maintenancedemanded
status_main.ico
“Functioncheck“ status_funct.ico Text
“Nomessage” status_ok.ico
4.6 Status modification
The classification of the status alarms can bechanged as required. The following assign-ment of the states are:
� Maintenance alarm� Maintenance required/Maintenance
demanded� No message possible
Select Positioner folder (> Error control >Status classification) to modify the classifica-tion of standard alarms issued by EXPERT.
Select Positioner folder (> Error control >Status classification > Extended) to modifythe classification of alarms issued byEXPERT+.
Note!All additional alarms generated by EXPERT+
have the status “No message” by default.
On resetting the positioner parameters totheir default settings (Code 36), the statusclassification is also reset to the default set-ting.
If modifications that have already beenmade should be kept, we recommenduploading them on a PC before performinga reset and then downloading them onto thepositioner again afterwards.
Note!In the Type 3730-5 Positioner (FoundationFieldbus), block error alarms as well as thecondensed states can be assigned to events .Refer to EB 8384-5 EN for furtherinstructions.
30 EB 8388 EN
Status and diagnostic alarms
5 Resetting diagnosticparameters
When an alarm is issued, the source of theerror should be first located and the errorremedied.In the case of an EXPERT alarm, we recom-mend reading the corresponding remedynotes listed in the error code list (refer to theOperating Instructions of the positioner).Remedy notes on EXPERT+ alarms are listedin the table in section 7.
EXPERT
Alarms generated by EXPERT which areindicated on the positioner display by an er-ror code can be confirmed by pressing the
rotary pushbutton after selecting the corre-sponding error code.Resetting error codes as well as resetting op-tions such as logging or the total valve travelcan be performed using an engineeringtool, for example, TROVIS-VIEW3 software.
EXPERT+
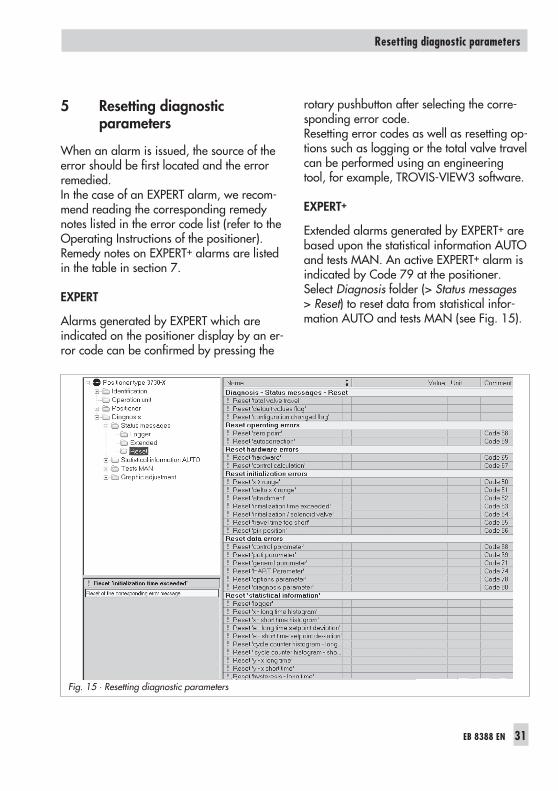
Extended alarms generated by EXPERT+ arebased upon the statistical information AUTOand tests MAN. An active EXPERT+ alarm isindicated by Code 79 at the positioner.Select Diagnosis folder (> Status messages> Reset) to reset data from statistical infor-mation AUTO and tests MAN (see Fig. 15).
EB 8388 EN 31
Resetting diagnostic parameters
Fig. 15 · Resetting diagnostic parameters
Note that the corresponding short-term his-togram/short-term monitoring is also reseton resetting long-term histogram/long-termmonitoring.
On performing the tests MAN, the measur-ing data of the last measurement as well asthe reference measurements (for d1 and d2)are stored in the positioner.On restarting a test MAN, the existing dataare updated by the repeated measurementdata.In addition, the repeated measurements ofthe tests MAN such as drive signal diagramsteady-state and drive signal diagram hys-teresis can be reset by selecting the Statusmessages folder (> Reset).
Note!Resetting the measured data does not causethe reference graphs to be reset:
� Drive signal diagram steady-state� Drive signal diagram hysteresis� Reference value for the end position
trend
However, the existing data set is replacedby the new reference data when the refer-ence graphs for steady-state and hysteresisgraphs (see section 1.5) are replotted.The data sets from already existing mea-surements of steady-state and hysteresisgraphs recorded in both statistical informa-tion AUTO and tests MAN are reset whenboth reference graphs are updated.
Initialization
After an initialization has been successfullycompleted, new reference measurements areautomatically plotted and the existing refer-
ence data are overwritten. The new refer-ence data and the optimized control param-eters cause the following statistical informa-tion AUTO and MAN tests to be reset:
� Drive signal diagram steady-state(AUTO and MAN tests)
� Drive signal diagram hysteresis(AUTO and MAN tests)
� Setpoint deviation histogram (long-termand short-term)
� End position trend
Resetting over Code 36 (EXPERT/EXPERT+)
Activate Code 36 or select Operation unitfolder (> Start with default settings) to resetthe positioner parameters to their defaultsettings (see code list in the mounting andoperating instructions of the positioner).
The following diagnostic functions ofEXPERT/EXPERT+ diagnostics are reset:
� Settings and activated statistical informa-tion AUTO and tests MAN in EXPERT+
� Status classification settings(EXPERT/EXPERT+)
� Operating hours counter: (> Deviceswitched on since initialization) and(> Device since initialization in controlloop) (EXPERT)
� Total valve travel (EXPERT)� All short-term histograms (EXPERT+)
Drive signal diagram steady-state anddiagram hysteresisStatistical information AUTO and testsMAN (EXPERT+)
� Static characteristic and step response(EXPERT+)
� End position trend (EXPERT+)
32 EB 8388 EN
Resetting diagnostic parameters
If the same status classification is to be usedin future, you can upload the settings onto aPC over, for example, the TROVIS-VIEWsoftware.
Mounting the positioner onto another con-trol valve
As the EXPERT+ extended diagnostics pro-vides statements about the entire controlvalve, the data from statistical informationAUTO and tests MAN need to be resetwhen the positioner is attached to a differentcontrol valve.After mounting the positioner on the newcontrol valve, perform a reset over Code 36and re-initialize the positioner. This leads tothe most of the diagnostic functions beingreset.We recommend additionally to manually re-set the long-term travel histogram and thelong-term cycle counter histogram as well asthe logging by selecting the Diagnosis folder(> Reset).
EB 8388 EN 33
Resetting diagnostic parameters
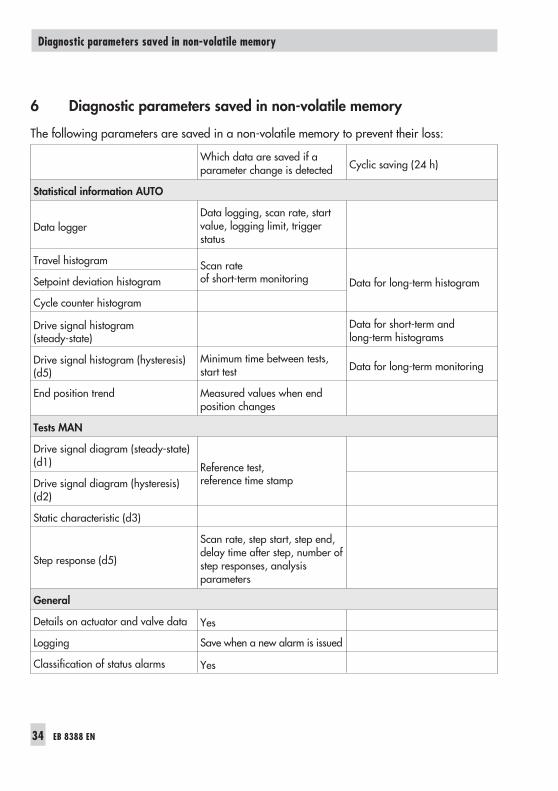
6 Diagnostic parameters saved in non-volatile memory
The following parameters are saved in a non-volatile memory to prevent their loss:
Which data are saved if aparameter change is detected Cyclic saving (24 h)
Statistical information AUTO
Data loggerData logging, scan rate, startvalue, logging limit, triggerstatus
Travel histogram Scan rateof short-term monitoring Data for long-term histogramSetpoint deviation histogram
Cycle counter histogram
Drive signal histogram(steady-state)
Data for short-term andlong-term histograms
Drive signal histogram (hysteresis)(d5)
Minimum time between tests,start test Data for long-term monitoring
End position trend Measured values when endposition changes
Tests MAN
Drive signal diagram (steady-state)(d1) Reference test,
reference time stampDrive signal diagram (hysteresis)(d2)
Static characteristic (d3)
Step response (d5)
Scan rate, step start, step end,delay time after step, number ofstep responses, analysisparameters
General
Details on actuator and valve data Yes
Logging Save when a new alarm is issued
Classification of status alarms Yes
34 EB 8388 EN
Diagnostic parameters saved in non-volatile memory
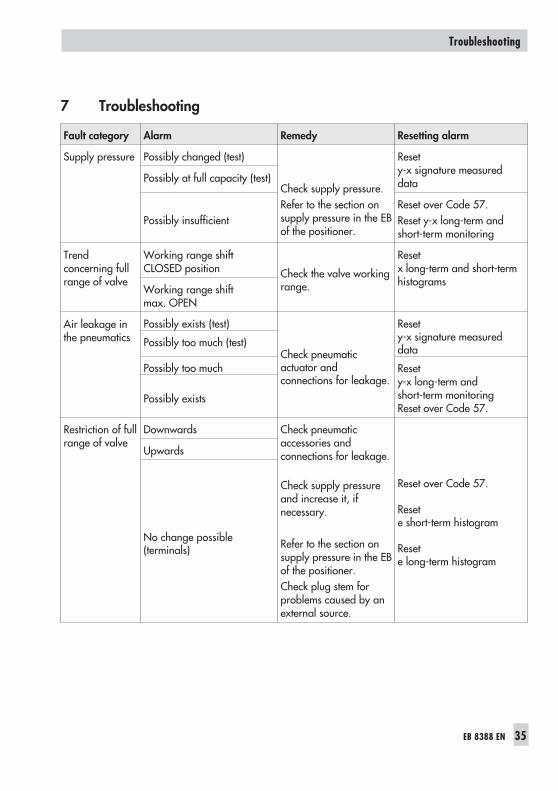
7 Troubleshooting
Fault category Alarm Remedy Resetting alarm
Supply pressure Possibly changed (test)
Check supply pressure.Refer to the section onsupply pressure in the EBof the positioner.
Resety-x signature measureddataPossibly at full capacity (test)
Possibly insufficientReset over Code 57.Reset y-x long-term andshort-term monitoring
Trendconcerning fullrange of valve
Working range shiftCLOSED position Check the valve working
range.
Resetx long-term and short-termhistograms
Working range shiftmax. OPEN
Air leakage inthe pneumatics
Possibly exists (test)
Check pneumaticactuator andconnections for leakage.
Resety-x signature measureddata
Possibly too much (test)
Possibly too much Resety-x long-term andshort-term monitoringReset over Code 57.
Possibly exists
Restriction of fullrange of valve
Downwards Check pneumaticaccessories andconnections for leakage.
Check supply pressureand increase it, ifnecessary.
Refer to the section onsupply pressure in the EBof the positioner.Check plug stem forproblems caused by anexternal source.
Reset over Code 57.
Resete short-term histogram
Resete long-term histogram
Upwards
No change possible(terminals)
EB 8388 EN 35
Troubleshooting
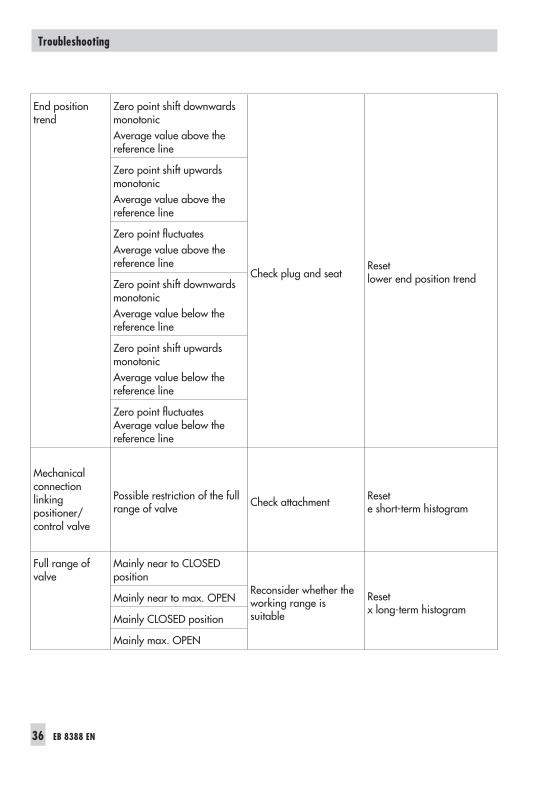
End positiontrend
Zero point shift downwardsmonotonicAverage value above thereference line
Check plug and seatResetlower end position trend
Zero point shift upwardsmonotonicAverage value above thereference line
Zero point fluctuatesAverage value above thereference line
Zero point shift downwardsmonotonicAverage value below thereference line
Zero point shift upwardsmonotonicAverage value below thereference line
Zero point fluctuatesAverage value below thereference line
Mechanicalconnectionlinkingpositioner/control valve
Possible restriction of the fullrange of valve Check attachment Reset
e short-term histogram
Full range ofvalve
Mainly near to CLOSEDposition
Reconsider whether theworking range issuitable
Resetx long-term histogram
Mainly near to max. OPEN
Mainly CLOSED position
Mainly max. OPEN
36 EB 8388 EN
Troubleshooting
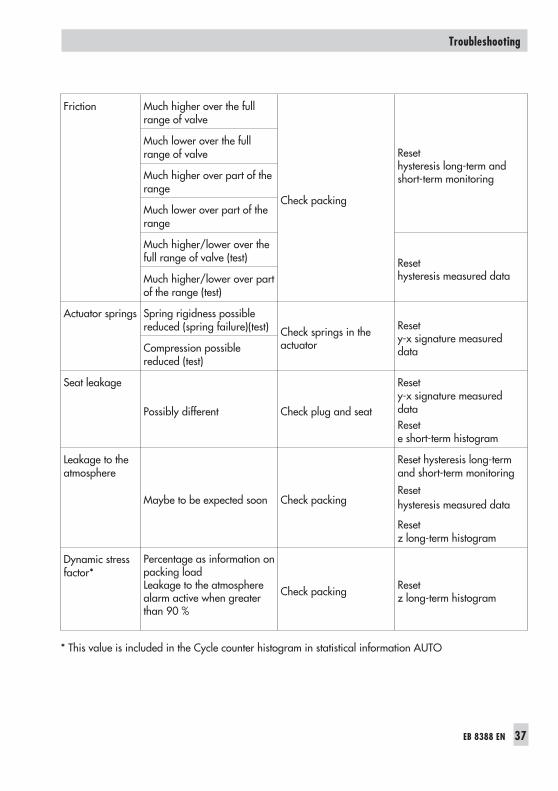
Friction Much higher over the fullrange of valve
Check packing
Resethysteresis long-term andshort-term monitoring
Much lower over the fullrange of valve
Much higher over part of therange
Much lower over part of therange
Much higher/lower over thefull range of valve (test) Reset
hysteresis measured dataMuch higher/lower over partof the range (test)
Actuator springs Spring rigidness possiblereduced (spring failure)(test) Check springs in the
actuator
Resety-x signature measureddataCompression possible
reduced (test)
Seat leakage
Possibly different Check plug and seat
Resety-x signature measureddataResete short-term histogram
Leakage to theatmosphere
Maybe to be expected soon Check packing
Reset hysteresis long-termand short-term monitoring
Resethysteresis measured data
Resetz long-term histogram
Dynamic stressfactor*
Percentage as information onpacking loadLeakage to the atmospherealarm active when greaterthan 90 %
Check packing Resetz long-term histogram
* This value is included in the Cycle counter histogram in statistical information AUTO
EB 8388 EN 37
Troubleshooting
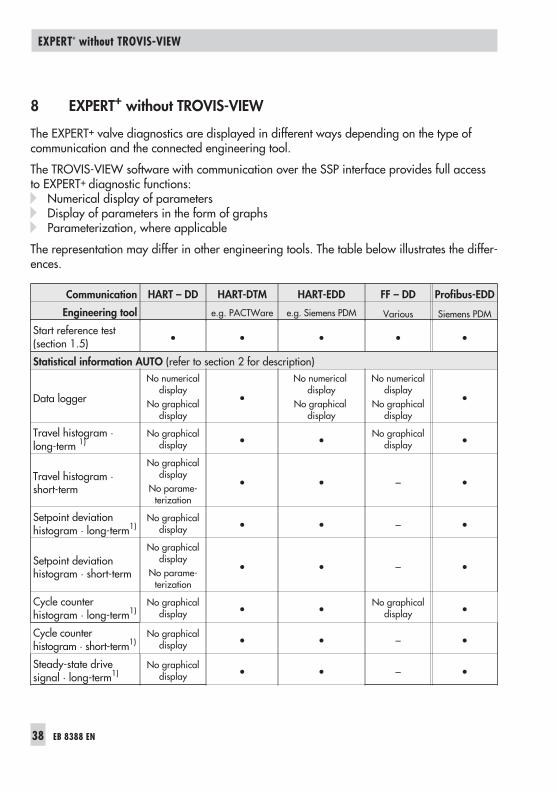
8 EXPERT+ without TROVIS-VIEW
The EXPERT+ valve diagnostics are displayed in different ways depending on the type ofcommunication and the connected engineering tool.
The TROVIS-VIEW software with communication over the SSP interface provides full accessto EXPERT+ diagnostic functions:� Numerical display of parameters� Display of parameters in the form of graphs� Parameterization, where applicable
The representation may differ in other engineering tools. The table below illustrates the differ-ences.
Communication HART – DD HART-DTM HART-EDD FF – DD Profibus-EDD
Engineering tool e.g. PACTWare e.g. Siemens PDM Various Siemens PDM
Start reference test(section 1.5) • • • • •
Statistical information AUTO (refer to section 2 for description)
Data logger
No numericaldisplay
No graphicaldisplay
•
No numericaldisplay
No graphicaldisplay
No numericaldisplay
No graphicaldisplay
•
Travel histogram ·long-term 1)
No graphicaldisplay • •
No graphicaldisplay •
Travel histogram ·short-term
No graphicaldisplay
No parame-terization
• • – •
Setpoint deviationhistogram · long-term1)
No graphicaldisplay • • – •
Setpoint deviationhistogram · short-term
No graphicaldisplay
No parame-terization
• • – •
Cycle counterhistogram · long-term1)
No graphicaldisplay • •
No graphicaldisplay •
Cycle counterhistogram · short-term1)
No graphicaldisplay • • – •
Steady-state drivesignal · long-term1)
No graphicaldisplay • • – •
38 EB 8388 EN
EXPERT+ without TROVIS-VIEW
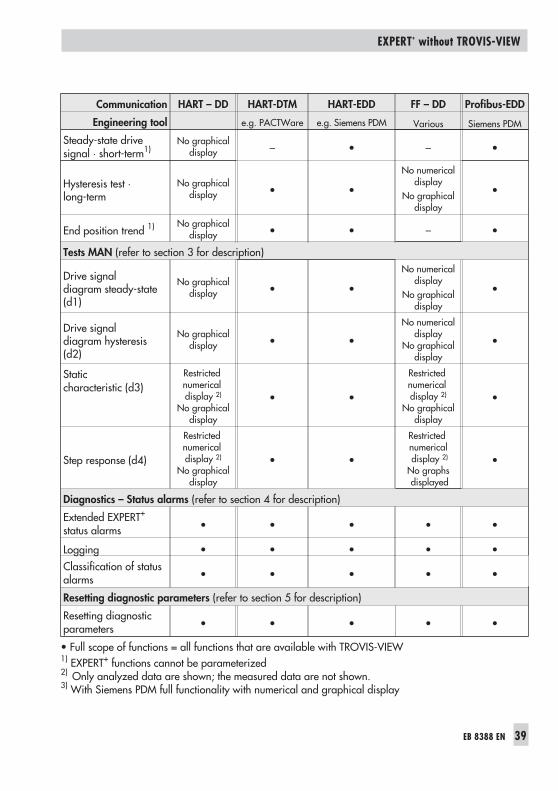
Communication HART – DD HART-DTM HART-EDD FF – DD Profibus-EDD
Engineering tool e.g. PACTWare e.g. Siemens PDM Various Siemens PDM
Steady-state drivesignal · short-term1)
No graphicaldisplay – • – •
Hysteresis test ·long-term
No graphicaldisplay • •
No numericaldisplay
No graphicaldisplay
•
End position trend 1) No graphicaldisplay • • – •
Tests MAN (refer to section 3 for description)
Drive signaldiagram steady-state(d1)
No graphicaldisplay • •
No numericaldisplay
No graphicaldisplay
•
Drive signaldiagram hysteresis(d2)
No graphicaldisplay • •
No numericaldisplay
No graphicaldisplay
•
Staticcharacteristic (d3)
Restrictednumericaldisplay 2)
No graphicaldisplay
• •
Restrictednumericaldisplay 2)
No graphicaldisplay
•
Step response (d4)
Restrictednumericaldisplay 2)
No graphicaldisplay
• •
Restrictednumericaldisplay 2)
No graphsdisplayed
•
Diagnostics – Status alarms (refer to section 4 for description)
Extended EXPERT+
status alarms • • • • •
Logging • • • • •Classification of statusalarms • • • • •
Resetting diagnostic parameters (refer to section 5 for description)
Resetting diagnosticparameters • • • • •
• Full scope of functions = all functions that are available with TROVIS-VIEW1) EXPERT+ functions cannot be parameterized2) Only analyzed data are shown; the measured data are not shown.3) With Siemens PDM full functionality with numerical and graphical display
EB 8388 EN 39
EXPERT+ without TROVIS-VIEW

SAMSON AG · MESS- UND REGELTECHNIKWeismüllerstraße 3 · 60314 Frankfurt am Main · GermanyPhone: +49 69 4009-0 · Fax: + 49 69 4009-1507Internet: http://www.samson.de EB 8388 EN S/
Z20
07-1
0