
Operating Budget Notes - TorontoOPERATING BUDGET NOTES Fleet Services ... the Alternate Service...
32
OPERATING BUDGET NOTES Fleet Services 2018 OPERATING BUDGET OVERVIEW Fleet Services provides responsive and efficient fleet management services to City Programs and Agencies to maximize safety and environmental sustainability and minimize lifecycle costs. 2018 Budget Summary The total cost to deliver these services to Toronto residents is $57.541 million gross and ($0.302) million net as shown below: The 2018 Operating Budget of $57.541 million gross is $3.334 or 6.2% million over the 2017 Approved Budget, primarily attributable to an increase in fleet maintenance costs and demand for fuel from client Programs which is fully offset by increased inter-divisional recoveries. The net expenditure reduction of $0.302 million is due to savings identified from implementing service efficiency strategies. CONTENTS Overview 1. 2018-2020 Service Overview and Plan 5 2. 2018 Preliminary Operating Budget by Service 13 3. Issues for Discussion 21 Appendices 1. 2017 Service Performance 26 2. 2018 Preliminary Operating Budget by Expenditure Category 26 3. 2018 Organization Chart 27 4. Summary of 2018 Service Changes 28 5. Summary of 2018 New / Enhanced Service Priorities N/A 6. Inflows/Outflows to/from Reserves & Reserve Funds 29 7. 2018 User Fee Rate Changes N/A CONTACTS Program: Lloyd Brierley General Manager Tel: (416) 392-1034 Email: [email protected] Corporate: Marie Barcellos Manager, Financial Planning Tel: (416) 392-8393 E-Mail: [email protected] $ % Gross Expenditures 54,207.2 57,541.2 3,334.0 6.2% Revenues 54,216.7 57,843.3 3,626.5 6.7% Net Expenditures (9.5) (302.1) (292.6) 3078.2% 2017 Budget 2018 Preliminary Budget Change (in $000's)
Transcript of Operating Budget Notes - TorontoOPERATING BUDGET NOTES Fleet Services ... the Alternate Service...
OPERATING BUDGET NOTES
Fleet Services 2018 OPERATING BUDGET OVERVIEW
Fleet Services provides responsive and efficient fleet management
services to City Programs and Agencies to maximize safety and
environmental sustainability and minimize lifecycle costs.
2018 Budget Summary
The total cost to deliver these services to Toronto residents is $57.541
million gross and ($0.302) million net as shown below:
The 2018 Operating Budget of $57.541 million gross is $3.334 or 6.2%
million over the 2017 Approved Budget, primarily attributable to an
increase in fleet maintenance costs and demand for fuel from client
Programs which is fully offset by increased inter-divisional recoveries.
The net expenditure reduction of $0.302 million is due to savings
identified from implementing service efficiency strategies.
CONTENTS
Overview
1. 2018-2020 Service Overview and Plan 5
2. 2018 Preliminary Operating Budget by Service 13
3. Issues for Discussion 21
Appendices
1. 2017 Service Performance 26
2. 2018 Preliminary Operating Budget by Expenditure Category 26
3. 2018 Organization Chart 27
4. Summary of 2018 Service Changes 28
5. Summary of 2018 New / Enhanced Service Priorities N/A
6. Inflows/Outflows to/from Reserves & Reserve Funds 29
7. 2018 User Fee Rate Changes N/A
CONTACTS
Program: Lloyd Brierley General Manager Tel: (416) 392-1034 Email: [email protected] Corporate: Marie Barcellos Manager, Financial Planning Tel: (416) 392-8393 E-Mail: [email protected]
$ %
Gross Expenditures 54,207.2 57,541.2 3,334.0 6.2%
Revenues 54,216.7 57,843.3 3,626.5 6.7%
Net Expenditures (9.5) (302.1) (292.6) 3078.2%
2017
Budget
2018
Preliminary
Budget
Change
(in $000's)

2018 Operating Budget Fleet Services
toronto.ca/budget2018 2
FAST FACTS
Manage 5,500 vehicles and equipment for City of
Toronto Divisions and Agencies.
Manage the fueling needs of over 7,100 assets
located throughout the City.
Distribute 15.5 million litres of fuel to City
Programs and Agencies.
Dispense fuel to the City's vehicles throughout 23
fuel sites across the City.
Manage the Capital replacement plan for all City
fleet, except TTC and Police.
Foster and continue to lead the City-wide Green
Fleet Plan that encompasses all City fleets,
including TTC, Police and Agencies.
Maintained a satisfactory Ontario Commercial
Vehicle Operators Registration (CVOR) safety
rating for the City's Fleet of 35% as of November
2017 (a lower number is better).
TRENDS
The average age of vehicles and equipment has
increased beyond the optimum lifecycle in some
classes. The average age is expected to
gradually decline starting 2018 to 7.50 years by
2020 as funding for fleet replacement increases.
Maintaining the optimum vehicle and equipment
age ensures safety and reduces the escalating
cost of repairs and maintenance.
KEY SERVICE DELIVERABLES FOR 2018
The 2018 Operating Budget will enable Fleet Services
to:
Provide a full‐range of fleet management services
for City Divisions and Agencies.
Direct the lifecycle management of the City's fleet
including the acquisition, maintenance and
disposal of vehicles and equipment based on
lifecycle and operational analysis.
Ensure compliance with Provincial legislation and
City policies and guidelines.
Provide safety training, testing and certification to
approximately 11,000 City employees who are
required to operate City vehicles and equipment.
Oversee and direct the City's fuel management
operations, including, safety and compliance
management, staff training and the associated
management of fueling stations and the fueling of
over 7,100 assets.
Work closely with client Programs to optimize fleet
size through ensuring that all vehicles are
required and fully utilized.
Provide leadership in reducing the environmental
impact of the City's fleet operations through the
City's 2014 ‐ 2018 Consolidated Green Fleet
Plan.
Provide permanent opportunities combined with a
multi-faceted approach that includes training and
apprentice programs; to attract, develop and
retain fully qualitied and knowledgeable staff.
Enhance service delivery by adopting leading
fleet practices, including Reliability-Centered
Maintenance practices to improve Preventative
Maintenance execution, and reduce downtime
and costs.
2015Actual
2016Actual
2017Proj
Actual
2018Target
2019Plan
2020Plan
Figures 8.10 8.01 8.40 8.10 7.80 7.50
7.07.27.47.67.88.08.28.48.6
Average Vehicle/Equipment Age (in years)

2018 Operating Budget Fleet Services
toronto.ca/budget2018 3
Where the money goes:
Where the money comes from:
OUR KEY ISSUES & PRIORITY ACTIONS
Cost & Financial Management
Capital reserve contribution shortfalls, vehicle reserve backlogs and associated impact of maintaining past-optimum life assets
Structure & Staffing
Significant challenges attracting and retaining fully qualified and knowledgeable staff due to an industry-wide shortage of skilled trades, combined with niche occupation requirements
Facilities
Aging and insufficient work space no longer meets the changing needs of today’s vehicles and equipment and best practice work methods
Operational and Business Processes
Fleet Management Information System (FMIS) data capture and data management needs improvement
Data driven – continue to improve foundational metrics, performance measures and management reports
Continue to improve service delivery through a reliability-centered maintenance approach to improve Preventative Maintenance execution (PM vs Non-PM repairs) and reduce downtime through a refocusing of internal resources
2018 OPERATING BUDGET HIGHLIGHTS
The 2018 Operating Budget of $57.541 million gross and ($0.302) million net expenditures provides funding for two services: Fleet Management and Fuel Management.
Fleet Services has over-achieved the 0% budget target through the following service efficiency strategies:
Savings in the second year of implementation of the Alternate Service Delivery model for vehicle maintenance by contracting out preventative maintenance for Class 1 & 2 ($0.469) million
Mitigation of the budget impact from the provincially mandated Cap & Trade Program by effective fuel hedging ($0.353) million
Cost reduction from improving the parts warranty management and core returns process to ensure warranties are maximized ($0.100) million
Adopting a new tire management strategy by implementing a tire retreading process for heavy vehicles/equipment ($0.060) million
Effective contract management to meet client division needs, while mitigating risk and ensuring that value for money is obtained by the City ($0.035) million
Staff complement will decrease by 1.0 position from 2017 to 2018
Fleet Management,
$39.5, 69%
Fuel Management,
$18.1, 31%
2018 Budget by Service
$57.5 Million
Inter-Divisional
Recoveries,$50.2, 86%
Transfers From Capital,
$1.1, 2%
Contribution From
Reserves/Reserve Funds, $0.1, 0%
Sundry and Other
Revenues, $6.4, 11%
Property Tax, ($0.3),
-1%
2018 Budget by Funding Source
$57.5 Million
Salaries And Benefits,
$19.4, 34%
Materials & Supplies,
$26.6, 46%
Equipment, $0.2, 0%
Service And Rent, $8.1, 14%
Contribution To Reserves/Reserve
Funds, $2.6, 5%
Inter-Divisional Charges, $0.6,
1%
2018 Budget by Expenditure Category
$57.5 Million

2018 Operating Budget Fleet Services
toronto.ca/budget2018 4
Actions for Consideration
Approval of the 2018 Preliminary Budget as presented in these notes requires that:
1. City Council approve the 2018 Preliminary Operating Budget for Fleet Services of $57.541 million gross, ($0.302) million net for the following services:
Service: Gross
($000s) Net
($000s)
Fleet Management: 39,481.1 332.6
Fuel Management: 18,060.1 (634.6)
Total Program Budget 57,541.2 (302.1)
2. City Council approve the 2018 service levels for Fleet Services as outlined on pages 15 and 20 of this report, and associated staff complement of 185.0 positions, comprising 8.0 capital project delivery positions and 177.0 operating service delivery positions.
3. City Council approve the budget transfer of $0.244 million gross and net, reflecting the additional savings resulting from the implementation of the Alternate Service Delivery Model, from Fleet Services to the respective tax-supported client programs and Agencies for 2018 as detailed below:
Savings by Programs/Agencies 2018 Savings
Parks, Forestry & Recreation 116,680
Transportation Services 91,789
Facilities Mgmt & Real Estate 13,701
Fleet Services 7,034
Municipal licensing & stds 5,884
Engineering & Constr. Services 2,441
Toronto Public Library 2,150
Public Health 1,509
Office of Emergency Management 750
Purchasing and Materials Mgmt 702
Toronto Building 498
City Clerks Office 478
Eco. Devt. & Culture 467
Total Tax-Supported Programs/Agencies 244,083
2018 Operating Budget Fleet Services
toronto.ca/budget2018 5
Part 1
2018-2020 Service Overview and Plan

2018 Operating Budget Fleet Services
toronto.ca/budget2018 6
Program Map
Fleet ServicesProvide responsive and efficient fleet management services to City Programs and Agencies that maximizes safety and
environmental sustainability and minimizes lifecycle costs.
Fleet Management
Fleet Acquisition
Fleet Maintenance
Fleet Disposal
Vehicle Safety
Fuel Management
Fuel Acquisition
Fuel Distribution
Fleet Management
• Staff - City Divisions
Indirect (Beneficiary)
• Residents
• Businesses
Purpose:
To provide repair and
preventive maintenance
services for vehicles and
equipment to support
divisional operations and
comply with legislative
requirements.
Purpose:
To provide fuel to support
divisional operations and
oversight at all City‐owned
fuel sites.
Service Customer
Legend:
Program
Service
Activity
Fuel Management
• Staff - City Divisions
• Staff – Agencies
Indirect (Beneficiary)
• Residents
• Businesses

2018 Operating Budget Fleet Services
toronto.ca/budget2018 7
Table 1
2018 Preliminary Operating Budget and Plan by Service
The Fleet Services' 2018 Preliminary Operating Budget is $57.541 million gross and ($0.302) million net,
representing a decrease of $0.293 million to the 2017 Approved Net Operating Budget and over-achievement of the
0% budget target as set out in the 2018 Operating Budget Directions and Guidelines.
Base pressures are mainly attributable to the inflationary cost increases in salaries and benefits, increased
demand for fuel, and higher costs to maintain the City's fleet.
The above pressures were more than offset by inter-divisional recoveries, additional savings from
implementation of the Alternate Service Delivery (ASD) model and service efficiency strategies.
Approval of the 2018 Operating Budget will result in Fleet Services reducing its total staff complement by 1.0
position from 186.0 to 185.0:
A reduction of 2 temporary mechanic positions arising from the conversion of 10 temporary vacant
positions (9 mechanic and 1 supervisor) to 8 permanent mechanic positions, will result in savings of $0.223
million.
1 permanent mechanic position will be added to support the ongoing maintenance of the Vehicle
Information Box (VIB) project.
The 2019 and 2020 Plan incremental costs are mainly attributable to increases in salary and benefit and
maintenance contract escalation.
Incremental Change
(In $000s) Budget
Projected
Actual Base
New/
Enhanced
Total
Budget
By Service $ $ $ $ $ $ % $ % $ %
Fleet Management
Gross Expenditures 37,942.7 42,312.8 39,481.1 0.0 39,481.1 1,538.3 4.1% 242.7 0.6% 596.9 1.5%
Revenue 38,132.1 41,778.4 39,148.5 0.0 39,148.5 1,016.4 2.7% (498.1) (1.3%) 0.0
Net Expenditures (189.4) 534.5 332.6 0.0 332.6 522.0 (275.6%) 740.8 222.8% 596.9 55.6%
Fuel Management
Gross Expenditures 16,264.5 16,930.0 18,060.1 0.0 18,060.1 1,795.6 11.0% 425.1 2.4% 416.5 2.3%
Revenue 16,084.6 17,534.6 18,694.7 0.0 18,694.7 2,610.2 16.2% 268.7 1.4% 264.8 1.4%
Net Expenditures 179.9 (604.6) (634.6) 0.0 (634.6) (814.5) (452.8%) 156.5 (24.7%) 151.7 (31.7%)
Total
Gross Expenditures 54,207.2 59,242.8 57,541.2 0.0 57,541.2 3,334.0 6.2% 667.9 1.2% 1,013.4 1.7%
Revenue 54,216.7 59,313.0 57,843.3 0.0 57,843.3 3,626.5 6.7% (229.4) (0.4%) 264.8 0.5%
Total Net Expenditures (9.5) (70.1) (302.1) 0.0 (302.1) (292.6) (3078.2%) 897.3 (297.0%) 748.6 125.8%
Approved Positions 186.0 167.0 185.0 0.0 185.0 (1.0) (0.5%) (6.0) (3.2%) 0.0
2018 Preliminary
vs. 2017 Budget
Change
2019
Plan
2020
Plan
2017 2018 Preliminary Operating Budget

2018 Operating Budget Fleet Services
toronto.ca/budget2018 8
The following graphs summarize the operating budget pressures for Fleet Services and the actions taken to
offset/reduce these pressures to meet the budget reduction target.
Key Cost Drivers
Actions to Achieve Budget Reduction Target
(374.5)
103.0
(426.0)
1,221.6
2,980.8
(3,249.6)
255.2
Prior Year Impacts Operating Impacts ofCapital
Salaries and Benefits Non Labor InflationaryImpacts
Other Base Changes Revenue Changes Total Pressure
($ Thousands)
255.2
(547.8)
(292.6)
Opening Pressure Base BudgetReductions
Efficiencies Service Adjustments Bridging Strategies New & Enhanced Remaining Pressure
($ Thousands)

2018 Operating Budget Fleet Services
toronto.ca/budget2018 9
Table 2 Key Cost Drivers
Key cost drivers for Fleet Services are shown in Table 2 above. The following describes major budget changes for
2018.
Gross Expenditure Changes
Prior Year Impacts:
Additional savings of $0.469 million resulting from the second year of implementation of ASD from
reducing vehicle downtime and maintenance & repair, of which $0.244 million will be allocated to the tax-
supported client Programs and Agencies from Fleet Services.
In October 2017, City Council approved the extension of 6 temporary positions for Report "Tree Protection
Enforcement (EX27.21)" for eight months. This is a temporary initiative to address the increase in
complaints under the Municipal Tree Protection By-Laws. As a result, additional costs of $0.095 million
will be required in fuel and vehicle rental costs to support this initiative. These costs will be fully recovered
from Parks, Forestry and Recreation.
Fleet
Maintenance
Fuel
Management
(In $000s) $ $ $ Position
Gross Expenditure Changes
Prior Year Impacts
ASD Implementation Savings (225.7) (243.4) (469.1)
1 Parks Tress Protection Enforcement 75.6 19.0 94.5
Operating Impacts of Capital
Ongoing Maintenance of VIB Program 103.0 103.0 1.0
Salaries and Benefits
Salary and Benefits Adjustments (56.2) (147.0) (203.2)
Conversion of Temporary Positions to Permanent (222.8) (222.8) (2.0)
Economic Factors
Inflationary Increases for Utilities, Maintenance Contracts and
Vehicle Parts374.4 847.2 1,221.6
Other Base Expenditure Changes
Inter-divisional Charges Adjustments 1.6 (56.7) (55.1)
2 Fuel Volume Adjustment 1,519.8 1,519.8
2 Expenditures Required to Maintain City Fleet in SOGR 1,018.0 1,018.0
2 Vehicle & Equipment Reserve Contribution Adjustment 198.1 198.1
3 Contribution for Toronto Community Housing Corporation 300.0 300.0
Expenditure Realignment (12.1) 12.1
Total Gross Expenditure Changes 1,355.7 2,149.1 3,504.8 (1.0)
Revenue Changes
Base Revenue Changes
1 Recovery for Parks Tress Protection Enforcement 75.6 19.0 94.5
2 Recoveries from Agencies 4.2 1,595.2 1,599.5
2 Recoveries from Divisions and Capital 222.3 996.1 1,218.4
3 Recovery from Toronto Community Housing Corporation 300.0 300.0
Vendor Discount 31.7 31.7
Miscellaneous Adjustments 4.9 0.5 5.5
Total Revenue Changes 638.7 2,610.9 3,249.6
Net Expenditure Changes 717.0 (461.8) 255.2 (1.0)
2018 Base Operating Budget
Total

2018 Operating Budget Fleet Services
toronto.ca/budget2018 10
Operating Impacts of Capital:
Fleet Services has an ongoing capital project to deploy the Vehicle Information Box (VIB) technology in
4,000 vehicles and equipment. This technology will allow for automated vehicle meter reading and
authorization for fueling at the fuel sites. As a result, 1 permanent mechanic position is requested to
support the continuing maintenance of these Vehicle Information Box program.
Salaries and Benefits
Lower salaries and benefits, mainly due to realignment of positions and benefit adjustments based on
actual trend, is partially offset by the inflationary increases in salaries and benefits.
Conversion of 10 temporary vacant positions (9 mechanics and 1 supervisor) to 8 permanent mechanic
positions, will result in savings of $0.223 million.
Economic Factors:
Inflationary increases to fuel price, including the Cap and Trade impact and vehicle maintenance
contracts, will result in a pressure of $1.221 million.
Other Base Changes
An increase of $1.520 million in fuel costs can be attributed to increased fuel demand mainly driven by Toronto
Transit Commission vehicles and Toronto District School Board vehicles moving to City Fleet fuel sites. These
costs will be fully recovered from City Programs and Agencies.
Increased expenditures of $1.018 million for contracted services, machinery & equipment and computer
hardware & software required to maintain City fleet in State of Good Repair. These will be offset by the inter-
divisional recoveries from divisions and agencies.
Additional contribution to the Vehicle and Equipment Reserve of $0.198 million to provide funding for Fleet's
future capital projects.
Contribution to Reserve on behalf of Toronto Community Housing Corporation (TCHC) of $0.300 million based
on their vehicle replacement requirement, which will be recovered from TCHC.
Base Revenue Changes
Base budget pressures will be offset by additional recoveries of $3.118 million for higher fuel consumption and
maintenance costs for fleet in State of Good Repair (SOGR) from City Programs and Agencies.
Vendor discount revenue, for paying invoices within the discount term based on actual trend, contributes
$0.032 million to offset base budget pressures.

2018 Operating Budget Fleet Services
toronto.ca/budget2018 11
In order to offset the above net pressures, and achieve the budget reduction target, the 2018 service changes for Fleet Services consists of service efficiency savings of $0.548 million net, as detailed below.
Table 3 Actions to Achieve Budget Reduction Target
2018 Preliminary Service Change Summary
Fleet Services was able to offset budget pressures with the following measures:
Service Efficiencies (Savings of $0.560 million gross & $0.548 million net)
Fleet Rationalization - Facilities
Through fleet rationalization, Facilities is reducing its fleet size by 2 Class 2 vehicles, which will result in
maintenance and fuel savings of $0.012 million for these vehicles. The savings will be offset by the lower
recovery from Facilities. There is no impact to service levels.
Tire Management
Fleet Services is adopting a new tire management strategy by implementing of a tire retreading process for
heavy vehicles/equipment, which will reduce costs for maintenance and purchase of new tires by $0.060
million. There is no impact to service levels.
Parts Warranty Management
Improved parts warranty management and core returns process to ensure warranties are maximized, by
utilizing new systems such as a parts ordering system to track parts warranty earlier and to increase data
capture, invoicing and parts turnaround, will reduce the expenditures for vehicle parts by $0.100 million. There
is no impact to service levels.
Contract Management
Fleet Services has hired 4 new contract coordinators. These positions are dedicated to developing and
implementing new processes to effectively manage fleet maintenance contracts to meet client division needs,
while mitigating risk and ensuring that value for money is obtained by the City. These actions will result in
savings of $0.035 million for 2018.
Reduce Cap & Trade Impact through Effective Fuel Hedging
There will be a budget pressure resulting from the provincially mandated Cap & Trade program in 2018, with
the impact estimated to be $0.054/L for diesel and $0.04/L for gasoline. Fleet Services anticipates being able to
lower the impact by $0.02/L through effective fuel hedging and reducing costs by $0.353 million.
$ $ #
Gross Net Gross Net Gross Net Pos. Net Pos. Net Pos.
Service Efficiencies
Fleet Rationalization - Facilities (11.7) (0.7) (12.4)
Tire Management (60.0) (60.0)
Parts Warranty Management (100.0) (100.0)
Contract Management (35.0) (35.0)
Reduce Cap & Trade Impact Through Effective
Fuel Hedging(352.8) (352.8)
Sub-Total (206.7) (195.0) (353.5) (352.8) (560.2) (547.8)
Total Changes (206.7) (195.0) (353.5) (352.8) (560.2) (547.8)
2019 Plan 2020 Plan
Service Changes Total Service Changes Incremental Change
Description ($000s)
Fleet
Maintenance
Fuel
Management

2018 Operating Budget Fleet Services
toronto.ca/budget2018 12
Table 5 2019 and 2020 Plan by Program
Future year incremental costs are primarily attributable to the following:
Known Impacts:
Elimination of 5 temporary mechanics that will be no longer required in 2019 upon the completion of the Vehicle
Information Box Capital Project.
Additional costs to support the Parks Tree Protection Enforcement which will be fully recovered from Parks,
Forestry and Recreation.
Increases in salary and benefits for cost of living allowance, progression pay and associated benefits.
Incremental inter-divisional recoveries from client programs and agencies.
Anticipated Impacts:
Inflationary increases in maintenance contracts and fuel prices.
Description ($000s)
Gross
Expense Revenue
Net
Expense
%
Change Position
Gross
Expense Revenue
Net
Expense
%
Change Position
Known Impacts:
Prior Year Impact
Completion of the VIB Capital Project (513.2) (513.2) - (5.0)
Parks Tree Protection Enforcement 19.3 19.3 - 0.4 0.4 -
Salaries and Benefits
Adjustments for COLA, Progression Pay &
Benefits 339.1 339.1 (1.0) 201.3 201.3
Revenue (specify)
IDR Adjustments 264.5 (264.5) 264.5 (264.5)
Sub-Total (154.8) (229.4) 74.6 (6.0) 201.7 264.8 (63.2) 0.0
Anticipated Impacts:
Other (specify)
Inflationary Increases 822.6 822.6 811.8 811.8
Sub-Total 822.6 0.0 822.6 0.0 811.8 0.0 811.8 0.0
Total Incremental Impact 667.7 (229.4) 897.1 (6.0) 1,013.4 264.8 748.6 0.0
2019 - Incremental Increase 2020 - Incremental Increase

2018 Operating Budget Fleet Services
toronto.ca/budget2018 13
Part 2
2018 Preliminary Operating Budget by Service

2018 Operating Budget Fleet Services
toronto.ca/budget2018 14
Fleet Management
What We Do
Purchase, manage, maintain and dispose
vehicles and equipment, and provide operator
training and safety compliance management to
support divisional operations and comply with
legislative requirements.
Fleet Management
Fleet Acquisition
Fleet Maintenance
Fleet Disposal
Vehicle Safety
Fleet Acquisition,
$2.5, 6%
Fleet Maintenance,
$35.6, 90%
Fleet Disposal, $0.2, 1%
Vehicle Safety, $1.2, 3%
2018 Service Budget by Activity($Ms)
$39.5 Million
Inter-Divisional Recoveries, $35.9,
91%
Transfers From Capital,
$1.0, 3%
Contribution From Reserves/Reserve
Funds, $0.1, 0%
Sundry and Other Revenues, $2.2,
5%
Property Tax, $0.3, 1%
2018 Service by Funding Source($Ms)
$39.5 Million

2018 Operating Budget Fleet Services
toronto.ca/budget2018 15
2018 Service Levels Fleet Management
Overall, the 2018 Service Levels are consistent with the approved 2017 Service Levels for Fleet Management:
The actual Average Age for the various type of vehicles are higher than the Approved Level, this is mainly due
to the State of Good Repair backlog. Fleet Services and Financial Planning will continue to work with the key
divisions that have the greatest backlogs, including Parks, Forestry and Recreation, Transportation and Toronto
Water to reduce their SOGR backlogs.
The actual % scheduled repairs to unscheduled repairs are lower than the Approved Level due to some vehicle
and equipment classes being past optimum life. Older vehicles have a greater frequency of unplanned repairs
and also require more repair, which puts added pressure on existing resources to maintain service levels.
The actual number of "Days to Dispose" for used Assets and Vehicle/Equipment are higher than the Approved
Levels. Fleet Services has done an analysis recently and found that the Approved Level did not include the
time required for preparation, auction process, delay in auction and final paperwork to close out the sale. Staff
have concluded that 100 days for Used Assets and 250 days for Vehicle/Equipment would be more reasonable,
realistic and achievable targets.
A new service level measure has been added for "# of course and training attendance" which provides a
measure for the number of staff that attend Vehicle and Equipment Safety training. This training is necessary
to ensure fleet operators remain safe and compliant with all legislative and operating practices.
Activity Type Service level Description Status 2015 2016 2017 2018
Approved 4.5 4.5 4.5 4.5
Actual 6.3 6.4 6.8
Approved 5.7 5.7 5.7 5.7
Actual 6.9 7.1 7.5
Approved 6.2 6.0 6.0 6.0
Actual 7.6 7.1 7.3
Approved 7.1 7.0 7.0 7.0
Actual 10.3 10.2 10.7
Approved 60% / 40% 60% / 40% 60% / 40% 60% / 40%
Actual 27% / 73% 25% / 75% 25% / 75%
Approved 42 90 90 100
Actual 124 204 173
Approved 250 250 250 250
Actual 251 450 262
Approved 52.0% 42.0% 40.0% 40.0%
Actual 27.0% 38.0% 35.0%
Approved 8,700
Actual 6333 9116 8597
Vehicle Safety
MTO CVOR (Commercial Vehicle Operator's Registration)
Safety RatingRate
# of course and training attendance # of People
Fleet
Maintenance% scheduled repairs to unscheduled repairs Percentage Comparison
Fleet Disposal
Average days to sale for used assets # of Days
Vehicles / equipment disposed # of Vehicles
Fleet Acquisition
Light Duty Vehicle (<4500kg) Average Age
Medium Duty Vehicles (4500kg - 9000 Kg) Average Age
Heavy Duty Vehicle (>9000kg) Average Age
Off-Road (Driven) Average Age

2018 Operating Budget Fleet Services
toronto.ca/budget2018 16
Service Performance Measures
The number of vehicles and equipment acquired
affects the timely replacement of vehicles in order
to minimize operating costs.
The number of vehicles and equipment acquired
on an annual basis reflects the new additions to
the fleet.
It is projected that a combined total of 250
vehicles and equipment will be purchased in
2018.
2015Actual
2016Actual
2017Proj
Actual
2018Target
2019Plan
2020Plan
Series1 301 421 233 250 250 250
0
50
100
150
200
250
300
350
400
450
Number of Vehicles & Equipment Acquired
2015Actual
2016Actual
2017Proj
Actual
2018Target
2019Plan
2020Plan
Series1 251 450 262 250 250 250
0
50
100
150
200
250
300
350
400
450
500
Number of Vehicles & Equipment Disposed
An equivalent number of vehicles and equipment
are projected to be acquired and disposed on an
annual basis.
The timely replacement including the disposal of
beyond optimum life units will have an overall
positive impact on maintenance costs.

2018 Operating Budget Fleet Services
toronto.ca/budget2018 17
Table 6 2018 Preliminary Service Budget by Activity
Fleet Management provides services including purchasing, management and maintenance of the vehicles and
equipment, and operator training and safety compliance management to support divisional operations and comply
with legislative requirements.
Fleet Management's 2018 Preliminary Operating Budget of $39.481 million gross and $0.333 million net is $0.522
million or 275.6% over the 2017 Approved Net Budget.
Base budget pressures in Fleet Management are primarily attributable to higher maintenance costs for vehicles
in SOGR.
These pressures are partially offset by increased recoveries from various City Programs and Agencies, as well
as savings from the implementation of the Alternate Service Delivery Model.
2015Actual
2016Actual
2017Proj
Actual
2018Target
2019Plan
2020Plan
Series1 18% 19% 19% 20% 22% 24%
0%
5%
10%
15%
20%
25%
Percentage of Green Vehicles
Incremental Change
Approved
Budget
Base
Budget
Service
Changes
Preliminary
Base
Prelim.
Base
Budget vs.
2017
Budget % Change
New/
Enhance
d
Prelim
Budget
($000s) $ $ $ $ $ % $ $ $ % $ % $ %
GROSS EXP.
Fleet Acquisition 2,527.9 2,495.5 2,495.5 (32.4) (1.3%) 2,495.5 (32.4) (1.3%) 28.4 1.1% 22.3 0.9%
Fleet Disposal 164.2 161.0 161.0 (3.3) (2.0%) 161.0 (3.3) (2.0%) 2.5 1.6% 0.8 0.5%
Fleet Maintenance 34,031.0 35,811.0 (206.7) 35,604.4 1,573.3 4.6% 35,604.4 1,573.3 4.6% 181.1 0.5% 540.7 1.5%
Vehicle Safety 1,219.5 1,220.2 1,220.2 0.7 0.1% 1,220.2 0.7 0.1% 30.7 2.5% 33.1 2.6%
Total Gross Exp. 37,942.7 39,687.7 (206.7) 39,481.1 1,538.3 4.1% 39,481.1 1,538.3 4.1% 242.7 0.6% 596.9 1.5%
REVENUE
Fleet Acquisition 1,004.7 1,338.4 1,338.4 333.7 33.2% 1,338.4 333.7 33.2% 1.7 0.1%
Fleet Disposal 75.0 75.0 75.0 75.0
Fleet Maintenance 37,052.4 37,746.8 (11.7) 37,735.1 682.7 1.8% 37,735.1 682.7 1.8% (499.8) (1.3%)
Vehicle Safety - - - -
Total Revenues 38,132.1 39,160.2 (11.7) 39,148.5 1,016.4 2.7% 39,148.5 1,016.4 2.7% (498.1) (1.3%)
NET EXP.
Fleet Acquisition 1,523.2 1,157.1 1,157.1 (366.1) (24.0%) 1,157.1 (366.1) (24.0%) 26.7 2.3% 22.3 1.9%
Fleet Disposal 89.2 86.0 86.0 (3.3) (3.7%) 86.0 (3.3) (3.7%) 2.5 2.9% 0.8 0.9%
Fleet Maintenance (3,021.4) (1,935.7) (195.0) (2,130.7) 890.6 (29.5%) (2,130.7) 890.6 (29.5%) 680.9 (32.0%) 540.7 (37.3%)
Vehicle Safety 1,219.5 1,220.2 1,220.2 0.7 0.1% 1,220.2 0.7 0.1% 30.7 2.5% 33.1 2.6%
Total Net Exp. (189.4) 527.6 (195.0) 332.6 522.0 (275.6%) 332.6 522.0 (275.6%) 740.8 222.8% 596.9 35.7%
Approved Positions 181.8 187.8 182.8 1.0 0.6% 182.8 1.0 0.6% (5.9) (3.2%)
2019 Plan 2020 Plan
2017 2018 Preliminary Operating Budget
2018 Prelim Budget
vs. 2017 Budget
The percentage of the vehicle inventory that
is Green includes alternative fuel vehicles
such as Natural Gas, Gas-Electric Hybrids,
and all electric vehicles.
Fleet Services continues to purchase
environmentally sustainable vehicles to
reduce fuel use and costs, emissions of
greenhouse gases and smog-causing air
pollutants, increasing from 18% in 2015 to
20% in 2017.
The percentage of Green Vehicles in the
vehicle inventory is expected to be at 20% in
2018.

2018 Operating Budget Fleet Services
toronto.ca/budget2018 18
Fuel Management
What We Do
Provide fuel to support divisional operations and
oversight at all City-owned fuel sites.
Fuel Management
Fuel Acquisition
Fuel Distribution
Fuel Acquisition, $16.0, 89%
Fuel Distribution,
$2.1, 11%
2018 Service Budget by Activity($Ms)
$18.1 Million
Inter-Divisional Recoveries, $14.4, 74%
Transfers From
Capital, $0.1, 1%
Contribution From Reserves/Reserve
Funds, $0.0, 0%Sundry and Other
Revenues, $4.3, 22%
Property Tax, ($0.6), -3%
2018 Service by Funding Source($Ms)
$18.1 Million

2018 Operating Budget Fleet Services
toronto.ca/budget2018 19
2015Actual
2016Actual
2017Proj
Actual
2018Target
2019Plan
2020Plan
Series1 11,429 11,314 11,200 10,822 10,822 10,822
10,400
10,600
10,800
11,000
11,200
11,400
11,600
Amount of Diesel Fuel Distributed (in 000s)
2018 Service Levels Fuel Management
Overall, the 2018 Service Levels are consistent with the approved 2017 Service Levels for Fuel Services.
The gasoline contract below market price is increasing due to effective hedging, combined with better pricing
received for the City's fuel contract in comparison to the pricing at commercial fuel sites.
The target volume of gasoline dispensed reflects increased demand from City Programs.
Service Performance Measures
The Diesel Contract below Market price has
been stable over the past few years due to
better pricing received on the fuel contract
compare to the pricing at commercial fuel
sites.
Activity Type Service Level Description Status 2015 2016 2017 2018
Approved 5% 5% 7% 8%
Actual 10% 10% 11%
Approved 8% 8% 8% 8%
Actual 11% 12% 12%
Approved 3.8 3.9 5.4 6.4
Actual 4.0 4.6 5.7
Approved 10.6 11.4 10.1 10.8
Actual 11.4 11.3 11.2
Fuel Acquisition
Gasoline Contract below market price
Diesel Contract below market price
Fuel Distribution
Gasoline Dispensed
Diesel Dispensed
% below market price
% below market price
litres (millions)
litres (millions)
2015Actual
2016Actual
2017Proj
Actual
2018Target
2019Plan
2020Plan
Series1 11% 12% 12% 8% 8% 8%
0%
2%
4%
6%
8%
10%
12%
14%
Diesel Contract below Market Price
The amount of diesel fuel distributed is
projected to be higher in 2018 due to
increased demand from client programs.
Fuel Services continues the Fuel Hedging
program to minimize the impacts of
fluctuating fuel market prices.

2018 Operating Budget Fleet Services
toronto.ca/budget2018 20
Table 6 2018 Preliminary Service Budget by Activity
The Fuel Management Service provides fuel to support divisional operations and oversight for all City-owned fuel
sites.
Fuel Management's 2018 Preliminary Operating Budget of $18.060 million gross and ($0.635) million net is $0.815
million or 452.8% under the 2017 Approved Net Budget.
In addition to the base budget pressures common to all services, this service is experiencing higher fuel
consumption mainly from the Toronto Transit Commission and Toronto District School Board.
In order to offset these pressures, the 2018 Preliminary Operating Budget includes higher recoveries from City
Programs and Agencies, savings from implementation of the Alternate Service Delivery and effective fuel
hedging.
The higher savings that have been included in this service will offset the increased net pressure of $0.333
million in the Fleet Management Service.
Incremental Change
Approved
Budget Base Budget
Service
Changes
Preliminary
Base
Prelim.
Base
Budget vs.
2017
Budget % Change
New/
Enhanced
Prelim
Budget
($000s) $ $ $ $ $ % $ $ $ % $ % $ %
GROSS EXP.
Fuel Acquisition 13,998.0 16,362.9 (353.5) 16,009.4 2,011.4 14.4% 16,009.4 2,011.4 14.4% 417.0 2.6% 409.6 2.5%
Fuel Distribution 2,266.4 2,050.7 2,050.7 (215.7) (9.5%) 2,050.7 (215.7) (9.5%) 8.1 0.4% 6.9 0.3%
Total Gross Exp. 16,264.5 18,413.6 (353.5) 18,060.1 1,795.6 11.0% 18,060.1 1,795.6 11.0% 425.1 2.4% 416.5 2.2%
REVENUE
Fuel Acquisition - - - -
Fuel Distribution 16,084.6 18,695.4 (0.7) 18,694.7 2,610.2 16.2% 18,694.7 2,610.2 16.2% 268.7 1.4% 264.8 1.4%
Total Revenues 16,084.6 18,695.4 (0.7) 18,694.7 2,610.2 16.2% 18,694.7 2,610.2 16.2% 268.7 1.4% 264.8 1.4%
NET EXP.
Fuel Acquisition 13,998.0 16,362.9 (353.5) 16,009.4 2,011.4 14.4% 16,009.4 2,011.4 14.4% 417.0 2.6% 409.6 2.5%
Fuel Distribution (13,818.1) (16,644.7) 0.7 (16,644.1) (2,825.9) 20.5% (16,644.1) (2,825.9) 20.5% (260.6) 1.6% (257.9) 1.5%
Total Net Exp. 179.9 (281.8) (352.8) (634.6) (814.5) (452.8%) (634.6) (814.5) (452.8%) 156.5 (24.7%) 151.7 (46.5%)
Approved Positions 4.2 2.2 2.2 (2.0) (47.6%) 2.2 (2.0) (47.6%) (0.1) (4.5%)
2017 2018 Preliminary Operating Budget
2018 Prelim Budget
vs. 2017 Budget 2019 Plan 2020 Plan

2018 Operating Budget Fleet Services
toronto.ca/budget2018 21
Part 3
Issues for Discussion

2018 Operating Budget Fleet Services
toronto.ca/budget2018 22
Issues Impacting the 2018 Budget
Budget Target
At its meeting on May 24, 2017, the "2018 Budget Process - Budget Directions and Schedule" staff report
(EX25.18) was submitted for consideration and adopted by City Council regarding the establishment of the
2018 Budget Process and the scheduling of the review and approval of the Tax and Rate Supported 2018
Operating Budget and 2018-2027 Capital Budget and Plan for the City of Toronto.
http://app.toronto.ca/tmmis/viewAgendaItemHistory.do?item=2017.EX25.18
City Council directed all City Programs and Agencies to provide their 2018 Net Operating Budget equal to the
2017 Approved Net Operating Budget through cost containment, service efficiency, modernization, service level
and revenue strategies.
Fleet Services' 2018 Operating Budget is $57.541million gross and ($0.302) million net, representing $0.293
million decrease from the 2017 Approved Net Operating Budget. The Program over-achieved the Council
directed budget target by applying the following reduction strategies:
Service efficiency savings from fuel hedging, Tire Management, Parts Warranty Management and Contract
Management resulting in a reduction of $0.560 million gross with no impact on service levels.
Additional savings of $0.469 million from implementation of the Alternate Service Delivery model.
Additional Savings from Implementation of Alternate Service Delivery (ASD) model
City Council adopted the report "Fleet Services Review - Detailed Implementation Plan for the Fleet Services
Strategy (GM 14.1)" in October 2016 and approved the detailed implementation plan for the Alternate Service
Delivery model. http://www.toronto.ca/legdocs/mmis/2016/gm/bgrd/backgroundfile-94260.pdf.
The Alternative Service Delivery model will improve maintenance practices, client service delivery and
availability. Over the medium term, this model is expected to facilitate fleet optimization improvements,
enhance vehicle condition and resale values, and reduce vehicle downtime.
This model includes contracting out all preventative maintenance and repairs of Non-Specialized Class 1-2
vehicles managed in-house utilizing City contracts, which results in reduction of vehicle downtime, maintenance
and repair costs.
This model was initially implemented in October 2017, and the City-wide savings realized in 2017 totaled
$0.397 million, of which $0.172 million in savings for Tax-Supported Programs and $0.225 million for Rate-
Supported Programs.
Additional savings of $0.244 million to be realized for 2018 has been included in the Fleet Services' 2018
Preliminary Operating Budget for Tax-Supported Programs. Savings of $0.132 million is included in the 2018
Preliminary Operating Budget for Solid Waste and $0.087 million in the 2018 Preliminary Operating Budget for
Toronto Water as noted in the table below.
These savings are expected to be achieved through a reduction in downtime and improvements in preventative
maintenance and repair, and will need to be reflected in the respective Tax-Supported Programs and Agencies
2018 Operating Budgets, with adjustments to be made after the approval of the 2018 Operating Budget.

2018 Operating Budget Fleet Services
toronto.ca/budget2018 23
It is recommended that City Council approve the budget transfer of $0.244 million gross and net, reflecting the
savings resulting from the implementation of the Alternate Service Delivery Model as noted in table above, to
the respective Tax-supported client Programs from Fleet Services' 2018 Operating Budget.
The future savings for 2019 and 2020 are expected to be the same as 2018 at $0.463 million. The total savings
realized by this initiative is expected to be $3.726 million for City-wide programs by 2024, and they will be
reviewed and reflected in future year budget processes.
Savings by Programs/Agencies 2018 Savings
Parks, Forestry & Recreation 116,680
Transportation Services 91,789
Facilities Mgmt & Real Estate 13,701
Fleet Services 7,034
Municipal licensing & stds 5,884
Engineering & Constr. Services 2,441
Toronto Public Library 2,150
Public Health 1,509
Office of Emergency Management 750
Purchasing and Materials Mgmt 702
Toronto Building 498
City Clerks Office 478
Eco. Devt. & Culture 467
Sub-total Tax-Supported Programs/Agencies 244,083
Solid Waste Management 132,402
Toronto Water 86,515
Sub-Total Rate-supported Programs 218,917
Total Savings 463,000

2018 Operating Budget Fleet Services
toronto.ca/budget2018 24
Issues Referred to the 2018 Operating Budget Process
New & Enhanced Not Included in the 2018 Preliminary Operating Budget
Fleet Services submitted 3 New and Enhanced requests as noted in the table below, which will require
additional funding of $0.172 million gross and net and 2 new positions, if approved.
TransformTO – ($0.172 million gross and net, 2 positions):
City Council approved the TransformTO Short-term Strategies as set out in Attachment A of Report
"TransformTO: Climate Action for a Healthy Equitable and Prosperous Toronto (PE15.1)" in December
2016. http://app.toronto.ca/tmmis/viewAgendaItemHistory.do?item=2016.PE15.1.
City Council also directed City Divisions, with support from the Chief Corporate Officer, to develop business
cases as part of the 2018 Budget Process to implement the strategies outlined in the TransformTO Short-
term Strategies. Each strategy has an identified "lead" within the City of Toronto responsible for advancing
its implementation.
Fleet Services is identified as the lead on Strategy 4.4 Improve Fleet Fuel Efficiency. Below are the
additional 2 permanent positions that are requested for the implementation and support of the
TransformTO initiatives. These two positions are anticipated to start in May 2018, which will result in salary
and benefit costs of $0.172 million in 2018, $0.269 million in 2019 and $0.276 million in 2020.
The remaining 2 Business Cases are to provide vehicle/equipment support for the new/enhanced initiatives for
Parks, Forestry and Recreation. All of these initiatives are part of the Council approved Parks Plan 2013 - 2017
that guides delivery of service. The costs for vehicles & equipment rental and fuel are expected to increase
upon implementation of these initiatives. The impact for the Horticulture Bed Rejuvenation initiative and the
Parks Ranger Program initiative will be in 2019. The higher costs will be fully recovered from Parks, Forestry
and Recreation, and there will be no net impact to Fleet Services.
Gross Revenue Net Positions Net Positions Net Positions
Not Included
Referred to the Budget Process:
Positions for TransformTO 172.4 172.4 2.0 96.2 6.9
Sub-Total Referred to Budget Process 172.4 172.4 2.0 96.2 0.0 6.9 0.0
Staff Initiated:
Equipment to Support Horticulture and Urban Agriculture 36.2 36.2
Equipment to Support Enhanced Maintenance and
Quality Management 15.0 15.0
Sub-Total Staff Initiated 51.2 51.2 - - - - 0.0 0.0
Total New / Enhanced Services (Not Included) 223.6 51.2 172.4 2.0 96.2 - 6.9 0.0
New / Enhanced Service Description ($000s)
2018 Impact
Incremental Change
2019 Plan 2020 Plan
Position TitleStatus
(Temp/Perm)Position
2018
May - Dec 2019 2020
BUSINESS DEV & IMPROVEMENT ANALYST Perm 1.0 86.2 134.3 137.7
PROJECT MANAGER GREEN FLEET Perm 1.0 86.2 134.3 137.7
Total Total 2.0 172.4 268.6 275.5

2018 Operating Budget Fleet Services
toronto.ca/budget2018 25
Appendices

2018 Operating Budget Fleet Services
toronto.ca/budget2018 26
Appendix 1
2017 Service Performance
Key Service Accomplishments
In 2017, Fleet Services made significant progress and/or accomplished the following:
Commenced implementation of the Council approved alternate service delivery model for all preventative
maintenance and repairs for non-specialized class 1-2 vehicles.
Completed the centralization and oversight of 23 City Wide fuel sites that fuel over 7100 assets. The 23 City
fuel sites now utilize 1 common software and hardware program.
Continued to partner with Solid Waste Management to implement CNG technology on curbside residential
collections vehicles. To date, approximately 40% of the collections units have been replaced by CNG vehicles.
Continued to maintain the City of Toronto's Commercial Vehicle Operator's Registration (CVOR) rating at a
satisfactory level with the Ministry of Transportation.
Completed the installation of one DC Fast charging station which will substantially reduce electric vehicle
charging time. Two new electric vehicles added to the City's fleet.
Leveraged procurement leadership to provide Toronto Transit Commission, Toronto Parking Authority, Toronto
Fire Services, Toronto Paramedic Services, Exhibition Place and the Toronto Zoo with the ability to procure
vehicles or equipment based on existing Fleet Services specifications.
Appendix 2
2018 Preliminary Operating Budget by Expenditure Category
Program Summary by Expenditure Category
For additional information regarding the 2017 Q3 operating variances and year-end projections, please refer to the
attached link for the report entitled "Operating Variance Report for the Nine-Month Period Ended September 30,
2017" considered by City Council at its meeting on November 27, 2017:
http://app.toronto.ca/tmmis/viewAgendaItemHistory.do?item=2017.BU37.2
Impact of 2017 Operating Variance on the 2018 Preliminary Operating Budget
The 2017 Year-End projects a slightly higher recovery from City Programs and Agencies than plan driven by
increased maintenance costs for vehicles that have passed their optimum life and higher fuel consumption by
Toronto Transit Commission and Toronto District School Board. There is no impact to the 2018 Preliminary
Operating Budget.
2017 2018
2015 2016 2017 Projected Preliminary
Category of Expense Actual Actual Budget Actual * Budget 2019 2020
($000's) $ $ $ $ $ $ % $ $
Salaries And Benefits 16,642.1 17,228.6 19,357.5 17,525.7 19,426.8 69.3 0.4% 19,237.7 19,439.0
Materials & Supplies 26,102.1 24,676.4 25,164.2 27,276.2 26,636.7 1,472.5 5.9% 27,320.6 27,982.3
Equipment 99.4 120.9 91.7 175.6 187.3 95.6 104.2% 189.4 191.4
Service And Rent 8,831.4 9,100.4 6,647.1 11,348.9 8,144.7 1,497.6 22.5% 8,312.5 8,460.9
Contribution To Reserves/Reserve Funds 938.2 2,476.3 2,304.1 2,304.1 2,558.1 254.0 11.0% 2,558.1 2,558.1
Inter-Divisional Charges 502.6 513.0 642.6 612.5 587.5 (55.1) (8.6%) 590.7 590.7
Total Gross Expenditures 53,115.9 54,115.5 54,207.2 59,242.9 57,541.2 3,334.0 6.2% 58,209.0 59,222.4
Inter-Divisional Recoveries 50,869.2 50,375.1 48,371.5 52,759.7 50,208.1 1,836.6 3.8% 50,491.9 50,756.7
Transfers From Capital 183.9 278.7 1,213.7 1,213.7 1,067.0 (146.7) (12.1%) 553.8 553.8
Contribution From Reserves/Reserve Funds 33.7 104.6 120.8 120.8 126.3 5.5 4.5% 126.3 126.3
Sundry and Other Revenues 2,430.4 3,411.1 4,510.7 5,218.7 6,441.9 1,931.2 42.8% 6,441.9 6,441.9
Total Revenues 53,517.1 54,169.5 54,216.7 59,313.0 57,843.3 3,626.5 6.7% 57,613.8 57,878.7
Total Net Expenditures (401.3) (53.9) (9.5) (70.1) (302.1) (292.6) 3078.2% 595.2 1,343.7
Approved Positions 165.0 164.0 181.0 167.0 185.0 4.0 2.2% 179.0 179.0 * Based on the 9-month Operating Variance Report
2018 Change from
2017 Approved
Budget
Plan
2018 Operating Budget Fleet Services
toronto.ca/budget2018 27
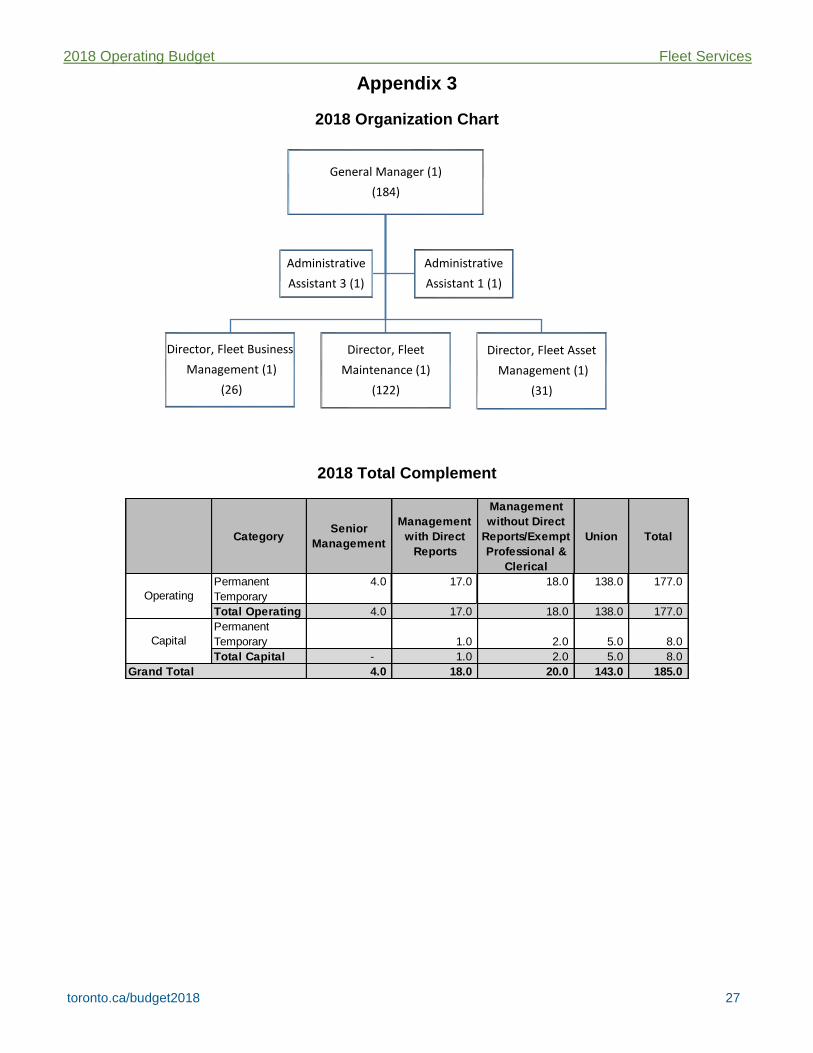
Appendix 3
2018 Organization Chart
2018 Total Complement
General Manager (1)
(184)
Director, Fleet Business
Management (1)
(26)
Director, Fleet
Maintenance (1)
(122)
Director, Fleet Asset
Management (1)
(31)
Administrative
Assistant 3 (1)
Administrative
Assistant 1 (1)
CategorySenior
Management
Management
with Direct
Reports
Management
without Direct
Reports/Exempt
Professional &
Clerical
Union Total
Permanent 4.0 17.0 18.0 138.0 177.0
Temporary
Total Operating 4.0 17.0 18.0 138.0 177.0
Permanent
Temporary 1.0 2.0 5.0 8.0
Total Capital - 1.0 2.0 5.0 8.0
Grand Total 4.0 18.0 20.0 143.0 185.0
Operating
Capital

2018 Operating Budget Fleet Services
toronto.ca/budget2018 28
Appendix 4
Summary of 2018 Service Changes

2018 Operating Budget - Preliminary Service ChangesSummary by Service ($000's)
23.35 Service: FL-Fleet Management
Preliminary Service Changes: (11.7) (11.7) 0.0 0.00 0.0 0.0
1.38 Service: FL-Fuel Management
Preliminary Service Changes: (0.7) (0.7) 0.0 0.00 (0.0) 0.0
14545 Fleet Rationalization for Facilities51 No Impact Description:
Through fleet rationalization, Facilities is reducing its fleet size by 2 Class 2 vehicles, which will result in maintenance cost and fuel savings for thesevehicles.
Service Level Impact:
Total Preliminary Service Changes: (12.4) (12.4) 0.0 0.00 (0.0) 0.0
Equity Statement:Not applicable
352.81 Service: FL-Fuel Management
14632 Absorb Partial Cap & Trade Impact through Effective Hedging51 No Impact Description:
There will be a budget pressure resulting from the provincially mandated Cap & Trade program in 2018, with the impact estimated to be $0.054/L fordiesel and $0.04/L for gasoline. Fleet Services will mitigate the impact by $0.02/L through effective fuel hedging.
Service Level Impact:
Equity Statement:There are no equity impacts.
Form IDInternal Corporate Services
Program - Fleet Services
Adjustments2019 Plan
Net Change2020 Plan
Net ChangeGrossExpenditure Revenue Net Approved
Positions
2018 Preliminary Base Budget Before Service Changes: 58,101.3 57,855.6 245.7 185.00 897.3 748.6
Category:51 - Efficiency Change 52 - Revenue Change 59 - Service Change
Run Date: 11/21/2017 11:20:33Page 1 of 3

2018 Operating Budget - Preliminary Service ChangesSummary by Service ($000's)
Preliminary Service Changes: (352.8) 0.0 (352.8) 0.00 0.0 0.0
Total Preliminary Service Changes: (352.8) 0.0 (352.8) 0.00 0.0 0.0
60 Service: FL-Fleet Management
Preliminary Service Changes: (60.0) 0.0 (60.0) 0.00 0.0 (0.0)
14634 Tire Management51 No Impact Description:
Fleet Services is adopting a new tire management strategy by implementing of a tire retreading process for heavy vehicles/equipment, which willreduce costs for maintenance and purchase of new tires. There is no impact to service levels.
Service Level Impact:
Total Preliminary Service Changes: (60.0) 0.0 (60.0) 0.00 0.0 (0.0)
Equity Statement:There are no equity impacts.
100 Service: FL-Fleet Management
14635 Parts Warranty Management51 No Impact Description:
Improve the parts warranty management and core returns process to ensure warranties are maximized, by utilizing new systems such as a partsordering system to track parts warranty earlier and to increase data capture, invoicing and parts turnaround. Therefore, expenditures for vehicleparts will be reduced. There is no impact to service levels.
Service Level Impact:
Equity Statement:There are no equity impacts.
Form IDInternal Corporate Services
Program - Fleet Services
Adjustments2019 Plan
Net Change2020 Plan
Net ChangeGrossExpenditure Revenue Net Approved
Positions
Category:51 - Efficiency Change 52 - Revenue Change 59 - Service Change
Run Date: 11/21/2017 11:20:33Page 2 of 3

2018 Operating Budget - Preliminary Service ChangesSummary by Service ($000's)
Preliminary Service Changes: (100.0) 0.0 (100.0) 0.00 0.0 (0.0)
Total Preliminary Service Changes: (100.0) 0.0 (100.0) 0.00 0.0 (0.0)
35 Service: FL-Fleet Management
Preliminary Service Changes: (35.0) 0.0 (35.0) 0.00 0.0 0.0
14636 Contract Management51 No Impact Description:
Fleet Services has hired 4 new contract coordinators. These positions are dedicated in developing and implementing new processes to effectivelymanage fleet maintenance contracts to meet client division needs, while mitigating risk and ensuring that value for money is obtained by the City.
Service Level Impact:
Total Preliminary Service Changes: (35.0) 0.0 (35.0) 0.00 0.0 0.0
Equity Statement:There are no equity impacts.
Form IDInternal Corporate Services
Program - Fleet Services
Adjustments2019 Plan
Net Change2020 Plan
Net ChangeGrossExpenditure Revenue Net Approved
Positions
Summary:
Total Preliminary Service Changes: (560.2) (12.4) (547.8) 0.00 (0.0) (0.0)
Total Preliminary Base Budget: 57,541.2 57,843.3 (302.1) 185.00 897.3 748.6
Category:51 - Efficiency Change 52 - Revenue Change 59 - Service Change
Run Date: 11/21/2017 11:20:33Page 3 of 3

2018 Operating Budget Fleet Services
toronto.ca/budget2018 29
Appendix 6
Inflows/Outflows to/from Reserves & Reserve Funds
Program Specific Reserve / Reserve Funds
2018 2019 2020
$ $ $ $
Projected Beginning Balance 30,005.2 25,971.0 26,095.0 26,219.0
Insurance Reserve Fund XR1010
Proposed Withdrawals (-) (4,158.1)
Contributions (+) 124.0 124.0 124.0 124.0
Total Reserve / Reserve Fund Draws / Contributions 25,971.0 26,095.0 26,219.0 26,343.0
Other Program / Agency Net Withdrawals & Contributions
Balance at Year-End 25,971.0 26,095.0 26,219.0 26,343.0
* Based on 9-month 2017 Reserve Fund Variance Report
2018 2019 2020
$ $ $ $
Projected Beginning Balance 6,813.4 4,124.2 5,346.0 6,567.8
Vehicle and Equipment Replacement XQ0003
Proposed Withdrawals (-) (3,948.4) (126.3) (126.3) (126.3)
Contributions (+) 1,259.3 1,348.1 1,348.1 1,348.1
Total Reserve / Reserve Fund Draws / Contributions 4,124.2 5,346.0 6,567.8 7,789.6
Other Program / Agency Net Withdrawals & Contributions
Balance at Year-End 4,124.2 5,346.0 6,567.8 7,789.6
* Based on 9-month 2017 Reserve Fund Variance Report
2018 2019 2020
$ $ $ $
Projected Beginning Balance 813.0 573.5 573.5 573.5
Fleet Services - Fleet Replacement XQ1503
Proposed Withdrawals (-) (239.5) - -
Contributions (+) - - -
Total Reserve / Reserve Fund Draws / Contributions 573.5 573.5 573.5 573.5
Other Program / Agency Net Withdrawals & Contributions
Balance at Year-End 573.5 573.5 573.5 573.5
* Based on 9-month 2017 Reserve Fund Variance Report
2018 2019 2020
$ $ $ $
Projected Beginning Balance 704.9 1,432.6 1,130.6 1,890.6
Toronto Community Housing Corp.-Fleet ReplacementXQ1707
Proposed Withdrawals (-) (72.4) (1,402.0) (340.0) (1,452.0)
Contributions (+) 800.0 1,100.0 1,100.0 1,100.0
Total Reserve / Reserve Fund Draws / Contributions 1,432.6 1,130.6 1,890.6 1,538.6
Other Program / Agency Net Withdrawals & Contributions
Balance at Year-End 1,432.6 1,130.6 1,890.6 1,538.6
* Based on 9-month 2017 Reserve Fund Variance Report
Reserve /
Reserve
Fund
Number
Projected
Balance as of
Dec. 31, 2017 *
Withdrawals (-) / Contributions (+)
Reserve / Reserve Fund Name
(In $000s)
Reserve /
Reserve
Fund
Number
Projected
Balance as of
Dec. 31, 2017 *
Withdrawals (-) / Contributions (+)
Reserve / Reserve Fund Name
(In $000s)
Reserve /
Reserve
Fund
Number
Projected
Balance as of
Dec. 31, 2017 *
Withdrawals (-) / Contributions (+)
Reserve / Reserve Fund Name
(In $000s)
Reserve /
Reserve
Fund
Number
Projected
Balance as of
Dec. 31, 2017 *
Withdrawals (-) / Contributions (+)
Reserve / Reserve Fund Name
(In $000s)


