OPERATING BUDGET NOTES - Toronto · toronto.ca/budget2016 OPERATING BUDGET NOTES Contents Overview...
27
toronto.ca/budget2016 OPERATING BUDGET NOTES Contents Overview I: 2016 – 2018 Service Overview and Plan 5 II: 2016 Budget by Service 11 III: Issues for Discussion 18 Appendices: 1. 2015 Performance 23 2. 2016 Operating Budget by Expenditure Category 24 3. 2016 Organization Chart 25 4. Summary of 2016 Service Changes 26 5. Summary of 2016 New & Enhanced Service Priorities N/A 6. Inflows/Outflows to / from Reserves & Reserve Funds 27 7. 2016 User Fee Rate Changes NA Contacts Program: Reg Paul General Manager Long-Term Care Homes & Services Tel: (416) 392-8896 Email: [email protected] Corporate: Ritu Sadana Manager, Financial Planning Tel: (416) 395-6449 E-Mail: [email protected] Long-Term Care Homes & Services 2016 OPERATING BUDGET OVERVIEW Long-Term Care Homes & Services (LTCHS) provides a continuum of high quality long-term care services to eligible adults in both long-term care homes and the community. LTCHS are leaders in excellence and ground-breaking services for healthy aging. 2016 Budget Highlights The total cost to deliver these services to Toronto residents is $252.739 million gross and $47.263 million net as shown below. For 2016, the opening net pressure was $1.585 million primarily driven by the operating impact of reopening Kipling Acres Phase II facility. These pressures were partially offset by Ministry of Health and Long-Term Care (MOHLTC) user fee rate increase for basic and preferred accommodations, as well as base expenditure and efficiency savings. As a result, Long-Term Care Homes & Services' 2016 Preliminary Operating Budget is $1.067 million higher than 2015 to sustain 2015 service levels. (in $000's) $ % Gross Expenditures 242,138.6 252,739.7 10,601.1 4.4% Gross Revenues 195,942.6 205,476.7 9,534.1 4.9% Net Expenditures 46,196.0 47,263.00 1,067.0 2.3% 2015 Approved 2016 Budget Change
Transcript of OPERATING BUDGET NOTES - Toronto · toronto.ca/budget2016 OPERATING BUDGET NOTES Contents Overview...

toronto.ca/budget2016
OPERATING BUDGET NOTES
Contents
Overview
I: 2016 – 2018 Service Overview and Plan 5
II: 2016 Budget by Service 11
III: Issues for Discussion 18
Appendices:
1. 2015 Performance 23
2. 2016 Operating Budget by Expenditure Category 24
3. 2016 Organization Chart 25
4. Summary of 2016 Service Changes 26
5. Summary of 2016 New & Enhanced Service Priorities N/A
6. Inflows/Outflows to / from Reserves & Reserve Funds 27
7. 2016 User Fee Rate Changes NA
Contacts
Program: Reg Paul General Manager Long-Term Care Homes & Services Tel: (416) 392-8896 Email: [email protected] Corporate: Ritu Sadana Manager, Financial Planning Tel: (416) 395-6449 E-Mail: [email protected]
Long-Term Care Homes & Services
2016 OPERATING BUDGET OVERVIEW
Long-Term Care Homes & Services (LTCHS) provides a continuum of high quality long-term care services to eligible adults in both long-term care homes and the community. LTCHS are leaders in excellence and ground-breaking services for healthy aging.
2016 Budget Highlights
The total cost to deliver these services to Toronto residents is $252.739 million gross and $47.263 million net as shown below.
For 2016, the opening net pressure was $1.585 million primarily driven by the operating impact of reopening Kipling Acres Phase II facility. These pressures were partially offset by Ministry of Health and Long-Term Care (MOHLTC) user fee rate increase for basic and preferred accommodations, as well as base expenditure and efficiency savings.
As a result, Long-Term Care Homes & Services' 2016 Preliminary Operating Budget is $1.067 million higher than 2015 to sustain 2015 service levels.
(in $000's) $ %
Gross Expenditures 242,138.6 252,739.7 10,601.1 4.4%
Gross Revenues 195,942.6 205,476.7 9,534.1 4.9%
Net Expenditures 46,196.0 47,263.00 1,067.0 2.3%
2015
Approved
2016
Budget
Change

2016 Operating Budget Long-Term Care Homes & Services
toronto.ca/budget2016 Page 2
2014 Actual2015 Projected
Actual2016 Target 2017 Plan 2018 Plan
Customer
satisfaction rate -LTC
94% 95% 95% 95% 95%
93.4%
93.6%
93.8%
94.0%
94.2%
94.4%
94.6%
94.8%
95.0%
95.2%
Long-Term Care Homes Resident Satisfaction Rate
Fast Facts
LTCHS offers long-term care homes providing permanent, convalescent, and short-stay admissions; community based programs; including adult day programs, supportive housing services, and homemaking services.
Supportive 24 hour assistance Housing Services at 9 sites to 525 seniors. Residents come from 50 countries of origin, communicate in 38 languages and practice 34 faith denominations.
2,200 volunteers providing over 134,000 hours per year.
Approximately 2,600 clients throughout the City assisted to remain in their own homes by Homemakers and Nurses Services program.
Trends
The senior’s population is growing rapidly. The population of Toronto's seniors is projected to increase by one-third, close to half a million residents or 17 % of the City's population by 2031.
LTCHS provides surveys to clients and residents to assess their level of satisfaction with services provided by Long-Term Care Homes & Services.
As shown in the chart below, long-term care homes have historically experienced high satisfaction ratings.
Our Service Deliverables for 2016
Long-Term Care Homes & Services provides a variety of exemplary services along a comprehensive and flexible continuum of care – from enabling vulnerable individuals to continue living in the community to healthy aging and quality end-of-life care in LTCHS' homes.
The 2016 Preliminary Operating Budget will:
Support the Toronto Seniors Strategy to meet growing demand for long-term care services resulting from changing demographics and new populations.
Re-open Kipling Acres Phase II, 145 bed long-term care home and community hub bringing the original 337 bed site back into full service.
Initiate implementation of the 2016-2020 Service Plan's main priority areas: Deliver exemplary care and services, serve vulnerable individuals and respond to emerging needs; and lead advances in long-term care and support services to seniors.
Undertake a comprehensive division-wide national accreditation process in partnership with an expert external team of reviewers.
Continue to provide 14,000 client days of service for Adult Day Programs; continue to provide 525 clients with Supportive Housing Services, 86,000 client visits per year under the Homemakers and Nurses Services.

2016 Operating Budget Long-Term Care Homes & Services
toronto.ca/budget2016 Page 3
2016 Operating Budget Expenses & Funding
Where the money goes:
2016 Budget by Service
2016 Budget by Expenditure Category
Where the money comes from:
2016 Budget by Funding Source
Communtiy Based Long-Term Care,
$12.4, 5%
Long Term Care Homes, $240.4,
95%
$252.7 Million
Contribution To Reserves/Reserve Funds, $1.9, 1%
Equipment, $2.9, 1%
Materials & Supplies, $19.8, 8%
Salaries And Benefits, $206.8,
82%
Service And Rent, $20.6, 8%
$252.7 Million
Property Tax, $47.2, 19%
Provincial Subsidies,
$153.6, 61%
User Fees & Donations, $51.2, 20%
Contribution From Reserves,
$0.10, 0%
Transfers from Capital, $0.2, 0%
Inter-Divisional Recoveries, $0.09, 0%
Sundry and Other Revenues,$0.1, 0%
$252.7 Million
Our Key Issues & Priority Actions Respond to increasingly complex and rising
needs of LTC residents
LTCHS will continue to provide service through permanent admission, short stay and convalescent care for residents with multiple diagnoses and complex care needs.
The 2016 Operating Budget includes $2.618 million in increased Provincial funding to address rise in resident acuity as well as funding of $0.734 million to support individuals living in the community to maintain their independence.
LTCHS will maintain an occupancy rate of 97% or higher to respond to community needs while maximizing provincial and LHIN subsidies.
LTCHS will continue to advocate for additional funding from the Province.
2016 Operating Budget Highlights
The 2016 Preliminary Operating Budget for Long-Term Care Homes & Services of $252.739 million gross and $47.263 million net provides funding for two services, Long-Term Care Homes and Community Based Long-Term Care program.
The budget as presented is $1.067 million or 2.3% over the 2015 Approved Budget. The following measures were taken:
The identification of sustainable, on-going 1% in efficiency savings / productivity gains ($0.519 million); and
Resident accommodation fees were increased in accordance with provincial regulations.
Any further reductions are not included as they would negatively impact service levels.

2016 Operating Budget Long-Term Care Homes & Services
toronto.ca/budget2016 Page 4
Actions for Consideration Approval of the 2016 Preliminary Budget as presented in these notes requires that:
1. City Council approve the 2016 Preliminary Operating Budget for Long-Term Care Homes & Services of $ of $252.739 million gross, $47.263 million net for the following services:
2. City Council approve the 2016 service levels for Long-Term Care Homes & Services as outlined on pages 13 and 16 of this report, and associated staff complement of 2,372 positions.
Service:
Gross
($000s)
Net
($000s)
Community Based Program:
Long-Term Care Homes:
12,347.4
240,392.3
1,395.3
45,867.7
Total Program Budget 252,739.7 47,263.0
2016 Operating Budget Long-Term Care Homes & Services
toronto.ca/budget2016 Page 5
Part I: 2016 – 2018
Service Overview and
Plan

2016 Operating Budget Long-Term Care Homes & Services
toronto.ca/budget2016 Page 6
Program Map

2016 Operating Budget Long-Term Care Homes & Services
toronto.ca/budget2016 Page 7
Table 1
2016 Preliminary Operating Budget and Plan by Service
The Long-Term Care Homes & Services' 2016 Preliminary Operating Budget is $252.739 million gross and $47.263 million net, representing a 2.3% increase over the 2015 Approved Net Operating Budget and includes reductions to achieve the reduction target as set out in the 2016 Operating Budget Directions and Guidelines.
Base pressures in the Long-Term Care Homes service are due to the re-opening of Kipling Acres Phase II facility ($1.529 million net), known salary and benefit adjustments ($0.418 million net) as well as other corporate inflationary increases that are driving the overall costs for the Program.
The above pressures were partially mitigated by revenue adjustments due to increased accommodation fees (basic and preferred) of $0.828 million and efficiency savings of $0.518 million net.
Approval of the 2016 Preliminary Operating Budget will result in Long-Term Care Homes & Services increasing its total staff complement by 146.1 positions from 2,225.9 to 2,372.0
The 2017 and 2018 Plan increases are attributable to the annualized impact of adding 115.6 positions for Kipling Acres Phase II.
Incremental Change
2017 and 2018 Plan
(In $000s)
Approved
Budget
Projected
Actual 2016 Base
2016
New/Enhanced 2016 Budget
By Service $ $ $ $ $ $ % $ % $ %
Communtiy Based Long-
Term Care
Gross Expenditures 12,183.8 12,183.8 12,347.4 12,347.4 163.6 1.3% 6.7 0.1% 23.4 0.2%
Revenue 10,788.5 10,788.5 10,952.1 10,952.1 163.6 1.5%
Net Expenditures 1,395.3 1,395.3 1,395.3 1,395.3 0.0 0.0% 6.7 0.5% 23.4 1.7%
Long Term Care Homes
Gross Expenditures 229,954.8 229,988.3 240,392.3 240,392.3 10,437.5 4.5% 3,114.2 1.3% 860.4 0.4%
Revenue 185,154.1 185,154.2 194,524.6 194,524.6 9,370.5 5.1% 1,866.3 1.0%
Net Expenditures 44,800.7 44,834.1 45,867.7 45,867.7 1,067.0 2.4% 1,247.9 2.7% 860.4 1.8%
Total
Gross Expenditures 242,138.6 242,172.1 252,739.7 252,739.7 10,601.1 4.4% 3,120.9 1.2% 883.8 0.3%
Revenue 195,942.6 195,942.7 205,476.7 205,476.7 9,534.1 4.9% 1,866.3 0.9%
Total Net Expenditures 46,196.0 46,229.4 47,263.0 47,263.0 1,067.0 2.3% 1,254.6 2.7% 883.8 1.8%
Approved Positions 2,225.9 2,225.9 2,372.0 2,372.0 146.1 6.6%
2015 2016 Operating Budget
2016 vs. 2015 Budget
Approved Changes 2017 2018

2016 Operating Budget Long-Term Care Homes & Services
toronto.ca/budget2016 Page 8
Table 2
Key Cost Drivers
Key cost drivers for Long-Term Care Homes & Services are discussed below:
Salaries and Benefits
Non-union progression pay, union step increases and other known salary adjustments of $0.418 million net are included in 2016. COLA is not included as it is subject to collective bargaining.
Other Base Changes account for $2.413 million net in base budget pressures as follows:
The Kipling Acres Phase II is scheduled to be completed on budget in May 2016, and 145 beds held in abeyance during construction, will be returned to service requiring 115.6 new positions, resulting in an operating impact of $1.529 million net.
Resident acuity and associated service level standards will be fully funded by the Province. This funding will allow LTCHS to respond to higher levels of service, more complex interventions and provide additional registered and non-registered personnel in order to maintain service levels that are consistent with the rising care needs of residents.
(In $000s) $ Position $ Position $ Position
Gross Expenditure Changes
Economic Factors
Corporate Economic Factors (Utilities, Contracted Services) 0.1 547.9 548.0
Salaries and Benefits
Progression Pay, Salary Increase (Step Included) and
Benefits Adjustments30.3 0.1 387.3 (0.1) 417.6
Other Base Changes
IDC/IDR's (Solid Waste, Children Services, Parks, Forestry &
Recreation, Facilities, Real Estate, Environment & Energy)(0.4) (64.3) (64.7)
Kipling Acres - Return to Service of 145 Beds (8 months) 6,949.8 115.6 6,949.8 115.6
Resident Acuity and Service Level Standards 2,618.0 30.9 2,618.0 30.9
Wage Enhancement for Personal Support Workers (PSW) 133.6 133.6
2016 Leap Year Impact 517.2 517.2
Total Gross Expenditure Changes 163.6 0.1 10,955.9 146.4 11,119.5 146.5
Revenue Changes (Increase) / Decrease
Increase in User Fees (30.0) (798.1) (828.1)
IDC/IDR's (Solid Waste, Children Services, Parks, Forestry &
Recreation, Facilities, Real Estate, Environment & Energy)(16.9) (16.9)
Kipling Acres - Return to Service of 145 Beds (8 months) (5,420.3) (5,420.3)
Resident Acuity and Service Level Standards (2,618.0) (2,618.0)
Wage Enhancement for Personal Support Workers (PSW) (133.6) (133.6)
2016 Leap Year Impact (413.8) (413.8)
Tax Stabilization funding for Leap Year Cost (103.4) (103.4)
Total Revenue Changes (163.6) (9,370.5) (9,534.1)
Net Expenditure Changes 0.0 0.1 1,585.4 146.4 1,585.4 146.5
Total
2016 Base Budget
Community Based Long-
Term Care Long-Term Care Homes
2016 Operating Budget

2016 Operating Budget Long-Term Care Homes & Services
toronto.ca/budget2016 Page 9
2016 Leap year one-time adjustment was included to account for the 24 hours per day, 7 days per week operations at the long-term care homes. This one-time increase will be funded from the Tax Stabilization Reserve.
Revenue Changes:
LTCHS will adjust its basic and preferred accommodation rates as set out in provincial regulations which will result in $0.828 million in additional revenues.
In order to offset the above net pressures, the 2016 service cost changes included for Long-Term Care Homes consists of efficiency savings of $0.518 million as shown in the table below.
Table 3
2016 Preliminary Service Change Summary
Service Efficiencies (Savings of $0.518 million gross & $0.518 million net)
Operating Efficiencies – Rationalize and Economize Resources
The Program conducted a thorough line by line expenditure review to reflect actual historical expenditures. These reductions will have no impact on service levels.
Operating Efficiencies – Consolidate & Streamline Operations
The Program will streamline its operations through the consolidation of administrative work, resulting in savings of $0.110 million gross, net and a reduction of 0.43 FTE.
$ $ #
Gross Net Gross Net Gross Net Pos. Net Pos. Net Pos.
Service Efficiencies
Operating Efficiencies - Rationalize and Economize
Resources(408.1) (408.1) (408.1) (408.1)
Operating Efficiencies - Consolidate & Streamline
Operations(110.4) (110.4) (110.4) (110.4) (0.4) 7.0 4.4
Sub-Total (518.5) (518.5) (518.5) (518.5) (0.4) 7.0 4.4
Total Changes (518.5) (518.5) (518.5) (518.5) (0.4) 7.0 4.4
2017 Plan 2018 Plan
2016 Service Changes Total Service Changes
Description ($000s)
Community
Based Long-Term
Care
Long-Term Care
Homes
Incremental Change

2016 Operating Budget Long-Term Care Homes & Services
toronto.ca/budget2016 Page 10
Table 5
2017 and 2018 Plan by Program
Future year incremental costs are primarily attributable to the following:
Known Impacts:
Progression pay, step and fringe benefits increases will result in increased pressure of $0.181 million net in 2017 and $0.857 million net in 2018. Since 2016 is a collective bargaining year, no estimate of cost of living allowance is included.
The re-opening of 145- bed home requires 115.6 new positions in 2016 with an annualized impact in 2017 and 2018 as shown in the table above. These estimates do not include provision for COLA which is subject to negotiations.
The rise in Resident Acuity and Service Level Standards will increase by $0.008 million and $0.022 million in 2017 and 2018 respectively.
Description ($000s)
Gross
Expense Revenue
Net
Expense
%
Change
#
Positions
Gross
Expense Revenue
Net
Expense
%
Change
#
Positions
Known Impacts:
Salary and Benefit Changes 181.6 181.6 14.5% 857.0 857.0 0.0%
IDC/IDR for West Acres Facility Rental at Kipling Acres 8.5 (8.5) (0.7%)
Kipling Acres - Return to Service of 145 Beds 3,140.0 2,375.0 765.0 61.0%
Resident Acuity and Service Level Standards 8.5 8.5 0.7% 22.3 22.3 0.0%
Reversal of 2016 Leap Year Impact (517.2) (413.8) (103.4) (8.2%)
Other 6.7 6.7 0.5% 4.4 4.4 0.0%
Economic Factors
Divisional Economic Factors ( mainly utilities and contracted
services)300.9 300.9 24.0%
Revenue
Reversal of Tax Stabilization for one extra day in 2016 (103.4) 103.4 8.2%
Total Incremental Impact 3,120.5 1,866.3 1,254.2 0.0% 883.7 883.7 0.0%
2017 - Incremental Increase 2018 - Incremental Increase

2016 Operating Budget Long-Term Care Homes & Services
toronto.ca/budget2016 Page 11
Part II: 2016 Budget by Service
S Community Bas

2016 Operating Budget Long-Term Care Homes & Services
toronto.ca/budget2016 Page 12
What We Do
Provide quality care and services to improve or maintain the independence and quality of life of clients that may be isolated, vulnerable or would otherwise not be able to live independently in their homes.
Provide day-time wellness programming, recreation and social activities for frail seniors living in the community.
Provide supportive housing services such as light housekeeping and laundry, light meal preparation to eligible clients who are tenants in the nine designated supportive housing sites across the City.
2016 Service Budget by Activity ($Ms)
Service by Funding Source ($Ms)
Customer Satisfaction Rate
Community Based Programs
Homemakers & Nurses Services
Adult Day Program
Supportive Housing Services
Adult Day Program, $1.2, 9%
Homemakers & Nurses Services,
$5.9, 48%
Supportive Housing Services, $5.3, 43%
$12.4 Million
Provincial Subsidies,
$10.7, 87%
User Fees & Donations,
$0.2,2%
Property Tax,
$1.4, 11%
$12.4 Million
2014 Actual2015 Projected
Actual2016 Target 2017 Plan 2018 Plan
Homemakers & Nurses Services 97% 95% 95% 95% 95%
Adult Day Program 97% 95% 95% 95% 95%
Supportive Housing Services 98% 95% 95% 95% 95%
93.5%
94.0%
94.5%
95.0%
95.5%
96.0%
96.5%
97.0%
97.5%
98.0%
98.5%
LTCHS performs surveys for clients to assess their level of satisfaction with services provided by the Program.
The levels of satisfaction for the 3 activities included in the Community Based Program are expected to remain at or above the 95% divisional threshold for the next 3 years.

2016 Operating Budget Long-Term Care Homes & Services
toronto.ca/budget2016 Page 13
2016 Service Levels
Community Based Programs
The 2016 Service Levels for Community Based Program Service are consistent with 2015 approved Service Levels.
Service Performance Number of clients served
Number of visits (client days)
Activity Type Status 2012 2013 2014 2015 2016
Adult Day Program Adult Day Services
Approved
Supportive
Housing Services
Personal Care and
Homemaking
Approved
Homemakers &
Nurses Services Homemaking
Approved
Service Availability (Supportive
Housing Services): 24 hours/day, 365
day/year
Service Availability (Homemakers &
Nurses Services): Mon-Fri, 52
weeks/year
Service Availability (Adult Day
Programs): Mon-Fri, 52 weeks/year
Mon-Fri, 52 Weeks/year
Mon-Fri, 52 Weeks/year
24 hours/day, 365 day/year
2014 Actual
2015
Projected Actual
2016 Target 2017 Plan 2018 Plan
Homemakers and Nurses Services 2,760.0 2,600.0 2,600.0 2,600.0 2,600.0
Adult Day Programs 175 160 160 160 160
Supportive Housing Services 501 525 525 525 525
-
500.0
1,000.0
1,500.0
2,000.0
2,500.0
3,000.0
2014 Actual
2015
Projected Actual
2016 Target 2017 Plan 2018 Plan
Homemakers and Nurses Services (visits) 89,310 86,000 86,000 86,000 86,000
Adult Day Programs (days) 14,182 14,000 14,000 14,000 14,000
Supportive Housing Services (days) 166,407 165,550 165,550 165,550 165,550
-
20,000
40,000
60,000
80,000
100,000
120,000
140,000
160,000
180,000
The number of clients served in the Homemakers & Nurses Services and Adult Day Programs are expected to be maintained at 2014 levels which are expected to continue in 2017 and 2018.
The number of client visits in Homemakers & Nurses Services, Adult day Programs and Supportive Housing Service will be maintained at 2014 levels. The 2015 levels will be maintained throughout 2018.

2016 Operating Budget Long-Term Care Homes & Services
toronto.ca/budget2016 Page 14
Table 6
2016 Preliminary Service Budget by Activity
The Community Based Programs provides quality care and services to improve or maintain the independence and quality of life of individuals living in the community. These services are an essential part of the continuum of care that is available to residents to ensure they receive the right level of care at the right time and in the right place.
The 2016 Preliminary Operating Budget of $12.347 million gross and $1.395 million net for this service is flat to the 2015 Approved Net Budget.
Base pressures are primarily attributed to known salary and benefit adjustments which have been partially offset by increased client fees.
MOHLTC and LHIN will provide additional funding of $0.133 million to support the final phase of the hourly wage increase for the Personal Support Workers (PSWs) that work in the community care sector. The MOHLTC increased the hourly rate for community agency personal support workers by $4.00. The initiative will be fully funded by the province with no impact to the City.
Incremental Change
Approved
Budget
Base
Budget
Service
Changes 2016 Base
Base
Budget vs.
2015
Budget % Change
New/
Enhanced
2016
Budget
($000s) $ $ $ $ $ % $ $ $ % $ % $ %
GROSS EXP.
Adult Day Program 1,557.9 1,587.9 1,587.9 30.0 1.9% 1,587.9 30.0 1.9% 2.5 0.2% 5.6 0.4%
Homemakers & Nurses Services 5,471.6 5,471.6 5,471.6 5,471.6 3.2 0.1% 10.9 0.2%
Supportive Housing Services 5,154.3 5,287.9 5,287.9 133.6 2.6% 5,287.9 133.6 2.6% 1.1 0.0% 6.8 0.1%
Total Gross Exp. 12,183.8 12,347.4 12,347.4 163.6 1.3% 12,347.4 163.6 1.3% 6.7 0.1% 23.4 0.2%
REVENUE
Adult Day Program 1,557.9 1,587.9 1,587.9 30.0 1.9% 1,587.9 30.0 1.9%
Homemakers & Nurses Services 4,076.3 4,076.3 4,076.3 4,076.3
Supportive Housing Services 5,154.3 5,287.9 5,287.9 133.6 2.6% 5,287.9 133.6 2.6%
Total Revenues 10,788.5 10,952.1 10,952.1 163.6 1.5% 10,952.1 163.6 1.5%
NET EXP.
Adult Day Program 2.5 5.6
Homemakers & Nurses Services 1,395.3 1,395.3 1,395.3 1,395.3 3.2 0.2% 10.9 0.8%
Supportive Housing Services 1.1 6.8
Total Net Exp. 1,395.3 1,395.3 1,395.3 1,395.3 6.7 0.5% 23.4 1.6%
Approved Positions 44.1 44.2 (1.1) 43.1 (1.0) (2.3%) 43.1 (1.0) (2.3%)
2015 2016 Operating Budget
2016 Budget vs. 2015
Budget 2017 Plan 2018 Plan

2016 Operating Budget Long-Term Care Homes & Services
toronto.ca/budget2016 Page 15
Long-Term Care Homes
What We Do
Provide continuum of long-term care and services for residents with various diagnoses and multiple degrees of physical frailties, cognitive impairments and complex care needs.
Provide a short-stay admission program, stroke rehabilitation, convalescent care programs, specialized behavioural support services.
2016 Service Budget by Activity ($Ms)
Service by Funding Source ($Ms)
Number of bed days
Long-Term Care Homes
Long Term Care Homes, $240.3, 100%
$240.3 Million
Inter-Divisional Recoveries,
$0.09,
0%
Provincial Subsidies,$142.9
60%
Sundry and Other
Revenues,$0.1
0%
Property Tax, $45.8,
19%
Transfers From Capita, $0.2,
0%
User Fees & Donations,$50.9,
21%
$240.3 Million
2014 Actual 2015 Projected Actual 2016 Target 2017 Plan 2018 Plan
# of Bed Days 911,040 911,040 966,606 963,965 963,965
880,000
900,000
920,000
940,000
960,000
980,000
The total number of bed days available for use by long-term care homes residents will increase in 2016 due to it being a leap year as well as a result of the re-opening of 145-bed Kipling Acres long-term care home.

2016 Operating Budget Long-Term Care Homes & Services
toronto.ca/budget2016 Page 16
2016 Service Levels
Long-Term Care Homes
The 2016 Service Levels are consistent with the approved 2015 Service Levels for Long-Term Care Homes Service.
Service Performance Occupancy Rate for Long-Stay Program
Occupancy Rate for Convalescent Care Program (CCP)
Activity Type Status 2012 2013 2014 2015 2016
Resident Care -
Long Stay
Approved
Resident Care -
Short Stay
Approved
Convalescent Care Approved
Behavioural
Support Care
Approved
Service Availability (Long-Term Care
Homes): 24 hours/day, 365 days/year
97% Occupancy
50% Occupancy
80% Occupancy
2014 Actual2015 Projected
Actual2016 Target 2017 Plan 2018 Plan
% Occupancy - long stay 98% 97% 97% 97% 97%
96%
97%
97%
97%
97%
97%
98%
98%
98%
98%
2014 Actual2015 Projected
Actual2016 Target 2017 Plan 2018 Plan
% Occupancy - Convalescent care 80% 80% 80% 80% 80%
0%
10%
20%
30%
40%
50%
60%
70%
80%
90%
The occupancy rate for the long-stay program will remain at 97% for the next 3 years.
The occupancy rate for the Convalescent Care Program (CCP) will be maintained at 80% for the next 3 years.
The Convalescent Care Program provides 24-hour care to seniors who require specific medical and therapeutic services in a supportive environment for a period of up to 90 continuous days.

2016 Operating Budget Long-Term Care Homes & Services
toronto.ca/budget2016 Page 17
Table 6
2016 Preliminary Service Budget by Activity
Long-Term Care Homes provides a variety of long-term health care services for residents and actively participate in creating an integrated healthcare system through strong partnerships with other stakeholders and community partners.
The Long-Term Care Homes' 2016 Preliminary Operating Budget of $240.392 million gross and $45.867 million net is $1.067 million or 2.4% over the 2015 Approved Net Budget.
Base budget pressures in Long-Term Care Homes service are primarily due to the following:
Re-opening of Kipling Acres 145 bed long-term care home in May 2016, will result in operating
impact of $6.949 million gross, $1.529 million net for operating the new home.
The additional non-payroll costs of $0.103 million to operate 1 extra day in 2016 to be funded on a
one-time basis from the Tax Stabilization Reserve Fund.
Other base pressures arising from salary and benefit adjustments and inflationary increases in non-payroll expenditures were partially offset by base expenditure reductions, efficiency savings as well as accommodation fee adjustments to resident fees for basic and preferred accommodations.
Incremental Change
Approved
Budget Base Budget
Service
Changes 2016 Base
Base Budget
vs. 2015
Budget % Change
New/
Enhanced 2016 Budget
($000s) $ $ $ $ $ % $ $ $ % $ % $ %
GROSS EXP.
Long Term Care Homes 229,954.8 240,910.8 (518.5) 240,392.3 10,437.5 4.5% 240,392.3 10,437.5 4.5% 3,114.2 1.3% 860.4 0.4%
Total Gross Exp. 229,954.8 240,910.8 (518.5) 240,392.3 10,437.5 4.5% 240,392.3 10,437.5 4.5% 3,114.2 1.3% 860.4 0.4%
REVENUE
Long Term Care Homes 185,154.1 194,524.6 194,524.6 9,370.5 5.1% 194,524.6 9,370.5 5.1% 1,866.3 1.0%
Total Revenues 185,154.1 194,524.6 194,524.6 9,370.5 5.1% 194,524.6 9,370.5 5.1% 1,866.3 1.0%
NET EXP.
Long Term Care Homes 44,800.7 46,386.2 (518.5) 45,867.7 1,067.0 2.4% 45,867.7 1,067.0 2.4% 1,247.9 2.7% 860.4 1.8%
Total Net Exp. 44,800.7 46,386.2 (518.5) 45,867.7 1,067.0 2.4% 45,867.7 1,067.0 2.4% 1,247.9 2.7% 860.4 1.8%
Approved Positions 2,181.8 2,328.2 0.7 2,328.9 147.1 6.7% 2,328.9 147.1 6.7% 0.0%
2015 2016 Operating Budget
2016 Budget vs. 2015
Budget 2017 Plan 2018 Plan

2016 Operating Budget Long-Term Care Homes & Services
toronto.ca/budget2016 Page 18
Part III: Issues for Discussion
2016 Operating Budget Long-Term Care Homes & Services
toronto.ca/budget2016 Page 19
Issues for Discussion Issues Impacting 2016 Budget
Provincial Funding Uncertainty
As the provider of a wide range of long-term care services to diverse clients, LTCHS faces several challenges resulting from a complex and variable funding model. MOHLTC funding fluctuates from year-to-year requiring the Program to aggressively pursue all available grants, subsidies and revenues making in-year service adjustments as necessary.
The 2016-2020 Long-Term Care Homes & Services (LTCHS) Service Plan approved by City Council in November 2015 focuses on three priority areas: delivering exemplary care and services through a continuum of care; serving vulnerable individuals and responding to emerging community needs; and leading advances in long-term care and support services to seniors.
LTCHS serves a diverse population, from young adults with severe disabilities to seniors with cognitive impairments, medical complexities and behavioural challenges. Aging demographics, rising acuity and demand for specialized services requires an investment in increased training, specialized services and new approaches to care.
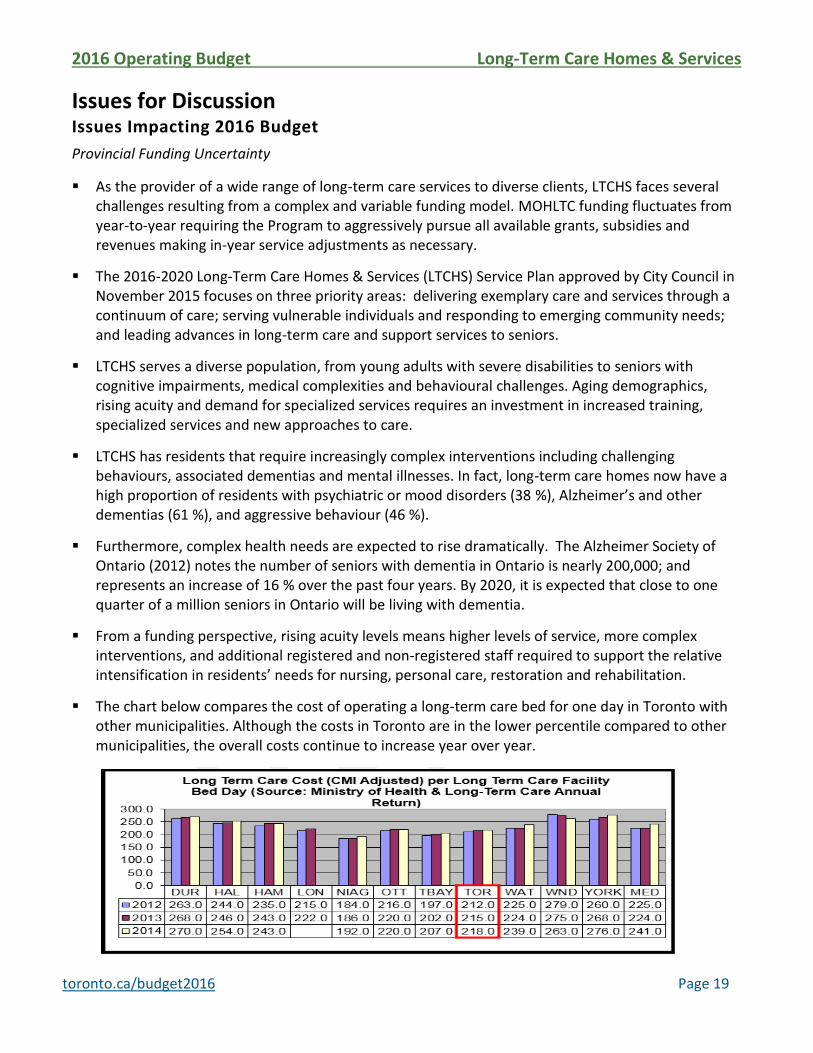
LTCHS has residents that require increasingly complex interventions including challenging behaviours, associated dementias and mental illnesses. In fact, long-term care homes now have a high proportion of residents with psychiatric or mood disorders (38 %), Alzheimer’s and other dementias (61 %), and aggressive behaviour (46 %).
Furthermore, complex health needs are expected to rise dramatically. The Alzheimer Society of Ontario (2012) notes the number of seniors with dementia in Ontario is nearly 200,000; and represents an increase of 16 % over the past four years. By 2020, it is expected that close to one quarter of a million seniors in Ontario will be living with dementia.
From a funding perspective, rising acuity levels means higher levels of service, more complex interventions, and additional registered and non-registered staff required to support the relative intensification in residents’ needs for nursing, personal care, restoration and rehabilitation.
The chart below compares the cost of operating a long-term care bed for one day in Toronto with other municipalities. Although the costs in Toronto are in the lower percentile compared to other municipalities, the overall costs continue to increase year over year.

2016 Operating Budget Long-Term Care Homes & Services
toronto.ca/budget2016 Page 20
The increasing needs in the communities are pushing service demands upwards that will require increased levels of Provincial funding or alternate funding sources and support through new partnerships. Ongoing sustainable level of provincial funding is critical to address the rise in acuity as well as the growing demand for specialized services.
The 2016 Preliminary Operating Budget includes enhanced funding from the Province to address some of the challenges stated above. $7.465 million increase Provincial subsidies is included to address base pressures and is subject to confirmation through the 2016 Provincial Budget. Expenditures will not be incurred until the funding is confirmed and received by the MOHLTC.
The 2016 Preliminary Operating Budget includes additional funding of $2.618 million gross, $0 net and 30.92 positions – (8.32 permanent F/T and 22.6 permanent P/T) to address rising acuity pressures. The $2.618 million will be fully funded by the MOHLTC with no net impact to the City.
LTCHS will continue to advocate for increased Provincial funding and pursue other funding opportunities and partnerships for additional programs, services and specialized units to fulfill its mandate and to continue to meet the increasingly complex community needs.
Kipling Acres Redevelopment Update - "Major Capital Project"
The Kipling Acres redevelopment project ($102.000 million gross/$55.777 million debt) was developed in two phases (the 192-beds and 145-beds), on the existing site. Upon completion, the redevelopment will provide beds for 337 residents, the same number of beds in the reconstructed facility as were provided prior to the reconstruction.
The timing of the reconstruction in the original project plan was based on the re-opening of the 192-bed home in 2013, followed by the re-opening of 145 bed Phase II of the home in 2016. The anticipated operating impacts resulting from the re-opening of the 145 bed addition was originally planned to be offset by the savings resulting from the elimination of the nursing staff shift overlap, which produced savings of $2.176 million between 2013 and 2015.
However, the construction of the 192-bed home was delayed, resulting in occupancy for residents in 2014. Consequently, the construction of the 145-bed addition was delayed and is now scheduled to re-open in May 2016 adding net operating cost pressure of $1.529 million in 2016 stemming from the need to add 115.6 positions to operate the home. The annualized impact of adding these positions in 2017 is estimated at $0.765 million net.
Issues Referred to the Budget Process
New/Enhanced Priorities
At its meeting of November 3rd, 2015, City Council adopted EX 9.5 “TO Prosperity: Toronto Poverty Reduction Strategy" which included the recommendation to implement the 2016 Annual Work Plan and recommended several initiatives with financial impacts to the City Manager for consideration as part of the 2016 Budget Process. http://app.toronto.ca/tmmis/viewAgendaItemHistory.do?item=2015.EX9.5
The 2016 Annual Work Plan included in the Strategy called for 1 enhanced priority for LTCHS namely "Expansion of the Homemakers and Nurse Services (HMNS)" to increase the capacity of the

2016 Operating Budget Long-Term Care Homes & Services
toronto.ca/budget2016 Page 21
existing program by 31,200 additional hours of homemaking services to reach 400 additional clients.
The above initiative is not included in the 2016 Preliminary Budget for LTCHS, however it is included for Council's consideration as part of the list of New/Enhanced requests referred to the Budget process to be distributed for Budget Committee's consideration in the 2016 Budget process.
Net Positions Net Positions
Not IncludedReferred to the Budget Process
Poverty Reduction Strategy - Expansion of the
Homemakers and Nurses Services (HMNS)750.0 600.0 150.0
Total New/Enhanced Services (Not Included) 750.0 600.0 150.0 0.0 0.0 0.0 0.0 0.0
New / Enhanced Service Description ($000s)
2016 Impact Net Incremental Impact
Gross Revenue Net Positions
2017 Plan 2018 Plan
2016 Operating Budget Long-Term Care Homes & Services
toronto.ca/budget2016 Page 22
Appendices:

2016 Operating Budget Long-Term Care Homes & Services
toronto.ca/budget2016 Page 23
Appendix 1
2015 Service Performance
2015 Key Service Accomplishments
In 2015, Long-Term Care Homes & Services accomplished the following:
Enhanced care and services based on best practice information.
Continued to expand the division's ability to serve individuals who are frequently unable to secure care and service through other providers (e.g. significant dementia, behavioural response issues, more complex care, specialized care and service).
Developed 5-year service plan that details strategies and actions to improve and prioritize long-term care services provided by the City of Toronto.
Hosted a bilingual Senior's Wellness Symposium to increase awareness of the services and programs available to francophones and bilingual speaking individuals, community agencies and health-care providers in the Toronto area.
Celebrated 40 years of service at Castleview Wychwood Towers and 25 years of service at Seven Oaks and at Lakeshore Lodge.
Hosted Residents' Summits for 228 long-term care residents to network, share and learn from guest speakers and educational presentations.
Made presentations at Accreditation Canada Quality Conference to national attendees on three (3) topics: Reducing Medication Interruptions, Implementing Effective Strategies to Reduce Restraint and Reducing the Potential of an Outbreak.
Excellence in Volunteering Awards presented and celebration of support by approximately 2,200 people of all ages, neighborhoods and backgrounds that support the division by giving their time, energy, skills and passion to enhance the lives of residents and clients. 134,000 hours of volunteer service supports a variety of programs, such as recreation programs, gift shops, cultural and religious activities, outings and fundraising.
Support for leadership excellence in healthy aging through continuous improvement, customer service, education, innovation, research, teamwork, partnerships and technology.
Participated as an early adopter in ConnectingGTA, an electronic portal for healthcare service providers which allows clinicians to provide better, timelier and more coordinated care by sharing hospital reports, community documentation, imaging reports and lab data.

2016 Operating Budget Long-Term Care Homes & Services
toronto.ca/budget2016 Page 24
Appendix 2
2016 Preliminary Operating Budget by Expenditure Category
Program Summary by Expenditure Category
For additional information regarding the 2015 Q3 operating variances and year-end projections, please refer to the attached link for the report entitled "Operating Variance Report for the Nine-Month Period Ended September 30, 2015" approved by City Council at its meeting on December 9, 2015.
http://app.toronto.ca/tmmis/viewAgendaItemHistory.do?item=2015.BU13.6
Impact of 2015 Operating Variance on the 2016 Preliminary Budget
As the projected savings in 2015 are only one-time, there is no impact of the 2015 Operating Variance on the 2016 Operating Budget.
2015 2016
2013 2014 2015 Projected Budget
Category of Expense Actual Actual Budget Actual * 2017 2018
($000's) $ $ $ $ $ $ % $ $
Salaries And Benefits 183,149.9 185,220.0 197,781.3 190,201.2 206,804.9 9,023.6 4.6% 209,624.9 210,508.7
Materials & Supplies 17,745.9 19,037.2 18,590.2 18,590.2 19,819.8 1,229.6 6.6% 20,120.7 20,120.7
Equipment 3,195.0 936.2 2,873.4 2,293.4 2,877.5 4.1 0.1% 2,877.5 2,877.5
Service And Rent 15,658.9 18,731.1 20,187.4 19,102.3 20,612.5 425.1 2.1% 20,612.5 20,612.5
Contribution To Reserves/Reserve Funds 1,809.4 1,809.4 1,901.5 1,901.5 1,901.5 1,901.5 1,901.5
Other Expenditures 79.0 191.7 114.9 114.9 98.3 (16.6) (14.4%) 98.3 98.3
Inter-Divisional Charges 579.3 600.1 689.9 689.9 625.2 (64.7) (9.4%) 625.2 625.2
Total Gross Expenditures 222,217.4 226,525.7 242,138.6 232,893.4 252,739.7 10,601.1 4.4% 255,860.7 256,744.4
Inter-Divisional Recoveries 123.0 69.1 72.8 72.8 89.7 16.9 23.2% 98.2 98.2
Provincial Subsidies 129,778.3 135,275.6 146,819.1 138,406.5 153,683.8 6,864.7 4.7% 155,645.0 155,645.0
User Fees & Donations 48,087.9 48,497.0 48,652.7 48,652.7 51,200.8 2,548.1 5.2% 51,200.8 51,200.8
Licences & Permits Revenue
Transfers From Capital 260.0 260.0 260.0 260.0 260.0
Contribution From Reserves/Reserve Funds 138.0 103.4 103.4
Sundry and Other Revenues 290.2 312.0 138.0 139.0 1.0 0.7% 139.0 139.0
Total Revenues 178,279.4 184,153.7 195,942.6 187,530.0 205,476.7 9,534.1 4.9% 207,343.0 207,343.0
Total Net Expenditures 43,938.0 42,372.0 46,196.0 45,363.4 47,263.0 1,067.0 2.3% 48,517.6 49,401.4
Approved Positions 2,151.3 2,179.7 2,225.9 2,225.9 2,372.0 146.1 6.6% 2,372.0 2,372.0 * Based on the 9-month Operating Variance Report
2016 Change from
2015 Approved
Budget
Plan

2016 Operating Budget Long-Term Care Homes & Services
toronto.ca/budget2016 Page 25
Appendix 3
2016 Organization Chart
2016 Complement
General Manager (1.0)
# of Reports 2,371.0
Policy Planning & Project Consultant
(1.0)
Director, Resident Care & Services
(1.0)# of Reports 40.9
Managers(5.0)
# of Reports 35.9
Supervisor(2.0)
# of Reports 33.9
Director, Long-Term Care Homes
(1.0)# of Reports 2,282.2
Managers (128.5)
# of Reports 2,153.7
Supervisors (8.0)
# of Reports 2,145.7
Director, Management Services
(1.0)
# of Reports 32.0
Managers(5.0)
# of Reports 27.0
Supervisors(2.0)
# of Reports 25.0
Manager, Program & Strategic Support
(1.0)# of Reports 7.0
Manager, People Services
(1.0)# of Reports 1.0
Admin Assistant(1.0)
Category
Senior
Management Management
Exempt
Professional &
Clerical Union Total
Permanent 1.0 164.6 2.0 2,204.4 2,372.0
Temporary
Total 1.0 164.6 2.0 2,204.4 2,372.0

2016 Operating Budget Long-Term Care Homes & Services
toronto.ca/budget2016 Page 26
Appendix 4
Summary of 2016 Service Changes

2016 Operating Budget Long-Term Care Homes & Services
toronto.ca/budget2016 Page 27
Appendix 6
Inflows/Outflows to/from Reserves & Reserve Funds
Program Specific Reserve / Reserve Funds
Corporate Reserve / Reserve Funds
2016 2017 2018
$ $ $ $
Projected Beginning Balance 5,539.0 4,338.0 3,185.0
Homes for the Aged XR2103 3,682.0
Withdrawls (-) (1,650.0) (2,556.0) (2,508.0) (2,038.0)
Contributions (+) 3,507.0 1,355.0 1,355.0 1,355.0
5,539.0 4,338.0 3,185.0 2,502.0
Other Program / Agency Net Withdrawals & Contributions
Balance at Year-End 5,539.0 4,338.0 3,185.0 2,502.0
* Based on 9-month 2015 Reserve Fund Variance Report
Reserve /
Reserve Fund
Number
Projected
Balance as of
Dec. 31, 2015 *
Withdrawals (-) / Contributions (+)
Reserve / Reserve Fund Name (In $000s)
Total Reserve / Reserve Fund Draws / Contributions
2016 2017 2018
$ $ $ $
Projected Beginning Balance 25,335.0 26,821.5 28,308.0
Insurance Reserve XR1010 25,335.0
Contributions (+) 1,486.5 1,486.5 1,486.5
25,335.0 26,821.5 28,308.0 29,794.5
Other Program / Agency Net Withdrawals & Contributions
Balance at Year-End 25,335.0 26,821.5 28,308.0 29,794.5
* Based on 9-month 2015 Reserve Fund Variance Report
Total Reserve / Reserve Fund Draws / Contributions
Reserve /
Reserve Fund
Number
Projected
Balance as of
Dec. 31, 2015 *
Withdrawals (-) / Contributions (+)
Reserve / Reserve Fund Name (In $000s)