Operating Budget for Fiscal Year 2022 - myUSF
27
Operating Budget for Fiscal Year 2022 For Consideration by the Board of Trustees March 26, 2021
Transcript of Operating Budget for Fiscal Year 2022 - myUSF

Operating Budget for
Fiscal Year 2022 For Consideration by the Board of Trustees March 26, 2021

University of San Francisco March 16, 2021 FY 2022 Operating Budget Page 1
Executive Overview Purpose of Report
The purpose of this report is to review the fiscal year 2022 operating budget of the University of San Francisco and to
recommend its approval by the Board of Trustees. The Center for Institutional Planning and Effectiveness (CIPE) prepared this
report and the budget therein in consultation with the executive officers of the University, its Leadership Team, and the
University Budget Advisory Council (UBAC).
The report outlines budgeted revenue and expense categories and details the spending plan for fiscal year 2022 using updated
enrollment targets and projections (as of March 1, 2021) and revenue forecasts, along with the Board’s approved tuition and
fee rates.
Recommendation
The proposed fiscal year 2022 unrestricted operating budget was approved by the President on March 5, 2021. The President
recommends that the Board of Trustees approves the proposed fiscal year 2022 unrestricted operating budget.
Process
Vice presidents approve unit plans, contractual increases, and planned reductions or changes, which are presented for
discussion and prioritization at the University Budget Advisory Council, Leadership Team and Cabinet meetings. The President
makes final funding decisions in consultation with the Provost.
The School of Law develops its own budget, which is reviewed by Law faculty and administrators under separate funding
policies. The Provost also reviews and approves this budget. The School of Law budget is included in this report as it is
incorporated into the University’s overall proposed fiscal year 2022 operating plan.

University of San Francisco March 16, 2021 FY 2022 Operating Budget Page 2
FY 2022 Operating Budget Highlights Tuition, room, and board increases ● Traditional undergraduate tuition increases by 1.9% (with tuition, fees, room, and board, the typical traditional
undergraduate student cost of education increase is 1.7%). ● The tuition increase for graduate programs varies by program. Generally, Arts & Sciences, Nursing & Health Professions,
and Management graduate tuition increases by 1.9%. The Master of Nonprofit Administration, the Master of Science in Information Systems and the Master of Public Administration programs will see tuition increases of 0.9%.
● Tuition rate increases for the School of Education and the School of Law will be 0.9%. ● Residence hall rates, and meal plan rates, increase by 0.9%. Enrollment projections of 9,941 student headcount and 262,785 student credit hours (SCHs) ● A decrease of 21,733 SCHs (a 7.6% decrease) from the FY 2021 base budget and a decrease of 6,559 SCHs (a 2.4%
decrease) from FY 2021 actuals (as of March 1, 2021). FY 2022 total operating budget is $470.0 million ● The tuition (net of exceptions) budget of $413.7 million decreases by $23.0 million, or 5.3%, from the FY 2021 base
budget* and decreases $2.3 million, or 0.5%, from FY 2021 forecasted actuals (as of March 5, 2021). ● The financial aid budget of $118.3 million decreases $6.1 million, or 4.9%, from the FY 2021 base budget and increases
$2.1 million, or 1.8%, from FY 2021 forecasted actuals. The University’s unfunded discount rate increases to 28.6% — up from 28.5% in the FY 2021 base budget and up from 27.9% with respect to FY 2021 forecasted actuals.
● The net tuition budget of $295.4 million decreases by $16.9 million, or 5.4%, from the FY 2021 base budget and decreases $4.4 million, or 1.5%, from FY 2021 forecasted actuals.
● The proposed FY21 budget includes anticipated centrally organized and/or unit savings of approximately $18.2 million. These cuts are being identified by management and will be implemented by, or around, the start of FY 2022.
*FY 2021 base budget is the budget that was drafted in March 2020, and incorporates management's base category savings in June 2020 and base adjustments.

University of San Francisco March 16, 2021 FY 2022 Operating Budget Page 3
FY 2022 University Non-Law planning priorities include:
Division Primary Unit Revenue Compensation FT FTE Expenditures Total DescriptionBusiness & Finance Division
Business & Finance ‐$ ‐$ ‐ 1,000,000 1,000,000$ University Insurance Premium IncreasesFacilities Management ‐$ 309,457$ 5.00 737,001 1,046,458$ Lone Mountain East Housing ‐ Facilities Related Expenses
Subtotal ‐$ 309,457$ 5.00 1,737,001$ 2,046,458$
ITS DivisionCIO ‐$ ‐$ ‐ 232,765 232,765$ FY22 ‐ Lone Mountain Residence Hall annual ongoing operational cost
Subtotal ‐$ ‐$ ‐ 232,765$ 232,765$
Marketing CommunicationsOffice Marketing Communications ‐ ‐ 120,000 120,000$ Media and Crisis Communications Consultant
Subtotal ‐$ ‐$ ‐ 120,000$ 120,000$
Provost DivisionNursing ‐$ 16,500$ 0.25 ‐ 16,500$ Operations AnalystNursing ‐$ 153,153$ 2.00 ‐ 153,153$ Sim and Lab Techs ‐ Two Staff LinesGleeson Library ‐$ ‐$ 13,572 13,572$ OCLC/INNOVATIVE & Other Library Systems Contractual Increases
Subtotal ‐$ 169,653$ 2.25 13,572$ 183,225$
Student Life DivisionStudent Life ‐$ ‐$ ‐ 25,500 25,500$ Student Life Contractual IncreasesStudent Achievement ‐$ ‐$ ‐ 12,555 12,555$ Black Achievement Success and Engagement (BASE) Program Staff and Faculty SupportStudent Development ‐$ 201,438$ 2.00 ‐ 201,438$ Title IX Staff Positions
Subtotal ‐$ 201,438$ 2.00 38,055$ 239,493$
UniversityUniversity ‐$ ‐$ ‐ 1,500,000 1,500,000$ University Reserves IncreaseUniversity ‐$ ‐$ ‐ 67,288 67,288$ Minimum Salaries for Exempt Employees in California for 2021
Subtotal ‐$ ‐$ ‐ 1,567,288$ 1,567,288$
Grand Total ‐$ 680,548$ 9.25 3,708,680$ 4,389,228$
University of San Francisco March 16, 2021 FY 2022 Operating Budget Page 4
New Academic Programs Within Their First Five Years of Operation:
● For FY 2022, the incremental expense budgets enumerated in the table above will be funded by reallocation of budgetary
resources within the Division of Academic Affairs rather than through the creation of new expense budgets.
● Reallocation will be achieved by cleaning up budgets associated with programs or cohorts that have been suspended or that have seen material declines in enrollment.
● These new academic programs, launched over the past five years, are projected to contribute $22,064,000 in net tuition (tuition net scholarships, and also net any Pearson Embanet revenue share).
● Law revenues increase by $66,000. Its net expenses decrease by $3.8 million. FY 2022 now sees a Law operating contribution of $3.8 million, a stark increase from the $0 in operating contribution budgeted for FY 2021.
● Student housing revenue increases by $6.0 million, with accompanying expense increases of $1.7 million. Dedicated reserves for student housing revenue are budgeted at $996,000 (3.0% of student housing revenue), an increase of $180,000 over its base budget of $816,000 in FY 2021. In support of the new Lone Mountain East residence hall, the debt servicing budget increases $7.1 million.
New and Continuing Academic Programs Salary & Benefit Faculty FTE Staff FTE Expenditure TotalComputer Science Bridge Program 598 ‐ ‐ (17,500) (16,902)$ MA International Studies 7,732 ‐ ‐ ‐ 7,732$ MS Applied Economics 11,200 ‐ ‐ (7,500) 3,700$ BS Engineering 111,010 ‐ 1.0 41,089 152,099$ MA Public Leadership (1,359) ‐ ‐ 85,725 84,366$ MA Migration Studies (39,571) ‐ ‐ 9,404 (30,167)$ MS Marketing Intell igence (256) ‐ ‐ 4,600 4,344$ MS Entrepreneurship and Innovation 3,551 ‐ ‐ ‐ 3,551$ PsyD Clinical Psychology (35,514) ‐ (2.5) 13,230 (22,284)$ Doctor of Nursing Practice (32,773) ‐ ‐ 69,140 36,367$ BSN Sacramento 27,442 ‐ 0.5 ‐ 27,442$ MSN Orange County 80,882 ‐ 0.8 ‐ 80,882$ Masters in Public Health ‐ Orange County 114,344 ‐ 0.5 (4,000) 110,344$ Executive Leadership DNP 27,533 ‐ ‐ 18,960 46,493$ Grand Total 274,817$ ‐ 0.3 213,148$ 487,965$

University of San Francisco March 16, 2021 FY 2022 Operating Budget Page 5
FY 2022 Unrestricted Operating Budget Creation Process Goal The primary goals of the budget creation process are (1) to align college-, school-, and division-level goals and activities with the vision, mission, and strategic priorities of the University and (2) to promote innovation that is reflected in both new academic programs and enrollment growth in existing academic offerings. While collecting and reviewing requests for new budget allocations, we strongly encourage academic and service units to fund reconfigured programs and required new costs through budget reallocation. FY 2022 Unrestricted Operating Budget Creation Process Highlights
● Non-tuition revenue items were identified by the responsible managers and reviewed by the vice presidents, University Budget Advisory Council, Cabinet, the Provost, and the President.
● Additional revenue and expense budget requests were submitted through the University’s online tool, Budget Assist, for consideration by unit and division leaders, as well as the University Budget Advisory Council, with ultimate funding decisions made by the President and the Provost.
● New capital requests were reviewed by the University Budget Advisory Council, Cabinet members, the Provost, and the President.
● Employee compensation was determined by contractual (or anticipated contractual) obligations with bargaining units, as well as the President’s directives concerning compensation for exempt staff and executives.
● Tuition revenue budgets were based on enrollment targets and projections (supplied by the Division of Academic Affairs), as well as Board-approved tuition rates. The Board of Trustees also approved the aforementioned enrollment targets and projections at its winter meeting.
● Institutional financial aid expenses were based on a combination of historical, forecasted, and targeted discount rates.

University of San Francisco March 16, 2021 FY 2022 Operating Budget Page 6

University of San Francisco March 16, 2021 FY 2022 Operating Budget Page 7
University of San Francisco March 16, 2021 FY 2022 Operating Budget Page 8
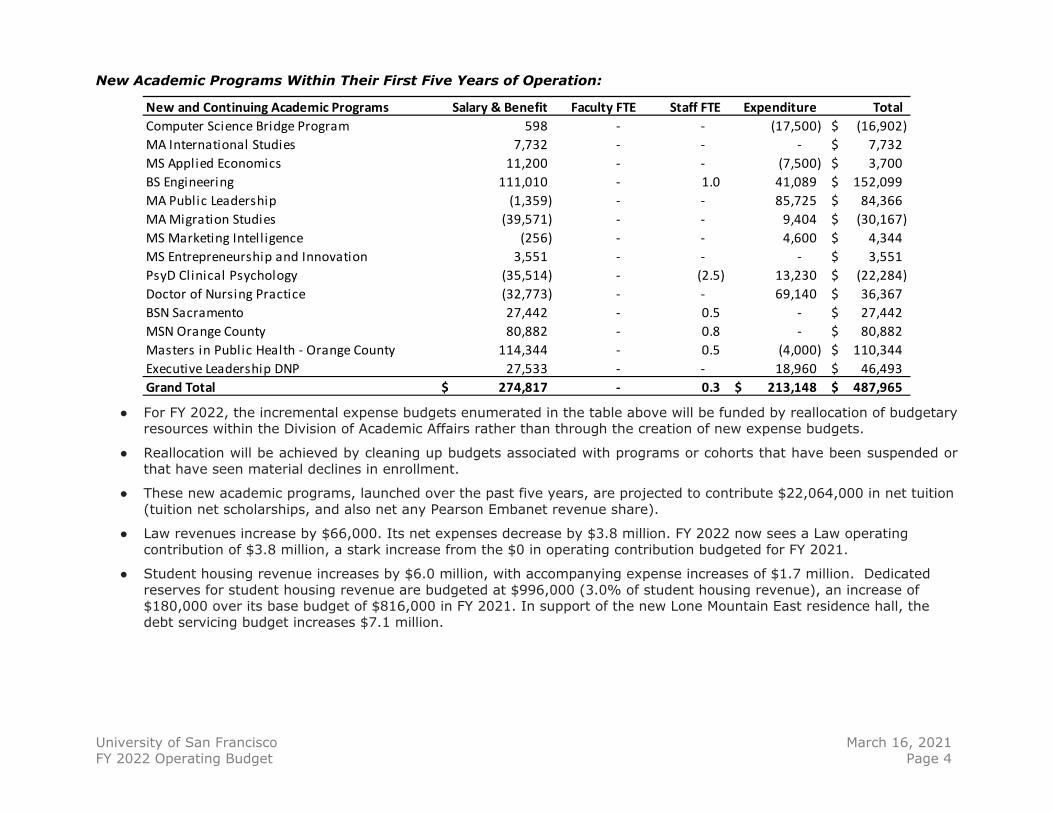
FY 2022 Proposed Operating Budget by Category Across the University The $470.0 million operating budget for FY 2022 is based on the University’s plan to welcome 9,941 continuing and new students across all of its campuses. Compared to the current fiscal year’s base budget (including savings identified in order to balance the current fiscal year’s placeholder budget), FY 2022 revenue is expected to decrease $19.1 million from FY 2021 revenue due to enrollment composition, rate increases associated with tuition and housing, and adjustments to fees, investment returns, auxiliary and other revenue budgets.
Revenue Tuition revenue (net of tuition exceptions) is budgeted to decrease by $23.0 million. Fee revenue budgets reflect the adjustment of housing and health clinic fees. The current investment returns budget decreases on account of lower returns on the university’s cash holdings. Planned changes to auxiliary revenue reflect a 0.9% room rate increase and the addition of beds in the new Lone Mountain East residence hall. Food service revenue is planned to be flat due to a volume adjustment. Decreases to other revenues include adjustments from the University’s housing and Law. Financial Aid Expense Institutional financial aid is a combination of merit awards and need-based aid. Unfunded financial aid budgets will decrease, in aggregate, by 4.9% This decrease will account for the University’s recent and planned enrollment composition and discounting practices. Other Expenses General operating, facilities, and capital expenditure budgets will collectively see a decrease in their levels, as will total compensation. Insurance premium budgets increase, as does debt service to support interest payments for Lone Mountain East. Please refer to pages 15 and 16 for details. University Reserves and Transfers University operating reserves increase $1.7 million to $9.5 million, or 2.0% of operating revenue budgets. Transfers In removes Law’s previous support from their restricted resources.
University of San Francisco March 16, 2021 FY 2022 Operating Budget Page 9

University of San Francisco March 16, 2021 FY 2022 Operating Budget Page 10

University of San Francisco March 16, 2021 FY 2022 Operating Budget Page 11
FY 2022 Proposed Operating Budget by Primary Functional Areas Highlighted changes are from the University’s current FY 2021 base budget. While we highlight proposed changes to the FY 2022 budget resulting from planning efforts, changes from the FY 2021 base budget also include management adjustments made within the fiscal year.
Revenue Changes ● The Division of Academic Affairs decrease is due to enrollment projections as of March 1, 2021, adjusted by tuition increases
approved by the Board of Trustees in December 2020. ● The Division of Business & Finance decrease is due to lower interest income on the university’s cash holdings, as well as
lower summer auxiliary operations. ● Athletics decrease is due to lower auxiliary ticket sales. ● The Student Life net increase is due to a student housing revenue increase, including additional beds in Lone Mountain East.
Expense Changes ● Expense budgets in functional areas see changes due to OPE
and engineer compensation increases, planning priorities, as well as new academic programs.
● The Academic Affairs net decrease includes reductions for Law budget, Presidio facilities, tuition share, scholarship, and faculty compensation increase pool reductions.
● The Office of Marketing Communications includes funding for a media and crisis communications consultant.
● The Business and Finance increase includes support budgets for Lone Mountain East (staff, facilities, debt interest) as well as for university insurance premiums.
● The Athletics increase includes additional financial aid. ● The Student Life net increase includes additional funding for
student housing, Title IX staff positions, a contractual increase as well as support for the Black Achievement, Success and Engagement Program.
● The Information Technology Services increase includes support budgets for Lone Mountain East.
● Institutional Support net increase includes an increase to the University’s operating reserves, student staff and minimum wage compensation increases, as well as a holding budget of approximately $18.1 million for anticipated savings.
FY 2022 Proposed Budget (in $1,000's)
Revenue FY21 Budget FY22 Budget Change Change %
Academic Affairs 438,676 415,676 (23,000) ‐5.2%President 61 61 ‐ 0.0%Development 6 6 ‐ 0.0%Business & Finance 16,777 15,586 (1,191) ‐7.1%Athletics 1,502 1,293 (209) ‐13.9%Student Life 30,500 35,839 5,339 17.5%ITS 1 ‐ (1) ‐100.0%Institutional Support 1,519 1,519 ‐ 0.0%Total Revenue 489,043 469,980 (19,063) ‐3.9%
ExpensePresident 3,070 3,154 84 2.7%General Counsel 3,520 3,575 55 1.6%Academic Affairs 318,742 306,668 (12,074) ‐3.8%Development 11,422 11,459 37 0.3%OMC 5,446 5,573 127 2.3%Business & Finance 64,769 74,113 9,344 14.4%Athletics 17,102 17,249 147 0.9%Student Life 32,155 34,012 1,857 5.8%ITS 26,066 26,323 257 1.0%Institutional Support 6,751 (12,147) (18,898) ‐279.9%Total Expense 489,043 469,980 (19,063) ‐3.9%
Net Balance ‐ ‐ ‐ ‐

University of San Francisco March 16, 2021 FY 2022 Operating Budget Page 12

University of San Francisco March 16, 2021 FY 2022 Operating Budget Page 13
Enrollment, Revenue, and Expense: FY 2021 Actuals Versus FY 2022 Budget Undergraduate Enrollment New undergraduate student enrollment is planned to increase from 1,501 in fall 2020 to 1,716 in fall 2021. The undergraduate continuing student population is planned to decrease from 4,316 in fall 2020 to 4,026 in fall 2021. Overall, undergraduate student enrollment is planned to decrease from 5,817 in fall 2020 to 5,742 in fall 2021. Graduate Enrollment Arts and Sciences graduate student enrollment for FY 2022 is planned to increase from 18,377 SCHs in FY 2021 to 18,828 SCHs in FY 2022. Management projected graduate SCHs are planned to decrease from 11,844 in FY 2021 to 10,998 in FY 2022. Nursing graduate SHCs are planned to decrease from 19,527 SCHs in FY 2021 to 19,408 in FY 2022. Education total enrollment, as measured by SCHs, is planned to decrease from 22,629 in FY 2021 to 21,639 in FY 2022. Law total enrollment, as measured by SCHs, is planned to increase from 11,719 in FY 2021 to 12,037 in FY 2022. FY 2022 Budgeted Revenue and Expense by School or College The table lists revenue budgets by teaching college, along with direct expense budgets. These budgets include new enrollments, approved plans, and related expenses, as well as estimated allocations for full-time faculty compensation increases, part-time faculty compensation, financial aid, and tuition share budget.

University of San Francisco March 16, 2021 FY 2022 Operating Budget Page 14
*Note: Gen Ops Facilities Capital includes a decrease for anticipated savings of $18.158 million.
University of San Francisco March 16, 2021 FY 2022 Operating Budget Page 15
Changes in Expense Budgets Highlighted changes are from the University’s current FY 2021 base budget. While we highlight proposed changes to the FY 2022 operating budget resulting from planning efforts, changes from the FY 2021 base budget also include management adjustments made within the fiscal year. Total Compensation Employee compensation constitutes approximately 51.7% of budgeted expenses in FY 2022. This category includes salaries for executive, professional and administrative staff; full- and part-time faculty; student employees; and statutory and employee benefit expenses, such as retirement savings contributions, tuition remission, health insurance, etc. Changes by category of compensation are on the next page and include both new academic program plans, as well as the clearing of FY 2021 compensation increase budgets. The non-Law staff compensation increase pool is within the unit of Institutional Support. The non-Law faculty compensation increase pool is within the Division of Academic Affairs. Remaining FY 2021 compensation increase budgets not applied will be zeroed out and there are no compensation increase pool budgets in the FY 2022 budget. General Operating/Facilities/Capital This category includes office supplies and equipment, leases, consumable goods and services, building operational costs, janitorial and utility charges, furniture, library holdings, and most scientific equipment. The net decrease of $17.1 million includes a decrease for anticipated savings of $18.1 million, increases for planning priorities of $1.1 million, housing increases of $807K, decreased revenue share payments of $503K, a decrease of $453K for the salvage of the Presidio campus’ facilities lease budgets, a $241K increase for the conversion of two staff positions (one in the Office of Marketing Communications and the other in Development) to temporary budgets, and a net decrease of $226K for Law. Financial Aid The $6.1 million decrease in financial aid accounts for a decrease of $3.6 million in undergraduate budgets supporting current financial aid practices. Law decreases its operating financial aid funding by $2.8 million. Other non-Law graduate financial aid increases $107K, and housing financial aid increases by $218K. Food Service, Insurance/Collections/Bad Debt/Loans and Debt Service Food Service remains at its current budget due to a volume adjustment. Debt Service increases by $7.1 million to budget debt interest payments for Lone Mountain East. The Insurance/Collections/Bad Debt/Loans category increase by $1.0 million to fund university insurance premium increases. Reserves and Transfers In Reserves are designated for unexpected variations in revenues or expenses. The University will increase its operating reserves by approximately $1.7 million. The resulting level will represent approximately 2.0% of operating revenue budgets. Law’s budget removes a Transfers In target from restricted resources of $319K.
University of San Francisco March 16, 2021 FY 2022 Operating Budget Page 16
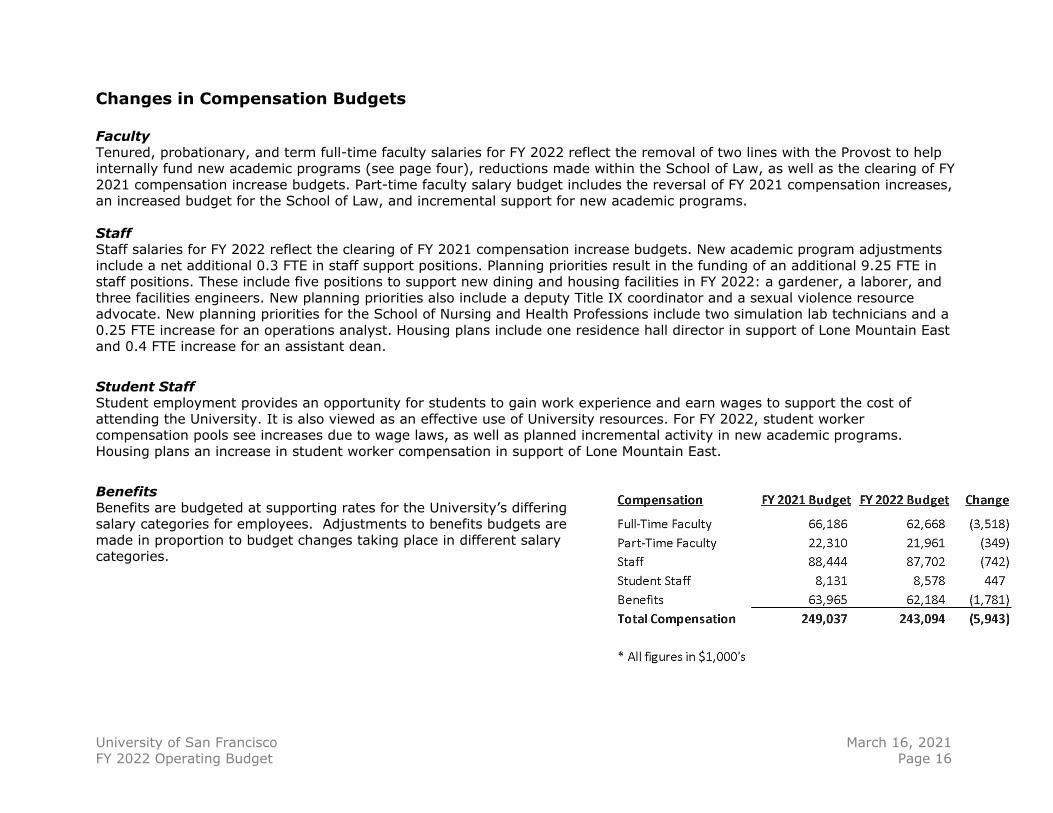
Changes in Compensation Budgets Faculty Tenured, probationary, and term full-time faculty salaries for FY 2022 reflect the removal of two lines with the Provost to help internally fund new academic programs (see page four), reductions made within the School of Law, as well as the clearing of FY 2021 compensation increase budgets. Part-time faculty salary budget includes the reversal of FY 2021 compensation increases, an increased budget for the School of Law, and incremental support for new academic programs. Staff Staff salaries for FY 2022 reflect the clearing of FY 2021 compensation increase budgets. New academic program adjustments include a net additional 0.3 FTE in staff support positions. Planning priorities result in the funding of an additional 9.25 FTE in staff positions. These include five positions to support new dining and housing facilities in FY 2022: a gardener, a laborer, and three facilities engineers. New planning priorities also include a deputy Title IX coordinator and a sexual violence resource advocate. New planning priorities for the School of Nursing and Health Professions include two simulation lab technicians and a 0.25 FTE increase for an operations analyst. Housing plans include one residence hall director in support of Lone Mountain East and 0.4 FTE increase for an assistant dean. Student Staff Student employment provides an opportunity for students to gain work experience and earn wages to support the cost of attending the University. It is also viewed as an effective use of University resources. For FY 2022, student worker compensation pools see increases due to wage laws, as well as planned incremental activity in new academic programs. Housing plans an increase in student worker compensation in support of Lone Mountain East. Benefits Benefits are budgeted at supporting rates for the University’s differing salary categories for employees. Adjustments to benefits budgets are made in proportion to budget changes taking place in different salary categories.

University of San Francisco March 16, 2021 FY 2022 Operating Budget Page 17
FY 2021 Base Budget and Forecast Versus FY 2022 Budget
(All figures in $1,000’s)
FY21 Budget FY21 Forecast^ FY22 Budget*RevenueTuition net Exceptions 436,653 415,931 413,674 Fees 3,839 2,558 3,714 Grants & Contracts - 55 - Gifts & Contributions 1,522 1,080 1,522 Investment Returns 2,084 1,152 1,134 Auxiliary Revenue 32,613 3,920 37,730 Board Revenue 10,400 1,096 10,400 Other Revenue 1,932 354 1,806 Total Revenue 489,043 426,145 469,980
ExpenseFT Faculty Salary & Benefits 91,005 75,638 86,169 PT Faculty Salary & Benefits 27,441 26,015 27,122 Total Staff Salary & Benefits 130,590 108,169 129,803 Gen Ops/Facilities/Capital 77,647 64,515 60,532 Scholarships 124,361 116,134 118,282 Food Service 10,550 2,096 10,550 Ins/Coll/Bad Debt/Loans 3,325 4,025 4,325 Debt Service 16,627 16,427 23,703 Reserves, Transfers & Internal Bank 7,496 13,125 9,495 Total Expense 489,043 426,145 469,980
Net Balance ‐ ‐ ‐ ̂February Fiscal Period Operating Forecast* This amount included a general operating reduction for anticipated savings of $18.158 million which will be allocated across other expense categories based on management's decisions on, or around, June 1, 2021.
Appendix: Historical Analysis

University of San Francisco March 16, 2021 FY 2022 Operating Budget Appendix, A-1
Revenue Tuition and fees make up 88.8% of the gross revenue in the FY 2022 operating budget. What follows is a review of the three main factors that influence the University’s revenue: enrollment, tuition rates and financial aid.
Year Total SCH % Change10-year
% ChangeFY 2012 Actual 269,454 3.8%FY 2013 Actual 278,528 3.4%FY 2014 Actual 283,286 1.7%FY 2015 Actual 294,499 4.0%FY 2016 Actual 294,223 -0.1%FY 2017 Actual 301,323 2.4%FY 2018 Actual 301,090 -0.1%FY 2019 Actual 295,212 -2.0%FY 2020 Actual 290,577 -1.6%FY 2021 Census 269,344 -7.3%FY 2022 Budget 262,785 -2.4% -2.5%0
50,000
100,000
150,000
200,000
250,000
300,000
FY 2012Actual
FY 2013Actual
FY 2014Actual
FY 2015Actual
FY 2016Actual
FY 2017Actual
FY 2018Actual
FY 2019Actual
FY 2020Actual
FY 2021Census
FY 2022Budget
Enrollment in Student Credit Hours (FY 2012 - FY 2022)

University of San Francisco March 16, 2021 FY 2022 Operating Budget Appendix, A-2
Tuition and Fee Income Planned tuition and fee revenue increases because enrollment projections and/or tuition rates increase. The FY 2022 budget anticipates that tuition (net of tuition exceptions) and fee revenue will decrease by 0.3%. Tuition and fees constitute 88.8% of the FY 2022 gross revenue budget. Financial Aid Over the ten-year analysis period, expenditures for University-funded financial aid have increased 95.6%, in contrast with a tuition and fee cumulative increase of 34.7%. As a percentage of tuition, aggregate financial aid has grown from 19.9% to a budgeted 28.6% during this same ten-year period.
The pressure to increase funding for financial aid comes from reduced support from government sources, as well as from the institution's attempt to use financial aid to recruit students for their academic ability, athletic talent, and ethnic and economic diversity. Financial aid awarded is a balance of merit- and need-based aid.
There is $118.3 million in aggregate unrestricted financial aid in the FY 2022 operating budget.
FY 2012 - FY 2022 Unrestricted Operating BudgetTuition & Fee Income/Percent of Total Revenue(in thousands of dollars)
10-YearYear Tuition* & Fees Total Revenue % of Total T&F % Change % Change FY 2012 Actual $309,816 $343,962 90.1% 6.4%FY 2013 Actual $332,441 $369,546 90.0% 7.3%FY 2014 Actual $349,938 $386,866 90.5% 5.3%FY 2015 Actual $367,352 $406,540 90.4% 5.0%FY 2016 Actual $378,743 $418,237 90.6% 3.1%FY 2017 Actual $402,253 $446,220 90.1% 6.2%FY 2018 Actual $420,181 $465,098 90.3% 4.5%FY 2019 Actual $425,283 $472,420 90.0% 1.2%FY 2020 Actual $436,333 $476,237 91.6% 2.6%FY 2021 Forecast $418,488 $426,145 98.2% -4.1%FY 2022 Budget $417,388 $469,980 88.8% -0.3% 34.7%
FY 2012 - FY 2022 Unrestricted Operating BudgetFinancial Aid/Percent of Tuition(in thousands of dollars)
10-YearYear Financial Aid Tuition* % of Tuition Fin Aid % Change % Change FY 2012 Actual $60,478 $304,166 19.9% 8.2%FY 2013 Actual $65,702 $325,849 20.2% 8.6%FY 2014 Actual $69,061 $340,894 20.3% 5.1%FY 2015 Actual $75,007 $364,473 20.6% 8.6%FY 2016 Actual $82,966 $375,814 22.1% 10.6%FY 2017 Actual $93,447 $398,673 23.4% 12.6%FY 2018 Actual $108,926 $416,295 26.2% 16.6%FY 2019 Actual $116,394 $421,587 27.6% 6.9%FY 2020 Actual $123,916 $433,077 28.6% 6.5%FY 2021 Forecast $116,134 $415,931 27.9% -6.3%FY 2022 Budget $118,282 $413,674 28.6% 1.8% 95.6%
Tuition* = Tuition + Tuition Exceptions

University of San Francisco March 16, 2021 FY 2022 Operating Budget Appendix, A-3
Tuition and Fee Rates Our pricing strategy of generally lower-than-average tuition increases is in response to an important shift in demographics and has been amplified by the so-called “Great Recession” of 2007-2010. This changing economic context provides the University with an opportunity to adapt and strengthen the University in a way that is consistent with our mission and long-term aspirations, as expressed in USF 2028. As a result, the University is making far-reaching structural adjustments — which include enhancing faculty and staff productivity — so that we may continue to offer a high-quality Jesuit education. Looking at the University’s ten-year tuition and fee history, rates have increased within a range of 2.9% to 4.6% per year over the last ten years. Consistent with private higher education trends, tuition rates have historically increased several percentage points above inflation rates. We are striving to maintain quality in our programs, while keeping our tuition charges at levels consistent with our cross-applicant competitor set of schools. There is strong political and social pressure to control the growth of higher education costs. The University is responding to this pressure by systemically reviewing new initiatives in the context of new and reallocated funds. Reacting to limited tuition rate increases has led to targeted efforts to reallocate budgets to meet emerging needs.
University of San Francisco March 16, 2021 FY 2022 Operating Budget Appendix, A-4
Tuition and Fee Comparison
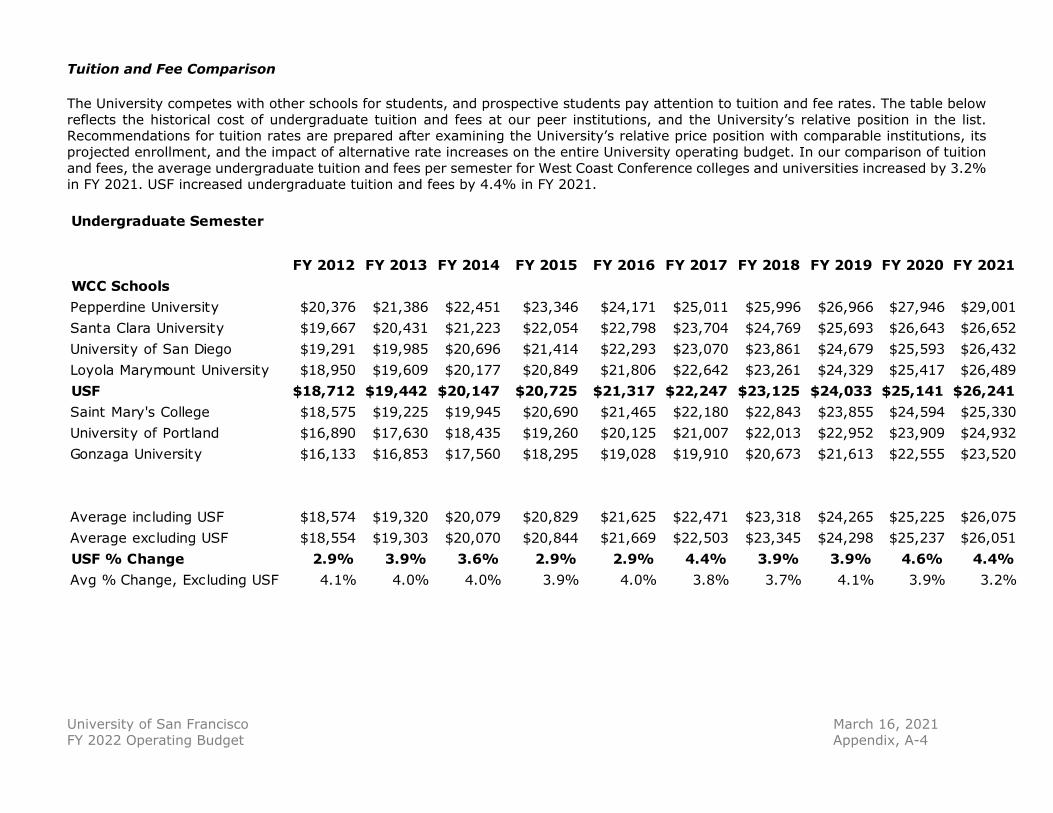
The University competes with other schools for students, and prospective students pay attention to tuition and fee rates. The table below reflects the historical cost of undergraduate tuition and fees at our peer institutions, and the University’s relative position in the list. Recommendations for tuition rates are prepared after examining the University’s relative price position with comparable institutions, its projected enrollment, and the impact of alternative rate increases on the entire University operating budget. In our comparison of tuition and fees, the average undergraduate tuition and fees per semester for West Coast Conference colleges and universities increased by 3.2% in FY 2021. USF increased undergraduate tuition and fees by 4.4% in FY 2021.
Undergraduate Semester
FY 2012 FY 2013 FY 2014 FY 2015 FY 2016 FY 2017 FY 2018 FY 2019 FY 2020 FY 2021WCC SchoolsPepperdine University $20,376 $21,386 $22,451 $23,346 $24,171 $25,011 $25,996 $26,966 $27,946 $29,001Santa Clara University $19,667 $20,431 $21,223 $22,054 $22,798 $23,704 $24,769 $25,693 $26,643 $26,652University of San Diego $19,291 $19,985 $20,696 $21,414 $22,293 $23,070 $23,861 $24,679 $25,593 $26,432Loyola Marymount University $18,950 $19,609 $20,177 $20,849 $21,806 $22,642 $23,261 $24,329 $25,417 $26,489USF $18,712 $19,442 $20,147 $20,725 $21,317 $22,247 $23,125 $24,033 $25,141 $26,241Saint Mary's College $18,575 $19,225 $19,945 $20,690 $21,465 $22,180 $22,843 $23,855 $24,594 $25,330University of Portland $16,890 $17,630 $18,435 $19,260 $20,125 $21,007 $22,013 $22,952 $23,909 $24,932Gonzaga University $16,133 $16,853 $17,560 $18,295 $19,028 $19,910 $20,673 $21,613 $22,555 $23,520
Average including USF $18,574 $19,320 $20,079 $20,829 $21,625 $22,471 $23,318 $24,265 $25,225 $26,075Average excluding USF $18,554 $19,303 $20,070 $20,844 $21,669 $22,503 $23,345 $24,298 $25,237 $26,051USF % Change 2.9% 3.9% 3.6% 2.9% 2.9% 4.4% 3.9% 3.9% 4.6% 4.4%Avg % Change, Excluding USF 4.1% 4.0% 4.0% 3.9% 4.0% 3.8% 3.7% 4.1% 3.9% 3.2%

University of San Francisco March 16, 2021 FY 2022 Operating Budget Appendix, A-5
Five-Year Undergraduate Tuition and Fees Trend
The FY 2021 average (excluding USF) annual undergraduate tuition and fees is $52,391, and the average rate of increase over the past five years has been 3.6% per annum. The average annual USF increase over the past five years has been 4.2%. Over the entire five-year period, the average tuition and fee level (excluding USF) increased 15.2%, while USF's tuition and fees increased 18.0%.
WCC School 2016~2017 2017~2018 2018~2019 2019~2020 2020~2021% chg in 5
yrsBAvg % chg per
yrCCA Univers i ty of Southern Cal i fornia 52,567 54,573 56,676 58,645 60,725 15.5% 3.7%
X CA Pepperdine Univers i ty 50,022 51,992 53,932 55,892 58,002 16.0% 3.8%NY Fordham Univers i ty 48,654 50,986 52,687 54,411 56,161 15.4% 3.7%
X Bay Santa Clara Univers i ty 47,407 49,538 51,386 53,285 53,303 12.4% 3.0%X CA Loyola Marymount Univers i ty 45,284 46,522 48,658 50,833 52,977 17.0% 4.0%X CA Univers i ty of San Diego 46,140 47,722 49,358 51,186 52,864 14.6% 3.5%X Bay USF 44,494 46,250 48,066 50,282 52,482 18.0% 4.2%X Bay Saint Mary's Col lege 44,360 45,686 47,710 49,188 50,660 14.2% 3.4%X OR Univers i ty of Portland 42,014 44,026 45,904 47,818 49,864 18.7% 4.4%
WA Seattle Univers i ty 41,495 43,428 45,145 47,090 48,390 16.6% 3.9%X WA Gonzaga Univers i ty 39,820 41,345 43,225 45,110 47,040 18.1% 4.3%
IL Loyola Univers i ty of Chicago 42,382 43,115 44,158 46,028 46,310 9.3% 2.2%Average 45,387 47,099 48,909 50,814 52,398 15.4% 3.7%Average excluding USF 45,468 47,176 48,985 50,862 52,391 15.2% 3.6%
Notes:(A) Schools are sorted by 2020/2021 Tuition and Fees column.(B) The '% change in 5 yrs' is the growth from FY17 to FY21.(C) The 'Average % change per yr' is an average of the % changes from FY17 to FY21.

University of San Francisco March 16, 2021 FY 2022 Operating Budget Appendix, A-6
Endowment (FY 2019)
Among other forms of support, a healthy endowment provides a source of funding for university scholarships. In fiscal year 2019 (the latest available data), the average (excluding USF) endowment income (EI) per enrolled full-time equivalent (FTE) of the universities included in the comparison below was $2,754. USF's EI/FTE is below this average at $1,520.
WCC School
2019 Total Endowment (TE) (000)2
4% Endowment Income FY 18 (EI)
(000)
Fall 2018 Total
Enrollment (FTE)3
2019 Total Enrollment TE/FTE
2019 Total Enrollment EI/FTE
CA Univers i ty of Southern Cal i fornia 5,732,101 229,284 43,674 131,247 5,250X Bay Santa Clara Univers i ty 1,019,760 40,790 7,953 128,223 5,129X CA Pepperdine Univers i ty 887,461 35,498 9,035 98,225 3,929X CA Univers i ty of San Diego 545,552 21,822 8,855 61,609 2,464X CA Loyola Marymount Univers i ty 476,198 19,048 8,705 54,704 2,188X OR Univers i ty of Portland 209,125 8,365 4,408 47,442 1,898X Bay Saint Mary's Col lege 181,313 7,253 3,851 47,082 1,883
NY Fordham Univers i ty 733,516 29,341 16,475 44,523 1,781WA Gonzaga Univers i ty 294,720 11,789 7,460 39,507 1,580
X Bay USF 399,571 15,983 10,518 37,989 1,520WA Seattle Univers i ty 234,341 9,374 6,519 35,947 1,438
Average 973,969 38,959 11,587 66,045 2,642Average excluding USF 1,031,409 41,256 11,694 68,851 2,754

University of San Francisco March 16, 2021 FY 2022 Operating Budget Appendix, A-7
Expenses The following appendices address the major areas of the University's expense budget, including employee compensation. Compensation The Office of the Provost and the deans track the balance between full- and part-time faculty members; faculty teaching, research, and service workloads; and faculty-to-student ratios. The University is continually making a concerted effort to focus its personnel costs on areas that provide consistently high levels of academic excellence and service quality. In concert with institutional planning, and through the annual budgeting process, new and reallocated funds are directed towards these activities. Benefits Expense
Benefits are shown in relation to University salary expense and total expense. USF charges benefits to departments based on salary expense.
Salaries
Year Benefits SalariesTotal
Expense % of
Salaries% of Total Expense
Annual % Change
10-year % Change
10-year % Change
FY 2012 Actual $45,376 $128,582 $344,180 35.3% 13.2% 9.6%FY 2013 Actual $47,925 $138,516 $364,866 34.6% 13.1% 5.6%FY 2014 Actual $48,136 $148,551 $377,882 32.4% 12.7% 0.4%FY 2015 Actual $54,371 $158,978 $405,906 34.2% 13.4% 13.0%FY 2016 Actual $57,935 $168,247 $418,237 34.4% 13.9% 6.6%FY 2017 Actual $60,366 $174,210 $446,220 34.7% 13.5% 4.2%FY 2018 Actual $61,674 $177,955 $465,098 34.7% 13.3% 2.2%FY 2019 Actual $60,461 $174,828 $472,110 34.6% 12.8% -2.0%FY 2020 Actual $59,907 $173,675 $476,237 34.5% 12.6% -0.9%
FY 2021 Forecast $54,756 $155,068 $488,853 35.3% 11.2% -8.6%
FY 2022 Budget $62,184 $180,909 $469,980 34.4% 13.2% 13.6% 37.0% 40.7%
Benefits

University of San Francisco March 16, 2021 FY 2022 Operating Budget Appendix, A-8
USF Five-Year Revenues & Expenses by Category The following report is a summary of all University historical actual revenues and expenses and unrestricted base budgets as organized by general revenue and expense categories. This analysis, and other budget-focused analyses are available from the Office of Planning and Budget’s web site at http://myusf.usfca.edu/planning-budget/office-reports.
Note: Revenues are represented within parentheses. All figures are in thousands.
FY 2018 FY 2019 FY 2020 FY 2021 FY 2022YTD Activity Actual Actual Actual Forecast Budget
Tuition & Fees (420,181) (425,283) (436,333) (418,488) (417,388)Gifts (1,301) (1,736) (1,140) (1,080) (1,522)
Auxiliary & Other Revenues (43,617) (45,401) (38,764) (6,577) (51,070)Revenue Total (465,098) (472,420) (476,237) (426,145) (469,980)
Full-Time Faculty 64,531 62,176 61,979 55,010 62,668Part-Time Faculty 22,839 22,053 21,546 21,150 21,961
Staff 83,400 83,138 83,177 75,781 87,702Student Staff 7,185 7,462 6,973 3,126 8,578
Benefits 61,674 60,461 59,907 54,756 62,184Gen Ops/Facilities/Capital 80,560 81,369 80,967 64,515 60,532
Financial Aid 108,926 116,394 123,916 116,134 118,282Food Service 10,277 10,056 6,744 2,096 10,550
Debt & Other Expense 19,419 19,681 19,681 32,577 28,027Reserves & Transfers In/Out 6,288 9,320 11,347 1,000 9,495
Expense Total 465,098 472,110 476,237 426,145 469,980
Grand Total 0 (310) 0 0 0