Operating Budget Data - Maryland General...
35
NI.00 Family Investment Department of Human Resources Note: Numbers may not sum to total due to rounding. For further information contact: Alice Boyle Shepard Phone: (410) 946-5530 1 Operating Budget Data ($ in Thousands) FY 01 FY 02 FY 03 % Change Actual Working Allowance Change Prior Year General Fund $101,272 $127,365 $127,797 $432 0.3% Special Fund 20,409 19,395 20,547 1,152 5.9% Federal Fund 412,526 397,017 417,673 20,656 5.2% Total Funds $534,208 $543,777 $566,018 $22,241 4.1% The Governor has proposed almost $30 million in deficiency appropriations. The funds would cover the Temporary Cash Assistance (TCA) deficit and provide cost containment relief. The allowance includes an increase of $26.5 million for public assistance payments. The additional funds primarily reflect an increase for TCA payments offset by declines in food stamp dollars. Because of increased turnover expectancy and cost containment efforts, personnel expenses decrease by $6.7 million. Personnel Data FY 01 FY 02 FY 03 Actual Working Allowance Change Regular Positions 2,403.00 2,607.00 2,588.00 (19.00) Contractual FTEs 180.82 150.00 150.00 0.00 Total Personnel 2,583.82 2,757.00 2,738.00 (19.00) Vacancy Data: Regular Positions Budgeted Turnover: FY 03 213.51 8.25% Positions Vacant as of 12/31/01 225.77 8.66% The allowance transfers 19 positions for the Medicaid waiver unit to the Department of Health and Mental Hygiene. Accounting for turnover expectancy and cost containment, the Family Investment programs will need to achieve a vacancy rate of 13.6% during fiscal 2003. This is approximately equivalent to 350 vacancies for the entire year, or about 125 more positions than were vacant at the end of calendar 2001.
Transcript of Operating Budget Data - Maryland General...

NI.00Family Investment
Department of Human Resources
Note: Numbers may not sum to total due to rounding.For further information contact: Alice Boyle Shepard Phone: (410) 946-5530
1
Operating Budget Data($ in Thousands)
FY 01 FY 02 FY 03 % ChangeActual Working Allowance Change Prior Year
General Fund $101,272 $127,365 $127,797 $432 0.3%
Special Fund 20,409 19,395 20,547 1,152 5.9%
Federal Fund 412,526 397,017 417,673 20,656 5.2%
Total Funds $534,208 $543,777 $566,018 $22,241 4.1%
� The Governor has proposed almost $30 million in deficiency appropriations. The funds would cover theTemporary Cash Assistance (TCA) deficit and provide cost containment relief.
� The allowance includes an increase of $26.5 million for public assistance payments. The additional fundsprimarily reflect an increase for TCA payments offset by declines in food stamp dollars.
� Because of increased turnover expectancy and cost containment efforts, personnel expenses decrease by$6.7 million.
Personnel DataFY 01 FY 02 FY 03Actual Working Allowance Change
Regular Positions 2,403.00 2,607.00 2,588.00 (19.00)
Contractual FTEs 180.82 150.00 150.00 0.00
Total Personnel 2,583.82 2,757.00 2,738.00 (19.00)
Vacancy Data: Regular Positions
Budgeted Turnover: FY 03 213.51 8.25%
Positions Vacant as of 12/31/01 225.77 8.66%
� The allowance transfers 19 positions for the Medicaid waiver unit to the Department of Health andMental Hygiene.
� Accounting for turnover expectancy and cost containment, the Family Investment programs will need toachieve a vacancy rate of 13.6% during fiscal 2003. This is approximately equivalent to 350 vacanciesfor the entire year, or about 125 more positions than were vacant at the end of calendar 2001.
NI.00 - DHR - Family Investment
2
Analysis in Brief
Issues
TCA Caseload Remains Steady: Despite the sluggish economy, the State has not experienced sustainedgrowth in the TCA caseload. Primarily because of grant estimates that exceed those in the budget, theDepartment of Legislative Services (DLS) anticipates that the Department of Human Resources (DHR) willexperience difficulties covering costs for TCA payments. DLS recommends freezing the monthly grantat its current level and having the Secretary discuss DHR’s caseload projections.
January 2002 Marked the Start of the Five-year Time Limit on Cash Assistance: Beginning in January1997, federal law limits the lifetime receipt of Temporary Assistance to Needy Families-funded (TANF) cashassistance to five years. The time limit hit in January 2002, but, because of the 20% federal hardshipexemption, TCA recipients have not lost their grants. DHR does not anticipate exceeding the exemption leveluntil August 2004. DLS recommends that the Secretary discuss the challenges associated with movinglong-term recipients to permanent employment.
Substance Abuse Screening and Referrals Provided to TCA Clients: The Welfare Innovation Act of 2000requires the placement of addiction specialists in every local department of social services (LDSS). DHR hasprovided data showing that less than 60% of those referred to assessment complete the recommendedactivity. On the other hand, all those thought to need treatment have enrolled or are on a waiting list. DLSrecommends that the Secretary discuss TCA case closure resulting from this program and otherprogram activities.
Accessing the Food Stamp Program: The success of the food stamp program can be measured by its abilityto reach its target population. Researchers determined that Maryland’s food stamp participation rate appearsto be in line with the national average. The federal government provides states with options to improveaccess to the program. This issue discusses transitional food stamp benefits and simplified reporting as itrelates to the "Michigan Waiver." DLS recommends that the Secretary discuss DHR’s plans to improveaccess to the food stamp program.
Recommended Actions
Funds Positions
1. Delete PINs vacant for over one year prior to the hiring freeze. 3.0
2. Add language eliminating the grant increase for Temporary CashAssistance payments.
3. Reduce funds for contract with the Regional Economic StudiesInstitute to constrain fiscal 2003 spending.
$110,000
NI.00 - DHR - Family Investment
3
Total Reductions $ 110,000 3.0
Updates
Food Stamp Error Rate Continues to Exceed National Average: Federal fiscal 2000 marked the seventhconsecutive year that Maryland’s food stamp error rate exceeded the national average. This issue discussesthe food stamp error rate and includes a brief discussion of the State’s food stamp investment strategies.
Various Welfare Innovation Initiatives Encourage the Hiring of TCA Clients: Between 1998 and 2001,the General Assembly passed three Welfare Innovation Acts that included provisions to encourage the hiringof TCA clients. This update provides job placement and other available statistics on the three hiringagreement initiatives.
Impact of Baltimore City Community College Work Study Program Not Yet Known: The 2001 JointChairmen’s Report (JCR) required DHR, in conjunction with the Baltimore City Community College, toprovide information on the effectiveness of the IMPACT 2000 program. The purpose of the program is todetermine whether TCA recipients with certificates or degrees fare better in the labor market than recipientswho did not participate in these educational activities. The data needed to track employment and earningsfor those who graduated in June 2000 was not available until November 2001. The evaluation results areexpected in February 2002.
DHR Makes Preliminary Assessment of Promising Welfare-to-work Activities: As requested in the 2001JCR, DHR conducted informal evaluations related to programs funded with work opportunities allocations.To compile the necessary information, DHR administered a survey instrument to each LDSS. This updatediscusses preliminary findings.

NI.00 - DHR - Family Investment
4

NI.00Family Investment
Department of Human Resources
5
Operating Budget Analysis
Program Description
The Department of Human Resources (DHR) administers a variety of State and federal public assistanceprograms. Programs administered include:
� Temporary Cash Assistance (TCA), formerly Aid to Families with Dependent Children (AFDC), theState’s largest cash assistance program, provides financial assistance to dependent children and otherfamily members deprived of support due to the death, incapacitation, underemployment, orunemployment of one or both parents. Prior to October 1, 1996, AFDC was a federal entitlement withthe State paying 50% of the costs. Federal welfare reform legislation enacted in August 1996 eliminatedthe individual entitlement to AFDC and replaced it with a Temporary Assistance to Needy Families(TANF) Block Grant. States receive their share of the block grant as long as they comply with amaintenance of effort requirement of 80%, 75% if a state is successful in meeting the federal workparticipation rate. Under the legislation, states determine the eligibility criteria for TCA. The federallegislation also requires welfare recipients to work in order to receive assistance for more than two yearsand establishes a five-year time limit on the receipt of benefits with a hardship exemption for as much as20% of the State’s caseload.
� Family Investment Program (FIP), the State’s program for serving welfare recipients, encompassesthe provision of TCA and efforts to divert potential applicants through employment, move recipients towork, and provide retention services to enhance skills and prevent recidivism. The goal of FIP is to assistTCA applicants/recipients in becoming self-sufficient. After assessing each family’s specific needs andresources, staff focus on the services required to move clients into work. TCA is provided only as a lastresort. Beginning in October 1996, applicants for cash assistance are required to cooperate with childsupport enforcement staff as a condition of eligibility and must undertake job search activities if asked.Recipients are sanctioned if they fail to comply with any work or training requirements. Screening ofTCA recipients for substance abuse is mandatory, with participation in treatment required of individualsoffered appropriate treatment.
� The Burial Assistance Program subsidizes funeral expenses of public assistance recipients, childrenreceiving foster care, and Medical Assistance recipients.
� Emergency Assistance to Families with Children offers limited grants for families experiencing crisessuch as eviction, disaster, and breakdown of essential appliances.
� The Food Stamp Program provides benefits solely for the purchase of food items to individuals andfamilies who meet income and resource requirements. Benefit costs are 100% federally funded, whilethe administrative costs are split evenly between the State and federal government. Maryland providesState-funded food stamps to legal immigrant children who are barred from the federal program.

NI.00 - DHR - Family Investment
6
� Public Assistance to Adults provides payments to indigent clients residing in licensed domiciliary carehomes and to Project Home clients. Recipients include mentally and physically disabled adults andindividuals with Acquired Immune Deficiency Syndrome who remain in their homes.
The local departments of social services (LDSS) are responsible for making eligibility determinations andre-determinations for the aforementioned programs, the State’s subsidized child care program called Purchaseof Care (POC), and the Medical Assistance program which is administered by the Department of Health andMental Hygiene (DHMH). Local departments have the flexibility to create their own tailor-made welfareprogram and determine what training and job search activities will be required of applicants. In addition, thelocal departments are responsible for networking with employers and determining the most appropriate usefor job training funds.
Fiscal 2002 Actions
Cost Containment
Through cost containment measures, the Department of Budget and Management (DBM) reducedfunding for Family Investment programs by almost $4 million ($2.5 million in general funds). The hiringfreeze produced $2.5 million of these savings. The remaining $1.5 million represents child support collectionsused to offset TCA payments. Based on recent collection activities, it seems unlikely that DHR will collectthe full amount assumed in the fiscal 2002 budget. As discussed below, the Governor has proposed $1.3million in cost containment relief for personnel expenses through deficiency appropriations.
Proposed Deficiency Appropriations
The budget bill includes $29.9 million in deficiency appropriations for Family Investment services.However, an additional $670,000 provided as part of a deficiency appropriation for local child welfare isintended to support Family Investment activities and, as such, DHR would need to reallocate these funds asappropriate. Therefore, the total amount of proposed deficiency appropriations for Family Investmentprograms totals $30.6 million. The funds consist of $24 million in unappropriated TANF block grant dollarsand $6.6 million in special funds from the Family Investment Dedicated Purpose Account. The proposedappropriations are described below.
� TCA Payments: The TCA deficit stems from overly optimistic assumptions about caseload declinesused when building the fiscal 2002 budget. The caseload has fluctuated from month to month but hasnot exhibited an overall downward trend. To cover the deficit, the Governor has proposed providing$28.9 million: $24 million in unappropriated TANF dollars and $4.9 million from the Family InvestmentDedicated Purpose Account.
� Cost Containment Relief: The budget includes two proposed deficiency appropriations totaling almost$1.7 million from the Family Investment Dedicated Purpose Account to restore funds for certain FamilyInvestment services impacted by cost containment measures. The Governor has also proposed providing$866,000 from the Family Investment Dedicated Purpose Account to address other critical needs faced

NI.00 - DHR - Family Investment
7
by DHR. The department’s priority for use of these funds is emergency services for child welfare andadult services cases. If the entire amount of contingency funds is not spent, DHR intends to apply thebalance toward the potential shortfall in the budget for TCA payments. As an indeterminate portion ofthese funds support Family Investment, these dollars are not included in the deficiency appropriationtotals for Family Investment programs. The two cost containment relief measures are described below.
• Filled Positions: Prior to the imposition of the hiring freeze, DHR had filled a significant numberof vacant positions. The vacancy reports used by DBM to identify savings generated by the hiringfreeze, however, did not reflect these recent personnel activities. A deficiency appropriation of $1.3million would restore funding for almost 90 positions, primarily in LDSS. DHR will also useavailable federal dollars to support the personnel costs associated with these positions.
• Food Stamp Reinvestment Strategies: The State's food stamp error rate has exceeded the nationalaverage for the past seven years. In lieu of paying penalties to the federal government, DHR mustspend State dollars on food stamp reinvestment strategies. The Governor has provided a hiring freezeexemption for these 15 new positions. A proposed deficiency appropriation would provide $336,000to cover personnel expenses.
Governor’s Proposed Budget
Exhibit 1 shows that the allowance increases by $22.2 million, or 4.1% compared to the fiscal 2002working appropriation. After accounting for the proposed deficiency appropriations, the budget for FamilyInvestment programs drops by $8.4 million between fiscal 2002 and 2003. The significant budgetary changesare described below.
Personnel Expenses
Despite increases in health insurance and retirement costs, annualization of the fiscal 2002 general salaryincrease, and fiscal 2003 increments, personnel expenditures between fiscal 2002 and 2003 decrease by$6.7 million. This occurs primarily because of increased turnover expectancy and cost containment efforts.To generate the savings assumed in the allowance, the Family Investment programs would need a vacancyrate of 13.6% in fiscal 2003. This is approximately equivalent to 350 vacancies for the entire year. At theend of calendar 2001, the Family Investment programs had almost 226 vacancies for a vacancy rate of8.7 percent.
The transfer of the Medicaid waiver unit to DHMH also contributes to the reduction in personnel costs.The decrease, including $13,000 in nonpersonnel costs, for the 19 positions is $773,000. The waiver unitconsists of specialized eligibility staff that determine technical and financial eligibility for Medicaid waiverprograms authorized by the federal government. DHMH initiates waiver requests and, through this process,gains expertise on each program that will help it provide oversight for the transferred unit.

NI.00 - DHR - Family Investment
8
Exhibit 1
Governor’s Proposed BudgetFamily Investment
($ in Thousands)
How Much It Grows:General
FundSpecialFund
FederalFund Total
2002 Working Appropriation $127,365 $19,395 $397,017 $543,777
2003 Governor’s Allowance 127,797 20,547 417,673 566,018
Amount Change $432 $1,152 $20,656 $22,241
Percent Change 0.3% 5.9% 5.2% 4.1%
Where It Goes:
Personnel Expenses
Health insurance and retirement . . . . . . . . . . . . . . . . . . . . . . . . . . . . . . . . . . . . . . . . . . $2,338
Annualize fiscal 2002 general salary increase . . . . . . . . . . . . . . . . . . . . . . . . . . . . . . . . 1,753
Fiscal 2003 increments . . . . . . . . . . . . . . . . . . . . . . . . . . . . . . . . . . . . . . . . . . . . . . . . . 1,060
Increased turnover expectancy . . . . . . . . . . . . . . . . . . . . . . . . . . . . . . . . . . . . . . . . . . . (4,305)
Net fiscal 2003 cost containment . . . . . . . . . . . . . . . . . . . . . . . . . . . . . . . . . . . . . . . . . (3,871)
Other adjustments -- primarily for SB 1, deferred compensation, and the sick leaveincentive program . . . . . . . . . . . . . . . . . . . . . . . . . . . . . . . . . . . . . . . . . . . . . . . . . . . . (2,886)
Transfer of 19 positions to DHMH for Medicaid waiver unit (includes reduction of$13,000 for nonpersonnel expenses) . . . . . . . . . . . . . . . . . . . . . . . . . . . . . . . . . . . . . . . (773)
Assistance Payments
TCA payments ($28.9 million deficiency proposed for fiscal 2002) . . . . . . . . . . . . . . . . 35,627
Decline in food stamps to reflect recent trends . . . . . . . . . . . . . . . . . . . . . . . . . . . . . . . (11,249)
Other public assistance programs . . . . . . . . . . . . . . . . . . . . . . . . . . . . . . . . . . . . . . . . . 2,105
Initiatives
Addiction specialists to screen and refer TCA clients to substance abuse treatment . . . . 988
Work opportunities allocations to jurisdictions . . . . . . . . . . . . . . . . . . . . . . . . . . . . . . . 238
Food stamp reinvestment strategies . . . . . . . . . . . . . . . . . . . . . . . . . . . . . . . . . . . . . . . 59
Job Access/Reverse Commute . . . . . . . . . . . . . . . . . . . . . . . . . . . . . . . . . . . . . . . . . . . 45

NI.00 - DHR - Family Investment
Where It Goes:
9
Job skills enhancement (to be funded through work opportunities allocations) . . . . . . . . (1,056)
End of From the Ground Up demonstration project in Baltimore County . . . . . . . . . . . . (600)
School Counts at Baltimore City Community College (BCCC) (to be funded throughBaltimore City’s work opportunities allocation) . . . . . . . . . . . . . . . . . . . . . . . . . . . . . .
(587)
Special projects in Cecil and Talbot counties . . . . . . . . . . . . . . . . . . . . . . . . . . . . . . . . (229)
Contracts
Maryland Food Stamp Nutrition Education Program contract with the University ofMaryland, College Park (UMCP) (primarily federal funds) . . . . . . . . . . . . . . . . . . . . . . 772
Contract to assist Transitional Emergency Medical and Housing Assistance (TEMHA)recipients and participants in other public assistance programs to qualify for SupplementalSecurity Income (SSI) and Social Security Disability Income (SSDI) . . . . . . . . . . . . . . 551
Economic research and forecasting contract with the Regional Economic Studies Institute(RESI) at Towson University . . . . . . . . . . . . . . . . . . . . . . . . . . . . . . . . . . . . . . . . . . . . 197
Research contract with University of Maryland at Baltimore to study impact of welfarereform . . . . . . . . . . . . . . . . . . . . . . . . . . . . . . . . . . . . . . . . . . . . . . . . . . . . . . . . . . . . . (346)
Other Operating Expenses
Rent . . . . . . . . . . . . . . . . . . . . . . . . . . . . . . . . . . . . . . . . . . . . . . . . . . . . . . . . . . . . . . 979
Increased funding for contractual personnel for local work opportunities programs . . . 444
Fuel and utilities . . . . . . . . . . . . . . . . . . . . . . . . . . . . . . . . . . . . . . . . . . . . . . . . . . . . . 105
Increased travel costs . . . . . . . . . . . . . . . . . . . . . . . . . . . . . . . . . . . . . . . . . . . . . . . . . . 89
Purchase of motor vehicle and vehicle maintenance and repair . . . . . . . . . . . . . . . . . . . 21
Reduction in funds for additional office equipment . . . . . . . . . . . . . . . . . . . . . . . . . . . . (182)
Other . . . . . . . . . . . . . . . . . . . . . . . . . . . . . . . . . . . . . . . . . . . . . . . . . . . . . . . . . . . . . . 954
Total $22,241
Note: Numbers may not sum to total due to rounding.
Contracts
The funding levels for four contracts show significant changes in the allowance. Although DHR hascontracted with UMCP to implement the Maryland Food Stamp Nutrition Education Program for severalyears, this is the first time the dollars appear in DHR’s budget. Federal food stamp dollars comprise amajority of the $772,000 contract, while UMCP fulfills most of the required State match through in-kind

NI.00 - DHR - Family Investment
10
contributions.
The contract for the Disability Entitlement Advocacy Program (DEAP) receives an additional $551,000in the allowance. Through this program, the contractor, Health Management Associates, assists recipientsof TEMHA and TCA and children in foster care placements paid entirely with State dollars to qualify for SSIand SSDI. DEAP provides tracking, monitoring, representation, and assistance during the application andappeals process. The increased funding allows the contractor to handle an additional number of cases.Medicaid dollars cover half the contract costs, while the State provides an equal match. The allowance fundsthe contract at a less favorable federal match rate. DLS would ordinarily recommend reducing general fundsto reflect available federal dollars, but, given optimistic assumptions about Medicaid attainment in the fiscal2003 allowance, DHR will likely need the funds to cover shortfalls elsewhere.
The allowance also provides about $197,000 in increased funding for DHR’s economic research andforecasting contract with RESI at Towson University. The contract is primarily supported by TANF funds.In addition, the estimated need for the research contract with the University of Maryland at Baltimore(UMAB) decreases by $346,000 between fiscal 2002 and 2003. UMAB tracks TCA clients who leavewelfare and studies the impact of welfare reform.
Initiatives
Exhibit 1 also shows significant budgetary changes for various initiatives administered by the FamilyInvestment program. The allowance provides $3.2 million in TANF, an increase of nearly $1 millioncompared to fiscal 2002, for addictions specialists to screen TCA recipients and applicants at the LDSS. Thisis required by the Welfare Innovation Act of 2000. The fiscal 2002 budget contains only $2.2 million forthese services, so DHR will likely have to transfer funds from other activities to cover costs associated withthis initiative.
The allowance provides $41.4 million in work opportunities dollars to distribute to the local jurisdictionsto operate their locally designed Family Investment programs (FIP). This is an increase of about $238,000compared to fiscal 2002, but in fiscal 2003, many LDSS may need to fund additional activities within theseallocations. For example, should the ten LDSS that operated the Job Skills Enhancement Project infiscal 2002 plan to continue the program in fiscal 2003, they must use their work opportunities allocationsto support the initiative. In previous years, DHR budgeted funds to distribute to LDSS for the demonstrationproject. The allowance eliminates the $1.0 million provided in fiscal 2002 for this purpose. According tothe Family Investment Administration (FIA), it has a policy of supporting demonstration projects for onlytwo to three years. Likewise, the allowance eliminates funding for the School Counts Program at BCCC andspecial projects in Cecil and Talbot counties to reflect the expectation that the jurisdictions, if they determinethe programs should continue, will make use of their work opportunities allocation to do so.
To encourage participation in the Job Skills Enhancement Program, the Welfare Innovation Act of 2001modified the program eligibility requirements to include those participating in FIP within the previous 36months rather than the previous 18 months. Without specified funding available to provide to jurisdictions,it seems that LDSS may have less incentive to operate the program. DLS recommends that the Secretarycomment on the effectiveness of the Job Skills Enhancement Project and the number of jurisdictionsthat intend to continue operating this program in fiscal 2003.

NI.00 - DHR - Family Investment
11
Assistance Payments
Total funding for assistance payments increases by $26.5 million in the fiscal 2003 allowance. Thisprimarily reflects increased funding of $35.6 for TCA payments offset by a reduction of $11.2 million in foodstamps consistent with recent levels of participation in the program. Exhibit 2 shows caseload trends forpublic assistance programs operated by FIP. For all programs but TCA and TEMHA, the estimated 2003caseload matches, or nearly matches, the fiscal 2001 caseload. The allowance assumes that the TCA caseloadwill drop by less than 1% compared to the estimated fiscal 2002 caseload. Issue #1 will contain additionalinformation on TCA caseload projections.
Exhibit 2
Caseload Trends in Public Assistance ProgramsFiscal 1998 though 2003
ActualFY 1998
ActualFY 1999
ActualFY 2000
ActualFY 2001
EstimatedFY 2002
EstimatedFY 2003
%Change
FY 02-03
Food Stamp Households 140,913 145,924 105,457 97,500 105,932 97,500 (8.0%)
TCA 136,183 99,600 79,065 75,710 74,458 73,835 (0.8%)
TEMHA 12,459 11,700 10,566 10,768 10,566 10,566 0.0%
Public Assistance toAdults 1,690 2,852 2,865 2,981 2,865 2,981 4.0%
Emergency Assistance 1,210 960 987 1,066 987 1,066 8.0%
Burial Assistance 761 817 725 699 828 700 (15.5%)
Refugee Assistance 214 181 149 278 222 278 25.2
Source: Governor’s Budget Books
Performance Analysis: Managing for Results
The Managing for Results (MFR) submission for the Family Investment programs includes four goals.Most of them involve the largest population served by FIA, TCA clients. Exhibit 3 shows these goals alongwith their corresponding performance measures. Progress made in the indicators under the first goal dependson meeting many of the indicators found under the last three goals. For example, assuring that individualsand families receive appropriate benefits and placing TCA clients in employment where earnings increase overtime promote the first goal of moving families with an employable parent and no children under one towarda speedy and lasting exit from TCA.
One of the performance indicators under the first goal measures the percentage of families who exit TCA

NI.00 - DHR - Family Investment
12
each year. The percent decreased between fiscal 1999 and 2000 but showed improvement in fiscal 2001. Exhibit 3
Program Measurement DataFamily Investment
Fiscal 1999 through 2003
Actual1999
Actual2000
Est.2001
Actual2001
Est.2002
Est.2003
Ann.Chg.99-01
Ann.Chg.01-03
Move families with an employable parent and no children under one toward a speedy and lasting exit from TCA.
Percent of families whoexit from TCA 11% 9% 8% 10% 9% 8% -4.7% -10.6%
Percent of TCA caseclosures that remainclosed for 12 consecutivemonths 63% 60% 55% 50% 50% 50% -10.9% 0.0%
Percent of families withan adult receiving TCAwho have receivedassistance every monthsince January 1, 1997 21% 10% 7% 4% 2% 1% -56.4% -50.0%
Assure individuals and families receive appropriate benefits.
Percent of TCA casesclosed due to earningswhich receive foods t a m p s , m e d i c a lassistance or child caresubsidies in the followingmonth 77% 95% 95% 96% 97% 97% 11.7% 0.5%
Percent of TCA casesclosed or denied for otherthan earnings whichreceive food stamps,medical assistance, orchild care subsidies in thefollowing month n/a 60% n/a 60% 60% 60% n/a 0.0%
Weighted average ofmonths from the date ofTEMHA application untildate of approval of SSI n/a 21 n/a 20 21 21 n/a 1.7%

NI.00 - DHR - Family Investment
Actual1999
Actual2000
Est.2001
Actual2001
Est.2002
Est.2003
Ann.Chg.99-01
Ann.Chg.01-03
13
Proportion of correct foodstamp dollars in samplecompared to total foodstamp dollars in sample(federal fiscal year) 86.4% 88.9% 90 90.2%* 91.9% 94.1% 2.2% 2.1%
Place TCA individuals in employment where earnings increase over time.
P e r c e n t i n c r e a s e dearnings over time foremployed individuals 35% 50% 40% 52% 50% 50% 21.9% -1.9%
Increase the number of TCA families where an adult family member obtained and retained employment.
Total number of jobplacements n/a 7,076 n/a 7,125 6,027 6,300 n/a -6.0%
Job retention rate 70% 74% 70% 74% 75% 77% 2.8% 2.0%
*Indicates estimate.
Source: Governor’s Budget Books
With the sluggish economy, DHR anticipates that the percentage of families leaving TCA will decrease infiscal 2002 and 2003. The second measure under DHR’s goal of moving employable parents with no childrenunder one toward a speedy and lasting exit from TCA involves the percentage of cases that remain closedfor 12 consecutive months. This reflects upon the families’ ability to secure permanent employment withsufficient earnings and to access needed benefits. The percentage of cases that remained closed has decreasedbetween fiscal 1999 to 2001, from 63% to 50%. DHR does not expect improvements in fiscal 2002 or 2003.Because of the federal five-year time limit on lifetime assistance, DHR tracks the percentage of families withan adult receiving TCA who have received assistance every month since January 1, 1997. The percentagehas decreased since fiscal 1999 suggesting that, at least in the near future, DHR will not need to discontinueTCA grants to families solely because of time limits.
As stated above, the second goal of assuring that individuals and families receive appropriate benefitshelps support the first goal of moving families toward a speedy and lasting exit from TCA. One of themeasures under the second goal tracks the percentage of TCA cases closed due to earnings who receive foodstamps, medical assistance, or child care subsidies in the following month. DHR has made improvements inthis area. Between fiscal 1999 and 2001, the annual percentage increase was almost 12%.
The third goal involves placing individuals in employment where earnings increase over time. Theoutcome indicator, which tracks the percent of increased earnings over time for employed individuals, hasimproved from 35% in fiscal 1999 to 52% in fiscal 2001. The legislative auditors determined that DHR didnot retain the data needed to support this reported performance measure. However, when the data was re-

NI.00 - DHR - Family Investment
14
generated, the auditors found that the reported results were reasonably accurate. The auditors offeredrecommendations to improve the computer match procedure used to determine earnings over time.
Increasing the number of TCA families where an adult family member obtained and retained employmentis FIA’s fourth MFR goal. The first measure, the total number of job placements, increased between fiscal2000 and 2001 but is expected to decline in fiscal 2002. The slow economy, as well as the characteristicsof the current caseload, hinders DHR’s ability to make significant progress in this area. The legislativeauditors identified issues related to the calculation of this measure and recommended enhancements to themethodology. DHR has implemented the recommendation of the auditors. The second measure under thefourth goal tracks the job retention rate. The measure indicates that, in fiscal 2000 and 2001, 74% ofindividuals who obtained employment in one calendar quarter remained employed in the following quarter.DHR anticipates that this percentage will improve in fiscal 2002 and 2003.

NI.00 - DHR - Family Investment
15
Issues
1. TCA Caseload Remains Steady
In the early years of welfare reform, efforts to transition individuals from welfare to work and a growingeconomy led to rapid reductions in the number of TCA recipients. From January 1995 to January 2000, thecaseload plummeted from an all-time high of 227,887 to only 77,340 individuals. After dropping at ratesexceeding 20% per year during the late 1990s, the pace of caseload declines has leveled off. Since the startof fiscal 2001, the caseload has fluctuated from month to month. Despite these fluctuations, the caseloadcontinues to exhibit an overall downward trend. For example, the August 2001 caseload was lower than theAugust 2000 caseload by almost 3,550 individuals. In December 2001, the latest month for which data areavailable, the number of individuals receiving TCA payments dropped by about 2,080 compared to December2000.
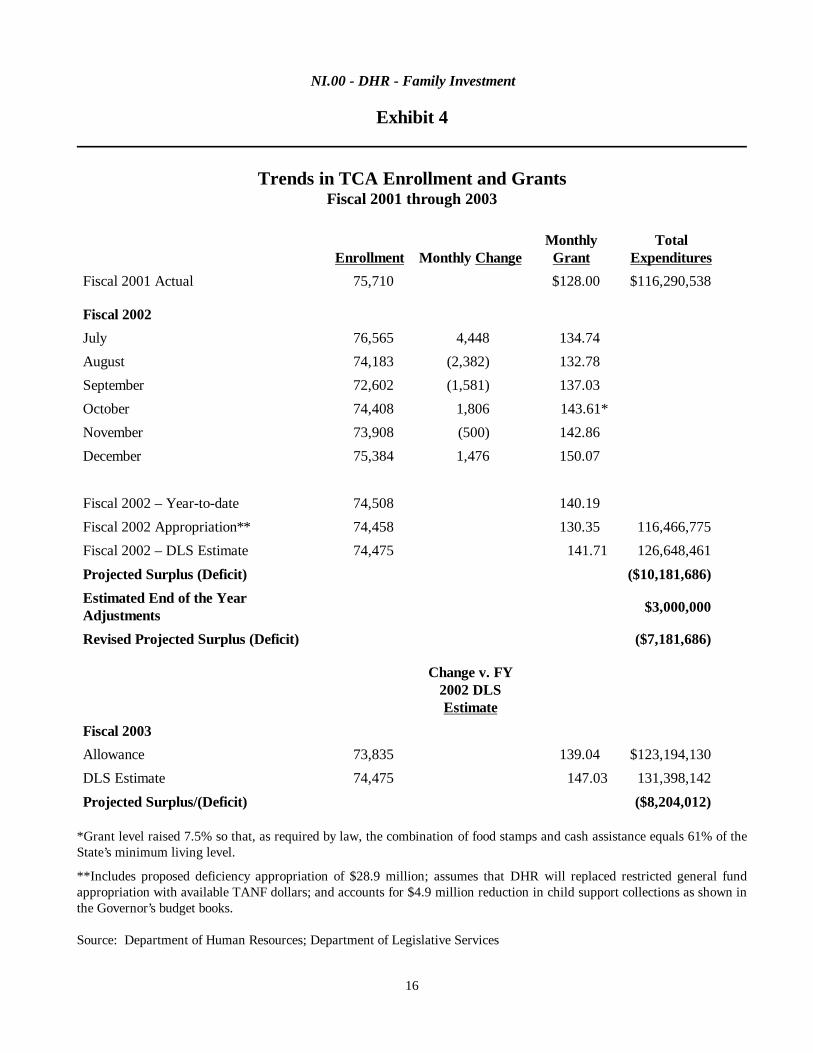
Exhibit 4 shows trends in TCA enrollment and average grant amounts. In December 2001, a traditionallyhigh month for cash assistance caseloads, the number of individuals receiving TCA reached 75,384. Duringthe month of December, approximately 30% of the new cases had never received cash assistance. Preliminarydata for January show that this number declined by about 2,000 individuals. The fiscal 2002 appropriationwith the proposed deficiency appropriation assumes an monthly average caseload of 74,458, which is aboutequal to the average monthly caseload for the first six months of the fiscal year. At 74,475, DLS hasprojected similar caseload level for fiscal 2002. After the terrorist attacks on September, 11, 2001, RESI atTowson University revised its caseload estimates. Its projections resemble those of DLS and DBM.
The differences in the projections lie with the grant amount. As shown in the exhibit, the average monthlygrant amount in the fiscal 2002 budget, accounting for the deficiency appropriation, is about $130 perindividual; this is $10 less than the average monthly grant amount for the first six months of fiscal 2002. InOctober, the grant amount increased by 7.5% so that the combination of food stamps and TCA benefitsequates to 61% of the State’s minimum living level. As such, the average monthly grant amount for the firstsix months of the fiscal year will be less than that for the entire year. DLS projects a fiscal 2002 grant amountof about $142 per individual. Coupled with the estimated caseload of 74,475, costs for the year total$126.6 million, or $10.1 million above the fiscal 2002 budget with the deficiency. At the end of the year,DHR typically makes adjustments to its TCA expenditure reports. DLS estimates that these adjustments willtotal about $3.0, an amount similar to the adjustments made in fiscal 2001. The projected TCA deficit forfiscal 2002 would drop to $7.1 million. DHR can likely cover about $2.0 million of this shortfall with higher-than-anticipated child support collections.
NI.00 - DHR - Family Investment
16
Exhibit 4
Trends in TCA Enrollment and GrantsFiscal 2001 through 2003
Enrollment Monthly ChangeMonthly
GrantTotal
Expenditures
Fiscal 2001 Actual 75,710 $128.00 $116,290,538
Fiscal 2002
July 76,565 4,448 134.74
August 74,183 (2,382) 132.78
September 72,602 (1,581) 137.03
October 74,408 1,806 143.61*
November 73,908 (500) 142.86
December 75,384 1,476 150.07
Fiscal 2002 – Year-to-date 74,508 140.19
Fiscal 2002 Appropriation** 74,458 130.35 116,466,775
Fiscal 2002 – DLS Estimate 74,475 141.71 126,648,461
Projected Surplus (Deficit) ($10,181,686)
Estimated End of the YearAdjustments
$3,000,000
Revised Projected Surplus (Deficit) ($7,181,686)
Change v. FY2002 DLSEstimate
Fiscal 2003
Allowance 73,835 139.04 $123,194,130
DLS Estimate 74,475 147.03 131,398,142
Projected Surplus/(Deficit) ($8,204,012)
*Grant level raised 7.5% so that, as required by law, the combination of food stamps and cash assistance equals 61% of theState’s minimum living level.
**Includes proposed deficiency appropriation of $28.9 million; assumes that DHR will replaced restricted general fundappropriation with available TANF dollars; and accounts for $4.9 million reduction in child support collections as shown inthe Governor’s budget books.
Source: Department of Human Resources; Department of Legislative Services

NI.00 - DHR - Family Investment
17
In fiscal 2003 DLS projects that the average monthly caseload wi11 remain at 74,475. This is slightlyhigher than the level assumed in the allowance and a bit lower than the level projected by RESI in its mostrecent report. The estimated average monthly grant amount is about $147 per individual. The increasecompared to fiscal 2002 reflects a 5% grant increase to keep pace with 61% of the State’s minimum livinglevel. DLS estimates that total costs will reach $131.4 million in fiscal 2003. This exceeds the amount in theallowance by $8.2 million. Even if the average monthly grant amount were to remain at its current levelthrough fiscal 2003, DHR could still face a $3 million deficit.
As stated above, the TCA grant amount increases every October so that the combination of food stampsand TCA benefits equates to 61% of the State’s minimum living level. For the past two years, these rateincreases have been significant. The rate grew by 5.3% and 7.5% in fiscal 2001 and 2002, respectively. Thisexceeded the percentage increases offered to State employees. To constrain costs, DLS will recommendeliminating the 2% general salary increase for State employees contained in the fiscal 2003 allowance. Tomake income increases consistent with those for State employees, DLS recommends that the annualTCA grant increase provided every October not be provided in fiscal 2003. The specific language isas follows:
It is the intent of the General Assembly that no grant increase be provided for Temporary Cash Assistancepayments in fiscal 2003.
Explanation: The fiscal 2002 and 2003 budgets do not contain sufficient funding to cover costs associatedwith Temporary Cash Assistance (TCA) benefits. Given the State’s fiscal situation, it seems unlikely thatsignificant deficiency appropriations will be available next year to cover shortfalls. Further, the budget passedby the General Assembly does not include a general salary increase for State employees. As such, the actionto freeze TCA grants at their current level is consistent with actions taken in other parts of the budget. Thisaction will save approximately $5 million in Temporary Assistance to Needy Families (TANF) block grantdollars, which can help fund the TCA deficit.
DLS also recommends that the Secretary discuss DHR’s caseload projections and how theycompare to the DLS estimates.
Characteristics of the Current Caseload
To track recipients needing employment services, DHR divides the caseload into two main groups: the“core” caseload and cases headed by an employable adult. The core cases include child only cases, parentswith a child under age one, disabled cases, and relative caretakers. Of these four types of core cases, onlyparents with a child under age one will require employment services in the near future. Until the baby turnsone-year-old, these parent may temporarily suspend work activities. In general, the department does notexpect the remaining three types of core cases to transition off cash assistance by seeking employment.Child-only cases, for example, typically leave the rolls after reaching adulthood. As employable adults havesuccessfully entered the labor market, the core cases have represented an ever increasing percentage of thetotal TCA caseload. As shown in Exhibit 5, core cases comprised almost 55% of the TCA caseload inNovember 2001, up from 37% in December 1998. However, this is essentially the same percentage as

NI.00 - DHR - Family Investment
18
fiscal 2002, reflecting a relatively stable caseload.
Exhibit 5
Characteristics of TCA CasesNovember 2001
Source: Department of Human Resources
DHR focuses its employment programs on the second main group, cases headed by an employable adult.Exhibit 5 shows that these cases represented 45% of the total TCA caseload in November 2001. A smallpercentage of the employable cases currently participate in the labor market, but because of insufficientearnings, they continue to receive cash assistance. The local department in Baltimore City serves nearly 70%of cases headed by an employable adult. At just over 10%, Prince George’s County has the second highestpercentage of these cases.
In the early years of welfare reform, the department concentrated on serving those easiest to place inemployment. Through its successful efforts, most of these cases have transitioned from welfare to work.Now, the remaining cases headed by an employable adult typically face multiple barriers to employment suchas substance abuse and/or mental health issues, poor work histories, low educational attainment, and limitedaccess to transportation. In addition, many of these cases have relied on cash assistance for long periods oftime. Over 36% received cash benefits for over five years during their lifetimes. To realize further caseloadreductions, the department must continue to provide intensive services to help these employable adults enterand remain in the labor force.
Based on November 2001 data, Exhibit 6 shows the number and percentage of cases headed by an

NI.00 - DHR - Family Investment
19
employable adult based on their cumulative length of stay on TCA and AFDC. The exhibit does not includeadult-headed households with earnings who receive the 35% earned income disregard. Because the State
Exhibit 6
TCA Length of Stay for Employable AdultsNovember 2001
Length of TimeCases Headed by Employable Adult Percentage of Cases
Less than 12 months 2,053 18.4%
12 to 24 months 2,041 18.3%
25 to 29 months 629 5.6%
30 to 48 months 1,662 14.9%
49 to 60 months 747 6.7%
Over 60 months 4,048 36.2%
Total 11,180 100.0%
Source: Department of Human Resources
funds cash assistance to these cases with State funds, they are not subject to the time limit. At 36%, thosewho have spent over five years during their lifetime receiving cash assistance comprise the single largestgroup of cases headed by an employable adult. This has decreased slightly from the November 2000percentage of 41%, suggesting that DHR has had some success in moving long-term recipients intopermanent employment. The vast majority of the families receiving cash assistance for over five years, or81%, reside in Baltimore City. Prince George’s County follows at 8%. Those who have received assistancefor two years or less during their lifetime, comprise roughly 37% of cases headed by an employable adult.Once again, most of these cases live in Baltimore City. Because the numbers in the exhibit reflect cumulativelifetime receipt of cash assistance since January 1977, the numbers do not indicate those subject to the timelimit.
2. January 2002 Marked the Start of the Five-year Time Limit on Cash Assistance
Moving employable adults from welfare to employment is particularly important in light of the federallifetime limit placed on receipt of cash assistance. Beginning in January 1997, federal law prohibits casesheaded by an adult from receiving TANF-funded cash benefits for more than five cumulative years. The lawalso provides for exemptions to the time limit for "hardship" as defined by the State. Under this provision,20% of the adult-headed caseload receiving TANF-funded cash assistance may continue to receive thesebenefits beyond five years. The Welfare Innovation Act of 2002 requires DHR to establish, by regulation,the standards and procedures for LDSS to apply the hardship exemption. In the event that the number offamilies exempted exceeds the 20% limit, the law provides that State dollars will support TCA payments for
NI.00 - DHR - Family Investment
20
those families that are complying with program requirements.
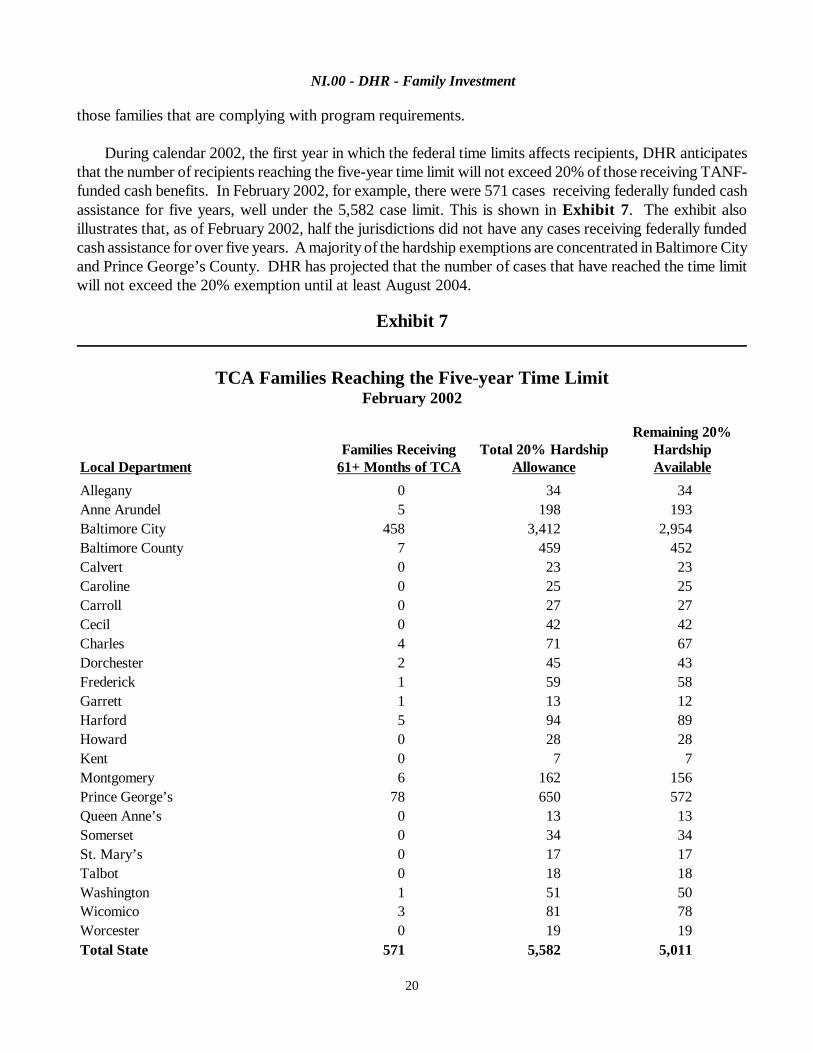
During calendar 2002, the first year in which the federal time limits affects recipients, DHR anticipatesthat the number of recipients reaching the five-year time limit will not exceed 20% of those receiving TANF-funded cash benefits. In February 2002, for example, there were 571 cases receiving federally funded cashassistance for five years, well under the 5,582 case limit. This is shown in Exhibit 7. The exhibit alsoillustrates that, as of February 2002, half the jurisdictions did not have any cases receiving federally fundedcash assistance for over five years. A majority of the hardship exemptions are concentrated in Baltimore Cityand Prince George’s County. DHR has projected that the number of cases that have reached the time limitwill not exceed the 20% exemption until at least August 2004.
Exhibit 7
TCA Families Reaching the Five-year Time LimitFebruary 2002
Local DepartmentFamilies Receiving
61+ Months of TCATotal 20% Hardship
Allowance
Remaining 20%HardshipAvailable
Allegany 0 34 34Anne Arundel 5 198 193Baltimore City 458 3,412 2,954Baltimore County 7 459 452Calvert 0 23 23Caroline 0 25 25Carroll 0 27 27Cecil 0 42 42Charles 4 71 67Dorchester 2 45 43Frederick 1 59 58Garrett 1 13 12Harford 5 94 89Howard 0 28 28Kent 0 7 7Montgomery 6 162 156Prince George’s 78 650 572Queen Anne’s 0 13 13Somerset 0 34 34St. Mary’s 0 17 17Talbot 0 18 18Washington 1 51 50Wicomico 3 81 78Worcester 0 19 19Total State 571 5,582 5,011

NI.00 - DHR - Family Investment
21
Source: Department of Human Resources
DLS recommends that the Secretary discuss:
� the most recent estimates of those reaching the five-year time limit;
� DHR’s efforts to move long-term recipients into employment; and
� the challenges associated with that task.
3. Substance Abuse Screening and Referrals Provided to TCA Clients
To ensure that TCA applicants and recipients receive substance abuse treatment as necessary, the WelfareInnovation Act of 2000 (Chapter 671 – HB 1160) requires the placement of addiction specialists in everyLDSS. The program is known as Substance Abuse Treatment Services (SATS). DHR has entered into amemorandum of understanding (MOU) with DHMH to carry out the provisions of the bill. Under the MOU,DHR transfers funding to DHMH. In turn, DHMH provides funds to local health departments or nonprofitagencies to hire addiction specialists. These specialists are placed at LDSS to screen TCA applicants, providereferrals to treatment programs, and monitor the progress of those participating in treatment programs. Thefiscal 2003 allowance includes $3.2 million in TANF dollars to support this initiative. The fiscal 2002 budgetcontains only $2.2 million in TANF. DHR anticipates that it will need additional funds to support theinitiative in fiscal 2002. As such, it will have to access funds available in other programs.
According to DHR, 68 out of 74 addiction specialists have been hired to date. The most notableimplementation delays occurred in Baltimore City. The health department in Baltimore City contracted withBaltimore Substance Abuse Systems (BSAS) to hire and supervise the addiction specialists at the localdepartments. As of October 1, 2001, State law limits the hiring of addiction specialists to certified programs.Because, as an organization, BSAS did not possess the necessary certification, it had to subcontract with acertified program. Since that time, Baltimore City has made significant progress in filling its allotment ofpositions.
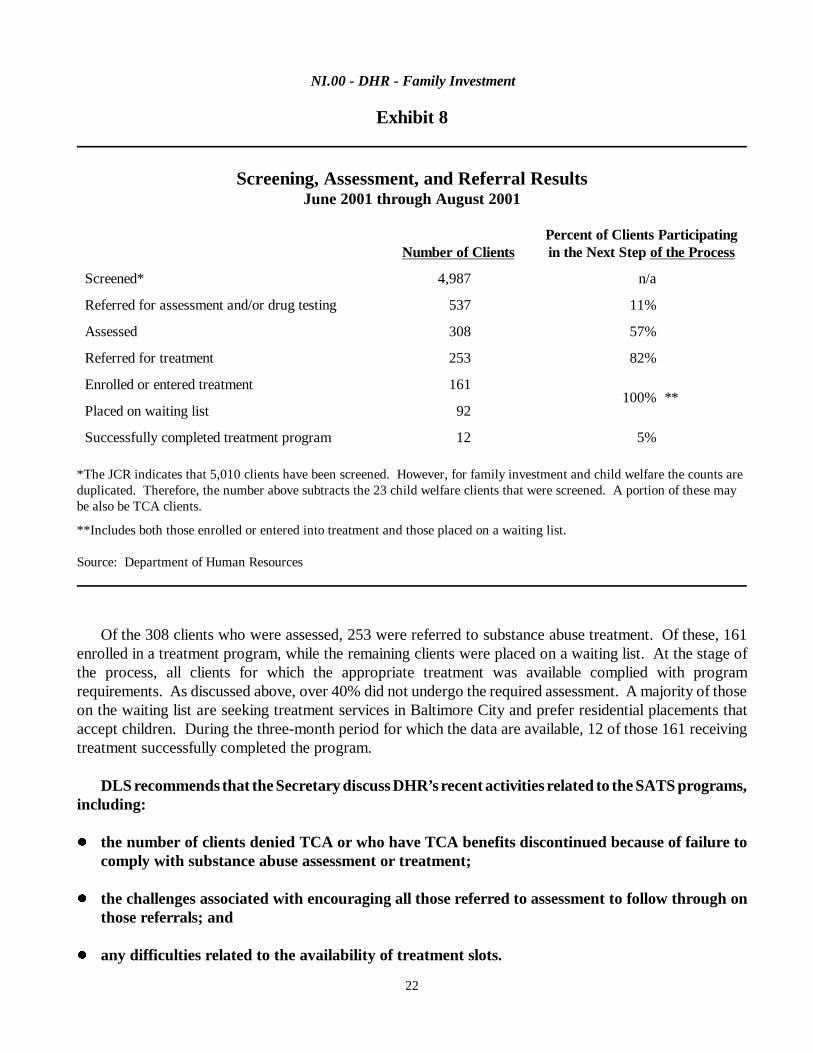
In the latest quarterly report required by the 2001 Joint Chairmen’s Report (JCR), DHR providedstatistics related to program activities. Based on three months of data, June 2001 through August of 2001,addiction specialists screened a total of 4,987 clients. This is shown in Exhibit 8. A majority, or 4,961, ofthe clients screened were TCA applicant or recipients. The remaining 26 were considered food-stamp-onlycustomers. A portion of these clients may also be involved with the child welfare system and have receivedscreening and assessment under the law requiring the Integration of Child Welfare and Substance AbuseTreatment (Chapters 550 and 551, Acts of 2000 (SB 671/HB 7)).
The exhibit shows that addiction specialists determined that 537, or 11%, of the clients they screenedshould receive substance abuse assessment or drug testing. Of those applicants or recipients, less than 60%actually underwent the assessment or drug testing. This suggests that 229 individuals were denied TCAbenefits or received notification that LDSS would discontinue their benefits within 30 days if they did notcome into compliance with the recommendation made by their addiction specialist.
NI.00 - DHR - Family Investment
22
Exhibit 8
Screening, Assessment, and Referral ResultsJune 2001 through August 2001
Number of ClientsPercent of Clients Participatingin the Next Step of the Process
Screened* 4,987 n/a
Referred for assessment and/or drug testing 537 11%
Assessed 308 57%
Referred for treatment 253 82%
Enrolled or entered treatment 161100% **
Placed on waiting list 92
Successfully completed treatment program 12 5%
*The JCR indicates that 5,010 clients have been screened. However, for family investment and child welfare the counts areduplicated. Therefore, the number above subtracts the 23 child welfare clients that were screened. A portion of these maybe also be TCA clients.
**Includes both those enrolled or entered into treatment and those placed on a waiting list.
Source: Department of Human Resources
Of the 308 clients who were assessed, 253 were referred to substance abuse treatment. Of these, 161enrolled in a treatment program, while the remaining clients were placed on a waiting list. At the stage ofthe process, all clients for which the appropriate treatment was available complied with programrequirements. As discussed above, over 40% did not undergo the required assessment. A majority of thoseon the waiting list are seeking treatment services in Baltimore City and prefer residential placements thataccept children. During the three-month period for which the data are available, 12 of those 161 receivingtreatment successfully completed the program.
DLS recommends that the Secretary discuss DHR’s recent activities related to the SATS programs,including:
� the number of clients denied TCA or who have TCA benefits discontinued because of failure tocomply with substance abuse assessment or treatment;
� the challenges associated with encouraging all those referred to assessment to follow through onthose referrals; and
� any difficulties related to the availability of treatment slots.
NI.00 - DHR - Family Investment
23
4. Accessing the Food Stamp Program
Food Stamp Participation Levels
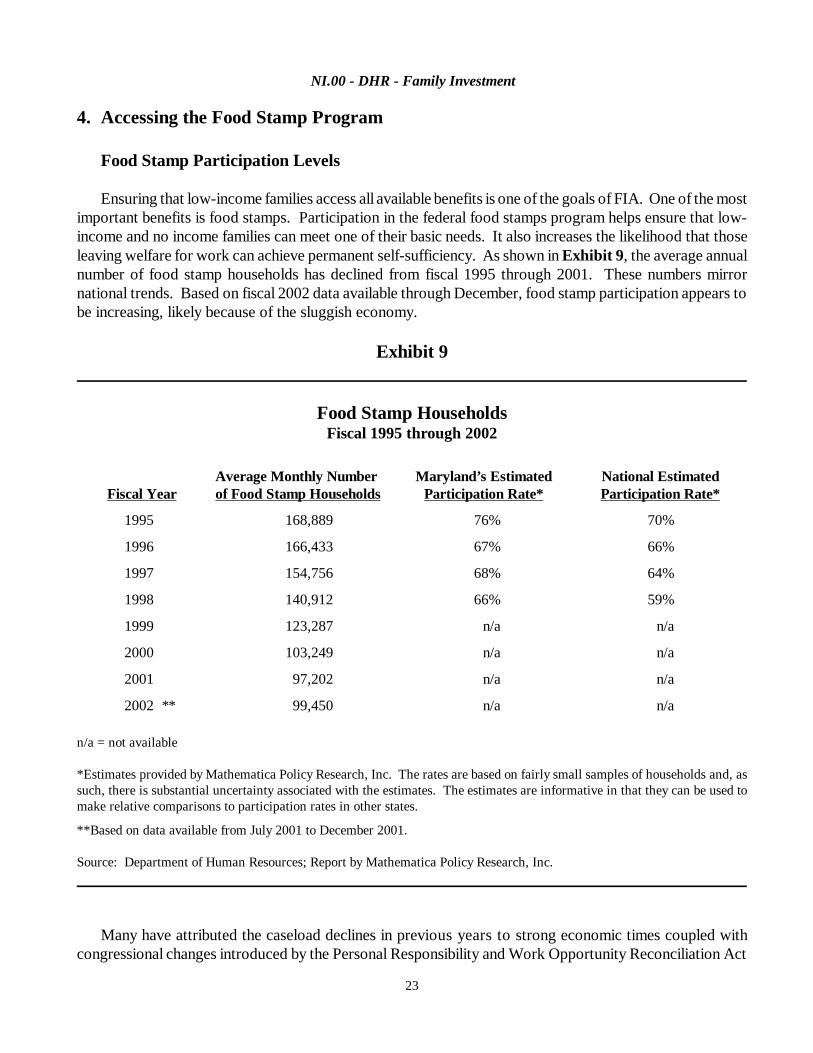
Ensuring that low-income families access all available benefits is one of the goals of FIA. One of the mostimportant benefits is food stamps. Participation in the federal food stamps program helps ensure that low-income and no income families can meet one of their basic needs. It also increases the likelihood that thoseleaving welfare for work can achieve permanent self-sufficiency. As shown in Exhibit 9, the average annualnumber of food stamp households has declined from fiscal 1995 through 2001. These numbers mirrornational trends. Based on fiscal 2002 data available through December, food stamp participation appears tobe increasing, likely because of the sluggish economy.
Exhibit 9
Food Stamp HouseholdsFiscal 1995 through 2002
Fiscal YearAverage Monthly Numberof Food Stamp Households
Maryland’s EstimatedParticipation Rate*
National EstimatedParticipation Rate*
1995 168,889 76% 70%
1996 166,433 67% 66%
1997 154,756 68% 64%
1998 140,912 66% 59%
1999 123,287 n/a n/a
2000 103,249 n/a n/a
2001 97,202 n/a n/a
2002 ** 99,450 n/a n/a
n/a = not available
*Estimates provided by Mathematica Policy Research, Inc. The rates are based on fairly small samples of households and, assuch, there is substantial uncertainty associated with the estimates. The estimates are informative in that they can be used tomake relative comparisons to participation rates in other states.
**Based on data available from July 2001 to December 2001.
Source: Department of Human Resources; Report by Mathematica Policy Research, Inc.
Many have attributed the caseload declines in previous years to strong economic times coupled withcongressional changes introduced by the Personal Responsibility and Work Opportunity Reconciliation Act
NI.00 - DHR - Family Investment
24
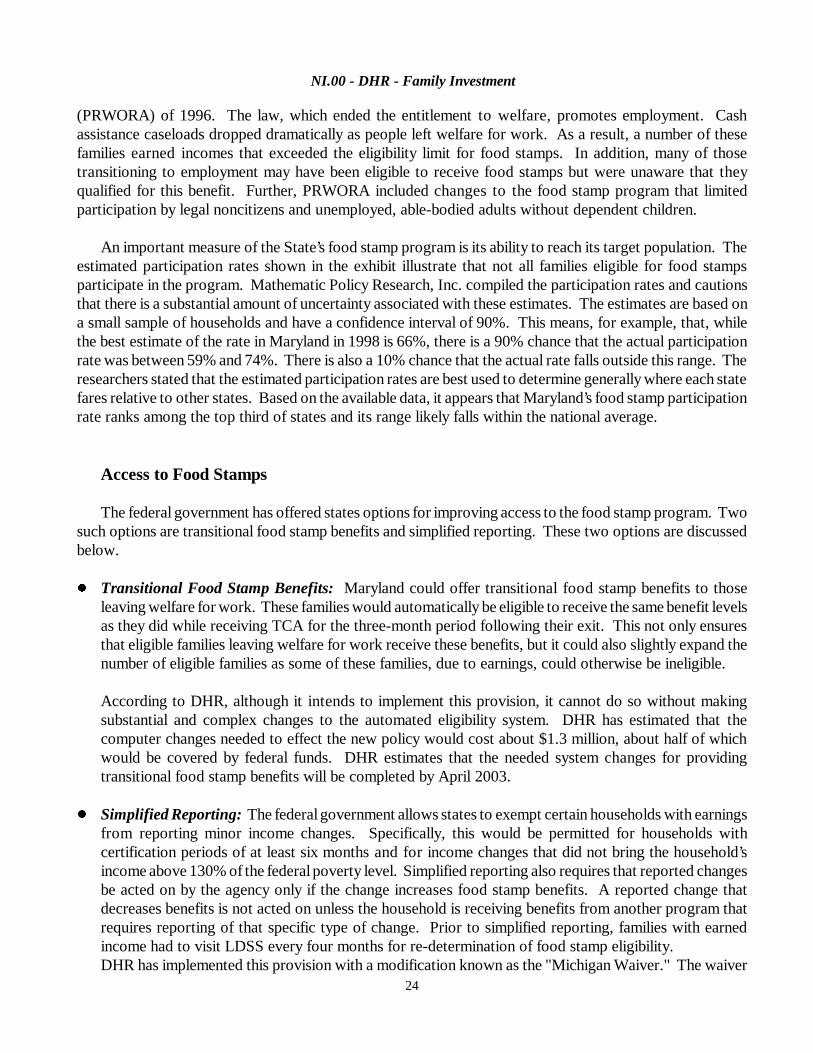
(PRWORA) of 1996. The law, which ended the entitlement to welfare, promotes employment. Cashassistance caseloads dropped dramatically as people left welfare for work. As a result, a number of thesefamilies earned incomes that exceeded the eligibility limit for food stamps. In addition, many of thosetransitioning to employment may have been eligible to receive food stamps but were unaware that theyqualified for this benefit. Further, PRWORA included changes to the food stamp program that limitedparticipation by legal noncitizens and unemployed, able-bodied adults without dependent children.
An important measure of the State’s food stamp program is its ability to reach its target population. Theestimated participation rates shown in the exhibit illustrate that not all families eligible for food stampsparticipate in the program. Mathematic Policy Research, Inc. compiled the participation rates and cautionsthat there is a substantial amount of uncertainty associated with these estimates. The estimates are based ona small sample of households and have a confidence interval of 90%. This means, for example, that, whilethe best estimate of the rate in Maryland in 1998 is 66%, there is a 90% chance that the actual participationrate was between 59% and 74%. There is also a 10% chance that the actual rate falls outside this range. Theresearchers stated that the estimated participation rates are best used to determine generally where each statefares relative to other states. Based on the available data, it appears that Maryland’s food stamp participationrate ranks among the top third of states and its range likely falls within the national average.
Access to Food Stamps
The federal government has offered states options for improving access to the food stamp program. Twosuch options are transitional food stamp benefits and simplified reporting. These two options are discussedbelow.
� Transitional Food Stamp Benefits: Maryland could offer transitional food stamp benefits to thoseleaving welfare for work. These families would automatically be eligible to receive the same benefit levelsas they did while receiving TCA for the three-month period following their exit. This not only ensuresthat eligible families leaving welfare for work receive these benefits, but it could also slightly expand thenumber of eligible families as some of these families, due to earnings, could otherwise be ineligible.
According to DHR, although it intends to implement this provision, it cannot do so without makingsubstantial and complex changes to the automated eligibility system. DHR has estimated that thecomputer changes needed to effect the new policy would cost about $1.3 million, about half of whichwould be covered by federal funds. DHR estimates that the needed system changes for providingtransitional food stamp benefits will be completed by April 2003.
� Simplified Reporting: The federal government allows states to exempt certain households with earningsfrom reporting minor income changes. Specifically, this would be permitted for households withcertification periods of at least six months and for income changes that did not bring the household’sincome above 130% of the federal poverty level. Simplified reporting also requires that reported changesbe acted on by the agency only if the change increases food stamp benefits. A reported change thatdecreases benefits is not acted on unless the household is receiving benefits from another program thatrequires reporting of that specific type of change. Prior to simplified reporting, families with earnedincome had to visit LDSS every four months for re-determination of food stamp eligibility.DHR has implemented this provision with a modification known as the "Michigan Waiver." The waiver

NI.00 - DHR - Family Investment
25
allows case managers to act on all reported changes, including those that decrease the household foodstamp benefits. As such, during the six-month period, the households’ food stamp level may be adjustedup or down depending on the nature of the reported change. Some are concerned this dilutes the purposeof simplified reporting, an option that allows states to provide a stable benefit level for six months.
According to DHR, it had to implement simplified reporting in conjunction with the "Michigan Waiver"to make food stamp policy consistent with policies for TCA and Medicaid, programs for whichregulations require that case managers act on all reported changes. In addition, the automated eligibilitysystem would need to undergo modifications to drop the "Michigan Waiver." DHR estimates that thesemodifications would cost almost $1 million. The federal government would cover half of these costs.
DLS recommends that the Secretary discuss DHR’s efforts to improve access to the food stampprogram, including implementation of Transitional Food Stamp Benefits and use of the "MichiganWaiver."
NI.00 - DHR - Family Investment
26
Recommended Actions
AmountReduction
PositionReduction
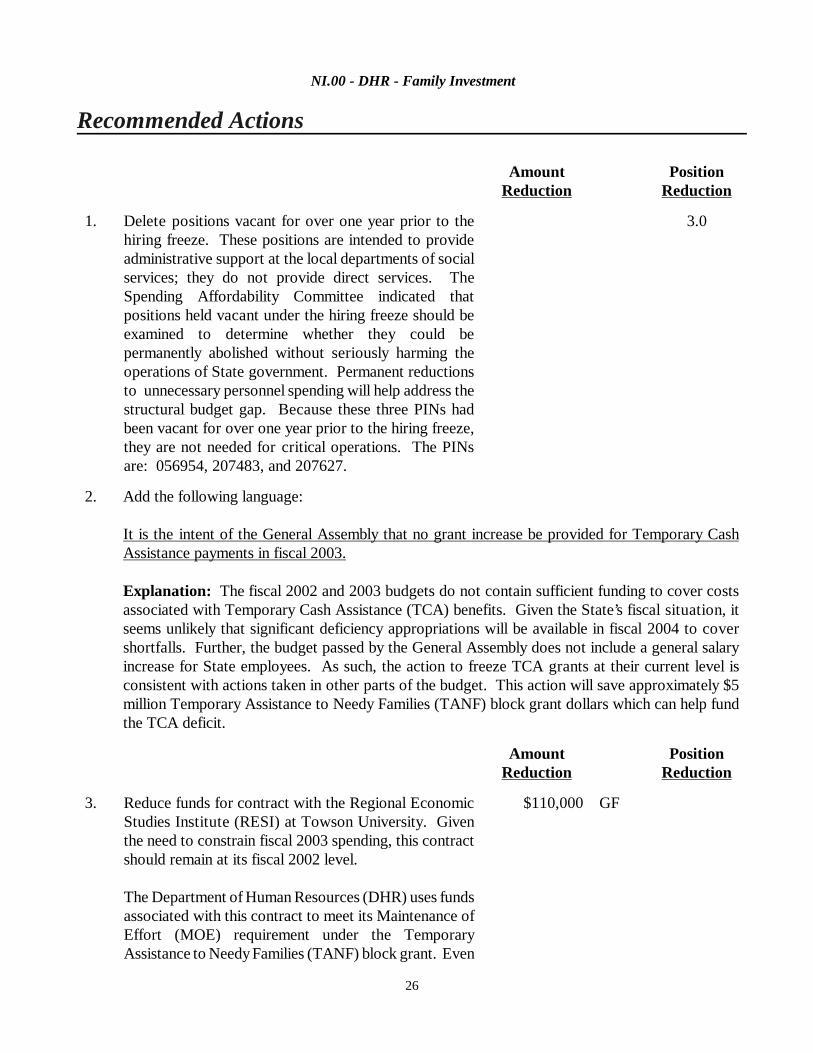
1. Delete positions vacant for over one year prior to thehiring freeze. These positions are intended to provideadministrative support at the local departments of socialservices; they do not provide direct services. TheSpending Affordability Committee indicated thatpositions held vacant under the hiring freeze should beexamined to determine whether they could bepermanently abolished without seriously harming theoperations of State government. Permanent reductionsto unnecessary personnel spending will help address thestructural budget gap. Because these three PINs hadbeen vacant for over one year prior to the hiring freeze,they are not needed for critical operations. The PINsare: 056954, 207483, and 207627.
3.0
2. Add the following language:
It is the intent of the General Assembly that no grant increase be provided for Temporary CashAssistance payments in fiscal 2003.
Explanation: The fiscal 2002 and 2003 budgets do not contain sufficient funding to cover costsassociated with Temporary Cash Assistance (TCA) benefits. Given the State’s fiscal situation, itseems unlikely that significant deficiency appropriations will be available in fiscal 2004 to covershortfalls. Further, the budget passed by the General Assembly does not include a general salaryincrease for State employees. As such, the action to freeze TCA grants at their current level isconsistent with actions taken in other parts of the budget. This action will save approximately $5million Temporary Assistance to Needy Families (TANF) block grant dollars which can help fundthe TCA deficit.
AmountReduction
PositionReduction
3. Reduce funds for contract with the Regional EconomicStudies Institute (RESI) at Towson University. Giventhe need to constrain fiscal 2003 spending, this contractshould remain at its fiscal 2002 level.
The Department of Human Resources (DHR) uses fundsassociated with this contract to meet its Maintenance ofEffort (MOE) requirement under the TemporaryAssistance to Needy Families (TANF) block grant. Even
$110,000 GF
NI.00 - DHR - Family Investment
27
with this reduction, DHR’s budget will contain sufficientState funding to meet the requirement in fiscal 2003.Further, DHR will likely need additional funds to coverits Temporary Cash Assistance (TCA) deficit. WithoutTANF funds available to cover these costs, State fundswill be needed. These TCA expenditures would qualifyas MOE and would more than fully offset any loss ofMOE eligible expenditures resulting from this reduction.
Total General Fund Reductions $ 110,000 3.0

NI.00 - DHR - Family Investment
28
Updates
1. Food Stamp Error Rate Continues to Exceed National Average
Federal fiscal 2000 marked the seventh consecutive year that Maryland’s food stamp eligibility error rateexceeded the national average. The error rate reached a peak in federal fiscal 1998 at 15.4%. Since thattime, Maryland has been closing the gap between its error rate and the national average. As shown inExhibit 9, the State's error rate at 11.1% exceeded the national average by 2.2 percentage points in federalfiscal 2000. Preliminary data for federal fiscal 2001 suggest that DHR has improved its error rateconsiderably. If the national average in fiscal 2001 resembles that achieved in fiscal 2000, Maryland maynot be penalized. For each year that a state’s error rate exceeds the national average, the state can besanctioned by the federal government. Maryland has entered into agreements with the federal governmentwhereby the liability is held in abeyance as Maryland invests in food stamp reinvestment strategies intendedto improve the accuracy rate and outreach efforts.
Exhibit 9
Food Stamp Error RateFederal Fiscal 1993 through 2001
($ in Millions)
Federal FiscalYears
State ErrorRate
NationalAverage
State vs.National
Maryland’s Post-settlementFiscal Liability
1993 10.7 % 10.8 % (0.1 %) $0.0
1994 11.2 % 10.3 % 0.9 % 0.3
1995 12.1 % 9.7 % 2.4 % 2.1
1996 11.3 % 9.2 % 2.1 % 0.8
1997 12.4 % 9.9 % 2.5 % 2.7
1998 15.4 % 10.7 % 4.7 % 2.5
1999 13.6 % 9.9 % 3.7 % 1.0
2000 11.1 % 8.9% 2.2% 0.6
2001 * 8.4% n/a n/a n/a
*Preliminary estimate calculated by DHR. Maryland’s federally adjusted error rate and the national average for federalfiscal 2001 will be available in April 2002.
Source: Department of Human Resources
DHR’s food stamp investment strategies in fiscal 2002 and 2003 involve a variety of activities. Theseactivities include management studies to identify problems and develop recommendations to improve the foodstamp error rate in selected LDSS, high performance awards to LDSS that achieve quality control error rates
NI.00 - DHR - Family Investment
29
at or below the goal set by FIA, and front-end workers at certain LDSS to validate eligibility on applicationsprior to the issuance of benefits. Another strategy also involves outreach strategies, such as publication andtelevision segments, to help ensure that all eligible households are aware of food stamp benefits.
2. Various Welfare Innovation Initiatives Encourage the Hiring of TCA Clients
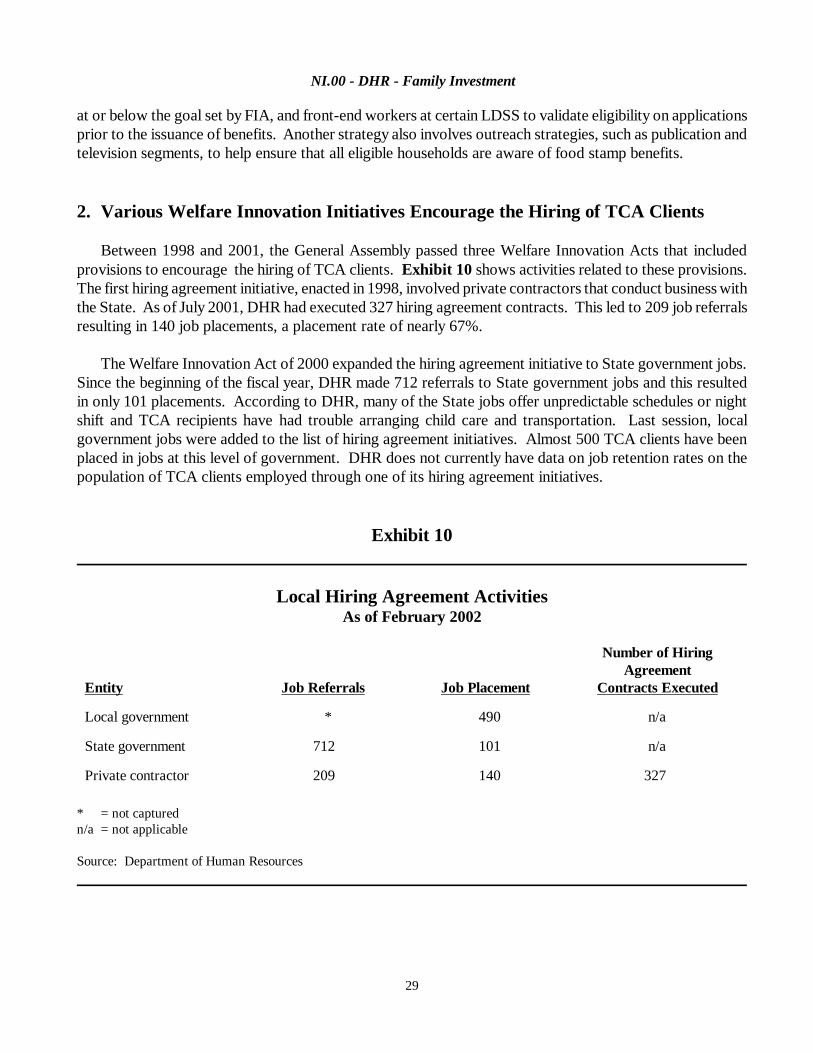
Between 1998 and 2001, the General Assembly passed three Welfare Innovation Acts that includedprovisions to encourage the hiring of TCA clients. Exhibit 10 shows activities related to these provisions.The first hiring agreement initiative, enacted in 1998, involved private contractors that conduct business withthe State. As of July 2001, DHR had executed 327 hiring agreement contracts. This led to 209 job referralsresulting in 140 job placements, a placement rate of nearly 67%.
The Welfare Innovation Act of 2000 expanded the hiring agreement initiative to State government jobs.Since the beginning of the fiscal year, DHR made 712 referrals to State government jobs and this resultedin only 101 placements. According to DHR, many of the State jobs offer unpredictable schedules or nightshift and TCA recipients have had trouble arranging child care and transportation. Last session, localgovernment jobs were added to the list of hiring agreement initiatives. Almost 500 TCA clients have beenplaced in jobs at this level of government. DHR does not currently have data on job retention rates on thepopulation of TCA clients employed through one of its hiring agreement initiatives.
Exhibit 10
Local Hiring Agreement ActivitiesAs of February 2002
Entity Job Referrals Job Placement
Number of HiringAgreement
Contracts Executed
Local government * 490 n/a
State government 712 101 n/a
Private contractor 209 140 327
* = not capturedn/a = not applicable
Source: Department of Human Resources
NI.00 - DHR - Family Investment
30
3. Impact of Baltimore City Community College Work Study Program Not Yet Known
In 1998, the Baltimore City Department of Social Services (BCDSS) and BCCC began operating a pilotprogram called Investing My Potential to Attain College Training (IMPACT 2000). The purpose of theprogram was to test whether BCDSS cash assistance customers completing BCCC certificate or degreeprograms fare better in the labor market than customers who did not participate in these educationalactivities.
A majority of the program participants were females, between the ages of 21 and 25 who reside inBaltimore City and have one child. At 43%, most participants were health science majors. The next mostpopular major can be categorized as clerical (21%), and this was followed by technology (12%).
Shortly after the program began, FIA requested that the UMAB, School of Social Work conduct anevaluation. The study tracks employment and earnings for 12 months after the date of expected graduationwhich is June 2000. The follow-up period ended in June 2001. Because of time lags associated withobtaining administrative data describing employment and earnings data, the necessary data was not availableuntil November 2001. The final report on program impacts is anticipated in February 2002.
4. DHR Makes Preliminary Assessment of Promising Welfare-to-work Activities
As requested in the 2001 JCR, DHR submitted a report on informal evaluations related to programsfunded with work opportunities allocations. To compile the necessary information, DHR assembled a taskforce of central and local department staff. This group developed an informal survey instrument that wouldhelp to determine the best programs and practices used to meet the goals of FIP.
Based on these self-assessments, DHR identified the types of activities that were most commonly citedas a promising practice. These included transportation, job search/readiness, services to employers, jobtraining, workforce support, and education and assessment. In their surveys, LDSS emphasized that havingthe flexibility to implement the mix of programs and strategies that best meets the needs of each jurisdictionproduced desirable outcomes such as declines in the TCA caseload and increases in job placements.
The survey results revealed interesting patterns among rural and urban jurisdictions. Rural jurisdictionsoften cited the Welfare Avoidance Grants as an effective way to achieve the goals of the FIP program. Ruraljurisdictions also tended to rely on the Key Educational Vocational Assessment System (KEVAS) clientassessment instrument more so than urban jurisdictions. A dozen rural jurisdictions ranked child careassistance among the most valuable activities, compared to only two metro jurisdictions.
DHR recognizes that some successful strategies can be replicated in other jurisdictions while othersstemmed from unique, local circumstances. As part of the next phase of these informal evaluations, DHRintends to conduct site visits to selected jurisdictions to validate current findings and determine if the mostpromising strategies will lend themselves to duplication in other jurisdictions. DHR plans to submit a finalreport on these activities in February 2002.

NI.00 - DHR - Family Investment
31
Appendix 1
Current and Prior Year BudgetsCurrent and Prior Year Budgets
Family Investment($ in Thousands)
GeneralFund
SpecialFund
FederalFund
Reimb.Fund Total
Fiscal 2001
LegislativeAppropriation $134,209 $18,330 $405,443 $0 $557,982
DeficiencyAppropriation 0 0 0 0 0
BudgetAmendments (32,937) 6,169 39,536 0 12,768
Reversions andCancellations 0 (4,090) (32,452) 0 (36,542)
ActualExpenditures $101,272 $20,409 $412,527 $0 $534,208
Fiscal 2002
LegislativeAppropriation $129,999 $24,247 $397,017 $0 $551,263
BudgetAmendments (2,634) (4,852) 0 0 (7,486)
WorkingAppropriation $127,365 $19,395 $397,017 $0 $543,777
Note: Numbers may not sum to total due to rounding.

NI.00 - DHR - Family Investment
32
Explanation of Significant Budgetary Changes during Fiscal 2001
Through the budget amendment process, the fiscal 2001 legislative appropriation for Family Investmentservices increased slightly, by just over two percent, from almost $558 million to nearly $571 million.However, by the end of the fiscal year, DHR had cancelled or transferred approximately $36.5 millionmeaning that total expenditures fell short of the original appropriation. Explanations for changes to thelegislative appropriation, cancellations, and transfers to other programs are provided below.
Fiscal 2001 Budget Amendments
Appendix 1 shows that budget amendments added nearly $13 million to the legislative appropriationduring fiscal 2001. This number reflects $45.7 million in federal and special fund increases offset by generalfund reductions of $32.9. The significant budget amendments are discussed below.
� The fiscal 2001 budget includes a federal fund increase of about $38.5 million in TANF dollars for TCApayments. The additional TANF funds are almost entirely offset by a negative adjustment to federal foodstamp dollars due to a lower-than-anticipated caseload. The TANF funds were needed for the TCAdeficit and to replace general funds transferred elsewhere in the department to cover federal fundattainment shortfalls and higher-than-anticipated personnel costs. A portion, or $4.8 million, of thesefunds reflect dollars authorized for inclusion in the fiscal 2001 budget by the General Assembly.Fiscal 2001 budget bill language restricted $4.8 million in general funds and permitted DHR to restorethem with unappropriated TANF dollars. The Governor transferred the restricted general funds to theFamily Investment Dedicated Purpose Account.
� The transfers to other programs and to the reserve fund that are described above account for a reductionof $35.6 million in general funds.
� DHR added another $31.8 million in previously unappropriated TANF dollars to its fiscal 2001 budget.Most of the funds supported work opportunities allocations to the LDSS to implement their locallydesigned Family Investment programs. The dollars also funded special projects such as the JobAccess/Reverse Commute, the Community Partnership Agreement with the Prince George’s CountyLocal Management Board, addiction specialists for substance abuse screening and referrals, and the JobSkills Enhancement Pilot Program.
� Special funds increased by $4.7 million to reflect higher-than-anticipated child support collections usedto offset TCA payments.
� Local government contributions to support the LDSS’ Family Investment activities exceeded the originalestimate by $1.3 million. DHR added these funds to its budget through amendment. These dollars, inaddition to $5.2 million in general funds transferred from other programs, supported salaries in the LDSS.

NI.00 - DHR - Family Investment
33
Fiscal 2001 Cancellations and Transfers to Other Programs
As noted above, Family Investment programs cancelled approximately $37 million in fiscal 2001. Federalfunds represent nearly all of these dollars. Explanations for the significant federal fund cancellations areprovided below.
� $25.9 million represents a cancellation of food stamp dollars resulting from lower-than-expectedparticipation in the Food Stamp Program.
� $3.2 million in TANF dollars budgeted for three Family Investment projects went unspent and DHRtransferred the funds to other programs. One of the projects, the FIP Demonstration Project authorizedin the Welfare Demonstration Act of 2000, did not start in fiscal 2001 and, as such, the funds were notneeded. The other two projects, the From the Ground Up initiative in Baltimore County and Job SkillsEnhancement, met the demand for services with less resources than originally anticipated.
DHR’s closeout statement for its Family Investment programs also shows $4.1 million in special fundcancellations. This resulted from lower-than-anticipated attainment from two sources of special funds:
� child support collections used to offset TCA payments; and
� reimbursements for TEMHA payments made to those who qualify for and eventually receiveSupplemental Security Income.
Explanation of Significant Budgetary Changes during Fiscal 2002
Since enactment of the fiscal 2002 legislative appropriation, the budget for Family Investment programshas decreased by $7.5 million. Savings assumed from the hiring freeze account for $2.5 million of the generalfund reduction. As previously discussed in this analysis, the Governor has proposed $1.5 million in costcontainment relief that would restore a portion of these reductions. The remaining $100,000 in general fundswas transferred to the Community Services Administration to implement the Individual DevelopmentAccount Demonstration Program authorized by Chapters 372 and 373, Acts of 2001 (SB 311/HB 378).
The $4.9 million decrease in special funds reflects revised estimates on the amount of child supportcollections available to offset TCA payments. Based on recent collection activities, it seems unlikely thatDHR will collect the full $16.5 million assumed in the fiscal 2002 legislative appropriation. The costcontainment budget amendment reduced these special funds by $1.5 million. According to DBM, anotherpending budget amendment would remove an additional $3.4 million. This reduction is already accountedfor in the fiscal 2002 working appropriation.
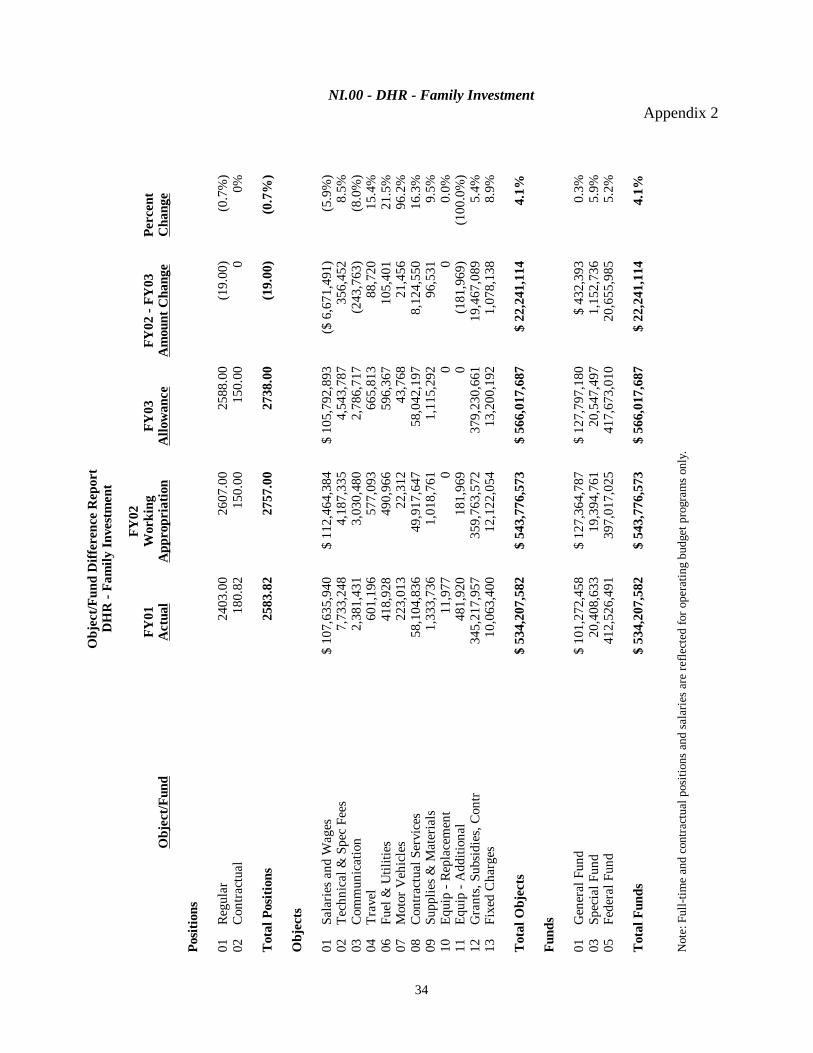
NI.00 - DHR - Family InvestmentAppendix 2
34
Obj
ect/
Fun
d D
iffe
renc
e R
epor
tD
HR
- F
amily
Inv
estm
ent
FY
02F
Y01
Wor
king
FY
03F
Y02
- F
Y03
Per
cent
Obj
ect/
Fun
dA
ctua
lA
ppro
pria
tion
Allo
wan
ceA
mou
nt C
hang
eC
hang
e
Pos
itio
ns
01
Reg
ular
2403
.00
2607
.00
2588
.00
(19.
00)
(0.7
%)
02
Con
trac
tual
180.
8215
0.00
150.
000
0%
Tot
al P
osit
ions
2583
.82
2757
.00
2738
.00
(19.
00)
(0.7
%)
Obj
ects
01
Sal
arie
s an
d W
ages
$ 10
7,63
5,94
0$
112,
464,
384
$ 10
5,79
2,89
3($
6,6
71,4
91)
(5.9
%)
02
Tec
hnic
al &
Spe
c Fe
es7,
733,
248
4,18
7,33
54,
543,
787
356,
452
8.5%
03
Com
mun
icat
ion
2,38
1,43
13,
030,
480
2,78
6,71
7(2
43,7
63)
(8.0
%)
04
Tra
vel
601,
196
577,
093
665,
813
88,7
2015
.4%
06
Fue
l & U
tili
ties
418,
928
490,
966
596,
367
105,
401
21.5
%07
M
otor
Veh
icle
s22
3,01
322
,312
43,7
6821
,456
96.2
%08
C
ontr
actu
al S
ervi
ces
58,1
04,8
3649
,917
,647
58,0
42,1
978,
124,
550
16.3
%09
S
uppl
ies
& M
ater
ials
1,33
3,73
61,
018,
761
1,11
5,29
296
,531
9.5%
10
Equ
ip -
Rep
lace
men
t11
,977
00
00.
0%11
E
quip
- A
dditi
onal
481,
920
181,
969
0(1
81,9
69)
(100
.0%
)12
G
rant
s, S
ubsi
dies
, Con
tr34
5,21
7,95
735
9,76
3,57
237
9,23
0,66
119
,467
,089
5.4%
13
Fix
ed C
harg
es10
,063
,400
12,1
22,0
5413
,200
,192
1,07
8,13
88.
9%
Tot
al O
bjec
ts$
534,
207,
582
$ 54
3,77
6,57
3$
566,
017,
687
$ 22
,241
,114
4.1%
Fun
ds
01
Gen
eral
Fun
d$
101,
272,
458
$ 12
7,36
4,78
7$
127,
797,
180
$ 43
2,39
30.
3%03
S
peci
al F
und
20,4
08,6
3319
,394
,761
20,5
47,4
971,
152,
736
5.9%
05
Fed
eral
Fun
d41
2,52
6,49
139
7,01
7,02
541
7,67
3,01
020
,655
,985
5.2%
Tot
al F
unds
$ 53
4,20
7,58
2$
543,
776,
573
$ 56
6,01
7,68
7$
22,2
41,1
144.
1% N
ote:
Ful
l-ti
me
and
cont
ract
ual p
osit
ions
and
sal
arie
s ar
e re
flec
ted
for
oper
atin
g bu
dget
pro
gram
s on
ly.
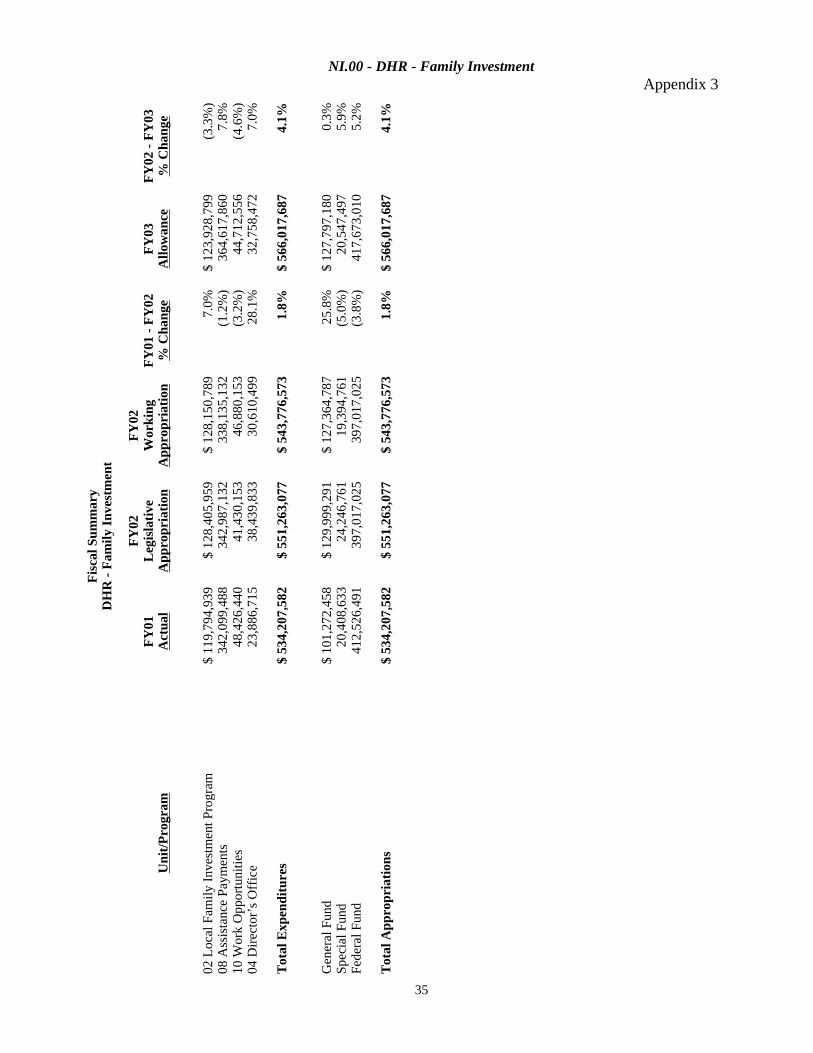
NI.00 - DHR - Family InvestmentAppendix 3
35
Fis
cal S
umm
ary
DH
R -
Fam
ily I
nves
tmen
t
FY
02F
Y02
FY
01L
egis
lati
veW
orki
ngF
Y01
- F
Y02
FY
03F
Y02
- F
Y03
Uni
t/P
rogr
amA
ctua
lA
ppro
pria
tion
App
ropr
iati
on%
Cha
nge
Allo
wan
ce%
Cha
nge
02 L
ocal
Fam
ily I
nves
tmen
t Pro
gram
$ 11
9,79
4,93
9$
128,
405,
959
$ 12
8,15
0,78
97.
0%$
123,
928,
799
(3.3
%)
08 A
ssis
tanc
e Pa
ymen
ts34
2,09
9,48
834
2,98
7,13
233
8,13
5,13
2(1
.2%
)36
4,61
7,86
07.
8%10
Wor
k O
ppor
tuni
ties
48,4
26,4
4041
,430
,153
46,8
80,1
53(3
.2%
)44
,712
,556
(4.6
%)
04 D
irec
tor’
s O
ffic
e23
,886
,715
38,4
39,8
3330
,610
,499
28.1
%32
,758
,472
7.0%
Tot
al E
xpen
ditu
res
$ 53
4,20
7,58
2$
551,
263,
077
$ 54
3,77
6,57
31.
8%$
566,
017,
687
4.1%
Gen
eral
Fun
d$
101,
272,
458
$ 12
9,99
9,29
1$
127,
364,
787
25.8
%$
127,
797,
180
0.3%
Spec
ial F
und
20,4
08,6
3324
,246
,761
19,3
94,7
61(5
.0%
)20
,547
,497
5.9%
Fede
ral F
und
412,
526,
491
397,
017,
025
397,
017,
025
(3.8
%)
417,
673,
010
5.2%
Tot
al A
ppro
pria
tion
s$
534,
207,
582
$ 55
1,26
3,07
7$
543,
776,
573
1.8%
$ 56
6,01
7,68
74.
1%