Operability and Performance Analysis of Various Control...
66
Murdoch University 15 Operability and Performance Analysis of Various Control Valves Final Report Jasmine Herbert
-
Upload
truongdiep -
Category
Documents
-
view
268 -
download
0
Transcript of Operability and Performance Analysis of Various Control...

Murdoch University
15
Operability and
Performance Analysis of
Various Control Valves Final Report
Jasmine Herbert

Page 1 of 65
Abstract In 2015 an assortment of control valves were implemented in the Murdoch University
Instrumentation and Control Laboratory and in the Pilot Plant. This project is a result of this
proposed implementation and is important to gain a proper understanding of the valves’ usage;
behaviour; and to confirm the new valves are an improvement on any valves they may be replacing.
This project aimed to compare and analyse the operability and performance of the Baumann 24000S
with Fisher 3660 Positioner and the existing Badger Meter Research Control Valves within the
Instrumentation and Control Laboratory. The operability and performance was analysed by
investigating the valves’ usage; functionality; hysteresis; valve type and sizing; dead band; and dead
time.
The first test checked if one valve opening resulted in two flow rates for different directions of the
stem movement (otherwise known as hysteresis). Eliminating hysteresis is important as it signifies
that the valve is less susceptible to variations caused by friction and other forces, resulting in a single
flow rate for each valve opening.
The valve type, sizing and usage was analysed with the flow coefficient and characteristic curves. The
flow coefficient indicates a valve’s maximum flow capacity, whereas the characteristic curve shows
the flow behaviour with change in valve opening; this should be as linear as possible. The type and
size of a valve is important in order to optimise a process. A valve that is too small will not allow
sufficient fluid to pass; whereas a valve that is too big will cause most of the process gain to come
from the valve and not the controller [1].
Dead band is the range the valve opening can change in both directions without change in the flow
being observed; this is a result of backlash and friction. The smaller the dead band the better the
valve’s ability is to respond to minor changes.
Dead time allows the evaluation of the valve’s response time, in order to compare the speed of the
valves.
In comparing the Research Valve results to the Baumann 24000S results, the Baumann 24000S had
no visible hysteresis; it had the strongest linear relationship; it had a small dead band of 0.5% and a
quicker dead time. Based on these findings it is determined that the Baumann 24000S surpasses the
performance of the Research Valve; therefore it is advised that the Baumann 24000S with Fisher
3660 positioner is a suitable replacement for the Badger Meter Research Valve.

Page 2 of 65
Contents Abstract ................................................................................................................................................... 1
List of Figures .......................................................................................................................................... 3
List of Tables ........................................................................................................................................... 4
1. Introduction .................................................................................................................................... 5
1.1 Objectives................................................................................................................................ 5
1.2 Report Structure ..................................................................................................................... 6
2. Literature Review/ Background ...................................................................................................... 7
2.1 Valves to be tested.................................................................................................................. 8
3. Methodology ................................................................................................................................. 12
3.1 Assumptions .......................................................................................................................... 12
3.2 Valve Calibration ................................................................................................................... 13
3.3 Hysteresis .............................................................................................................................. 14
3.4 Valve type and sizing ............................................................................................................. 15
3.5 Dead Band ............................................................................................................................. 18
3.6 Dead Time ............................................................................................................................. 19
4. Results ........................................................................................................................................... 20
4.1 Valve Calibration Results ................................................................................................ 20
4.2 Troubleshooting .................................................................................................................... 23
4.3 Hysteresis Results ................................................................................................................. 29
4.4 Valve Type and Sizing Results ............................................................................................... 34
4.5 Dead Band Results ................................................................................................................ 40
4.6 Dead Time Results ................................................................................................................. 45
4.7 Results Summary ................................................................................................................... 46
5. Conclusion ..................................................................................................................................... 48
5.1 Future Work ................................................................................................................................ 49
References ............................................................................................................................................ 50
Appendices ............................................................................................................................................ 52
Appendix 1- Hysteresis Test Results ................................................................................................. 52
Appendix 2- Dead Band Test Results ................................................................................................ 59

Page 3 of 65
List of Figures Figure 1 Baumann 51000 ........................................................................................................................ 8
Figure 2 Baumann 24000S with Fisher 3660 Positioner ......................................................................... 9
Figure 3 Baumann 24000S with Electric Actuator ................................................................................ 10
Figure 4 Existing Badger Meter Research Valve ................................................................................... 11
Figure 5 Laboratory Equipment Setup .................................................................................................. 14
Figure 6 Hysteresis Test [11] ................................................................................................................. 15
Figure 7 Inherent Valve Characteristics [1] ........................................................................................... 16
Figure 8 Dead Band Test [2] .................................................................................................................. 18
Figure 9 Calibration Setup for Baumann 24000S with Fisher 3660 Positioner ..................................... 20
Figure 10 Baumann 24000S with Fisher 3660 Positioner I/P Converter Calibration Results ............... 20
Figure 11 Baumann 24000S with Electric Actuator Calibration Results ............................................... 21
Figure 12 Baumann 51000 Calibration Setup ....................................................................................... 22
Figure 13 Baumann 51000 I/P Converter Calibration Results .............................................................. 22
Figure 14 Badger Meter Research Valve M19/a with "g" Flow Meter Step Test Results ..................... 24
Figure 15 Badger Meter Research Valve M19/a with "d" Flow Meter Step Test Results ..................... 24
Figure 16 Badger Meter Research Valve M19/b with "d" Flow Meter Step Test Results .................... 25
Figure 17 Badger Meter Research Valve M19/b with "g" Flow Meter Step Test Results ..................... 25
Figure 18 Baumann 24000S with Fisher 3660 Positioner with M19/a with "d" Flow Meter Step Test
Results ................................................................................................................................................... 26
Figure 19 Baumann 24000S with Fisher 3660 Positioner with M19/b with "g" Flow Meter Step Test
Results ................................................................................................................................................... 26
Figure 20 Badger Meter Research Valve M17/c (water valve fitted for air) Step Test ......................... 28
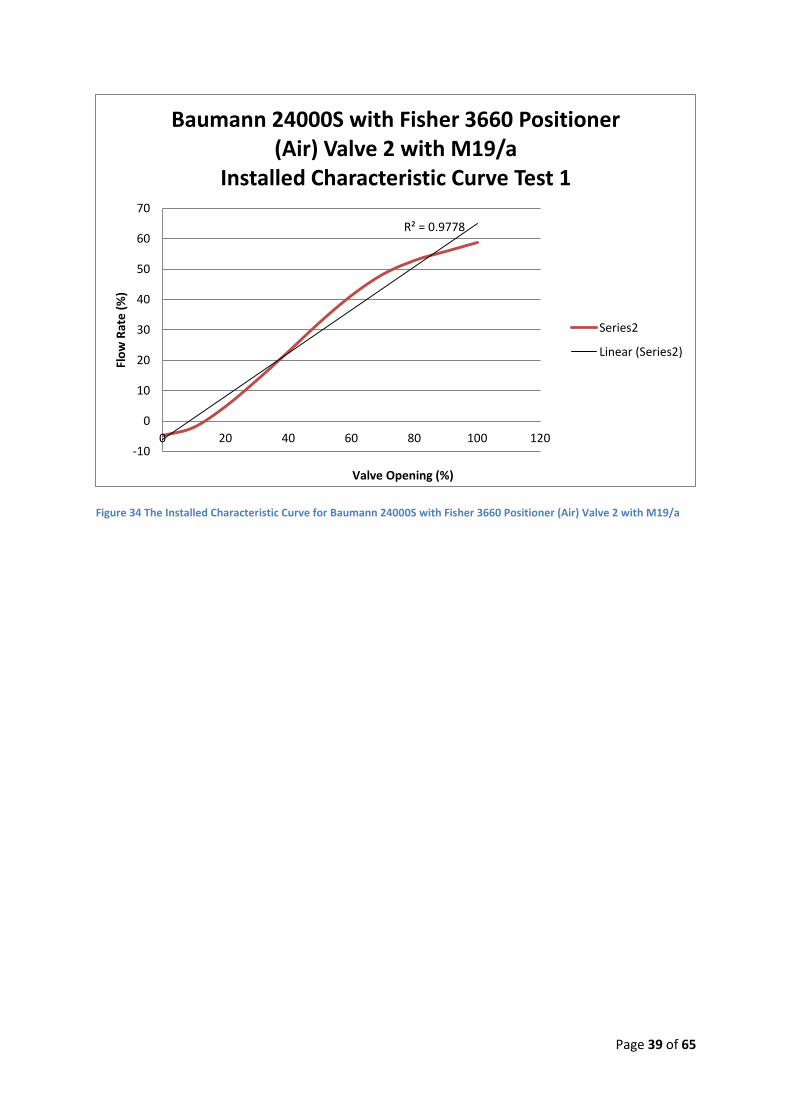
Figure 21 Badger Meter Research (Water) Valve M08/a Hysteresis Test 1 Results ............................. 30
Figure 22 Badger Meter Research (Water) Valve M08/d Test 1 Hysteresis Results ............................. 31
Figure 23 Baumann 24000S (Water) Valve 1 with Fisher 3660 Positioner Test 1 Hysteresis Results
(The two curves are almost superimposed.) ........................................................................................ 31
Figure 24 Baumann 24000S (Water) Valve 2 with Fisher 3660 Positioner Test 2 Hysteresis Results
(The two curves are almost superimposed.) ........................................................................................ 32
Figure 25 Badger Meter Research Valve M19/a Hysteresis Test 1 Results .......................................... 32
Figure 26 Baumann 24000S with Fisher 3660 Positioner (Air) Valve 1 with M19/b Hysteresis Test 1
Results ................................................................................................................................................... 33
Figure 27 Baumann 24000S with Fisher 3660 Positioner (Air) Valve 2 with M19/a Hysteresis Test 1
Results ................................................................................................................................................... 33
Figure 28 The Installed Characteristic Curve for Badger Meter Research (Water) Valve M08/a ......... 36
Figure 29 The Installed Characteristic Curve for Badger Meter Research (Water) Valve M08/d......... 36
Figure 30 The Installed Characteristic Curve for Baumann 24000S (Water) Valve 1 with Fisher 3660
Positioner .............................................................................................................................................. 37
Figure 31 The Installed Characteristic Curve for Baumann 24000S (Water) Valve 2 with Fisher 3660
Positioner .............................................................................................................................................. 37
Figure 32 The Installed Characteristic Curve for Badger Meter Research (Air) Valve M19/a .............. 38
Figure 33 The Installed Characteristic Curve for Baumann 24000S (Air) Valve 1 with Fisher 3660
Positioner and M19/b ........................................................................................................................... 38
Page 4 of 65
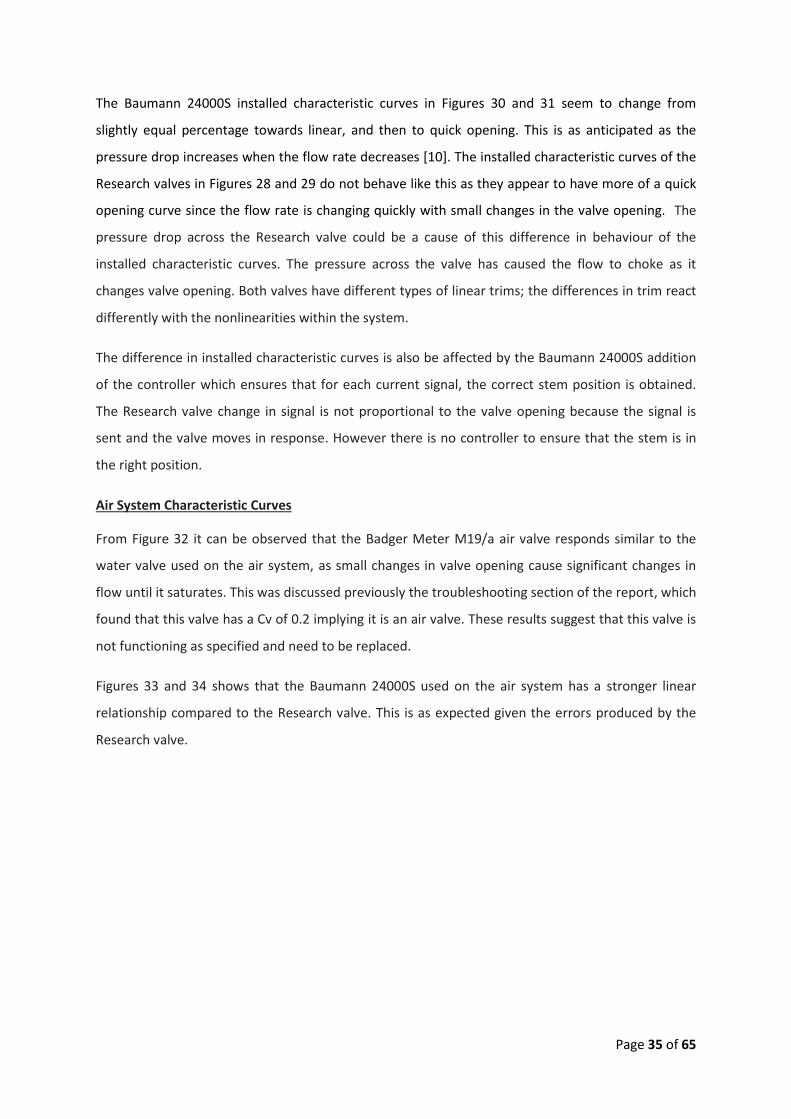
Figure 34 The Installed Characteristic Curve for Baumann 24000S with Fisher 3660 Positioner (Air)
Valve 2 with M19/a ............................................................................................................................... 39
Figure 35 Badger Meter Research (Water) Valve M08/a Dead Band Results ...................................... 41
Figure 36 Badger Meter Research (Water) Valve M08/d Dead Band Results ...................................... 42
Figure 37 Baumann 24000S (Water) Valve 1 with Fisher 3660 Positioner Dead Band Results ............ 42
Figure 38 Baumann 24000S (Water) Valve 2 with Fisher 3660 Positioner Dead Band Results ............ 43
Figure 39 Badger Meter Research (Air) Valve M19/a Dead Band Results ............................................ 43
Figure 40 Baumann 24000S (Air) Valve 1 with Fisher 3660 Positioner and M19/b Dead Band Results
.............................................................................................................................................................. 44
Figure 41 Baumann 24000S (Air) Valve 2 with Fisher 3660 Positioner and M19/a Dead Band Results
.............................................................................................................................................................. 44
List of Tables Table 1 Badger Meter Research Air Valve and Air Flow Meter Troubleshooting ................................. 27
Table 2 Badger Meter Research Valve M17/c Stem Movement with Valve Opening .......................... 29
Table 3 Badger Meter Research Valve Flow Coefficient ....................................................................... 34
Table 4 Baumann 24000S Flow Coefficient .......................................................................................... 34
Table 5 Water System Dead Time Results ............................................................................................ 45
Table 6 Air System Dead Time Results .................................................................................................. 45
Table 7 Summary of Water System Test Results .................................................................................. 47
Table 8 Summary of Air System Test Results ........................................................................................ 47

Page 5 of 65
1. Introduction Control valves are one of the most commonly used final control elements within a control loop and
often one of the most expensive so it is vital that a proper understanding of control valves is
developed [1]. The optimization of production in a process can be improved by selecting appropriate
valves. In 2015 a variety of control valves will be implemented into the Murdoch University
Instrumentation and Control Laboratory in the Physical Sciences Building and in the Engineering
Building Pilot Plant. These valves include the Baumann 24000S [6] with Fisher 3660 Positioner [5];
the Baumann 51000 [3] high pressure low flow valve; the Fisher 24000S [6] with Baumann Electric
Actuator [17] and the existing Badger Meter Research Control Valves [9]. This project came as a
result of the implementation of these new valves in which knowledge was required in order to know
their functionality. To also find out which system to implement the valves into, to ensure that they
were used correctly. This project is important to gain a proper understanding of the valves, their
usage; behaviour; and to confirm the new valves are better than any valves they may be replacing.
1.1 Objectives This project aims to compare and analyse the operability and performance of a variety of valves
within the Instrumentation and Control Laboratory.
The operability was analysed by investigating the valves’:
Usage – Specifically whether the valve is suited for the water system or the air system.
Functionality – A detailed research executed on features of the valve assembly that may
have impact the performance.
A comparison was made between existing and new valves to ensure the replacement of any of the
valves was warranted by carrying out a series of performance based tests, which also provided
insight into their behaviour and functionality. Prior to this the valves were calibrated to ensure they
functioned as specified by their manufacturers. The parameters that were investigated in order to
compare the performance of the valves include:
Hysteresis [20]
Valve type and sizing [1]
Dead band [2]
Dead Time [18]
A brief background and calibration on all the new valves is provided in order to give some knowledge
of the valves prior to installation. However, due to the limitations of this project the main focus will
be on the Baumann 24000S with Fisher 3660 Positioner and the existing Badger Meter Research

Page 6 of 65
Control Valves. These valves were of particular interest because the Baumann 24000S with Fisher
3660 is the proposed replacement for the Badger Meter Research Valve. Testing of these valves was
required to ensure that the replacement is warranted and to compare the effects that the positioner
had on a valve.
1.2 Report Structure Section 2 of this report will introduce some background information on valves including the
importance of valves to a process; components of a valve and information on how valves work.
Section 2.1 will introduce the valves that will be implemented along with a description and their
usage. Section 3 will go into detail about the tests performed on the valves. Section 4 contains the
results of the tests performed and difficulties that were faced and ways to troubleshoot them.
Section 4.7 will summarise the results and provide a suggested outcome from them. Section 6 will
provide a conclusion to this thesis report with potential future work that could be done and
recommendations.

Page 7 of 65
2. Literature Review/ Background In order to gain an accurate understanding of the operability and performance of a control valve
background is needed on what a control valve are, the components that make up a control valve,
their functionality, the way in which these components work together to change the flow in a
process and the importance of control valves to a process.
Control valves are instruments that change the flow of fluid through a system by completely or
partly opening or closing in order to compensate for disturbances and keep the process variable as
close as possible to a set point [1]. The existing valves in Instrumentation and Control Laboratory
work by receiving a current signal from the controller where the I/P (current to pressure) converter
translates this signal into instrument air pressure that passes through the pressure connection into
the diaphragm casing. Pressure builds up on the diaphragm plate that pushes on the actuator spring
and moves the stem up or down depending on the type of valve. The stem is connected to the
closure member that partially or fully opens or closes the valve thus manipulating the flow of fluid.
Control valves come in various types such as Rotary Ball, Rotary Butterfly and Sliding Stem. This
report will focus on the Sliding Stem Valve. The Sliding Stem Valve has two main parts, the actuator
and valve body assembly. The actuator is made up of the pressure connection; the diaphragm and
diaphragm plate; the actuator spring; the spring adjuster; the actuator stem; the yoke; and stem
connector. The main components in the valve body are the packing; the bonnet; the gaskets; the
cage; the seat ring; the seat ring gasket; and the closure member [1].
Control valves are important as they are often used as the final control element within a control
loop. The control loop consists of a process variable that is required to reach a desired set point
within a certain allowable tolerance. Sensors and transmitters test the process variable and
information is then sent to a controller that will evaluate the appropriate action required to get the
process variable to the set point. The final control element then implements this action [1]. All
elements in a control loop are important; if anything fails the loop breaks. Control valves play a
significant role in a control loop because it is the only component that moves to react to set point
changes and disturbances [2].
There are two main systems in the Instrumentation and Control Laboratory including the air system
and the water system. The setup of these systems is shown in Section 3.3 Figure 5. The valves are
either suited for use with water or with air, further details on the difference between these valves
are provided later in this report.

Page 8 of 65
2.1 Valves to be tested The valves’ to be installed in the laboratory along with the current Badger Meter Research Control
Valves, include the Baumann 51000 High-Pressure Low-Flow Control Valve, Baumann 24000S with
Fisher 3660 Positioner and the Baumann 24000S with Electric Actuator. This section will give a brief
overview of each type in order to gain insight into their functionality.
2.1.1 Baumann 51000 High-Pressure Low-Flow Control Valve
Figure 1 Baumann 51000
The Baumann 51000 is ideal for situations such as laboratories that often require low flow and high
pressure [3]. The valve as shown in Figure 1 is also very compact which is often required in
laboratories where space is limited. The corrosion resistant design of the valve means it is
appropriate for a variety of gases and highly viscous fluids such as caustic solutions. The compact
actuator is multi-spring with low friction and can easily be switched between air-to-open and air-to-
close without extra parts or special tools [3]. Murdoch University currently have two types of the
Baumann 51000 one with a Cv (flow coefficient) of 0.45 and one with a Cv of 1.5 as described by the
identification plates located on the valves’. Where the flow coefficient is the gallons of water that
passes through the valve over a period of one minute with the difference in pressure through the
valve set as 1 psi at a temperature of 60°F, this quantifies the valve’s flow capacity.

Page 9 of 65
2.1.2 Baumann 24000S with Fisher 3660 Positioner
Figure 2 Baumann 24000S with Fisher 3660 Positioner
The Baumann 24000S is the body type and the Fisher 3660 is the Positioner type. The Baumann
24000S with Fisher 3660 Positioner shown in Figure 2 is different from the other valves used in this
project because of the single acting pneumatic valve positioner. This positioner acts as an on-board
controller where the process variable is the position of the valve actuator. The actuator has an arm
mechanically connected to it and the positioner automatically adjusts its output to the actuator to
maintain a desired position in relation to the input signal [1]. The positioner will provide any output
pressure to the actuator to satisfy this relationship between the input signal and the valve position
[4]. A positioner improves the performance of a control valve because it continuously inspects to see
if the stem has reached the set point; if the stem has not reached the set point the valve pressure
adjusts. A valve without a positioner sends a signal to the current to pressure (I/P) converter which
outputs an air pressure and the stem moves, no further measurement is necessary to ensure the
stem is in the correct location. Some other advantages of the Baumann 24000S is that it is designed
to provide an accurate fast response and is able to withstand the vibrations of most plant
environments. Efficient operation is achieved through low steady‐state air consumption and the
easily adjustable gain and damping enable fine tuning of the positioner stability making it adaptable
to specific application requirements-[5]. There are two different types of Baumann 24000S with
Fisher 3660 to be tested, one for the air system and the other for the water system. The air valve has
a Cv of 0.2 and the water valve has a Cv of 1.

Page 10 of 65
2.1.3 Baumann 24000S with Baumann Electric Actuator
Figure 3 Baumann 24000S with Electric Actuator
The Baumann 24000S as seen in Figure 3 is ideal for the control of pressure, temperature, level and
flow [6]. The stainless steel body and epoxy powder-coated actuator is built to withstand mildly
corrosive fluids, yet compact and light enough for laboratory use. The actuator is multi-spring with
reduced dead band and can easily be switched between air-to-open and air-to-close. Where dead
band is the band through which the manipulated variable can be changed in both directions without
a change in the process variable being observed [1]. A useful feature of the actuator is the ability to
perform auto calibrations [6]. The difference between this valve’s actuator and the others is that it
contains an electric actuator module instead of the diaphragm; consequently it no longer requires
instrument air, however a power supply is needed. The Baumann 24000S has a high Cv of 9.5 and is
slow opening with a maximum travel time of 150 seconds. Typically slow opening valves are used for
applications such as boilers that have an ignition system where gas is required to ignite it. If a fast
opening valve were used it could cause excessive gas build up or make a loud noise during ignition;
whereas a slow opening valve would ignite at a lower pressure and would be a lot quieter [7]. Slow
opening valves also prevent sudden thermal shock and stress to a system and the pressure is more
controlled [8]. Given this information the best application for this valve at Murdoch University would
be in the Pilot Plant on the steam system.

Page 11 of 65
2.1.4 Existing Badger Meter Research Control Valve
Figure 4 Existing Badger Meter Research Valve
The Badger Meter Research Control Valves displayed in Figure 4 are categorised by their serial
numbers; there are two different model numbers written on the valves in the Instrumentation and
Control Laboratory these are 1002GCN36SVOSCLN36 and 1002GCN36SVOSGLN36. The only
difference in the model numbers is the trim size & characteristic where the trim is the internal
components of the valve that change the flow of fluid [1]. “C” linear trim has a Cv of 1.25; this valve
is used for water. “G” linear trim has a Cv of 0.2; this valve is used for air [9].

Page 12 of 65
3. Methodology
3.1 Assumptions The Instrumentation and Control Laboratory had no separate water flow meters, as they were all
connected to the existing valves. Initially the method used to get the flow rate was to pass water
into the new valve, then into the existing completely open Badger Meter Research Valves and
subsequently the flow meter. Due to differences in flow coefficient this could impact the results for
the performance tests. In order to get the most accurate results a bypass was made, effectively
splitting up the water flow meter and the water Research Valve.
The air valves all have the same flow coefficient, so it was assumed that the Research Valve would
not alter the Baumann 24000S results when air passed through it in order to go through the flow
meter.
It is assumed that the existing Badger Meter Research valves cannot be calibrated as there are no
pressure gauges on the valves and they are already installed in the laboratory.

Page 13 of 65
3.2 Valve Calibration The valve calibration test is an experiment to ensure the valve current to pressure converter is
functioning as designed. In most cases this means a current signal of 4-20mA is converted to 3-15psi.
If the current is not producing the correct pressure range the valve’s span and zero can be adjusted
to correct any errors. Current to pressure converter calibration is important in order for the valve to
operate correctly or else a current signal will be sent and an incorrect pressure will cause the valve
stem to move to the wrong position, creating unexpected results and variability. Valve calibration is
generally done prior to performance testing in order to adjust the valve if the stem is not moving to
the correct position.
In each of the control valve manuals it is outlined the input current signal for the current to pressure
(I/P) converter and what the corresponding pressure reading for this current signal should be. In
order to test that these were the correct values the valves were bench tested using the following
equipment:
Fluke 744 Documenting Process Calibrator;
Instrument air and pressure regulator;
All the valves have pressure gauges attached.
Some of the valves had additional equipment requirements that are outlined in their individual
results and discussion sections. The overall steps to calibrating the I/P converters of the valves
included:
Connecting the instrument air;
Removal of the face plate of the I/P converter;
Connect the terminals from the Fluke 744 to the terminals in the I/P converter;
1. Press Meas/Source button
2. Press mA button
3. Select “Source mA”
4. Press Enter
5. Type in the mA source to be used, press enter
6. Read from gauge on valve and record the pressure reading.

Page 14 of 65
3.3 Hysteresis Hysteresis of a valve is the greatest difference in the flow for any single per cent valve opening; this
difference is caused by friction and other forces acting on the valve [1]. Eliminating hysteresis is
important as it signifies that the valve is less susceptible to these variations resulting in a single flow
rate for each valve opening as seen in the ideal scenario (series 1) in Figure 6. Hence the controller
can be tuned for one operating point as opposed to two, where the controller would require more
complex tuning in order to adjust to the different directions of stem travel. Usually it is tuned for the
average of the two or just one of the scenarios, giving rise to decreased process optimisation,
increased variability and more inconsistencies.
The setup of equipment is shown in Figure 5. The equipment used to test the hysteresis, valve type
and sizing, dead band and dead time is as follows:
Various valves to be tested;
Instrument air;
Flow meter;
Computer with Labview using a basic experimental template;
Water supply tank with pump and power supply(When using the water system);
Water tank (When using the water system);
Air tank (When using the air system);
Pipes;
Analogue input and output leads.
Figure 5 Laboratory Equipment Setup
To test the hysteresis of the valves, the valve opening was gradually stepped up in increments of
10% from 0% to 100% capacity and the steady state flow for each increment was recorded. Then the
valve was gradually stepped down and the flow rates recorded like Figure 6, where the centre linear
line represents an ideal valve. This was repeated three times to ensure consistent results, only one
of the three sets of results is in the results section, the other results are in Appendix 1. All results
were logged in Labview to a comma separated file and analysed using Microsoft Excel.
Page 15 of 65
Figure 6 Hysteresis Test [11]
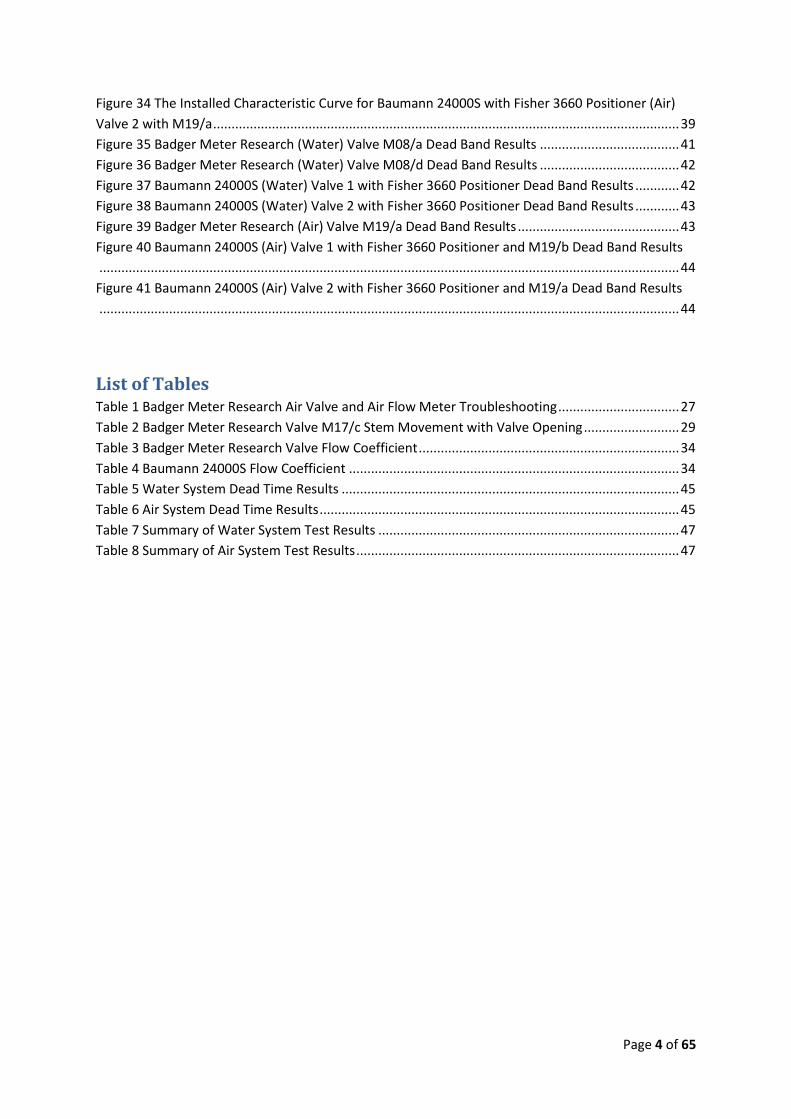
3.4 Valve type and sizing The flow coefficient (Cv) and the flow characteristic curves directly quantify and represent the effect
a valve’s type and sizing has on the flow. The flow coefficient quantifies the valve’s flow capacity, as
it is the gallons of water that passes through the valve over a period of one minute with the
difference in pressure through the valve set as 1 psi at a temperature of 60°F. The type and size of a
valve determines the value of the flow coefficient, specifically the trim and body style and size [10].
Knowing the flow coefficient allows an easy comparison of different valve’s fluid flow ability because
it is measured and obtained with specified standard experimental conditions. It can also be obtained
mathematically using Equation (3.1) given the following is known [1]:
ΔP=P1-P2
Q= Flow Rate (gpm)
SG= Specific Gravity
𝐶𝑉 = 𝑄√𝑆𝐺
∆𝑃 (3.1)
Throughout this project the flow coefficient was obtained from data sheets or written on the valve
itself. The flow coefficient only represents the maximum flow capacity and does not give an
indication of how the flow changes with valve opening in the build up to the maximum; this is where
the inherent characteristic curve is superior. The inherent characteristic is the relationship between
the flow coefficient as a percent of the maximum and the percent valve opening [10]. The style of
this curve and its movement depends on the type of closure member. The flow characteristic is
generally categorised as linear, equal percentage or quick opening as seen in Figure 7.

Page 16 of 65
Figure 7 Inherent Valve Characteristics [1]
Linear: Useful for systems that have a constant gain [11]. A linear valve is one in which the
per cent of maximum flow increases linearly with the per cent stem opening. These valves
perform well when used for water systems [12].
Equal Percentage: As the valve opening increases, the flow rate increases by a percentage of
the preceding flow [13].
Quick Opening: Commonly used for on/off applications; quick opening valves give a large
increase in flow rate for small changes in the valve opening from the closed position [13].
The inherent characteristic is obtained under standardised temperature and pressure testing
conditions, while the installed characteristic curve is acquired as the valve operates in the process it
is intended for, with actual pressure and temperature conditions. Under installed process conditions
different components of the system may have nonlinearities or interact and affect each other
causing nonlinearities [14]. Ideally the installed characteristic curve will be linear. Nonlinear
characteristics result in controllers that are not tuned for all operating points and only produce
prime results for one operating point. The process speed could become quite slow as the valve
position moves away from this point [15]. In order to obtain a linear installed characteristic curve
and a constant process gain an inherent characteristic other than linear, such as equal percentage or
fast opening, may be selected to compensate for any the nonlinearities or for any system gain
changes.
Valve type and sizing through the selection of flow coefficient and characteristic curves can either
optimize process production or impair it. A valve that is too small or has a small flow coefficient will
not allow sufficient fluid to pass, starving the process. The valve needs to be small enough so that

Page 17 of 65
most of the gain is still coming from the controller and not the valve, otherwise it can result in the
decrease in adjustability of the controller [1]. A reduction in controller gain will often be required in
order to maintain stability.
The installed flow characteristic was measured by recording the flow as the valve opening was
manually stepped up from 0% to 100% in increments of 10%. The flow was recorded for each step
once it had reached a steady state.
There are two main types of existing valves in the Instrumentation and Control Laboratory and two
main systems, the water system and the air system. From flow coefficient and characteristic curves it
can be determined which valve is suited for air or for water. The existing Research valves either have
a Cv of 0.2 or a Cv of 1.25. An air valve in the Instrumentation and Control Laboratory would be
identified as having a flow coefficient smaller than a water valve because air is less dense than water
so it flows through the valve a lot quicker. A valve with Cv of 0.2 would be suited for use on the air
system whereas a valve with Cv of 1.25 would be suited for use on the water system; this is how
they are currently utilised. This is currently one existing Badger Meter Research Valve that is fitted
incorrectly which is identified as M17/c; it has a “C” trim type with a corresponding Cv of 1.25 so it is
better suited to the water system but it is fitted in the air system.
If the flow coefficient is not known a good indication of whether the valve is suited for air or for
water can be obtained experimentally from the installed characteristic curve. An oversized valve or a
water valve used on the air system will rapidly increase the flow rate at small changes in stem
position until the flow saturates. An undersized valve or air valve used on the water system would
only let a small amount of fluid through with large changes in stem position when compared to a
water valve used on the water system [13].

Page 18 of 65
3.5 Dead Band Dead band is the band through which the manipulated variable can be changed in both directions
without a change in the process variable being observed. Dead band is triggered by backlash and
friction where backlash is the outcome of loose mechanical connections within a device when the
direction of the device input changes [1]. Having a small dead band improves a control valve’s
performance and is an important characteristic; it means the valve has a higher level of accuracy due
to its ability to respond to minor changes, therefore decreasing process variability [1].
The dead band was tested by changing the system controller output in Labview in various steps of
0.25% up to 5%. In most cases the initial valve opening was set to 55% and step changes were made
above and below 55%. The per cent valve openings to test the dead band was: 55; 54.75; 54.5;
54.75; 55.5; 55; 54.5; 54; 54.5; 56; 55; 54; 55; 57; 55; 53; 55; 60; 55; 50; and 55.
The flow rate, valve opening and time were logged to a comma separated value file. The data was
then analysed in Microsoft Excel with the flow rate and valve opening being plotted against time.
The dead band was then evaluated by observing whether the flow rate was changing with per cent
step changes as seen in Figure 8 [2] where the dead band is 5%. This was repeated three times to
ensure consistent results, only one of the three sets of results is in the results section, the other
results are in Appendix 2.
Figure 8 Dead Band Test [2]

Page 19 of 65
3.6 Dead Time Dead time is generally the time taken from when the input signal is sent, to the time when the
actuator first moves in response, or the time from when the input signal is sent to when the process
variable reacts. The first scenario requires a way to measure the time the signal changes to the time
the stem first moves. A way to accurately measure the time the stem first moved was not identified
without the use of additional equipment. Therefore in this case the second dead time has been
used. This dead time would be slightly longer than the time the stem first moved. Dead time allows
the evaluation of the valve response time, in order to compare the speed of the valve. Some of the
causes of dead time include the holding time of measurements within the control loop; the time it
takes for fluid to travel from the valve to the flow meter; the time for sensors to produce results;
and the time it takes for the valve to process a signal change, convert it into pressure initiating stem
movement [16]. Dead time can be improved by using shorter pipes, using a fast responding valve,
having sensors close to the manipulated variable and using fast responding sensors [16].
To test the dead time, the valve was initially set to 50% instead of zero because between 0% and
20% valve opening there was not enough flow for the flow meter to register any changes. In order to
get a more accurate representation of the dead time for the entire range of the stem span, the valve
was initially set to 50%. The valve opening was then stepped up 2% in Labview to 52% then to 54%
and 56%, then an average of the 3 dead times was calculated to gain an accurate result. The results
were logged and exported to Microsoft Excel for analysis.

Page 20 of 65
4. Results
4.1 Valve Calibration Results
Baumann 24000S with Fisher 3660 Positioner Calibration
The Baumann 24000S with Positioner has an input current signal of 4 to 20mA and a resulting
pressure of 3 to 15psi [5]. The setup for the calibration of the Baumann 24000S is shown in Figure 9.
Between 4mA and 5mA the pressure increased significantly from 0psi to 5.5psi. A significant jump
was observed between 19mA- 20mA from approximately 14.5psi to 20psi. The range of pressure
change stayed within the bounds of 0-100% at a current range of 4-20mA. Between 5-19mA the
pressure increased linearly as seen in Figure 10. These jumps in pressure indicate that the valve
requires more pressure to get the stem to the correct position for the lower and higher signals.
Figure 10 Baumann 24000S with Fisher 3660 Positioner I/P Converter Calibration Results
02468
10121416182022
-2 0 2 4 6 8 10 12 14 16 18 20 22
Input Current (mA)
Pressure (psi)
Fisher 3660 with Positioner I/P Converter Calibration
Test 1
Test 2
Figure 9 Calibration Setup for Baumann 24000S with Fisher 3660 Positioner

Page 21 of 65
Recommendations: Reading the pressure from the pressure gauge is subject to errors, purchasing
the Fluke 744 pressure module [22] would give a more accurate reading of the pressure due to the
digital interface.
Baumann 24000S with Electric Actuator
The Baumann 24000S with Electric Actuator was tested using a slightly different method to the other
valves due to the addition of the electric actuator. Instead of feeding a current input signal, an
equivalent input voltage of 2-10V was implemented. Instead of recording pressure, output voltage
was noted. This valve does not have an I/P converter, instead it has an input current or voltage and
an output current or voltage. A 24 VAC transformer to power the electric actuator was required and
no instrument air was needed. Instrument air was not required for this valve as the actuator
electronically shifts the valve stem. The results of this calibration are displayed in Figure 11 where
output voltage increases linearly with input voltage until it rapidly increases at 6V. The Baumann
24000S with Electric Actuator exhibited interesting behaviour, unlike the other valves it was
extremely slow and once the input voltage reached 7V the stem would not move any further than
halfway to fully open as seen in Figure 11. The Baumann Actuator instruction manual [17] outlines
the travel time at a maximum of 150 second for 0.5 and 0.75 inch travel and spring fall time of 30
seconds for full travel. This shows it is actually designed to be sluggish; the reasoning for this was
discussed in the valve type section of this report. In investigating why the valve would only open half
way, the actuator casing was opened and there were switches for auto calibration. An auto
calibration was performed. The stem only reached half way on the travel indicator. The data sheet
states the full range is approximately 20mm which is half way on the travel indicator; it is again
designed to perform this way, the travel indicator is larger than what it should be.
Figure 11 Baumann 24000S with Electric Actuator Calibration Results
0
2
4
6
8
10
12
0 2 4 6 8
Inp
ut
Vo
ltag
e
Output Voltage
Baumann 24000S with Electric Actuator Calibration
Test 1
Test 2

Page 22 of 65
Baumann 51000 Calibration
The Baumann 51000 manual states that the input current signal varying
from 4 to 20mA should result in a pressure of 3 to 15psi, however in
Figure 12 this was not the case. The Baumann 51000 has a 582 module
which is not adjustable, meaning there is no zero or span screws,
providing no means to change the calibration settings. When the
Baumann 51000 valves were manufactured they would have a
positioner on the outlet that would adjust the valve mechanically to
give the correct output despite the valves calibration settings. The
manager from Western Process Controls has suggested in order to
compensate for the un-adjustable valve calibration errors, the valve
should be fitted with an adjustable module or positioner; however this is not possible as compatible
fittings are no longer manufactured. Another suggestion is to calibrate the process controller to
compensate for the un-adjustable valve. This is not ideal, as the process variable would need to be
affected before the controller would respond. Due to calibration errors, it is advised that these
valves only be used for teaching and learning purposes and not in industrial applications.
Figure 13 Baumann 51000 I/P Converter Calibration Results
Another observation made from Figure 13 is that, unlike the Baumann 24000S with Fisher 3660
Positioner that has a pressure of zero at 4mA, the Baumann 51000 has an elevated zero. This is
useful to technicians when there is a problem as it is easier to fault find. If the power goes out the
02468
1012141618202224
-2 0 2 4 6 8 10 12 14 16 18
Current (mA)
Pressure (psi)
Baumann 51000 I/P Converter Calibration
Test 1
Test 2
Figure 6 Baumann 51000 Calibration Setup
Figure 12 Baumann 51000 Calibration Setup

Page 23 of 65
valve pressure will be at 0. If the fault is with the instrument air the pressure will be fine at its
elevated zero.
4.2 Troubleshooting This section will provide insight into some of the challenges faced while conducting and setting up
for experimental testing within the Instrumentation and Control Laboratory. It gives an explanation
why further testing was not conducted on some of the valves. This section has also been provided to
help future students when encountered with the similar problems.
Troubleshooting 1
Several concerns were revealed while testing the Badger Meter Research valve fitted for the air
system. These include:
The M19/a Research valve was producing results expected for a water valve used on the air
system. The flow coefficient of 0.2 was obtained for the data sheet, which is correct for an
air valve consequently it is not a water valve; it is indeed an air valve.
The M19/b Research valve has the same specifications as the M19/a, however it has
different results that are neither suited for the air or water systems.
Based on this information predictions of the cause of these errors include:
If the error is caused by a malfunction of the flow meters then swapping the flow meters
would not produce the same results for the corresponding valve.
If the error is caused by a malfunction in the valves, then swapping the flow meters would
produce the same results for the corresponding valve.
Each flow meter was labelled “g” and “d” in order to keep track of them.
M19/a with “g” flow meter in Figure 14 gives different results than with “d” in Figure 15, with the
“d” flow meter it gives results expected for an air valve. The flow is stepping in proportion to the
valve opening. With the “g” flow meter the valve is acting similar to what would be expected from a
water valve fitted for the air system in which the valve is oversized for the system. The flow rate
rapidly increases with each step until it saturates. Referring back to the proposed causes of the test
differences tests there must be a malfunction in the flow meters because it is the same valve with
different flow meters and the results are not the same.

Page 24 of 65
Figure 14 Badger Meter Research Valve M19/a with "g" Flow Meter Step Test Results
Figure 15 Badger Meter Research Valve M19/a with "d" Flow Meter Step Test Results
Further testing was conducted with each flow meter with the Badger Meter Research valve M19/b.
Figure 16 and Figure 17 show that the flow rate does not change between 0-40% valve openings,
and then it rapidly increases. This is consistent between both flow meters, which suggest there is a
fault with the M19/b valve that should be looked into further in the future.
-20
0
20
40
60
80
100
120
140
0 200 400 600 800Time (s)
Step Test Badger Meter Research Valve (Air) M19/a with "g" Flow Meter
Flow Rate (%)
Valve Opening (%)
-20
0
20
40
60
80
100
120
200 400 600 800 1000
Time (s)
Step Test Badger Meter Research Valve (Air) M19/a with "d" Flow Meter
Valve Opening (%)
Flow Rate (%)

Page 25 of 65
Figure 16 Badger Meter Research Valve M19/b with "d" Flow Meter Step Test Results
Figure 17 Badger Meter Research Valve M19/b with "g" Flow Meter Step Test Results
With the M19/a the results are different for each flow meter but with the M19/b the results are the
same, suggesting that the errors are due to both the flow meters and the valves. Further testing was
conducted with the Baumann 24000S with Fisher 3660 positioner to make a final conclusion about
the cause of the discrepancies.
-20
0
20
40
60
80
100
120
4609 4709 4809 4909 5009 5109
Time (s)
Step Test Badger Meter Research Valve (Air) M19/b with"d" Flow Meter
Valve Opening (%)
Flow Rate (%)
-20
0
20
40
60
80
100
120
850 1050 1250 1450 1650
Time (s)
Step Test Badger Meter Research Valve (Air) M19/b with"g" Flow Meter
Valve Opening (%)
Flow Rate (%)
Page 26 of 65
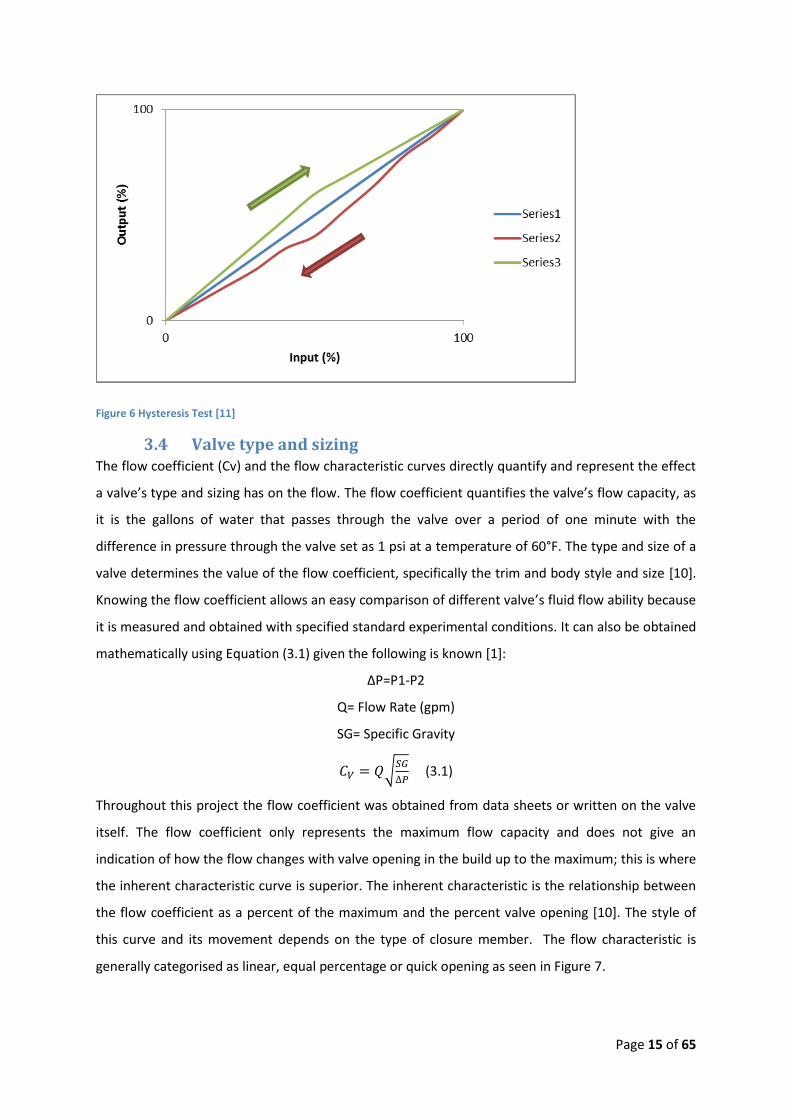
Figure 18 Baumann 24000S with Fisher 3660 Positioner with M19/a with "d" Flow Meter Step Test Results
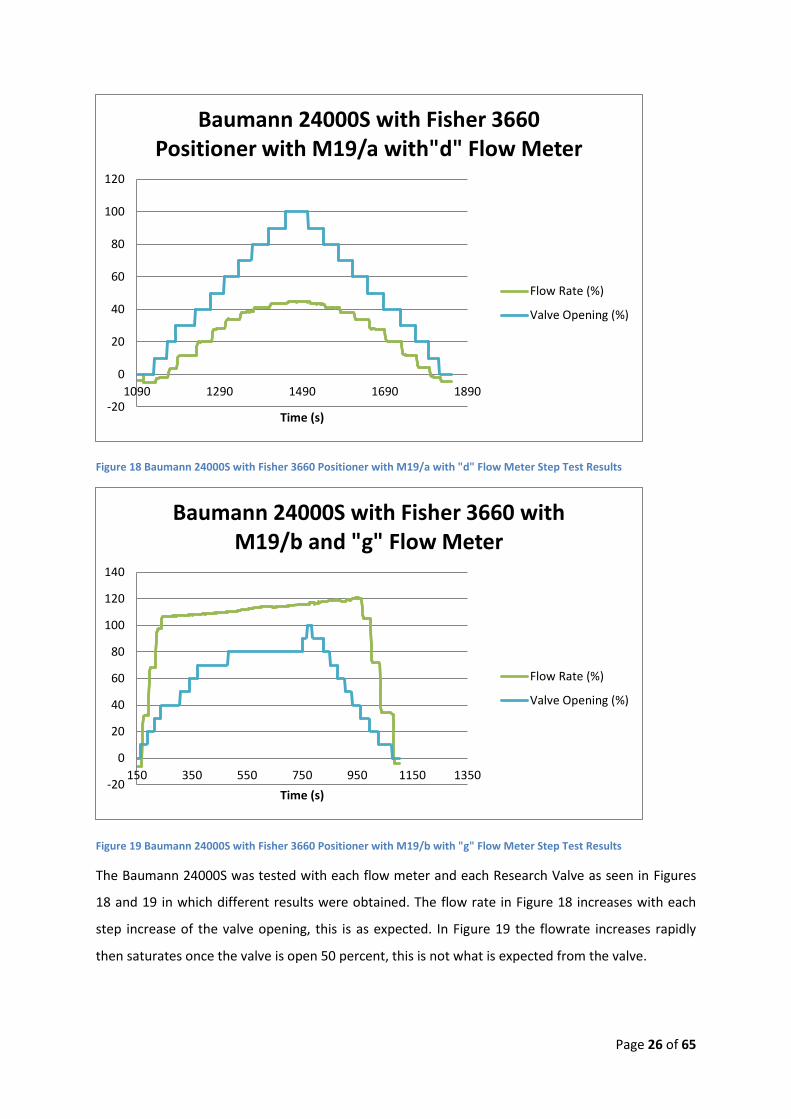
Figure 19 Baumann 24000S with Fisher 3660 Positioner with M19/b with "g" Flow Meter Step Test Results
The Baumann 24000S was tested with each flow meter and each Research Valve as seen in Figures
18 and 19 in which different results were obtained. The flow rate in Figure 18 increases with each
step increase of the valve opening, this is as expected. In Figure 19 the flowrate increases rapidly
then saturates once the valve is open 50 percent, this is not what is expected from the valve.
-20
0
20
40
60
80
100
120
1090 1290 1490 1690 1890
Time (s)
Baumann 24000S with Fisher 3660 Positioner with M19/a with"d" Flow Meter
Flow Rate (%)
Valve Opening (%)
-20
0
20
40
60
80
100
120
140
150 350 550 750 950 1150 1350
Time (s)
Baumann 24000S with Fisher 3660 with M19/b and "g" Flow Meter
Flow Rate (%)
Valve Opening (%)

Page 27 of 65
In Table 1 the results for all tests are summarised with the results categorised as either expected or
unexpected.
Table 1 Badger Meter Research Air Valve and Air Flow Meter Troubleshooting
Valve Flow Meter Results
M19/a g unexpected
M19/a d expected
M19/b g unexpected
M19/b d unexpected
M19/a + Baumann g expected
M19/b + Baumann d unexpected
From Table 1 we see that M19/b is consistently providing unexpected results. This strongly suggests
this valve has discrepancies requiring maintenance and calibrating. M19/a results are generally as
expected however one set is still unexpected as it behaves like a water valve used on the air system.
It is also suggested that the flow meters be mounted to their own panels so the Baumann 24000S
does not have to flow through the Research valve. This would make troubleshooting in future easier
as the flow meters would not constantly have to be taken to the workshop to be removed. Due to
the obvious inconsistencies with M19/b no further performance tests were conducted on this valve.
As M19/a and M19/b are the only air valves only one air valve, the M19/a, will be compared with
the Baumann 24000S for the remainder of this project.
Troubleshooting 2
While setting up to test the M17/c water valve fitted for air in which the air would have to pass
through the M19/a with a flow meter, an error occurred where the M19/a was not opening. The
possible causes of this included:
The control systems analogue output was not working.
The valve was damaged.
The lead was damaged.
The analogue output was changed to one that had just been previously working for the M17/c, but
the M19/a was still not responding. So either the valve or the lead was the problem. The leads were
then changed and the M19/a responded.
Page 28 of 65
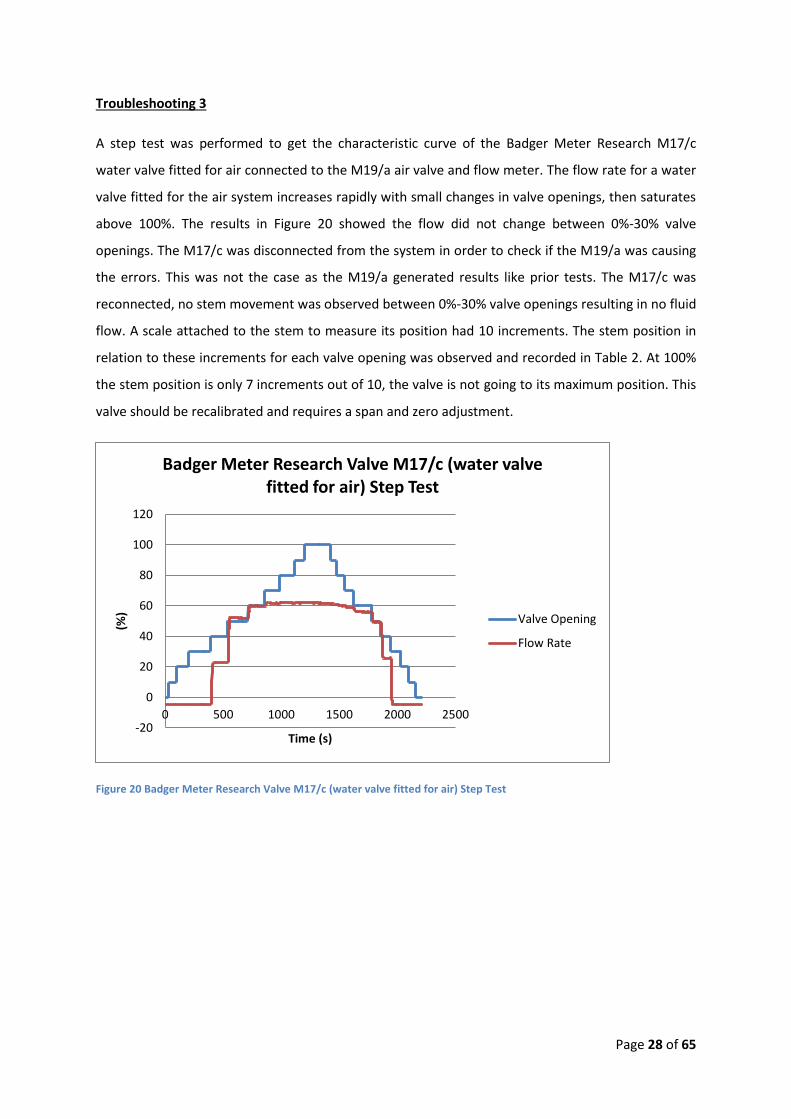
Troubleshooting 3
A step test was performed to get the characteristic curve of the Badger Meter Research M17/c
water valve fitted for air connected to the M19/a air valve and flow meter. The flow rate for a water
valve fitted for the air system increases rapidly with small changes in valve openings, then saturates
above 100%. The results in Figure 20 showed the flow did not change between 0%-30% valve
openings. The M17/c was disconnected from the system in order to check if the M19/a was causing
the errors. This was not the case as the M19/a generated results like prior tests. The M17/c was
reconnected, no stem movement was observed between 0%-30% valve openings resulting in no fluid
flow. A scale attached to the stem to measure its position had 10 increments. The stem position in
relation to these increments for each valve opening was observed and recorded in Table 2. At 100%
the stem position is only 7 increments out of 10, the valve is not going to its maximum position. This
valve should be recalibrated and requires a span and zero adjustment.
Figure 20 Badger Meter Research Valve M17/c (water valve fitted for air) Step Test
-20
0
20
40
60
80
100
120
0 500 1000 1500 2000 2500
(%)
Time (s)
Badger Meter Research Valve M17/c (water valve fitted for air) Step Test
Valve Opening
Flow Rate

Page 29 of 65
Table 2 Badger Meter Research Valve M17/c Stem Movement with Valve Opening
Valve Opening Increments (Stepping Up) Increments (Stepping Down)
0% 0 0
10% 0 0
20% 0 0
30% 0 0
40% 1.5 1
50% 2.5 2
60% 3.5 3
70% 4.5 4
80% 5.5 5
90% 6.5 6
100% 7 7
4.3 Hysteresis Results The Baumann 24000S with Fisher 3660 Positioner water valves in both Figures 23 and 24 have no
visible hysteresis. The Badger Meter Research water valves in both Figures 21 and 22 have obvious
hysteresis. The data was analysed to see what the maximum difference between the stepping up
and the stepping down. The Research valve had a maximum difference of 7.4% at a valve opening of
30%. The Baumann 24000S with Fisher 3660 Positioner had a maximum difference of approximately
0.193%. The Baumann 24000S has significantly less hysteresis than the Research valve. This is due to
the Baumann 24000S addition of the Fisher 3660 Positioner. Positioners eliminate hysteresis due to
the adjustable air pressure that can be adjusted to overcome friction [4]. The positioner
continuously checks that the stem has reached the set point. If not the air pressure adjusts so the
measured stem position is the same as the desired, resulting in one value for each signal eliminating
hysteresis.
Another observation made from the Research valve M08/a and the Baumann 24000S valve 1 in
Figures 21 and 23 is that a significant range from 0% to 20% of the valve opening resulted in no
measured flow. This could either be a consequence of the valves not letting fluid through, in which
case no stem movement would be observed or the flow meter not working properly. Stem
movement of the Baumann 24000S was observed for all signal changes both during the calibration
and conducting these tests. This confirms that from 0% to 20% the valve stem was not stuck at zero
and was allowing fluid to move through. The Research M08/a valve and Baumann 24000S valve 1
were tested with the flow meter attached to the M08/a panel; whereas the valves used in Figures 2
and 24 were tested with the flow meter on the M08/d panel, where a change in flow is observed
between 0-20%. From these observations it is concluded that the flow meter is the cause of these

Page 30 of 65
discrepancies and not the valves. It is suggested that further testing including calibration and
maintenance be performed on the flow meter on the M08/a panel in the future works.
The Badger Meter Research valve M19/a used on the air system produced inconsistent results when
compared with the results in Figure 25 with the additional results in Appendix 1 showing that
repeatability of the results is an issue. This was discussed in the troubleshooting section which
concluded that the valve should be calibrated and the air system flow meters need to be checked.
The results in Figures 26 and 27 show that the Baumann 24000S used on the air system produce
different results when partnered with different flow meters. This gives an indication that the valves
are likely to be the cause of these discrepancies. Despite the errors exhibited, the Baumann 24000S
is still consistently providing less hysteresis than the Research valves.
Water System
Figure 21 Badger Meter Research (Water) Valve M08/a Hysteresis Test 1 Results
-10
0
10
20
30
40
50
60
70
80
0 20 40 60 80 100 120
Flo
w R
ate
(%
)
Valve Opening (%)
M08/a Badger Meter Research (Water) Valve Hysteresis Test 1
Stepping Up
Stepping Down

Page 31 of 65
Figure 22 Badger Meter Research (Water) Valve M08/d Test 1 Hysteresis Results
Figure 23 Baumann 24000S (Water) Valve 1 with Fisher 3660 Positioner Test 1 Hysteresis Results (The two curves are almost superimposed.)
0
10
20
30
40
50
60
70
80
0 20 40 60 80 100 120
Flo
w R
ate
(%
)
Valve Opening (%)
M08/d Badger Meter Research Valve Hysteresis Test 1
Stepping Up
Stepping Down
-10
0
10
20
30
40
50
60
70
0 20 40 60 80 100 120
Flo
w R
ate
(%
)
Valve Opening (%)
Baumann 24000s with Fisher 3660 Positioner (Water 1)
Hysteresis Test 1
Stepping Up
Stepping Down

Page 32 of 65
Figure 24 Baumann 24000S (Water) Valve 2 with Fisher 3660 Positioner Test 2 Hysteresis Results (The two curves are almost superimposed.)
Air System
Figure 25 Badger Meter Research Valve M19/a Hysteresis Test 1 Results
0
10
20
30
40
50
60
70
0 20 40 60 80 100 120
Flo
w R
ate
(%
)
Valve Openig (%)
Baumann 24000S with Fisher 3660 Positioner (Water 2)
Hysteresis Test 2
Stepping Up
Stepping Down
-20
0
20
40
60
80
100
120
140
-10 10 30 50 70 90 110
Flo
w (
%)
Valve Opening (%)
Hysteresis Test 1 Badger Meter Research Valve M19/a
Stepping Up
Stepping Down

Page 33 of 65
Figure 26 Baumann 24000S with Fisher 3660 Positioner (Air) Valve 1 with M19/b Hysteresis Test 1 Results
Figure 27 Baumann 24000S with Fisher 3660 Positioner (Air) Valve 2 with M19/a Hysteresis Test 1 Results
-10
0
10
20
30
40
50
60
70
80
0 20 40 60 80 100 120
Flo
w R
ate
(%
)
Valve Opening (%)
Baumann 24000S with Fisher 3660 Positioner (Air) Valve 1 with M19/b Hysteresis Test 1
Stepping Up
Stepping Down
-10
0
10
20
30
40
50
60
70
0 20 40 60 80 100 120
Flo
w R
ate
(%
)
Valve Opening (%)
Baumann 24000S with Fisher 3660 Positioner (Air) Valve 2 with M19/a
Hysteresis Test 1
Stepping Up
Stepping Down

Page 34 of 65
4.4 Valve Type and Sizing Results Flow Coefficient
In the Instrumentation and Control Laboratory there is an air system and a water system. Section 3.4
provided information that showed the flow coefficient would be larger for a valve used on the water
system than a valve used for air. The existing Badger Meter Research with a flow coefficient of 0.2
would be used for the air system. The valves with a flow coefficient of 1.25 would be used for the
water system. The new Baumann 24000S with Fisher 3660 Positioner valves have a flow coefficient
of 0.2 making it well matched for air or a coefficient of 1 for use with water. The flow coefficient
valve size or style changes with. Both of these valves are 1/2” in size but the trim style is different;
both where the trim is in the plug and the seat arrangement. The orifice (the flow area or diameter
between the plug and seat) will change with different trims. In this case as shown in Table 3 the
larger orifice results in a larger Cv.
Table 3 Badger Meter Research Valve Flow Coefficient
Trim designation Max Cv Orifice diameter (inch) Orifice area (square inch)
C 1.25 0.2810 0.0620
G 0.2 0.1560 0.0191
The Baumann 24000s valves in Table 4 are both ½” and have the same orifice and plug travel.
However the trim styles are different. The valve with flow coefficient of 0.2 has a linear low flow
style trim whereas the valve with the flow coefficient of 1 has a linear trim.
Table 4 Baumann 24000S Flow Coefficient
Trim designation Max Cv Orifice diameter (inch)
102 Linear Low Flow 0.2 0.25
688 Linear 1 0.25
In contrast to the Baumann 24000S the flow coefficient of the Research water valve is 1.25. The flow
coefficient of the Baumann is 1; this indicates that the Research valve has a larger flow capacity. The
flow coefficient of the Research air valve is 0.2 which is the same as the Baumann 24000S. This
indicates that both valves have the same flow capacities.
Water System Characteristic Curves
The inherent characteristic curves for the Baumann 24000S and the Research valves are specified as
linear. The installed characteristic curves in Figures 30 and 31 show the Baumann valves continue to
have strong linear relationships with r squared (measure of closeness in proximity of data is to linear
curve) values of 0.9857 and 0.993. The Research valves with r squared values of 0.9283 and 0.8584
in Figures 28 and 29 do not maintain a linear relationship as strong as the Baumann 24000S.
Page 35 of 65
The Baumann 24000S installed characteristic curves in Figures 30 and 31 seem to change from
slightly equal percentage towards linear, and then to quick opening. This is as anticipated as the
pressure drop increases when the flow rate decreases [10]. The installed characteristic curves of the
Research valves in Figures 28 and 29 do not behave like this as they appear to have more of a quick
opening curve since the flow rate is changing quickly with small changes in the valve opening. The
pressure drop across the Research valve could be a cause of this difference in behaviour of the
installed characteristic curves. The pressure across the valve has caused the flow to choke as it
changes valve opening. Both valves have different types of linear trims; the differences in trim react
differently with the nonlinearities within the system.
The difference in installed characteristic curves is also be affected by the Baumann 24000S addition
of the controller which ensures that for each current signal, the correct stem position is obtained.
The Research valve change in signal is not proportional to the valve opening because the signal is
sent and the valve moves in response. However there is no controller to ensure that the stem is in
the right position.
Air System Characteristic Curves
From Figure 32 it can be observed that the Badger Meter M19/a air valve responds similar to the
water valve used on the air system, as small changes in valve opening cause significant changes in
flow until it saturates. This was discussed previously the troubleshooting section of the report, which
found that this valve has a Cv of 0.2 implying it is an air valve. These results suggest that this valve is
not functioning as specified and need to be replaced.
Figures 33 and 34 shows that the Baumann 24000S used on the air system has a stronger linear
relationship compared to the Research valve. This is as expected given the errors produced by the
Research valve.

Page 36 of 65
Water System
Figure 28 The Installed Characteristic Curve for Badger Meter Research (Water) Valve M08/a
Figure 29 The Installed Characteristic Curve for Badger Meter Research (Water) Valve M08/d
R² = 0.9283
-10
0
10
20
30
40
50
60
70
80
90
0 20 40 60 80 100
Flo
w R
ate
(%
)
Valve Opening (%)
Badger Meter Research (Water) Valve M08/a Installed Characteristic Curve
Series1
Linear (Series1)
R² = 0.8584
0
10
20
30
40
50
60
70
80
90
0 20 40 60 80 100
Flo
w R
ate
(%
)
Valve Opening (%)
Badger Meter Research (Water) Valve M08/d Installed Characteristic Curve
Series1
Linear (Series1)

Page 37 of 65
Figure 30 The Installed Characteristic Curve for Baumann 24000S (Water) Valve 1 with Fisher 3660 Positioner
Figure 31 The Installed Characteristic Curve for Baumann 24000S (Water) Valve 2 with Fisher 3660 Positioner
R² = 0.9857
-10
0
10
20
30
40
50
60
70
0 20 40 60 80 100
% F
low
Rat
e
% Valve Opening
Baumann 24000S (Water) Valve 1 with Fisher 3660 Positioner
Installed Characteristic Curve
Series1
Linear (Series1)
Linear (Series1)
R² = 0.993
-10
0
10
20
30
40
50
60
70
0 20 40 60 80 100
Flo
w R
ate
(%
)
Valve Opening (%)
Baumann 24000S (Water) Valve 2 with Fisher 3660 Positioner
Installed Characteristic Curve
Series1
Linear (Series1)

Page 38 of 65
Air System
Figure 32 The Installed Characteristic Curve for Badger Meter Research (Air) Valve M19/a
Figure 33 The Installed Characteristic Curve for Baumann 24000S (Air) Valve 1 with Fisher 3660 Positioner and M19/b
R² = 0.872
-20
0
20
40
60
80
100
120
0 20 40 60 80 100
Flo
w (
%)
Valve Opening (%)
Badger Meter Research (Air) Valve M19/a Installed Chatacteristic Curve
Series1
Linear (Series1)
R² = 0.9812
-20
-10
0
10
20
30
40
50
60
70
80
0 20 40 60 80 100
Flo
w R
ate
(%
)
Valve Open (%)
Baumann 24000S with Fisher 3660 Positioner (Air) Valve-1 with M19/b
Installed Charactrisic Curve
Series1
Linear (Series1)
Page 39 of 65
Figure 34 The Installed Characteristic Curve for Baumann 24000S with Fisher 3660 Positioner (Air) Valve 2 with M19/a
R² = 0.9778
-10
0
10
20
30
40
50
60
70
0 20 40 60 80 100 120
Flo
w R
ate
(%
)
Valve Opening (%)
Baumann 24000S with Fisher 3660 Positioner (Air) Valve 2 with M19/a
Installed Characteristic Curve Test 1
Series2
Linear (Series2)

Page 40 of 65
4.5 Dead Band Results Dead band is the band through which the manipulated variable can be changed in both directions
without a change in the process variable being observed. The Baumann 24000S with Fisher 3660
Positioner water valve dead band was 0.5% as seen in Figures 37 and 38. The Badger Meter Research
water valves in Figures 35 and 36 have a dead band of 5%. The Research valve in comparison with
the Baumann 24000S demonstrates the positioner’s ability to significantly improve the dead band of
a valve. These results were exactly as expected as the Instrument Engineers’ Handbook [11] states
“the dead band of a valve/actuator combination can be as much as 5%; when a positioner is added,
it can be reduced to less than 0.5%”. The positioner decreases the dead band because it
continuously checks for errors between the desired stem position and the measured stem position.
If there is a difference, corrective action takes place, with the adjustment of the instrument air.
Without a positioner no corrective action occurs, as the signal is being sent but there is nothing
checking to see if the stem is in the right location.
Dead band can be overcome by the overall process controller. This is not ideal as a large error
between the desired flow rate and the measured flow rate is required for the controller to cause an
adjustment in the valve. The positioner does not require a difference in the desired flow and the
measured flow to be affected for corrective action to occur. The positioner will adjust if there is an
error between the desired stem position and the measured stem position before the flow is
affected.
Dead band and hysteresis could also be decreased by regular valve maintenance, because the main
causes of dead band are backlash and friction and the main cause of hysteresis is friction. Backlash
occurs when the input of a device changes direction and slack occurs between the input and output
due to loose mechanical connections [1]. Friction can be reduced by regularly lubricating the valve;
backlash can be reduced by ensuring mechanical connections are tightened regularly. The Baumann
24000S is a brand new valve whereas the Research valve is old with an unknown service and
maintenance history, so it experiences more friction and backlash.
When changing direction of the Research valve opening in Figure 35, the final steady state flow rates
are different for the same valve opening, whereas in Figure 37 the Baumann 24000S consistently
settles to the same flow rate despite the direction of valve opening. This indicates the Baumann
24000S lack of hysteresis and the Research valves obvious hysteresis that is visible from the dead
band test results.
Figure 40 displays a larger dead band for the Baumann 24000S when fluid is also passed through the
Research valve M19/b when compared to Figure 41, in which fluid is passed through the M19/a. This

Page 41 of 65
suggested that the flow meters in the air system should be permanently disconnected from the
valves in order to get the Baumann 24000S dead band without errors from the Research valves
impacting the flow. Even with the addition of the errors from the Research valves, the Baumann
24000S still provides a significantly smaller dead band.
Water System
Figure 35 Badger Meter Research (Water) Valve M08/a Dead Band Results

Page 42 of 65
Figure 36 Badger Meter Research (Water) Valve M08/d Dead Band Results
Figure 37 Baumann 24000S (Water) Valve 1 with Fisher 3660 Positioner Dead Band Results

Page 43 of 65
Figure 38 Baumann 24000S (Water) Valve 2 with Fisher 3660 Positioner Dead Band Results
Air System
Figure 39 Badger Meter Research (Air) Valve M19/a Dead Band Results

Page 44 of 65
Figure 40 Baumann 24000S (Air) Valve 1 with Fisher 3660 Positioner and M19/b Dead Band Results
Figure 41 Baumann 24000S (Air) Valve 2 with Fisher 3660 Positioner and M19/a Dead Band Results

Page 45 of 65
4.6 Dead Time Results The Badger Meter Research valves consistently have a longer dead time than the Baumann 24000S
with Fisher 3660 Positioner valves as shown in Tables 5 and 6. Some of the causes of dead time
include the holding time of measurements within the control loop; the time it takes for fluid to travel
from the valve to the flow meter; the time for sensors to produce results and the time it takes for
the valve to respond to process signal changes by converting it into pressure, initiating stem
movement [16]. The length pipes, sensors and other system components were kept constant except
for the valve itself; this indicates the Baumann 24000S responds to process signal changes quicker
and initiates stem movement faster than the Research Valves.
Water System
Table 5 Water System Dead Time Results
Valve Dead Time (s)
Badger Meter Research Valve M08/a 3.85
Badger Meter Research Valve M08/d 3.44
Baumann 24000S Valve 1 with Fisher 3660 Positioner
2.89
Baumann 24000S Valve 2 with Fisher 3660 Positioner separate flow meter
2.56
Air System
Table 6 Air System Dead Time Results
Valve Dead Time (s)
Badger Meter Research Valve M19/a 3.44
Baumann 24000S Valve 1 with Fisher 3660 Positioner and M19/b
2.67
Baumann 24000S Valve 2 with Fisher 3660 Positioner and M19/a
2.67

Page 46 of 65
4.7 Results Summary The findings of this project are summarised in Tables 7 and 8. In Table 7 the Badger Meter Research
valve had
observable hysteresis;
the installed characteristic curve did not have the strongest linear relationship;
significantly larger dead band;
a slower dead time.
The Baumann 24000S with Fisher 3660 Positioner had
no visible hysteresis;
it had the strongest linear relationship;
a small dead band of 0.5%;
a quicker dead time.
Based on these findings it is determined that the Baumann 24000S with Fisher 3660 Positioner
surpasses the performance of the Badger Meter Research valve, therefore it is advised that the
Baumann 24000S with Fisher 3660 positioner is a suitable replacement for the Badger Meter
Research valve.
Table 8 summarises the findings of the valves used on the air system. Most results provided the
same conclusions as Table 7, that the Baumann 24000S had stronger linearity, less dead band and a
faster dead time. Unlike Table 7 the hysteresis for the Baumann 24000S used on the air system was
observable although still less than the Research valve. The Baumann 24000S also did not produce
constant results for the dead band. These errors are a result of the Research valve being
permanently connected to the air valve flow meters. The Research valves cause inconsistencies with
the Baumann 24000S results because the fluid has to flow through both valves. The Research air
valves should be replaced or serviced as they do not perform as specified by their manufacturer.

Page 47 of 65
Water System
Table 7 Summary of Water System Test Results
Test Badger Meter
Research Valve
M08/a
Badger Meter
Research Valve
M08/d
Fisher 3660 with
Positioner Valve-
1
Fisher 3660 with
Positioner Valve- 2
Flow
Characteristic
Linearity (r2)
0.9283 0.8584 0.9857 0.993
Flow Coefficient 1.25 1.25 1 1
Dead Band 5% 5% 0.5% 0.5%
Dead Time (s) 3.85 3.44 2.89 2.56
Hysteresis Yes Yes Not Observable Not Observable
Air System
Table 8 Summary of Air System Test Results
Test Badger Meter
Research Valve
M19/a
Fisher 3660 with
Positioner Valve-
1 with M19/b
Fisher 3660 with
Positioner Valve- 2
with M19/a
Flow
Characteristic
Linearity (r2)
0.872 0.9812 0.9778
Flow Coefficient 0.2 0.2 0.2
Dead Band 7% 1% 0.5%
Dead Time (s) 3.44 2.67 2.67
Hysteresis Significant Significantly less
than M19/a
Significantly less
than M19/a

Page 48 of 65
5. Conclusion This project sets out to analyse the operability and performance of the Baumann 24000S with Fisher
3660 Positioner in comparison with the Badger Meter Research Valve by investigating the usage and
functionality, valve type and sizing, dead band, dead time, and hysteresis.
The valve usage was identified with the flow coefficient and either specified as an air valve or water
valve. The Baumann 24000S water valve has a Cv of 1 and Research Water Valve has a Cv of 1.25;
both air valves are smaller with a Cv of 0.2. Air is less dense than water so it flows through the valve
a lot quicker consequently only a small orifice valve is required for air.
The first test exploring the hysteresis found that, when tested on the water system, the Baumann
24000S valve had no visible hysteresis and the Research water valve did demonstrate hysteresis.
This is a result of the addition of the positioner which reduces hysteresis by ensuring the valve stem
consistently moves to the same position, despite the direction of movement of the stem.
The valve type and sizing was analysed by examining the flow coefficient and characteristic curves. It
was found that the Baumann 24000S had a more linear characteristics compared to the Research
valve. This is due to a combination of the trim styles, the pressure drop through the valve, and the
addition of the positioner.
Testing the dead band showed the Baumann 24000S has significantly less dead band than the
Research Valve. Positioners have the ability to check the stem is in the right position, so it can easily
adjust to overcome dead band before the flow is affected. Maintenance of a valve also has an effect
on the amount of dead band and hysteresis. The Baumann 24000S is a new valve so it would not
need maintenance like the Research Valve.
The dead time results indicated the response time of the Baumann 24000S was quicker than the
Research valve.
The hysteresis for the Baumann 24000S used on the air system was observable although still less
than the Research valve. The Baumann 24000S also did not produce consistent dead band results.
The Research valves are permanently connected to the air valve flow meters resulting in
inconsistencies with the Baumann 24000S results.
Based on these findings it is advised that the Research air valves be replaced or serviced as they do
not perform as specified by their manufacturer. It was also found that the positioner significantly
improves the performance of a valve. Under all performance tests the Baumann 24000S with Fisher

Page 49 of 65
3660 Positioner surpasses the Badger Meter Research Valve and is a suitable replacement for the
Badger Meter Research Valve.
5.1 Future Work As this is the first project focusing primarily on the control valves in the Instrumentation and Control
laboratory, there is a lot of work that can be undertaken in future projects which include:
Analysing and comparing the performance of the Baumann 51000 high pressure low flow
valve; the Fisher 24000S with electric actuator and the existing control valves in the Pilot
Plant. These valves could also be compared with the Baumann 24000S with Fisher 3660
Positioner or the Badger Meter Research valves.
Further analysis of the dead time by testing the time from when the valve opening signal
change is sent to when the stem first moves in response.
Additional performance tests could include how the maintenance of the valve affects the
valve performance; further research into valve type and sizing; analysing the resolution;
investigating valve and valve positioner overshoot; modelling the valves and tuning
controllers to compensate for these nonlinearities.
The I/P converter of the Badger Meter Research valves used for the air system should be
calibrated, in which case a pressure gauge needs to be fitted.
The Fluke 744 pressure module should be purchased in order to accurately measure the
pressure while calibrating the I/P converter; in this case a pressure gauge attached the
Badger Meter Research Valve is not required.
The Badger Meter Research valves could also be calibrated in terms of current signal to
stem position.
The flow meters all need testing as some of them seem to give inconsistent results. It is also
advised that all the flow meters should be mounted on separate panels or permanently
disconnected from the existing valves. This will allow the valves to be tested with different
flow meters and to ensure that there is no interference from the existing valves.

Page 50 of 65
References [1] Control Valve Handbook. U.S.A: Fisher Controls International LLC, 2005.
[2] S. Anderson and N. Rinehart, How to Achieve Optimal Control Valve Performance. Fisher Controls
International LLC, 2007.
http://www.documentation.emersonprocess.com/groups/public/documents/articles_articlesreprint
s/how_to_achieve_optimal_cv_perf.pdf
[3] Baumann 51000 High-Pressure, Low-Flow Control Valve. Fisher Controls International LLC, 2012.
[4] Control Valve Actuators and Positioners. Spirax-Sarco Limited, 2014. http://www.spiraxsarco.com/resources/steam-engineering-tutorials/control-hardware-el-pn-actuation/control-valve-actuators-and-positioners.asp
[5] Fisher 3660 and 3661 Positioners. Fisher Controls International LLC, 2012.
[6] Baumann 24000S Stainless Steel Control Valve. Fisher Controls International LLC, 2013.
[7] J. Love and M. Santinanavat, Slow opening gas valve. Missouri: Emerson Electric Co., 2001.
http://www.google.com/patents/US6263908
[8] S. Kalmbach, Piping for High-pressure Boilers: The Installation and Inspection of High-pressure
Boiler Piping for Code Compliance with the ASME and National Board Code Requirements.
Wheatmark, Inc., 2012.
[9] Model Numbers Research Control Valves. Badger Meter, Inc.
[10] Commonly Asked Questions. Mitech. http://www.mitech.co.za/pdf/caq.pdf
[11] B. Lipták , Instrument Engineers’ Handbook Fourth Edition Process Control and Optimization. CRC Press Taylor & Francis Group, 2006.
[12] Control Valves and Flow Characteristics, Engineering Toolbox.
http://www.engineeringtoolbox.com/control-valves-flow-characteristics-d_485.html
[13] Control Valve Characteristics. Spirax-Sarco Limited, 2015. http://www2.spiraxsarco.com/resources/steam-engineering-tutorials/control-hardware-el-pn-actuation/control-valve-characteristics.asp
[14] Dale E. Seborg; Thomas F.Edgar; Duncan A. Mellichamp, Process dynamics and control. 2nd ed.
John Wiley & Sons, Inc., 2004.
[15] J. Smuts, Process Control for Practitioners. OptiControls Inc, 2011.
[16] D. Cooper, Dead Time Is The "How Much Delay" Variable. Douglas J. Cooper, 2006.
http://www.controlguru.com/wp/p51.html
[17] Baumann NV Electric Actuator Instructions. Fisher Controls International LLC, 2006.

Page 51 of 65
[18] J, Beall. Improving Control Valve Performance. Texas: Chemical Engineering & Emerson, 2010.
http://www.documentation.emersonprocess.com/groups/public/documents/articles_articlesreprint
s/chemical_eng_improv_cv_perf.pdf
[19] S. Anderson and N. Rinehart, How to Achieve Optimal Control Valve Performance. Fisher
Controls International LLC, 2007.
http://www.documentation.emersonprocess.com/groups/public/documents/articles_articlesreprint
s/how_to_achieve_optimal_cv_perf.pdf
[20] M. Ruel, A simple method to determine control valve performance and its impacts on control
loop performance. Swanton, VT: Top Control Inc.
http://www.topcontrol.com/fichiers/en/controlvalveperformance.pdf
[21] W. Harmon Ray and Babatunde A. Ogunnaike, Process Dynamics, Modeling and Control. New
York: Oxford University Press, 1994.
[22] Fluke 744 Documenting Process Calibrator Users Manual.Fluke Corporation 1998.
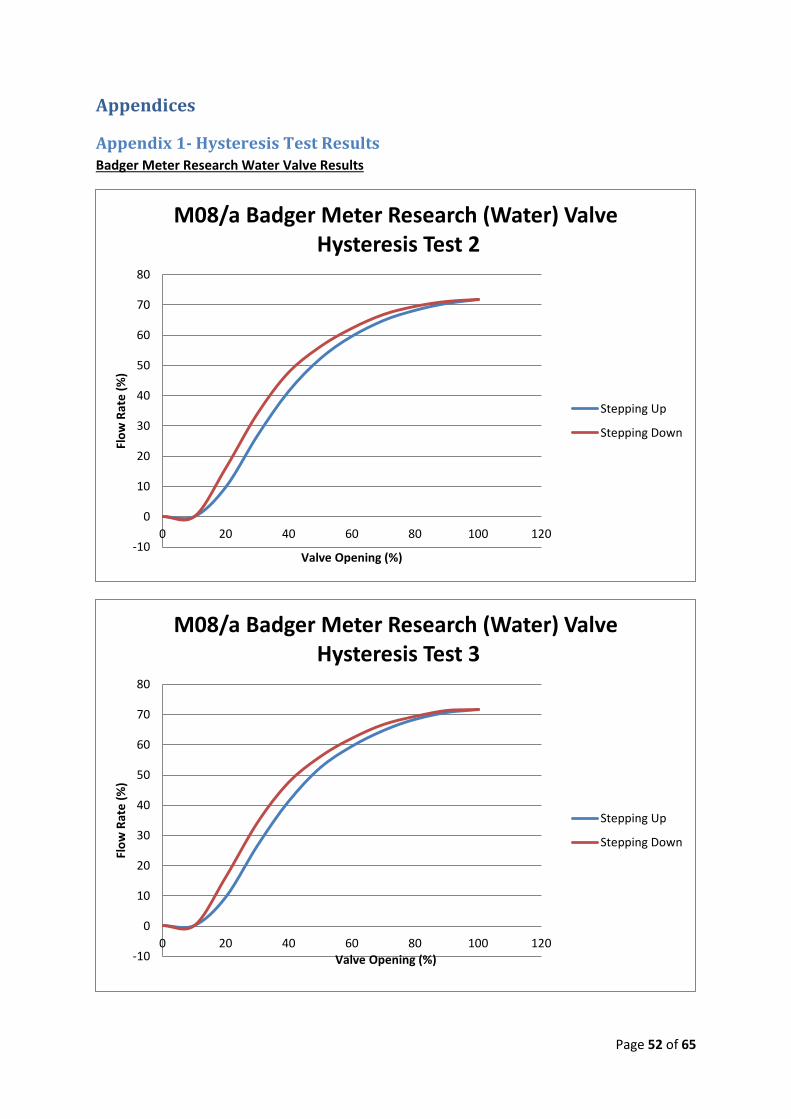
Page 52 of 65
Appendices
Appendix 1- Hysteresis Test Results Badger Meter Research Water Valve Results
-10
0
10
20
30
40
50
60
70
80
0 20 40 60 80 100 120
Flo
w R
ate
(%
)
Valve Opening (%)
M08/a Badger Meter Research (Water) Valve Hysteresis Test 2
Stepping Up
Stepping Down
-10
0
10
20
30
40
50
60
70
80
0 20 40 60 80 100 120
Flo
w R
ate
(%
)
Valve Opening (%)
M08/a Badger Meter Research (Water) Valve Hysteresis Test 3
Stepping Up
Stepping Down

Page 53 of 65
0
10
20
30
40
50
60
70
80
0 20 40 60 80 100 120
Flo
w R
ate
(%
)
Valve Opening (%)
M08/d Badger Meter Research Valve Hysteresis Test 2
Stepping Up
Stepping Down
0
10
20
30
40
50
60
70
80
0 20 40 60 80 100 120
Flo
w R
ate
(%
)
Valve Opening (%)
M08/d Badger Meter Research Valve Hysteresis Test 3
Stepping Up
Stepping Down

Page 54 of 65
Baumann 24000S with Fisher 3660 Positioner Water Valve Results
-10
0
10
20
30
40
50
60
70
0 20 40 60 80 100 120
% F
low
Rat
e
% Valve Opening
Baumann 24000s with Fisher 3660 Positioner (Water 1)
Hysteresis Test 2
Stepping Up
Stepping Down
-10
0
10
20
30
40
50
60
70
0 20 40 60 80 100 120
Flo
w R
ate
(%
)
Valve Opening (%)
Baumann 24000s with Fisher 3660 Positioner (Water 1)
Hysteresis Test 3
Stepping Up
Stepping Down

Page 55 of 65
0
10
20
30
40
50
60
70
0 20 40 60 80 100 120
Flo
w R
ate
(%
)
Valve Opening (%)
Baumann 24000S with Fisher 3660 Positioner (Water 2)
Hysteresis Test 1
Stepping Up
Stepping Down
0
10
20
30
40
50
60
70
0 20 40 60 80 100 120
Flo
w R
ate
(%
)
Valve Opening (%)
Baumann 24000S with Fisher 3660 Positioner (Water 2)
Hysteresis Test 3
Stepping Up
Stepping Down

Page 56 of 65
Badger Meter Research Air Valve Results
-20
0
20
40
60
80
100
120
140
0 20 40 60 80 100 120
Flo
w R
ate
(%
)
Valve Opening (%)
Hysteresis Test 2 Badger Meter Research Valve M19/a
Stepping Up
Stepping Down
-20
0
20
40
60
80
100
120
140
0 20 40 60 80 100 120
Flo
w R
ate
(%
)
Valve Opening (%)
Hysteresis Test 3 Badger Meter Research Valve M19/a
Stepping Up
Stepping Down
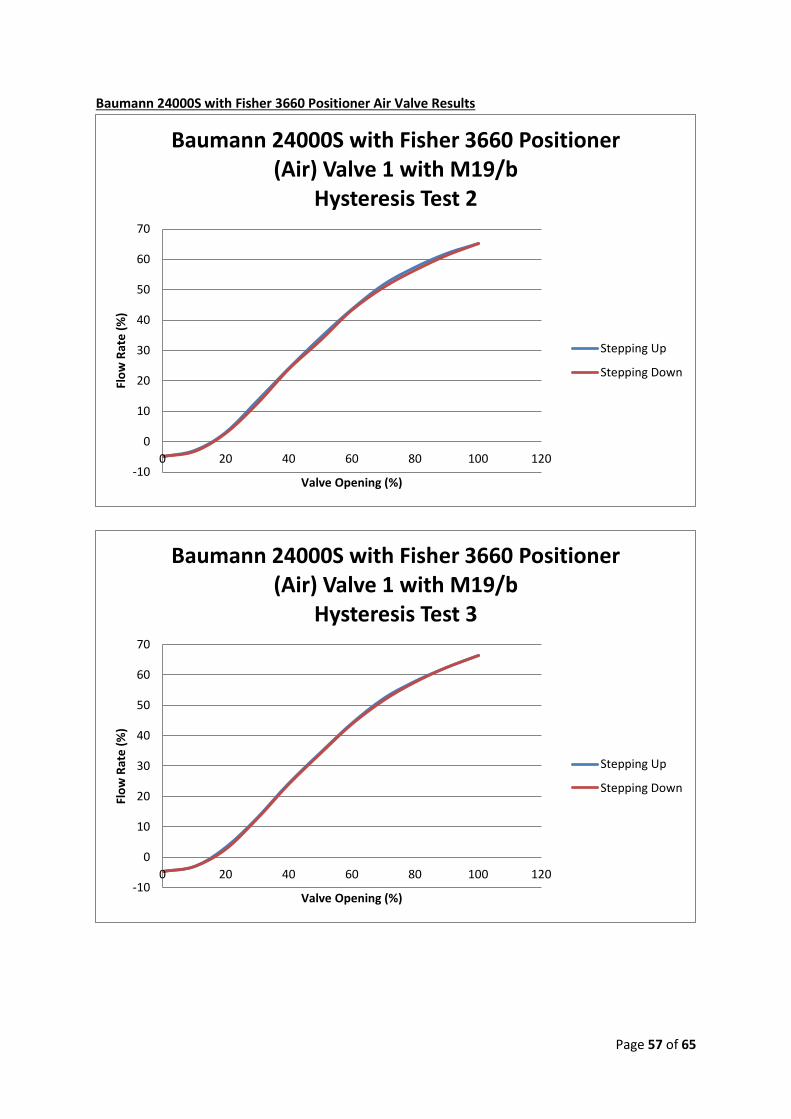
Page 57 of 65
Baumann 24000S with Fisher 3660 Positioner Air Valve Results
-10
0
10
20
30
40
50
60
70
0 20 40 60 80 100 120
Flo
w R
ate
(%
)
Valve Opening (%)
Baumann 24000S with Fisher 3660 Positioner (Air) Valve 1 with M19/b
Hysteresis Test 2
Stepping Up
Stepping Down
-10
0
10
20
30
40
50
60
70
0 20 40 60 80 100 120
Flo
w R
ate
(%
)
Valve Opening (%)
Baumann 24000S with Fisher 3660 Positioner (Air) Valve 1 with M19/b
Hysteresis Test 3
Stepping Up
Stepping Down

Page 58 of 65
-10
0
10
20
30
40
50
0 20 40 60 80 100 120
Flo
w R
ate
(%
)
Valve Opening (%)
Baumann 24000S with Fisher 3660 Positioner (Air) Valve 2 with M19/a
Hysteresis Test 2
Stepping Up
Stepping Down
-10
0
10
20
30
40
50
60
0 20 40 60 80 100 120
Flo
w R
ate
(%
)
Valve Opening (%)
Baumann 24000S with Fisher 3660 Positioner (Air) Valve 2 with M19/a
Hysteresis Test 3
Stepping Up
Stepping Down

Page 59 of 65
Appendix 2- Dead Band Test Results Badger Meter Research Water Valve Results
45
47
49
51
53
55
57
59
61
63
65
45
47
49
51
53
55
57
59
61
63
65
0 100 200 300 400 500
Flo
w R
ate
(%
)
Val
ve O
pe
nin
g (%
)
Time (s)
Badger Meter Research Valve M08/a (Water Valve) Deadband-
Test 2
Flow Rate (%)
Valve Opening (%)
45
47
49
51
53
55
57
59
61
63
65
45
47
49
51
53
55
57
59
61
63
65
-50 50 150 250 350 450
Flo
w R
ate
(%
)
Val
ve O
pe
nin
g (%
)
Time (s)
Badger Meter Research Valve M08/a (Water Valve) Deadband- Test 3
Valve Opening (%)
Flow Rate (%)

Page 60 of 65
45
47
49
51
53
55
57
59
61
63
65
0 100 200 300 400 500
Time (s)
Badger Meter Research (Water) Valve M08/d Dead Band- Test 1
Valve Opening (%)
Flow Rate (%)
45
47
49
51
53
55
57
59
61
63
65
0 500 1000 1500 2000 2500
Time (s)
Badger Meter Research (Water) Valve M08/d Dead Band- Test 3
Flow Rate (%)
Valve Opening (%)
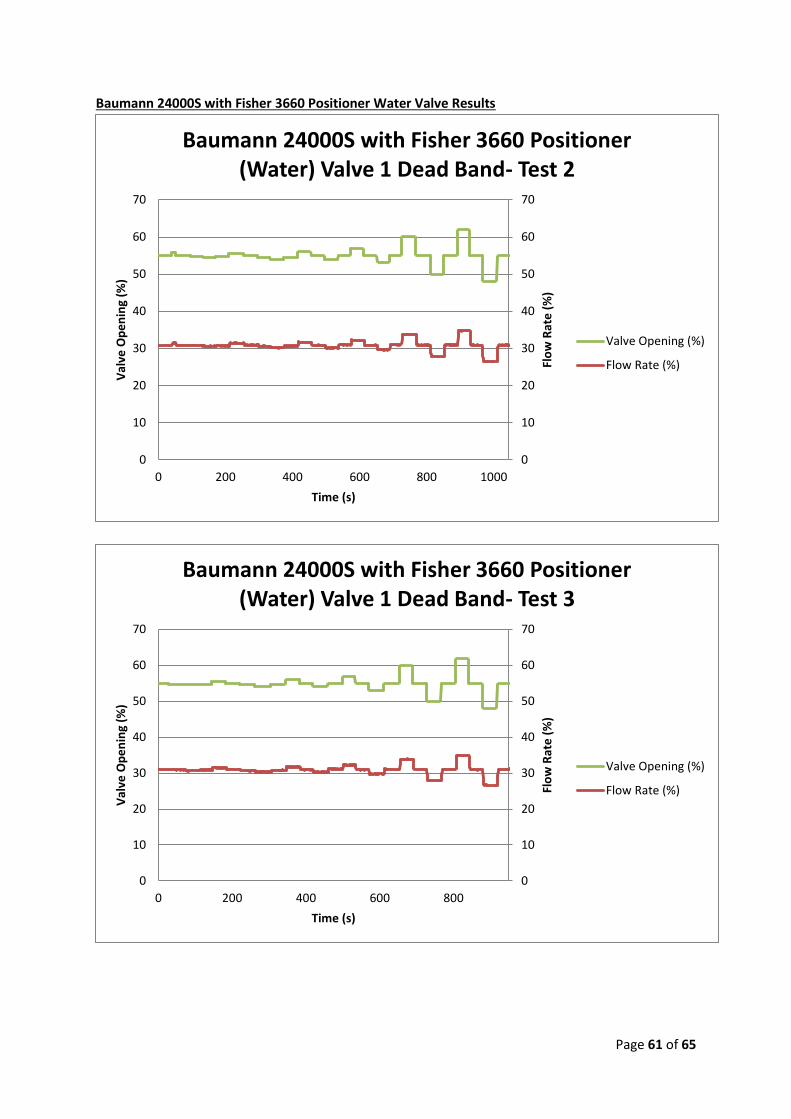
Page 61 of 65
Baumann 24000S with Fisher 3660 Positioner Water Valve Results
0
10
20
30
40
50
60
70
0
10
20
30
40
50
60
70
0 200 400 600 800 1000
Flo
w R
ate
(%
)
Val
ve O
pe
nin
g (%
)
Time (s)
Baumann 24000S with Fisher 3660 Positioner (Water) Valve 1 Dead Band- Test 2
Valve Opening (%)
Flow Rate (%)
0
10
20
30
40
50
60
70
0
10
20
30
40
50
60
70
0 200 400 600 800
Flo
w R
ate
(%
)
Val
ve O
pe
nin
g (%
)
Time (s)
Baumann 24000S with Fisher 3660 Positioner (Water) Valve 1 Dead Band- Test 3
Valve Opening (%)
Flow Rate (%)

Page 62 of 65
25
30
35
40
45
50
55
60
65
70
25
30
35
40
45
50
55
60
65
70
20 520 1020 1520 2020
Flo
w R
ate
(%
)
Val
ve O
pe
nin
g (%
)
Time (s)
Baumann 24000s with Fisher 3660 Positioner (Water) Valve 2 Dead Band- Test 2
Valve Opening (%)
Flow Rate (%)
25
30
35
40
45
50
55
60
65
70
25
30
35
40
45
50
55
60
65
70
20 520 1020 1520 2020
Flo
w R
ate
(%
)
Val
ve O
pe
nin
g (%
)
Time (s)
Baumann 24000s with Fisher 3660 Positioner (Water) Valve 2 Dead Band- Test 3
Valve Opening (%)
Flow Rate (%)

Page 63 of 65
Badger Meter Research Air Valve Results
10
20
30
40
50
60
70
80
110 210 310 410 510 610
Time (s)
Deadband M19/a Badger Meter Research (Air) Valve- Test 1
Flow Rate (%)
Valve Opening (%)
10
20
30
40
50
60
70
80
30 130 230 330 430
Time (s)
Deadband M19/a Badger Meter Research (Air) Valve- Test 3
Flow Rate (%)
Valve Opening (%)

Page 64 of 65
Baumann 24000S with Fisher 3660 Positioner Air Valve Results
30
35
40
45
50
55
60
65
70
30
35
40
45
50
55
60
65
70
0 100 200 300 400 500 600
Flo
w R
ate
(%
)
Val
ve O
pe
nin
g (%
)
Time (s)
Baumann 24000S with Fisher 3660 Positioner (Air) Valve with M19/b
Dead Band Test 2
Valve Opening (%)
Flow Rate (%)
30
35
40
45
50
55
60
65
70
30
35
40
45
50
55
60
65
70
20 120 220 320 420 520 620
Flo
w R
ate
(%
)
Val
ve O
pe
nin
g (%
)
Time (s)
Baumann 24000S with Fisher 3660 Positioner (Air) Valve with M19/b
Dead Band Test 3
Series1
Series2

Page 65 of 65
30
35
40
45
50
55
60
65
70
30
35
40
45
50
55
60
65
70
0 100 200 300 400 500 600
Flo
w R
ate
(%
)
Val
ve O
pe
nin
g (%
)
Time (s)
Baumann 24000S with Fisher 3660 Positioner (Air) Valve 2 with M19/a
Dead Band Test 2
Valve Opening (%)
Flow Rate (%)
30
35
40
45
50
55
60
65
70
30
35
40
45
50
55
60
65
70
0 100 200 300 400 500 600
Flo
w R
ate
(%
)
Val
ve O
pe
nin
g (%
)
Time (s)
Baumann 24000S with Fisher 3660 Positioner (Air) Valve 2 with M19/a Dead Band Test 3
Valve Opening (%)
Flow Rate (%)