opening doors - NTT Docomo · Services (New Services) DOCOMO is working to propose new methods of...
123
opening doors opening doors Annual Report 2009 Year ended March 31, 2009
Transcript of opening doors - NTT Docomo · Services (New Services) DOCOMO is working to propose new methods of...
opening doors
Printed in Japan
op
en
ing
do
ors
contents Annual Report 2009
Year ended March 31, 2009
This annual report is printed with soy ink on recycled paper.
An
nu
al Rep
ort 2009
Year ended March 31, 2009

STock InforMaTIon 119
Unless specifically stated otherwise, information in this annual report is as of July 2009.as used in this annual report, references to “DocoMo”, “the company”, “we”, “our” , “our group” and “us” are to nTT DocoMo, Inc. and its consolidated subsidiaries except as the context otherwise requires. name of companies or products presented in this annual report are the trademarks or registered trademarks of their respective organizations.
DEFINITION OF TERMS“fiscal 2008” refers to our fiscal year ended March 31, 2009, and other fiscal years are referred to in a corresponding manner.
SPECIAL NOTE REGARDING FORWARD-LOOKING STATEMENTSThis Earnings release contains forward-looking statements such as forecasts of results of operations, management strategies, objectives and plans, forecasts of operational data such as expected number of subscribers, and expected dividend payments. all forward-looking statements that are not historical facts are based on management’s current plans, expectations, assumptions and estimates based on the information currently available. Some of the projected numbers in this report were derived using certain assumptions that are indispensable for making such projections in addition to historical facts. These forward-looking statements are subject to various known and unknown risks, uncertainties and other factors that could cause our actual results to differ materially from those contained in or suggested by any forward-looking statement. Potential risks and uncertainties include, without limitation, the following:
1. changes in the business environment in the telecommunications industry, such as intensifying competition from other service providers or other technologies caused by Mobile number Portability, new market entrants and other factors, could limit our acquisition of new subscriptions and retention of existing subscriptions, or may lead to diminishing arPU or an increase in our costs and expenses.
2. current and new services, usage patterns, and sales schemes introduced by our corporate group may not develop as planned, which could affect our financial condition and limit our growth.
3. The introduction or change of various laws or regulations or the application of such laws and regulations to our corporate group could restrict our business operations, which may adversely affect our financial condition and results of operations.
4. Limitations in the amount of frequency spectrum or facilities made available to us could negatively affect our ability to maintain and improve our service quality and level of customer satisfaction.
5. The W-cDMa technology that we use for our 3G system and/or mobile multimedia services may not be introduced by other overseas operators, which could limit our ability to offer international services to our subscribers.
6. our domestic and international investments, alliances and collaborations may not produce the returns or provide the opportunities we expect.
7. as electronic payment capability and many other new features are built into our cellular phones, and services of parties other than those belonging to our corporate group are provided through our cellular handsets, potential problems resulting from malfunctions, defects or loss of handsets, or imperfection of services provided by such other parties may arise, which could have an adverse effect on our financial condition and results of operations.
8. Social problems that could be caused by misuse or misunderstanding of our products and services may adversely affect our credibility or corporate image.
9. Inadequate handling of confidential business information including personal information by our corporate group, contractors and other factors, may adversely affect our credibility or corporate image.
10. owners of intellectual property rights that are essential for our business execution may not grant us the right to license or otherwise use such intellectual property rights on acceptable terms or at all, which may limit our ability to offer certain technologies, products and/or services, and we may also be held liable for damage compensation if we infringe the intellectual property rights of others.
11. Earthquakes, power shortages, malfunctioning of equipment, software bugs, computer viruses, cyber attacks, hacking, unauthorized access and other problems could cause systems failures in the networks required for the provision of service, disrupting our ability to offer services to our subscribers and may adversely affect our credibility or corporate image.
12. concerns about wireless telecommunication health risks may adversely affect our financial condition and results of operations.
13. our parent company, nippon Telegraph and Telephone corporation (nTT), could exercise influence that may not be in the interests of our other shareholders.
We want to open the door to the future,
and connect you to people in exciting new ways.
By getting to know you as an individual,
and understanding your aspirations...
Our goal is to deliver personalized services,
designed to meet your communication needs...
And to serve and support you in all that you do,
so you can discover the unlimited potential
that makes your dreams come true.
The key that opens the door to the future is in your hand.
Unlimited potential, in your hand.
Stock Informationas of March 31, 2009
Transfer Agent
Mitsubishi UfJ Trust and Banking corporation, corporate agency Department
4-5, Marunouchi 1-chome, chiyoda-ku, Tokyo 100-8212, Japan
Tel: +81 3 3212 1211
Depositary for American Depositary Receipts (“ADRs”) (as of July 1, 2009)
The Bank of new York Mellon corporation
101 Barclay Street, new York, nY 10286, U.S.a.
U.S. callers: (888) BnY aDrS
non-U.S. callers: +1 866 239 0235
Stock Listings
Tokyo Stock Exchange, first Section listed october 1998 (Securities code: 9437)
new York Stock Exchange listed March 2002 (Ticker symbol: DcM)
London Stock Exchange listed March 2002 (Ticker symbol: nDcM)
Number of Shares
authorized: 188,130,000
Issued: 43,950,000
Number of Shareholders
320,511
Distribution of Ownership among Shareholders
nTT 62.89%
foreign corporations 13.05%
financial Institutions 11.75%
Individuals and others 6.16%
Treasury Stock 4.98%
other corporations (excluding nTT) 1.17%
* The above figures are based on the list of shareholders and records of actual share ownership as of March 31, 2009.
Major Shareholders Percentage of Total
number of Shares Held Issued Shares (%)
nIPPon TELEGraPH anD TELEPHonE corPoraTIon 27,640,000 62.89
Japan Trustee Services Bank, Ltd. (Trust account) 1,172,214 2.67
Japan Trustee Services Bank, Ltd. (Trust account 4G) 1,071,978 2.44
The Master Trust Bank of Japan, Ltd. (Trust account) 979,570 2.23
JP Morgan chase Bank 380055 283,321 0.64
State Street Bank and Trust company 505225 225,256 0.51
The Bank of new York Mellon as Depositary Bank for Depositary receipt Holders 224,444 0.51
Mellon Bank na as agent for its client Mellon omnibus US Pension 183,320 0.42
The chase Manhattan Bank na London SL omnibus account 177,050 0.40
oD05 omnibus china Treaty 808150 159,215 0.36
Total 32,116,368 73.07
* Treasury stocks are not included in the above list.
Financial Structure at a Glance 3
Financial Highlights (U.S. GAAP) 4
DOCOMO in the Mobile
Communications Industry 6
a Major change in Strategy 6
In figures 8
To Our Shareholders 10
Financial and Capital Strategy 16
Increasing Customer Satisfaction and
Realizing Our Medium-Term Vision 17
Review of Operations 27
overview 28
Services / content 30
rate Structure 31
Handsets 32
network 34
customer relations 35
International 36
new Business 37
research & Development 38
Management System and CSR 39
corporate Governance 40
Internal control 42
Information Management 43
corporate Social responsibility (cSr) 44
Board of Directors and corporate auditors 46
Financial Section 47
Organization 116
Overseas Bases / Subsidiaries
and Affiliates 117
Corporate Data 118
Stock Information 119
contents
�
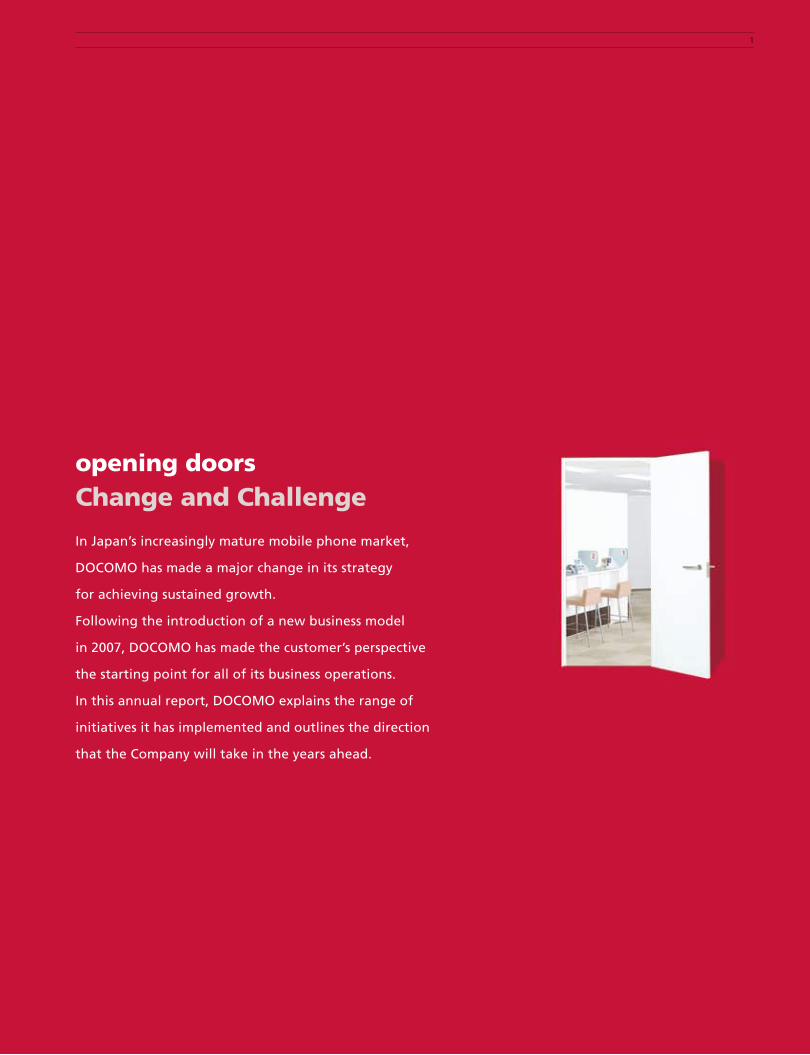
opening doorsChange and Challenge
In Japan’s increasingly mature mobile phone market,
DOCOMO has made a major change in its strategy
for achieving sustained growth.
Following the introduction of a new business model
in 2007, DOCOMO has made the customer’s perspective
the starting point for all of its business operations.
In this annual report, DOCOMO explains the range of
initiatives it has implemented and outlines the direction
that the Company will take in the years ahead.

� OPENING DOORS : FINANCIAL STRUCTURE AT A GLANCE
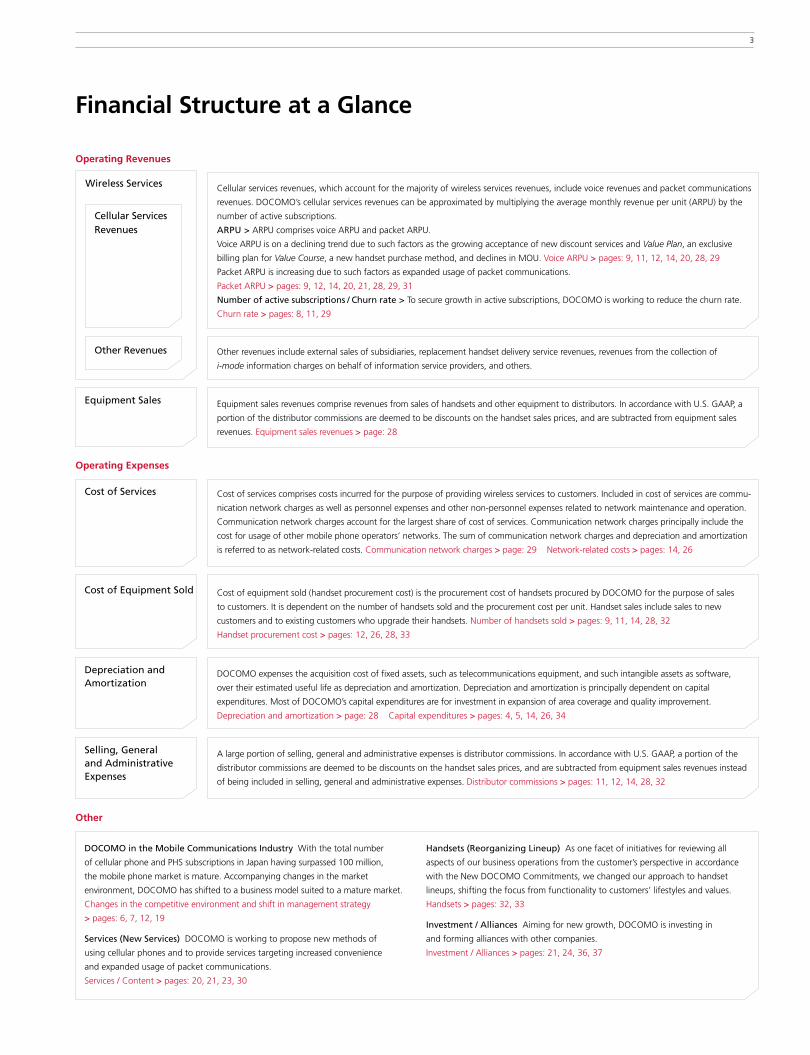
Financial Structure at a Glance
Equipment Sales
Wireless Services
Cellular Services Revenues
Other Revenues
Cellular services revenues, which account for the majority of wireless services revenues, include voice revenues and packet communications
revenues. DOCOMO’s cellular services revenues can be approximated by multiplying the average monthly revenue per unit (ARPU) by the
number of active subscriptions.
ARPU > ARPU comprises voice ARPU and packet ARPU. Voice ARPU is on a declining trend due to such factors as the growing acceptance of new discount services and Value Plan, an exclusive
billing plan for Value Course, a new handset purchase method, and declines in MOU. Voice ARPU > pages: 9, ��, ��, �4, �0, �8, �9 Packet ARPU is increasing due to such factors as expanded usage of packet communications.
Packet ARPU > pages: 9, ��, �4, �0, ��, �8, �9, 3�
Number of active subscriptions / Churn rate > To secure growth in active subscriptions, DOCOMO is working to reduce the churn rate.
Churn rate > pages: 8, ��, �9
Cost of Services
Cost of Equipment Sold
Depreciation and Amortization
Selling, General and Administrative Expenses
Cost of equipment sold (handset procurement cost) is the procurement cost of handsets procured by DOCOMO for the purpose of sales
to customers. It is dependent on the number of handsets sold and the procurement cost per unit. Handset sales include sales to new
customers and to existing customers who upgrade their handsets. Number of handsets sold > pages: 9, ��, �4, �8, 3�
Handset procurement cost > pages: ��, �6, �8, 33
A large portion of selling, general and administrative expenses is distributor commissions. In accordance with U.S. GAAP, a portion of the
distributor commissions are deemed to be discounts on the handset sales prices, and are subtracted from equipment sales revenues instead
of being included in selling, general and administrative expenses. Distributor commissions > pages: ��, ��, �4, �8, 3�
DOCOMO expenses the acquisition cost of fixed assets, such as telecommunications equipment, and such intangible assets as software,
over their estimated useful life as depreciation and amortization. Depreciation and amortization is principally dependent on capital
expenditures. Most of DOCOMO’s capital expenditures are for investment in expansion of area coverage and quality improvement.
Depreciation and amortization > page: �8 Capital expenditures > pages: 4, 5, �4, �6, 34
Other revenues include external sales of subsidiaries, replacement handset delivery service revenues, revenues from the collection of
i-mode information charges on behalf of information service providers, and others.
Equipment sales revenues comprise revenues from sales of handsets and other equipment to distributors. In accordance with U.S. GAAP, a
portion of the distributor commissions are deemed to be discounts on the handset sales prices, and are subtracted from equipment sales
revenues. Equipment sales revenues > page: �8
DOCOMO in the Mobile Communications Industry With the total number
of cellular phone and PHS subscriptions in Japan having surpassed �00 million,
the mobile phone market is mature. Accompanying changes in the market
environment, DOCOMO has shifted to a business model suited to a mature market.
Changes in the competitive environment and shift in management strategy
> pages: 6, 7, ��, �9
Services (New Services) DOCOMO is working to propose new methods of
using cellular phones and to provide services targeting increased convenience
and expanded usage of packet communications.
Services / Content > pages: �0, ��, �3, 30
Handsets (Reorganizing Lineup) As one facet of initiatives for reviewing all
aspects of our business operations from the customer’s perspective in accordance
with the New DOCOMO Commitments, we changed our approach to handset
lineups, shifting the focus from functionality to customers’ lifestyles and values.
Handsets > pages: 3�, 33
Investment / Alliances Aiming for new growth, DOCOMO is investing in
and forming alliances with other companies.
Investment / Alliances > pages: ��, �4, 36, 37
Operating Revenues
Operating Expenses
Other
Cost of services comprises costs incurred for the purpose of providing wireless services to customers. Included in cost of services are commu-
nication network charges as well as personnel expenses and other non-personnel expenses related to network maintenance and operation.
Communication network charges account for the largest share of cost of services. Communication network charges principally include the
cost for usage of other mobile phone operators’ networks. The sum of communication network charges and depreciation and amortization
is referred to as network-related costs. Communication network charges > page: �9 Network-related costs > pages: �4, �6
3

Financial Highlights (U.S. GAAP)NTT DOCOMO, INC. AND SUBSIDIARIES
Years ended March 3�
� Translations of the Japanese yen amounts into U.S. dollars are included solely for the convenience of readers by using the noon buying rate in New York City for cable transfers in foreign currencies as certified
for customs purposes by the Federal Reserve Bank of New York on March 3�, �009, which was ¥99.�5 to U.S.$�.00.
� Total debt = Short-term borrowings + Current portion of long-term debt + Long-term debt
3 Free cash flows = Net cash provided by operating activities + Net cash used in investing activities
4 Irregular factors represent the effects of uncollected revenues due to bank closure at the end of periods. Changes in investments for cash management purposes were derived from purchases, redemption at maturity and sales of
financial instruments held for cash management purposes with original maturities of longer than three months. For the reconciliations of these Non-GAAP financial measures, see page ��5.
5 Capital expenditures are calculated on an accrual basis for the purchases of property, plant and equipment, and intangible and other assets.
6 ROCE ratios are calculated using the simple average of the applicable year-end balance sheet figures.
7 Operating income margin = Operating income / Operating revenues
8 EBITDA = Operating income + Depreciation and amortization + Losses on sale or disposal of property, plant and equipment
EBITDA margin = EBITDA / Total operating revenues. For the reconciliations of these Non-GAAP financial measures, see page ��5.
9 ROCE (Return on capital employed) = Operating income / (Shareholders’ equity + Total debt)
�0 Equity ratio = Total shareholders’ equity / Total assets
�� Debt ratio = Total debt / (Shareholders’ equity + Total debt)
�� In the calculation of per share data, treasury stocks are not included in the number of outstanding shares during or at the end of the year.
�3 Cash dividends declared per share are presented in the fiscal year to which each record date for the dividends belongs.
4 OPENING DOORS : FINANCIAL HIGHLIGHTS (U.S. GAAP)
Millions of U.S. dollars�
Millions of yen (excluding per share data) (excluding per share data)
�005 �006 �007 �008 2009 2009
Operating results
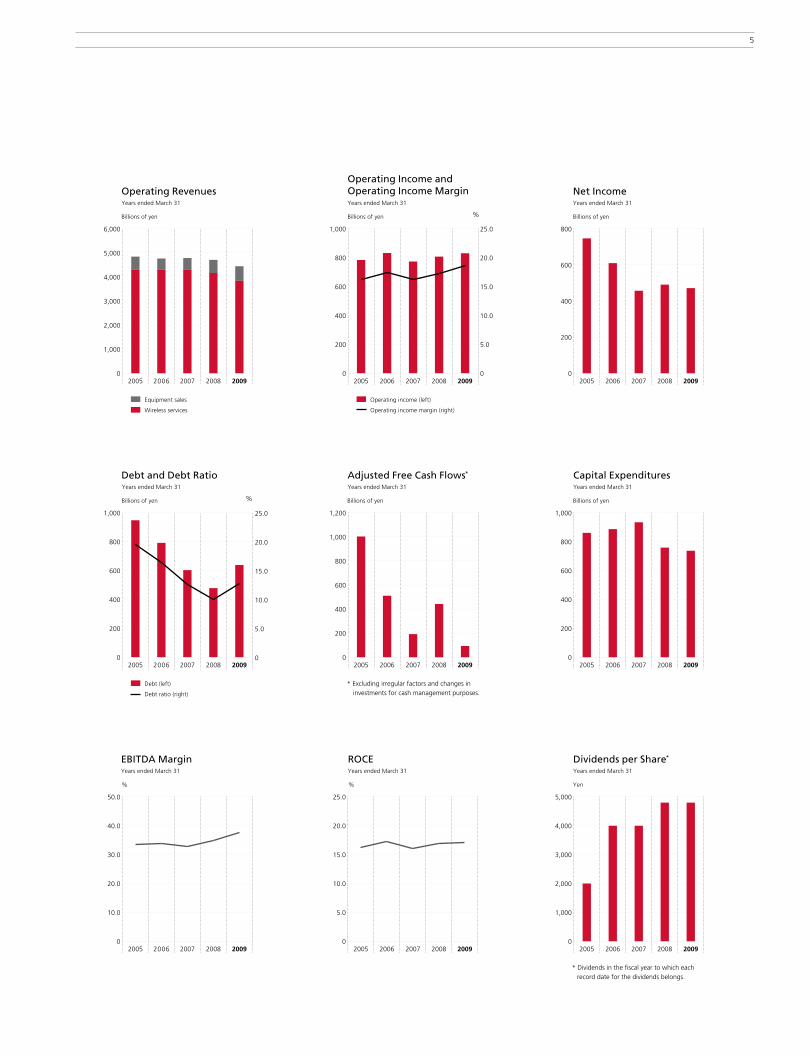
Operating revenues ¥4,844,6�0 ¥4,765,87� ¥4,788,093 ¥4,7��,8�7 ¥ 4,447,980 $ 44,86�
Wireless services 4,�96,537 4,�95,856 4,3�4,�40 4,�65,�34 3,84�,08� 38,740
Equipment sales 548,073 470,0�6 473,953 546,593 606,898 6,���
Operating expenses 4,060,444 3,933,�33 4,0�4,569 3,903,5�5 3,6�7,0�� 36,480
Operating income 784,�66 83�,639 773,5�4 808,3�� 830,959 8,38�
Net income 747,564 6�0,48� 457,�78 49�,�0� 47�,873 4,759
Financial position
Total assets ¥6,�36,5�� ¥6,365,�57 ¥6,��6,��5 ¥6,��0,834 ¥ 6,488,��0 $ 65,438
Total debt� 948,5�3 79�,405 60�,965 478,464 639,�33 6,447
Total shareholders’ equity 3,907,93� 4,05�,0�7 4,�6�,303 4,�76,496 4,34�,585 43,788
Cash flows
Net cash provided by operating activities ¥�,�8�,585 ¥�,6�0,94� ¥ 980,598 ¥�,560,�40 ¥ �,�73,677 $ ��,837
Net cash used in investing activities (578,3�9) (95�,077) (947,65�) (758,849) (�,030,983) (�0,398)
Adjusted free cash flows (excluding irregular
factors and changes in investments for
cash management purposes) 3,4 �,003,583 5�0,905 �9�,�37 44�,4�0 93,4�6 94�
Other financial data
Capital expenditures5 ¥ 86�,5�7 ¥ 887,��3 ¥ 934,4�3 ¥ 758,743 ¥ 737,606 $ 7,439
Financial ratios6
Operating income margin7 �6.�% �7.5% �6.�% �7.�% �8.7%
EBITDA margin8 33.6% 33.7% 3�.9% 34.8% 37.7%
ROCE9 �6.�% �7.�% �6.�% �7.0% �7.�%
Equity ratio�0 63.7% 63.7% 68.0% 68.9% 66.9%
Debt ratio�� �9.5% �6.4% ��.7% �0.�% ��.8%
Per share data�� (yen and U.S. dollars)
Basic and diluted earnings per share ¥ �5,77� ¥ �3,49� ¥ �0,396 ¥ ��,39� ¥ ��,�7� $ ���.67
Shareholders’ equity per share 84,455 9�,�09 95,457 �00,3�� �03,966 �,048.57
Cash dividends declared per share�3 �,000 4,000 4,000 4,800 4,800 48.4�
Equipment sales
Wireless services
0
1,000
2,000
3,000
4,000
5,000
6,000
20092008200720062005
Operating Revenues
Billions of yen
Years ended March 31
Operating income (left)
Operating income margin (right)
0
200
400
600
800
1,000
Operating Income andOperating Income Margin
Billions of yen %
Years ended March 31
0
200
400
600
800
20092008200720062005
Net Income
Billions of yen
Years ended March 31
Debt (left)
Debt ratio (right)
0
200
400
600
800
1,000
20092008200720062005
Debt and Debt Ratio
Billions of yen %
Years ended March 31
* Excluding irregular factors and changes in investments for cash management purposes.
0
200
400
600
800
1,000
1,200
20092008200720062005
Adjusted Free Cash Flows*
Billions of yen
Years ended March 31
0
200
400
600
800
1,000
20092008200720062005
Capital Expenditures
Billions of yen
Years ended March 31
0
10.0
20.0
30.0
40.0
50.0
200920082007200620050
5.0
10.0
15.0
20.0
25.0
20092008200720062005
EBITDA Margin
% %
Years ended March 31
ROCEYears ended March 31
* Dividends in the fiscal year to which eachrecord date for the dividends belongs.
0
1,000
2,000
3,000
4,000
5,000
20092008200720062005
Dividends per Share*
Yen
Years ended March 31
200920082007200620050
5.0
10.0
15.0
20.0
25.0
0
5.0
10.0
15.0
20.0
25.0
5
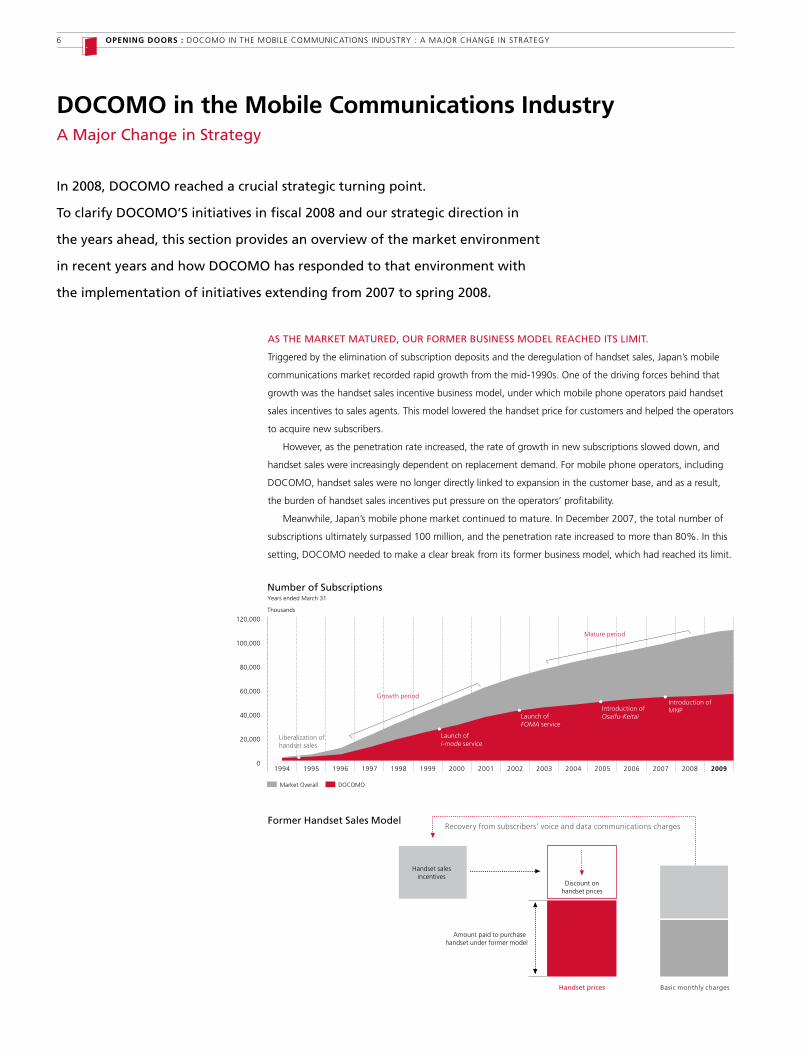
DOCOMO in the Mobile Communications Industry
In 2008, DOCOMO reached a crucial strategic turning point.
To clarify DOCOMO’S initiatives in fiscal 2008 and our strategic direction in
the years ahead, this section provides an overview of the market environment
in recent years and how DOCOMO has responded to that environment with
the implementation of initiatives extending from 2007 to spring 2008.
AS THE MARKET MATURED, OUR FORMER BUSINESS MODEL REACHED ITS LIMIT.
Triggered by the elimination of subscription deposits and the deregulation of handset sales, Japan’s mobile
communications market recorded rapid growth from the mid-�990s. One of the driving forces behind that
growth was the handset sales incentive business model, under which mobile phone operators paid handset
sales incentives to sales agents. This model lowered the handset price for customers and helped the operators
to acquire new subscribers.
However, as the penetration rate increased, the rate of growth in new subscriptions slowed down, and
handset sales were increasingly dependent on replacement demand. For mobile phone operators, including
DOCOMO, handset sales were no longer directly linked to expansion in the customer base, and as a result,
the burden of handset sales incentives put pressure on the operators’ profitability.
Meanwhile, Japan’s mobile phone market continued to mature. In December �007, the total number of
subscriptions ultimately surpassed �00 million, and the penetration rate increased to more than 80%. In this
setting, DOCOMO needed to make a clear break from its former business model, which had reached its limit.
Market Overall DOCOMO
Number of Subscriptions
Thousands
Years ended March 31
Growth period
Mature period
0
20,000
40,000
60,000
80,000
100,000
120,000
2009200820072006200520042003200220012000199919981997199619951994
Liberalization ofhandset sales
Launch of i-mode service
Launch of FOMA service
Introduction of Osaifu-Keitai
Introduction of MNP
A Major Change in Strategy
Former Handset Sales Model
Handset prices Basic monthly charges
Recovery from subscribers’ voice and data communications charges
Handset salesincentives
Discount onhandset prices
Amount paid to purchase handset under former model
6 OPENING DOORS : DOCOMO IN THE MOBILE COMMUNICATIONS INDUSTRY : A MAJOR CHANGE IN STRATEGY

7
MAJOR TURNING POINT IN STRATEGY
In accordance with the changes in the market environment, DOCOMO introduced a new business model
suitable for a mature market. The new business model has two essential components—new discount services
launched in August �007, centered on Fami-wari MAX 50, and new handset purchase methods introduced
in November �007.
The Fami-wari MAX 50 service offers substantial discounts on basic monthly charges, conditioned on a
two-year contract. This service is intended to stabilize DOCOMO’s customer base by building long-term rela-
tionships with customers. With the new handset purchase method Value Course, we have reduced the former
sales model’s handset sales incentives, which were increasingly unsuited to a mature market environment. Cus-
tomers who select Value Course pay an amount equivalent to the actual cost of the handset, and in exchange
an amount equivalent to the handset sales incentive is discounted from their basic monthly charges. The objec-
tives of this purchase method are to reduce DOCOMO’s burden for the cost of handset sales and to correct the
unfairness stemming from differences among subscribers in the frequency of handset replacement. In addition
to changing its business model, DOCOMO also implemented fundamental reforms of its operating strategies.
MAJOR SHIFT IN FOCUS TOWARD ENHANCING THE SATISFACTION OF OUR 55 MILLION CUSTOMERS
To secure the continued support of customers in a mature market, we need to accurately identify the diversi-
fying needs of each customer and provide services that respond appropriately to those needs. Accordingly,
we have shifted our focus from efforts to acquire new subscribers to marketing programs that enhance brand
loyalty through the pursuit of greater depth and length in relationships with customers by enhancing satisfac-
tion among existing customers. In order to demonstrate DOCOMO’s strong determination, we announced the
New DOCOMO Commitments, our vision for transformation, and renewed the corporate brand logo for the
first time since our establishment.
As a “Relation Service Company” that strengthens ties among people and lifestyles, DOCOMO has made
a new start. We are now focused on increasing the satisfaction of our 55 million customers and are working
to leverage our customer base, foster stable revenue and profit growth, and contribute to the continued
development of society.
New Handset Purchase Method – Value Course New Discount Services
Basic monthly chargesHandset prices
Handset salesincentives
Reduction in distributor commissions
Rise in handset prices
Amount paid topurchase handset
under former model
Reduction of basiccharges in compensationfor rise in handset price
Value Course monthly charges
Amount paid to purchasehandset under Value Course
Previously
New acquisition + Prevention of churns
Brand loyalty building =
Enhancing satisfaction ofDOCOMO’s 55 million customers
(degree of trust and satisfaction) (number of years of subscription)
Relationship depth x Length
Start of Building Brand Loyalty Targeting Higher Satisfaction of 55 Million Customers

55.7% 54.4% 52.0% 50.8%
4Q3Q2Q1Q
Millions
■ DOCOMO 51,143.6 52,621.1 53,387.7 54,600.7 53,628.7 53,937.0 54,155.1 54,600.7
■ KDDI (au + TU-KA)1 25,438.5 28,188.3 30,339.2 30,842.8 30,304.9 30,451.7 30,550.2 30,842.8
■ SoftBank Mobile2 15,209.9 15,908.5 18,586.2 20,632.9 19,111.7 19,633.2 19,999.8 20,632.9
(Thousands)
DOCOMO’s Market Share of Subscriptions
0
10
20
30
40
50
60
2009200820072006
Number of Subscriptions by OperatorFiscal year/quarterly data
Fiscal years ended March 3�
Source: Telecommunications Carriers Association
Net Addition by OperatorFiscal year/quarterly data
Fiscal years ended March 3�
Source: Telecommunications Carriers Association
0
1
2
3
4Q3Q2Q1Q
Millions
■ DOCOMO 2,318.7 1,477.5 766.6 1,213.0 241.0 308.3 218.1 445.6
■ KDDI (au + TU-KA)1 2,306.5 2,749.8 2,150.9 503.6 (34.3) 146.8 98.5 292.6
■ SoftBank Mobile2 169.2 698.6 2,677.7 2,046.7 525.5 521.5 366.6 633.1
2009200820072006(Thousands)
Churn Rate by OperatorFiscal year/quarterly data
Fiscal years ended March 3�
Source: Public sources from each company
Aggregate ARPU by OperatorFiscal year/quarterly data
Fiscal years ended March 3�
Source: Public sources from each company
0
2,000
4,000
6,000
8,000
4Q3Q2Q1Q
Yen
■ DOCOMO 6,910 6,700 6,360 5,710 5,890 5,860 5,730 5,390
■ KDDI (au + TU-KA)1 7,040 6,610 6,260 5,800 5,900 5,940 5,870 5,500
■ SoftBank Mobile2 5,810 5,510 4,650 4,070 4,180 4,170 4,090 3,830
2009200820072006
In Figures
8 OPENING DOORS : DOCOMO IN THE MOBILE COMMUNICATIONS INDUSTRY : IN FIGURES
0.0
0.5
1.0
1.5
2.0
4Q3Q2Q1Q
%
DOCOMO 0.77% 0.78% 0.80% 0.50% 0.51% 0.52% 0.44% 0.52%
KDDI (au + TU-KA)1 1.20% 1.02% 0.95% 0.76% 0.87% 0.75% 0.65% 0.77%
SoftBank Mobile2 1.59% 1.50% 1.32% 1.00% 0.98% 0.98% 0.91% 1.13%
2009200820072006
9
0
1,500
3,000
4,500
6,000
4Q3Q2Q1Q
Yen
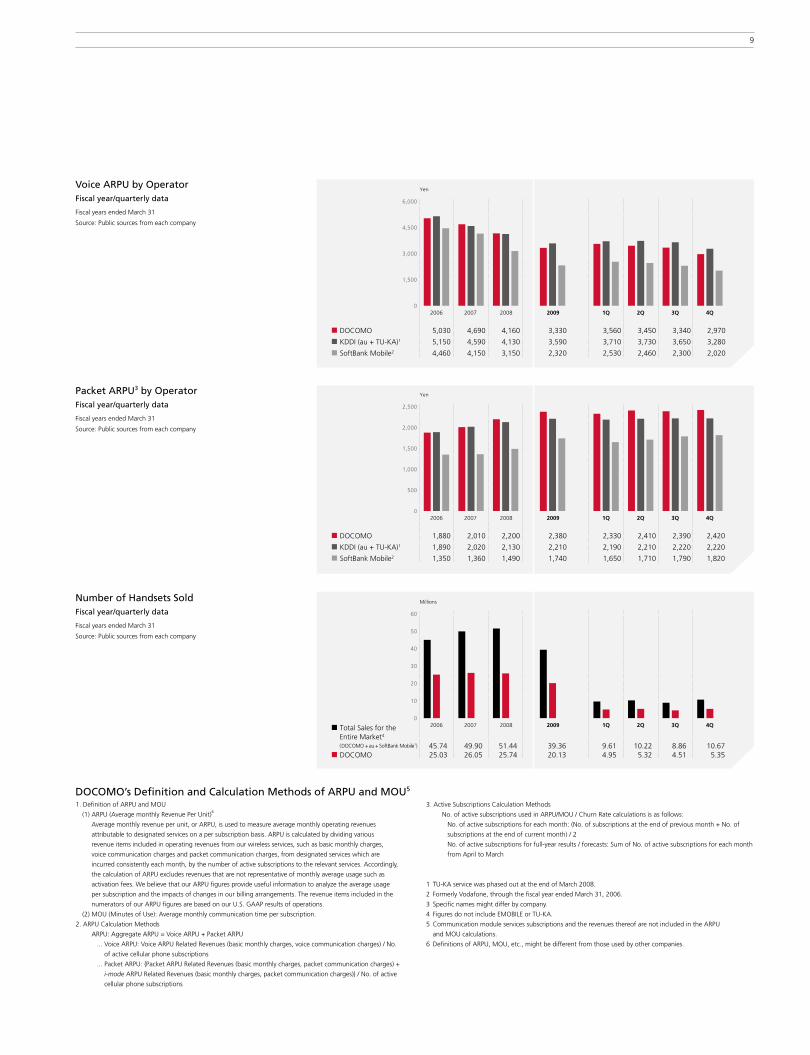
■ DOCOMO 5,030 4,690 4,160 3,330 3,560 3,450 3,340 2,970
■ KDDI (au + TU-KA)1 5,150 4,590 4,130 3,590 3,710 3,730 3,650 3,280
■ SoftBank Mobile2 4,460 4,150 3,150 2,320 2,530 2,460 2,300 2,020
2009200820072006
Voice ARPU by OperatorFiscal year/quarterly data
Fiscal years ended March 3�
Source: Public sources from each company
Packet ARPU3 by OperatorFiscal year/quarterly data
Fiscal years ended March 3�
Source: Public sources from each company
0
500
1,000
1,500
2,000
2,500
4Q3Q2Q1Q
Yen
■ DOCOMO 1,880 2,010 2,200 2,380 2,330 2,410 2,390 2,420
■ KDDI (au + TU-KA)1 1,890 2,020 2,130 2,210 2,190 2,210 2,220 2,220
■ SoftBank Mobile2 1,350 1,360 1,490 1,740 1,650 1,710 1,790 1,820
2009200820072006
Number of Handsets SoldFiscal year/quarterly data
Fiscal years ended March 3�
Source: Public sources from each company
0
10
20
30
40
50
60
4Q3Q2Q1Q
Millions
■ Total Sales for theEntire Market4
(DOCOMO +au+ SoftBank Mobile1) 45.74 49.90 51.44 39.36 9.61 10.22 8.86 10.67■ DOCOMO 25.03 26.05 25.74 20.13 4.95 5.32 4.51 5.35
2009200820072006
�. Definition of ARPU and MOU
(�) ARPU (Average monthly Revenue Per Unit)6
Average monthly revenue per unit, or ARPU, is used to measure average monthly operating revenues
attributable to designated services on a per subscription basis. ARPU is calculated by dividing various
revenue items included in operating revenues from our wireless services, such as basic monthly charges,
voice communication charges and packet communication charges, from designated services which are
incurred consistently each month, by the number of active subscriptions to the relevant services. Accordingly,
the calculation of ARPU excludes revenues that are not representative of monthly average usage such as
activation fees. We believe that our ARPU figures provide useful information to analyze the average usage
per subscription and the impacts of changes in our billing arrangements. The revenue items included in the
numerators of our ARPU figures are based on our U.S. GAAP results of operations.
(�) MOU (Minutes of Use): Average monthly communication time per subscription.
�. ARPU Calculation Methods
ARPU: Aggregate ARPU = Voice ARPU + Packet ARPU
... Voice ARPU: Voice ARPU Related Revenues (basic monthly charges, voice communication charges) / No.
of active cellular phone subscriptions
... Packet ARPU: {Packet ARPU Related Revenues (basic monthly charges, packet communication charges) +
i-mode ARPU Related Revenues (basic monthly charges, packet communication charges)} / No. of active
cellular phone subscriptions
3. Active Subscriptions Calculation Methods
No. of active subscriptions used in ARPU/MOU / Churn Rate calculations is as follows:
No. of active subscriptions for each month: (No. of subscriptions at the end of previous month + No. of
subscriptions at the end of current month) / �
No. of active subscriptions for full-year results / forecasts: Sum of No. of active subscriptions for each month
from April to March
� TU-KA service was phased out at the end of March �008.
� Formerly Vodafone, through the fiscal year ended March 3�, �006.
3 Specific names might differ by company.
4 Figures do not include EMOBILE or TU-KA.
5 Communication module services subscriptions and the revenues thereof are not included in the ARPU
and MOU calculations.
6 Definitions of ARPU, MOU, etc., might be different from those used by other companies.
DOCOMO’s Definition and Calculation Methods of ARPU and MOU5

�0 OPENING DOORS : TO OUR SHAREHOLDERS
To Our Shareholders
President and Chief Executive Officer
Ryuji Yamada
Since we announced the New DOCOMO Commitments in April 2008,
we have reviewed all of our business activities from the customer‘s
perspective, and have received a strong response to these efforts.
Moving forward, we will focus on improving the satisfaction of our
55 million customers and on creating new value in growth fields by
executing the “Change and Challenge” action plan. In these ways,
we will strive to realize our medium-term vision.
DOCOMO – FOCUSED ON IMPROVING THE SATISFACTION OF OUR 55 MILLION CUSTOMERS
��
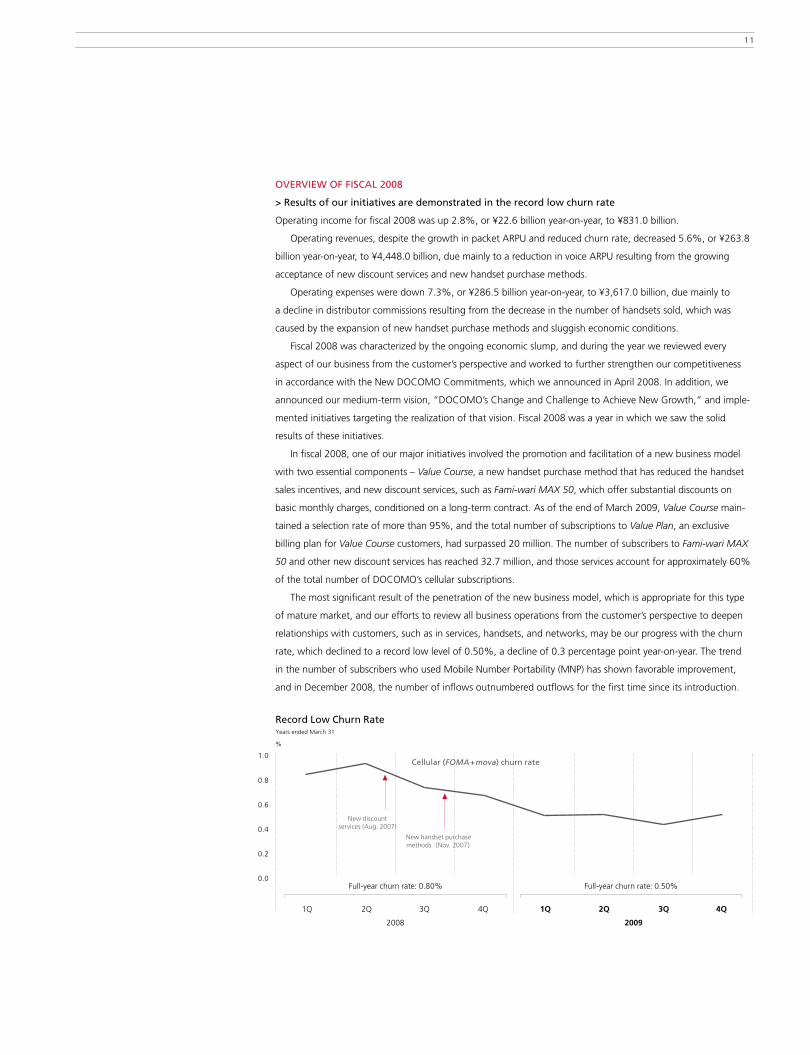
OVERVIEW OF FISCAL 2008
> Results of our initiatives are demonstrated in the record low churn rate
Operating income for fiscal �008 was up �.8%, or ¥��.6 billion year-on-year, to ¥83�.0 billion.
Operating revenues, despite the growth in packet ARPU and reduced churn rate, decreased 5.6%, or ¥�63.8
billion year-on-year, to ¥4,448.0 billion, due mainly to a reduction in voice ARPU resulting from the growing
acceptance of new discount services and new handset purchase methods.
Operating expenses were down 7.3%, or ¥�86.5 billion year-on-year, to ¥3,6�7.0 billion, due mainly to
a decline in distributor commissions resulting from the decrease in the number of handsets sold, which was
caused by the expansion of new handset purchase methods and sluggish economic conditions.
Fiscal �008 was characterized by the ongoing economic slump, and during the year we reviewed every
aspect of our business from the customer’s perspective and worked to further strengthen our competitiveness
in accordance with the New DOCOMO Commitments, which we announced in April �008. In addition, we
announced our medium-term vision, “DOCOMO’s Change and Challenge to Achieve New Growth,” and imple-
mented initiatives targeting the realization of that vision. Fiscal �008 was a year in which we saw the solid
results of these initiatives.
In fiscal �008, one of our major initiatives involved the promotion and facilitation of a new business model
with two essential components – Value Course, a new handset purchase method that has reduced the handset
sales incentives, and new discount services, such as Fami-wari MAX 50, which offer substantial discounts on
basic monthly charges, conditioned on a long-term contract. As of the end of March �009, Value Course main-
tained a selection rate of more than 95%, and the total number of subscriptions to Value Plan, an exclusive
billing plan for Value Course customers, had surpassed �0 million. The number of subscribers to Fami-wari MAX
50 and other new discount services has reached 3�.7 million, and those services account for approximately 60%
of the total number of DOCOMO’s cellular subscriptions.
The most significant result of the penetration of the new business model, which is appropriate for this type
of mature market, and our efforts to review all business operations from the customer’s perspective to deepen
relationships with customers, such as in services, handsets, and networks, may be our progress with the churn
rate, which declined to a record low level of 0.50%, a decline of 0.3 percentage point year-on-year. The trend
in the number of subscribers who used Mobile Number Portability (MNP) has shown favorable improvement,
and in December �008, the number of inflows outnumbered outflows for the first time since its introduction.
President and Chief Executive Officer
Ryuji Yamada
0.0
0.2
0.4
0.6
0.8
1.0
4Q3Q2Q1Q4Q3Q2Q1Q
2008 2009
Record Low Churn Rate
%
New discountservices (Aug. 2007)
New handset purchasemethods(Nov. 2007)
Cellular (FOMA+mova) churn rate
Full-year churn rate: 0.80% Full-year churn rate: 0.50%
Years ended March 31
�� OPENING DOORS : TO OUR SHAREHOLDERS
MEDIUM-TERM VISION
> Our direction toward sustained growth in profits
In October �008, we announced our medium-term vision, “DOCOMO’s Change and Challenge to Achieve New
Growth”, which includes a target for operating income of more than ¥900.0 billion in fiscal �0��. First, I will
describe the background to its formulation.
The increase in operating income in fiscal �008 resulted from a decline in handset sales-related costs – such as
handset procurement costs and distributor commissions – accompanying the expansion of the new handset pur-
chase methods. This decline in expenses exceeded the decline in operating revenues that resulted from a decline in
voice ARPU and other factors, and the net effect was to boost operating income. As the new handset purchase
methods penetrate, the impact of the reduction in basic monthly charges is expected to expand. Therefore, this
positive effect on income will gradually weaken as the uptake of the new handset purchase methods increases, and
if we do not take action, the underlying trend will be toward lower profits. In other words, for DOCOMO to main-
tain sustainable growth in profits, we need to generate gains that exceed the declines stemming from our new ini-
tiatives. This strong awareness drove the formulation of the medium-term vision.
As Japan’s mobile phone market is mature, quantitative growth, such as significant growth in the total number
of subscriptions, is reaching its limit. On the other hand, I believe that there is still room for substantial qualitative
growth. This growth will be driven by technical innovation in handsets and networks as well as by the entry of new
global players accompanying the penetration of models with open platforms, which will produce new services that
transcend conventional boundaries and thereby propel further advancements and diversification in the market.
Against this background, we will drive innovation in collaboration with a wide range of players, taking on the chal-
lenge of creating new value by leveraging the distinctive potential of mobile phones. In this way, we will seize busi-
ness opportunities and generate growth in profits. Our medium-term vision incorporates this approach.
ROAD MAP TO REALIZATION OF THE MEDIUM-TERM VISION
> Achieving growth in operating revenues by strengthening core businesses and developing
new business fields
To realize the medium-term vision, we must increase the level of customer satisfaction with thorough marketing
from the customer’s perspective. Through these initiatives, we aim to earn the No.� ranking in customer satisfac-
tion by fiscal �0�0. And after that, these initiatives will remain an ongoing part of our operations. We are strongly
committed to this program.
Next, I will explain the road map that we will follow to achieve the target of operating income of more than
¥900.0 billion. Achieving this objective will not be easy. However, we believe that there is still the potential for prof-
it growth in the evolution of mobile phone services. The keys to unlocking that potential are the unique properties
of mobile phones, such as real-time immediacy, personal authentication, and locating capabilities. We will leverage
these properties to develop services that are more advanced and more convenient, and thereby build a new reve-
nue and profit foundation.
The first strategy is to increase the use of packet communications by enhancing video services and promoting
packet flat-rate services. In recent years, due to such factors as the new business model and lower minutes of use
(MOU), voice ARPU has continued to decline, and under this influence, the aggregate ARPU has trended downward.
DOCOMO will aim to stop and then reverse this trend by increasing the use of packet communications by lever-
aging the unique properties of mobile phones. In the fiscal year ending March 3�, �0��, we would like to reverse
the trend in packet ARPU and voice ARPU, and to subsequently record gains in aggregate ARPU.
Also, DOCOMO will devote resources to opening up and building a new revenue and profit foundation in
fields that transcend the borders of our existing businesses. Specifically, we will proceed with initiatives in three
directions: Personalization, Social support, and Converged services. In personalization services, we will deliver

�3
personalized services and functions that cater to varying values and lifestyles of individual customers. In social sup-
port services, we will create new value in various fields, such as environment, ecology, safety, security, and health
management, targeting the sustainable growth of society. And in converged services, we will work to offer servic-
es that are more advanced and more convenient through links with various fields, such as lifestyle tools, fixed-line
communications, and broadcast networks. We are aiming to generate revenues of about ¥�00.0 billion in each
field by the fiscal year ending March 3�, �0�3.
DOCOMO is also working to expand its international business revenues. We will strive to expand international
roaming revenues and to develop international solutions for corporate customers. At the same time, we will build
an operational base through our investment and alliance strategy, centered on countries with rapidly growing
mobile phone markets. In the fiscal year ending March 3�, �0�0, we are aiming to expand revenues to ¥�00.0
billion, including international service revenues as well as dividends and consolidated revenues.
The enterprise and credit businesses are also fields in which we have substantial room for growth. In the enter-
prise business, we will bolster marketing by customer segment and industry and will aim to expand the number
of contracts. At the same time, we will work to expand SI/product revenues by strengthening the provision of
solutions and to expand new businesses. In the fiscal year ending March 3�, �0�0, we will work to achieve 7 mil-
lion subscriptions, an increase of 400 thousand from the previous year. In the credit business, which is positioned
as a future source of revenues in non-traffic fields, we will bolster sales through DOCOMO shops to acquire more
members in our DCMX credit business. We will also work to promote usage by expanding other shops where
DCMX can be used and by enhancing promotions.
> Advances in the network and handsets
DOCOMO will also continue working to enhance its network, which is the foundation for responding to increas-
ing packet communication usage arising from the enhancement of services. We introduced HSUPA� in June �009,
and will construct a high-speed, low-latency, large-capacity network through the introduction of LTE� in �0�0.
We will draw on our experience in the introduction of W-CDMA, the third-generation mobile communication
system, and, as one of the first LTE adopters in the world, we will work to introduce LTE.
Improvement of customer satisfaction
Expansion /enhancement of after-sales service
More affordable and easier-to-use billing plans
Area quality improvement
Creation of newrevenue sources
Expansion of international business
Bolstered initiatives in the corporate market
Promotion of credit business
Expansion/enhancement and enrichment of servicesPersonalization
Health care, environment,ecology businesses, etc.Social support
Home area services, etc.Converged services
Initiatives to expand usagePromotion of subscriptions to flat-rate services
through enrichment of video content, etc.
Change
Challenge
Networkevolution
Handsetevolution
Costefficiency
DOCOMO’S CHANGE AND CHALLENGE
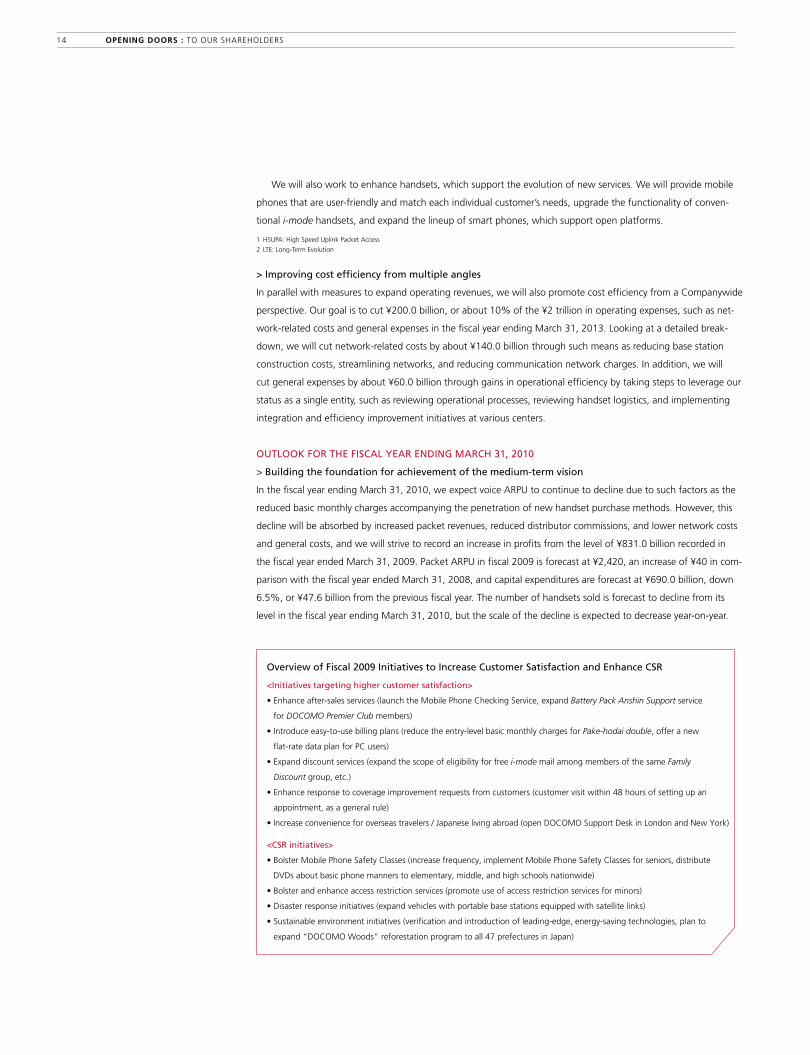
<Initiatives targeting higher customer satisfaction>
• Enhance after-sales services (launch the Mobile Phone Checking Service, expand Battery Pack Anshin Support service
for DOCOMO Premier Club members)
• Introduce easy-to-use billing plans (reduce the entry-level basic monthly charges for Pake-hodai double, offer a new
flat-rate data plan for PC users)
• Expand discount services (expand the scope of eligibility for free i-mode mail among members of the same Family
Discount group, etc.)
• Enhance response to coverage improvement requests from customers (customer visit within 48 hours of setting up an
appointment, as a general rule)
• Increase convenience for overseas travelers / Japanese living abroad (open DOCOMO Support Desk in London and New York)
<CSR initiatives>
• Bolster Mobile Phone Safety Classes (increase frequency, implement Mobile Phone Safety Classes for seniors, distribute
DVDs about basic phone manners to elementary, middle, and high schools nationwide)
• Bolster and enhance access restriction services (promote use of access restriction services for minors)
• Disaster response initiatives (expand vehicles with portable base stations equipped with satellite links)
• Sustainable environment initiatives (verification and introduction of leading-edge, energy-saving technologies, plan to
expand “DOCOMO Woods” reforestation program to all 47 prefectures in Japan)
Overview of Fiscal 2009 Initiatives to Increase Customer Satisfaction and Enhance CSR
�4 OPENING DOORS : TO OUR SHAREHOLDERS
We will also work to enhance handsets, which support the evolution of new services. We will provide mobile
phones that are user-friendly and match each individual customer’s needs, upgrade the functionality of conven-
tional i-mode handsets, and expand the lineup of smart phones, which support open platforms.
� HSUPA: High Speed Uplink Packet Access
� LTE: Long-Term Evolution
> Improving cost efficiency from multiple angles
In parallel with measures to expand operating revenues, we will also promote cost efficiency from a Companywide
perspective. Our goal is to cut ¥�00.0 billion, or about �0% of the ¥� trillion in operating expenses, such as net-
work-related costs and general expenses in the fiscal year ending March 3�, �0�3. Looking at a detailed break-
down, we will cut network-related costs by about ¥�40.0 billion through such means as reducing base station
construction costs, streamlining networks, and reducing communication network charges. In addition, we will
cut general expenses by about ¥60.0 billion through gains in operational efficiency by taking steps to leverage our
status as a single entity, such as reviewing operational processes, reviewing handset logistics, and implementing
integration and efficiency improvement initiatives at various centers.
OUTLOOK FOR THE FISCAL YEAR ENDING MARCH 31, 2010
> Building the foundation for achievement of the medium-term vision
In the fiscal year ending March 3�, �0�0, we expect voice ARPU to continue to decline due to such factors as the
reduced basic monthly charges accompanying the penetration of new handset purchase methods. However, this
decline will be absorbed by increased packet revenues, reduced distributor commissions, and lower network costs
and general costs, and we will strive to record an increase in profits from the level of ¥83�.0 billion recorded in
the fiscal year ended March 3�, �009. Packet ARPU in fiscal �009 is forecast at ¥�,4�0, an increase of ¥40 in com-
parison with the fiscal year ended March 3�, �008, and capital expenditures are forecast at ¥690.0 billion, down
6.5%, or ¥47.6 billion from the previous fiscal year. The number of handsets sold is forecast to decline from its
level in the fiscal year ending March 3�, �0�0, but the scale of the decline is expected to decrease year-on-year.

�5
Operating income is expected to be about the same level year-on-year, but in the fiscal year ending March 3�,
�0�� and thereafter, when the initiatives implemented in fiscal �008 and �009 take effect, we will work to increase
profit. To that end, we will continue to review our business activities from the customer’s perspective and further
bolster efforts to raise customer satisfaction. At the same time, we will approach this year as a period for building
the foundation for achievement of our medium-term vision.
We will steadily implement these initiatives, striving to ensure that all of our customers are satisfied with their
selection of DOCOMO. In April �009, we announced “initiatives to raise customer satisfaction and CSR measures”
and spelled out our initiatives for fiscal �009. We plan to spend approximately ¥40.0 billion on those initiatives,
and we consider this to be an important investment for driving growth in enterprise value in the years ahead.
Major initiatives are as outlined on the left.
SHAREHOLDER RETURN
> Planning to increase dividends by ¥400 per share in fiscal 2009
Believing that providing adequate returns to shareholders is one of the most important issues in corporate manage-
ment, DOCOMO plans to continue to pay stable dividends by taking into account its consolidated results and
consolidated dividend payout ratio while striving to strengthen its financial position and secure internal reserves.
In addition, we will maintain a flexible approach to share repurchases.
For the fiscal year ended March 3�, �009, we paid an interim dividend of ¥�,400 per share and a year-end
dividend of ¥�,400 per share, for a total annual dividend of ¥4,800 per share.
Due to the influence of the worsening of the global economy, the stock market is unstable, and in this setting,
there are calls for a direct return in the form of increased dividends. Accordingly, for the fiscal year ending March 3�,
�0�0, in consideration of our expectation of profits on a par with the fiscal year ended March 3�, �009 and of share-
holder feedback, we plan to raise dividends by ¥400 per share, to ¥5,�00 per share. The forecast is for a dividend
payout ratio of 44%, and we will work to maintain a dividend payout ratio in the top level in Japan in the future.
TARGETING REALIZATION OF THE MEDIUM-TERM VISION
> Thoroughly implementing on-site orientation and executing the “Change and Challenge” action plan
The initiatives implemented by DOCOMO have begun to produce tangible results. Those results stem from the sup-
port we have earned from our 55 million customers. We are grateful for the support of our customers, and through
the provision of services that are more convenient and can be used safely and securely, we will endeavor to further
increase customer satisfaction. At the same time, we will steadily implement initiatives targeting the realization of
our medium-term vision. Also, directly addressing our corporate social responsibilities, such as the realization of a
safe, secure mobile society, disaster countermeasures, and environmental conservation, we believe that working to
resolve issues as a mobile phone operator is a part of our corporate responsibility, and accordingly we will implement
a wide range of initiatives.
While thoroughly implementing an on-site orientation, DOCOMO will continue to execute the “Change and
Challenge” action plan in order to meet customer expectations. In this way, DOCOMO aims to contribute to society’s
sustainable development and a safer, more secure environment for people to lead enriched, convenient lives.
President and Chief Executive Officer
Ryuji Yamada
Dividends per share (left)
Dividend payout ratio (right)
0
1,000
2,000
3,000
4,000
5,000
20092008200720062005
Dividends per Share* and Dividend Payout Ratio
Yen %
Years ended March 31
* Dividends in the fiscal year to which each record date for the dividends belongs.
0
10.0
20.0
30.0
40.0
50.0

Financial and Capital Strategy
BASIC POLICY
The mobile phone penetration rate in Japan has surpassed 80%, and due to such factors as faster transmission
rates and enhanced content, data transmissions demand continues to grow in the mobile communications indus-
try. In this setting, the key to continually maintaining a competitive advantage is the construction of a highly reli-
able mobile communications network. In much the same way, the development of next-generation network
technologies and the development of highly convenient, appealing products and services are extremely important
in raising customer satisfaction and building long-term relationships with customers. Accordingly, we are working
to sustain and bolster our long-term competitiveness by reinvesting the funds that are steadily generated by the
mobile phone business into mobile phone network facilities.
In the use of funds after reinvestment, we have given the highest priority to investment in growth opportuni-
ties, such as in peripheral businesses from which synergies with the mobile phone business can be expected as
well as international services. Our basic policy is to pursue the optimal balance between providing a return to
shareholders and maintaining a strong financial position, while monitoring changes in the operating environment
and capital markets.
FINANCING POLICIES AND INITIATIVES TO STRENGTHEN FINANCIAL POSITION
DOCOMO determines the need for financing after a comprehensive examination of fund demand timing, the
level of cash and cash equivalents, working capital, and operating cash flow. On that basis, in the event that it is
difficult to meet funding needs, we will consider financing through borrowing or the issuance of stocks or bonds.
To ensure flexibility for future fund-raising, we are working to strengthen our financial position. We are
continuing to reduce total debt, while considering the balance between the reduction of total debt and the
reduction in shareholders’ equity stemming from the provision of returns to shareholders, as well as the level of
cash flow. In the fiscal year ended March 3�, �009, due in part to the introduction of the installment sales meth-
od and the investment in Tata Teleservices Limited, of India, the balance of consolidated debt increased year-on-
year, but over the five-year period from the fiscal year ended March 3�, �005, consolidated debt decreased from
¥948.5 billion to ¥639.� billion, and the debt ratio declined from �9.5% to ��.8%. In this way, we are steadily
bolstering our financial position.
Our long-term debt ratings are AA by Standard & Poor’s and Aa� by Moody’s. Accordingly, among telecom-
munications companies around the world, we continue to maintain high credit ratings.
SHAREHOLDER RETURN POLICY
We recognize that providing returns to our shareholders is one of management’s highest priorities. In determining
the level of shareholder return, we take into account the level of cash flows, the consolidated results, and the
consolidated dividend payout ratio as well as the need to strengthen our financial position and maintain adequate
internal reserves. We intend to provide shareholder return by continuing to flexibly repurchase our shares and to
pay dividends in accordance with the principle of stable dividend payments.
The Company paid a total annual dividend of ¥4,800 per share for the fiscal year ended March 3�, �009,
comprising an interim dividend of ¥�,400 per share and a year-end dividend of ¥�,400 per share. In fiscal �008,
we repurchased ¥�35.0 billion worth of shares (856,405 shares) based on a resolution of the Ordinary General
Meeting of Shareholders. For fiscal �009, after comprehensive consideration, including the concern that there
could be a dramatic decline in the number of shares circulating in the market, with authority delegated by the
Ordinary General Meeting of Shareholders, we have changed the scale of acquisitions, and we will make acquisi-
tions flexibly in accordance with resolutions of the Board of Directors. The Company intends to hold the repur-
chased shares as treasury stock and, in principle, to limit the amount of such treasury stock to approximately 5%
of total issued shares. Holdings in excess of this level will be retired at the end of the fiscal year. In fiscal �008,
the Company retired 0.9� million shares at the end of the fiscal year (about �.�% of the total shares issued prior
to the retirement).
�6 OPENING DOORS : FINANCIAL AND CAPITAL STRATEGY
Debt (left)
Debt ratio (right)
0
200
400
600
800
1,000
20092008200720062005
Debt and Debt Ratio
Billions of yen %
Years ended March 31
* Excluding irregular factors and changes in investments for cash management purposes.
0
200
400
600
800
1,000
1,200
20092008200720062005
Adjusted Free Cash Flows*
Billions of yen
Years ended March 31
0
5.0
10.0
15.0
20.0
25.0
opening doorsIncreasing Customer Satisfaction and Realizing Our Medium-Term Vision
DOCOMO is strengthening its relationships with customers and
implementing “change” to further enhance its ability to meet
customers’ expectations. In taking on the “challenge” of innovation
in mobile communications, we are not focused on the pursuit
of leading-edge technologies. Rather, the starting point of
our “challenge” activities is feedback from our customers.
“Pursuing higher levels of satisfaction for 55 million customers.”
With this strong determination, we will do our utmost to execute
the “Change and Challenge” action plan, targeting the realization
of our medium-term vision.
�7

Increasing Customer Satisfaction and Realizing Our Medium-Term Vision
�8 OPENING DOORS : INCREASING CUSTOMER SATISFACTION AND REALIZING OUR MEDIUM-TERM VISION

In accordance with the New DOCOMO Commitments, DOCOMO has re-
viewed every aspect of its business from the customer’s perspective. While
strengthening relationships with customers and fostering innovation by tak-
ing advantage of the unique characteristics of mobile communications, we
will continue to take on the challenge of creating new value.
The direction of these future initiatives is clarified in the medium-term
vision, “DOCOMO’s Change and Challenge to Achieve New Growth,” which
was announced in October �008. Under this medium-term vision, our goal
is to achieve over ¥900.0 billion in operating income in fiscal �0��. We will
work together to further increase customer satisfaction, focusing on our
goal of achieving the No.� ranking in customer satisfaction by fiscal �0�0.
In this special feature, we will explain the direction of the initiatives that
DOCOMO will implement to realize its medium-term vision.
Targeting Further Increases in Customer Satisfaction
PURSUIT OF “DEPTH” AND “LENGTH” IN CUSTOMER RELATIONSHIPS
Since the announcement of the New DOCOMO Commitments in April �008,
we have been implementing marketing activities with the objective of bol-
stering brand loyalty. These activities are focused on the “depth” (degree of
trust and satisfaction) and “length” (number of years of subscription) of the
relationships with our 55 million customers. Targeting the realization of the
medium-term vision, we will further bolster group-wide efforts and work to
strengthen relationships with customers.
First, we will take steps to enhance after-sales service for the purpose
of enabling worry-free use of mobile phones for long periods of time.
In July �009, we introduced the Mobile Phone Checking Service, where
specialists at DOCOMO shops throughout the country check the condition
of customers’ mobile phones, offer advice, and perform simple repairs.
In addition, we also enhanced the Battery Pack Anshin Support service,
which is a preferential service provided to customers who use the same
handset for a long period of time.
Moving forward, we will also continually revise billing plans to make
them easier to use. From May �009, we reduced the basic monthly charge
(entry level) for Pake-hodai double, an i-mode packet flat-rate service, and
in July �009 we introduced Flat-Rate Data Plan Standard, a service for use
with data cards.
We are also reinforcing our efforts to improve area coverage quality.
For example, we are promoting awareness of our policy for requests con-
cerning area coverage improvement. As a general rule, within 48 hours
after we respond to a request from a customer, we will visit the customer
and conduct an on-site indoor coverage survey, such as in their home.
In the future, we will continue taking steps to improve indoor area coverage
for more customers, including utilizing FOMA repeaters compatible with
FOMA Plus area.
Moreover, we are also working to increase convenience for customers
traveling or residing overseas. In May �009, we opened a DOCOMO Support
Desk for customers in London, and in September we plan to open one in
New York. In addition, we are working to achieve improved customer satis-
faction from a variety of angles. From May �009, DOCOMO has extended
the free i-mode mail that is available to the members of the same family
discount group. As a result, the free service now includes video files and
other large attachments, which were previously excluded.
In April �009, we announced new customer satisfaction and CSR initia-
tives and clarified our action plan for fiscal �009. Moving forward, we will
continue to steadily review every aspect of our business activities from the
customer’s perspective, targeting the No.� ranking in customer satisfaction
by fiscal �0�0.
Japan’s maturing mobile phone market has more than 100 million subscriptions. However, DOCOMO
believes that the market has unlimited potential stemming from the unique properties of mobile phones
– such as real-time immediacy, personal authentication, and locating capabilities – and from cooperation
with new global players from multiple industries through the adoption of open-platform handsets.
DOCOMO believes that new business opportunities will arise, one after another.
�9

Initiatives to Increase Packet Communications Usage
AIMING TO REVERSE THE DECLINE IN AGGREGATE ARPU THROUGH CONTINUED INCREASES
IN PACKET ARPU
In recent years, voice ARPU has been declining due to such factors as growth in the number of subscriptions to
discount services and shorter phone calls. In this setting, aggregate ARPU has followed a sustained downward
trend. In order to realize our objective of operating income of more than ¥900.0 million in fiscal �0��, as spelled
out in the medium-term vision, it is extremely important that we stop this trend. Accordingly, we will take steps
to achieve continued increases in packet ARPU, or data communications revenues. In fiscal �0��, DOCOMO will
aim to stop the decline in aggregate ARPU by offsetting the influence of the trend in voice ARPU, which is ex-
pected to continue to decline. Subsequently, we will aim to return aggregate ARPU to an increasing trend. To
that end, we are promoting subscriptions to and usage of our packet flat-rate services. In fiscal �009, we will aim
to increase the number of i-mode packet flat-rate subscriptions to ��.4 million, equivalent to about 47% of the
total number of FOMA i-mode subscriptions. This will be an increase from the fiscal �008 level of �7.6� million
subscriptions, or about 39% of FOMA i-mode subscriptions.
> Reviewing billing plans to promote expanded usage
One of DOCOMO’s initiatives to expand usage of packet communications is the enhancement of easy-to-use,
worry-free billing plans. In October �008, we reevaluated the details of Pake-hodai, an i-mode packet flat-rate
service that allows unlimited use of packet communications for a flat monthly rate, and introduced Pake-hodai
double, an i-mode packet flat-rate service under which the monthly flat rate varies in accordance with each
month’s usage. In May �009, with the objective of promoting subscriptions to packet flat-rate services and use of
packet communications among a wider range of customers, the monthly charge (entry level) for this service was
reduced, from ¥�,0�9 (including tax) when the service was introduced to ¥490 (including tax). We also continue
to improve billing plans. For example, in July �009 we introduced the Flat-Rate Data Plan Standard for use with
data cards.
> Expanding service/content areas and enhancing handset functions
In addition to billing plans, another key to increasing the use of packet communications is the provision of en-
hanced services and content. Accordingly, DOCOMO is working to expand the scope of its lineup of services and
content. Video content is a good example. In the past, we have focused principally on entertainment. Moving
forward, we will take steps to expand subscriptions and usage among a broad range of customers by expanding
to areas closely linked to lifestyles, such as tourism, navigation and health care.
0
2,000
4,000
6,000
8,000
201320092008
Aiming to Reverse Aggregate ARPU by Increasing Packet ARPU
Yen
Aggregate ARPU (① +②)
① Voice ARPU
② Packet ARPU
Packet ARPU to overtakeVoice ARPU
0
2,000
4,000
6,000
8,000
2013200920080
2,000
4,000
6,000
8,000
201320092008
総合ARPU(① +②)
①音声 ARPU
②パケットARPU
音声ARPUとパケットARPUの逆転
Years ended March 31
Stop the decline in aggregate ARPU (Fiscal 2011 target)
総合ARPUの下げ止まり(2012年3月期目標)
(Forecast)
* Image is conceptual.
�0 OPENING DOORS : INCREASING CUSTOMER SATISFACTION AND REALIZING OUR MEDIUM-TERM VISION
Also, mobile phone usage is expanding rapidly against a background of higher-speed communications and
more-advanced handsets, but most of the videos that are available for viewing on mobile phones are the result
of lateral development from TV and movies. Accordingly, DOCOMO will move ahead with the development and
provision of content that reflects full consideration for the special characteristics of mobile phones – small
screens (about 3 inches) and mobility. We are also working on the distribution of content that meets customer
preferences. BeeTV, launched in May �009 through a tie-up with Avex Entertainment Inc., is one of those initia-
tives. In the future, through joint initiatives with a wide range of partners, such as broadcasters and content
holders, we will undertake content expansion and joint production initiatives.
We are also taking steps to develop and provide handset functions suitable for replaying videos and other
content, such as introducing Inline Flash®, which plays video on a sub-section of a screen.
> Increasing the number of subscriptions to packet flat-rate services is the key to increasing packet
communications revenues
In the period of pay-as-you-go systems, packet communications revenues were generally expected to increase
in tandem with the spread of the Internet. On the other hand, in the age of unlimited use, flat-rate services, an
expanded focus on subscriptions plays an indispensable role in increasing revenues. In addition to measures to
enhance billing plans and services and content, as discussed above, DOCOMO is working to promote increased
packet flat-rate service revenues. To that end, we are offering customers who do not actively access information
over the Internet enhanced mobile Internet access opportunities through the i-channel information service,
which distributes information useful in daily life.
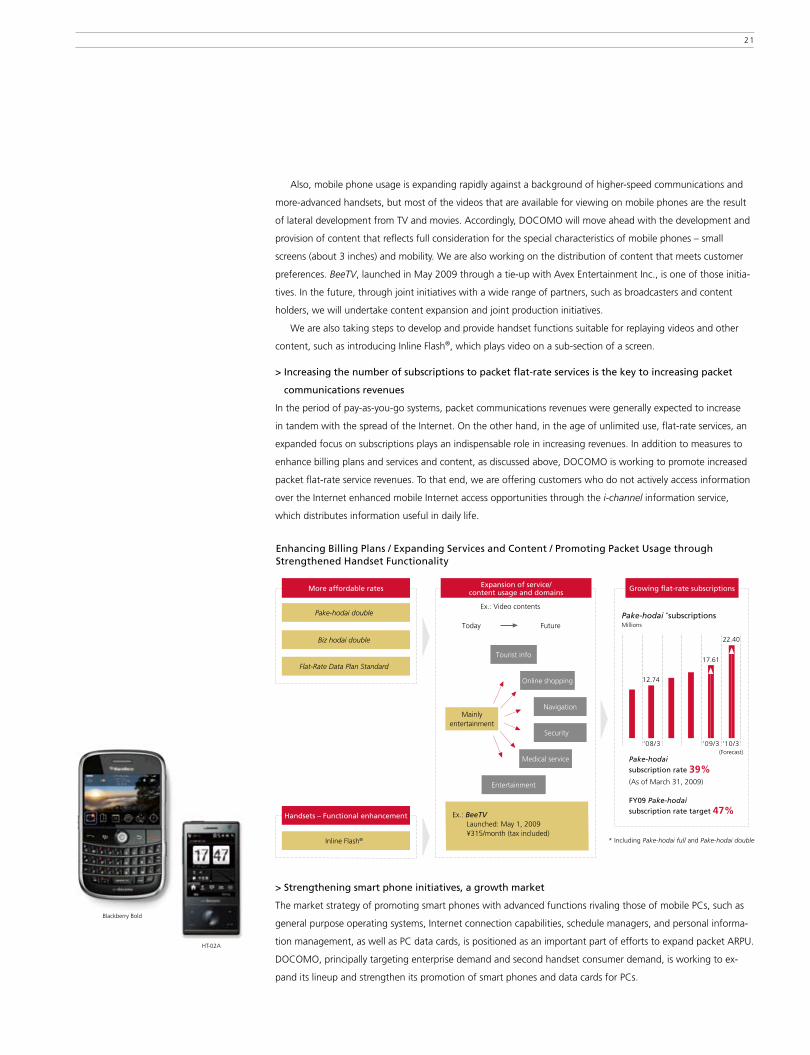
> Strengthening smart phone initiatives, a growth market
The market strategy of promoting smart phones with advanced functions rivaling those of mobile PCs, such as
general purpose operating systems, Internet connection capabilities, schedule managers, and personal informa-
tion management, as well as PC data cards, is positioned as an important part of efforts to expand packet ARPU.
DOCOMO, principally targeting enterprise demand and second handset consumer demand, is working to ex-
pand its lineup and strengthen its promotion of smart phones and data cards for PCs.
Enhancing Billing Plans / Expanding Services and Content / Promoting Packet Usage through Strengthened Handset Functionality
More affordable rates
Pake-hodai double
Biz hodai double
Flat-Rate Data Plan Standard
Expansion of service/content usage and domains
Tourist info
Online shopping
Navigation
Security
Medical service
Entertainment
Inline Flash®
Handsets – Functional enhancement
Growing flat-rate subscriptions
Ex.: BeeTV Launched: May 1, 2009 ¥315/month (tax included)
Ex.: Video contents
Pake-hodai
subscription rate 39%(As of March 31, 2009)
FY09 Pake-hodai
subscription rate target 47%
(Forecast)
Pake-hodai *subscriptionsMillions
* Including Pake-hodai full and Pake-hodai double
Today Future
Mainlyentertainment
’08/3
12.74
17.61
22.40
’09/3 ’10/3
Blackberry Bold
HT-0�A
��

Initiatives Targeting the Creation of New Sources of Revenues
NEW EVOLUTION IN SERVICES
The unique properties of mobile phones include real-time immediacy, where people are within 30 cm of their
mobile phones �4 hours a day; personal authentication, where the user can be identified; and locating capabili-
ties, where the user’s location can be determined through such technologies as GPS. Utilizing these properties,
DOCOMO will strive to provide behavior support tailored to the preferences and lifestyle of each individual user.
Method of communications, method of accessing information on the Internet, lifestyle infrastructure. And now
behavior support. In all of these mobile phone functions, which continue to grow, DOCOMO will lead new
progress in services through the use of the special properties of mobile phones and will create new sources of
revenues. Specifically, in the three fields of personalization, social support, and converged services, we will
work to facilitate service evolution, and are aiming to achieve revenues of about ¥�00.0 billion in each of these
fields by fiscal �0��.
> Personalization services
Against a background of a well-established, high-speed communications environment, more advanced handsets,
and enhanced content for mobile phones, accessing the Internet through a mobile phone has become a com-
mon activity. However, it can be very difficult for users to navigate among the vast amount of information avail-
able and to find the information that they need.
To enable customers to make full use of the mobile Internet by accessing information that meets their individ-
ual needs, we will offer information distribution services tailored to each person’s interests, values and lifestyle.
This is the personalization of services. The i-concier service, which was introduced in November �008, is the
realization of this idea. With this service, the mobile phone acts likes a butler or concierge, supporting daily
activities by automatically providing information that is tailored to the location and interests of each customer.
The number of subscriptions to this service has recorded favorable growth, with cumulative subscriptions surpass-
ing one million in just six months after the launch of the service. In the future, we will take steps to further
enhance personalization of this service and to step up its growth, such as enhancing services linked to location
information and focusing on the provision of community information.
Direction of Service Evolution
Time / evolution
Roles of mobile phones
Continual evolution of mobile phones and networks
Advancement of communication
Advancement of IT
Transformation into lifestyle infrastructure
Personalizationof services
Communication
Information access
Life assistance
Behavior assistance
• Telephone
• Search engine
• Filtering
• One-Seg
• Comic
• International dialing
• Push-to-talk
• Deco-mail
• Video
• Gaming
• Music
• Locating
• Security
• Auction
• Osaifu-keitai e-wallet
• i-concier
• 2in1• Videophone
• Internet access
DO
CO
MO
’S C
HA
LLEN
GE
�� OPENING DOORS : INCREASING CUSTOMER SATISFACTION AND REALIZING OUR MEDIUM-TERM VISION
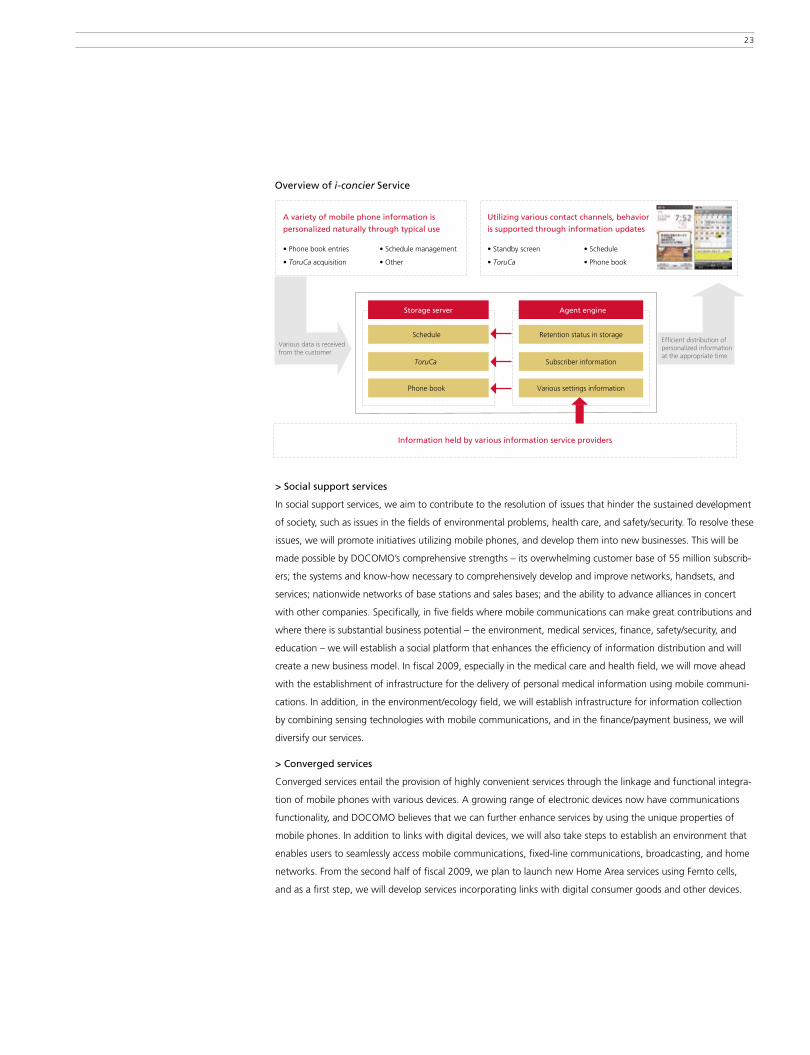
Overview of i-concier Service
A variety of mobile phone information is
personalized naturally through typical use
• Phone book entries • Schedule management
• ToruCa acquisition • Other
Utilizing various contact channels, behavior
is supported through information updates
• Standby screen • Schedule
• ToruCa • Phone book
Information held by various information service providers
Storage server
Schedule
ToruCa
Phone book
Agent engine
Subscriber information
Various settings information
Retention status in storageVarious data is received from the customer
Efficient distribution of personalized information at the appropriate time
> Social support services
In social support services, we aim to contribute to the resolution of issues that hinder the sustained development
of society, such as issues in the fields of environmental problems, health care, and safety/security. To resolve these
issues, we will promote initiatives utilizing mobile phones, and develop them into new businesses. This will be
made possible by DOCOMO’s comprehensive strengths – its overwhelming customer base of 55 million subscrib-
ers; the systems and know-how necessary to comprehensively develop and improve networks, handsets, and
services; nationwide networks of base stations and sales bases; and the ability to advance alliances in concert
with other companies. Specifically, in five fields where mobile communications can make great contributions and
where there is substantial business potential – the environment, medical services, finance, safety/security, and
education – we will establish a social platform that enhances the efficiency of information distribution and will
create a new business model. In fiscal �009, especially in the medical care and health field, we will move ahead
with the establishment of infrastructure for the delivery of personal medical information using mobile communi-
cations. In addition, in the environment/ecology field, we will establish infrastructure for information collection
by combining sensing technologies with mobile communications, and in the finance/payment business, we will
diversify our services.
> Converged services
Converged services entail the provision of highly convenient services through the linkage and functional integra-
tion of mobile phones with various devices. A growing range of electronic devices now have communications
functionality, and DOCOMO believes that we can further enhance services by using the unique properties of
mobile phones. In addition to links with digital devices, we will also take steps to establish an environment that
enables users to seamlessly access mobile communications, fixed-line communications, broadcasting, and home
networks. From the second half of fiscal �009, we plan to launch new Home Area services using Femto cells,
and as a first step, we will develop services incorporating links with digital consumer goods and other devices.
�3
UNCOVERING NEW GROWTH FIELDS
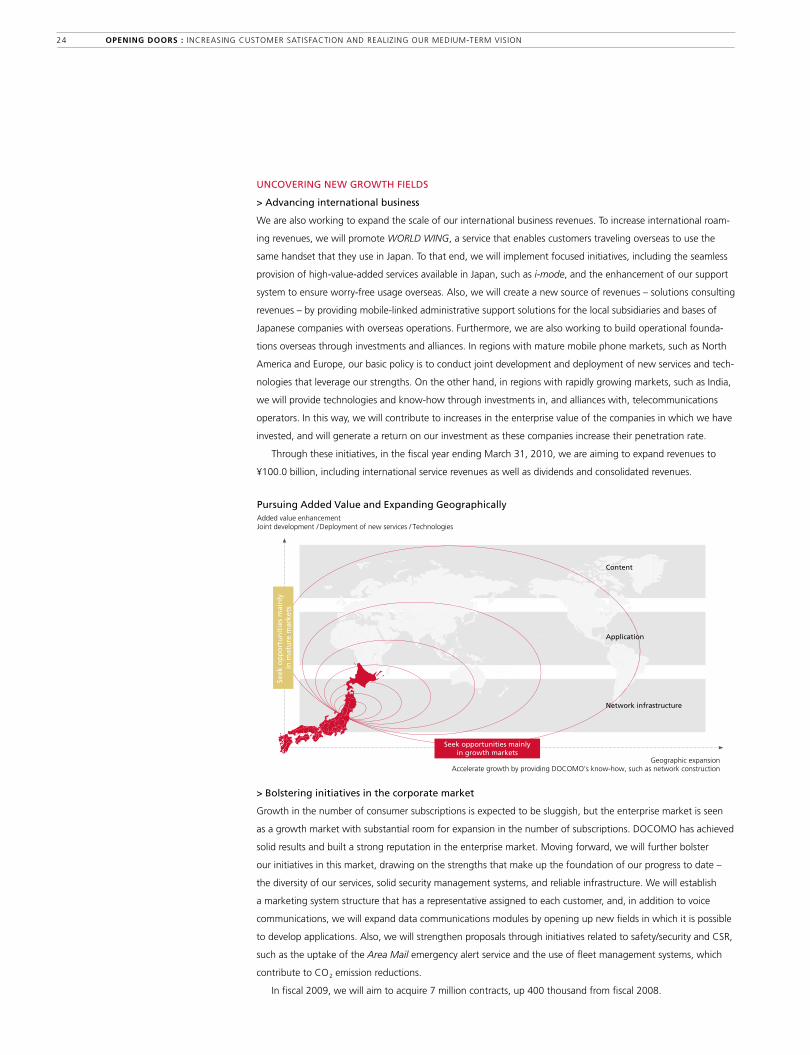
> Advancing international business
We are also working to expand the scale of our international business revenues. To increase international roam-
ing revenues, we will promote WORLD WING, a service that enables customers traveling overseas to use the
same handset that they use in Japan. To that end, we will implement focused initiatives, including the seamless
provision of high-value-added services available in Japan, such as i-mode, and the enhancement of our support
system to ensure worry-free usage overseas. Also, we will create a new source of revenues – solutions consulting
revenues – by providing mobile-linked administrative support solutions for the local subsidiaries and bases of
Japanese companies with overseas operations. Furthermore, we are also working to build operational founda-
tions overseas through investments and alliances. In regions with mature mobile phone markets, such as North
America and Europe, our basic policy is to conduct joint development and deployment of new services and tech-
nologies that leverage our strengths. On the other hand, in regions with rapidly growing markets, such as India,
we will provide technologies and know-how through investments in, and alliances with, telecommunications
operators. In this way, we will contribute to increases in the enterprise value of the companies in which we have
invested, and will generate a return on our investment as these companies increase their penetration rate.
Through these initiatives, in the fiscal year ending March 3�, �0�0, we are aiming to expand revenues to
¥�00.0 billion, including international service revenues as well as dividends and consolidated revenues.
> Bolstering initiatives in the corporate market
Growth in the number of consumer subscriptions is expected to be sluggish, but the enterprise market is seen
as a growth market with substantial room for expansion in the number of subscriptions. DOCOMO has achieved
solid results and built a strong reputation in the enterprise market. Moving forward, we will further bolster
our initiatives in this market, drawing on the strengths that make up the foundation of our progress to date –
the diversity of our services, solid security management systems, and reliable infrastructure. We will establish
a marketing system structure that has a representative assigned to each customer, and, in addition to voice
communications, we will expand data communications modules by opening up new fields in which it is possible
to develop applications. Also, we will strengthen proposals through initiatives related to safety/security and CSR,
such as the uptake of the Area Mail emergency alert service and the use of fleet management systems, which
contribute to CO� emission reductions.
In fiscal �009, we will aim to acquire 7 million contracts, up 400 thousand from fiscal �008.
Pursuing Added Value and Expanding GeographicallyAdded value enhancementJoint development / Deployment of new services / Technologies
Geographic expansionAccelerate growth by providing DOCOMO’s know-how, such as network construction
Network infrastructure
Application
Content
Seek opportunities mainlyin growth markets
Seek
op
po
rtu
nit
ies
mai
nly
in
mat
ure
mar
kets
�4 OPENING DOORS : INCREASING CUSTOMER SATISFACTION AND REALIZING OUR MEDIUM-TERM VISION

> Expansion of credit business
DOCOMO is working to diversify revenue sources by bolstering business development in non-traffic fields. For
DOCOMO, with its base of 55 million customers, the iD credit brand and the DCMX credit service have the po-
tential to be a source of future revenues in this area. DOCOMO’s credit brand, iD, and the iD-compatible credit
service, DCMX, are provided through the Osaifu-Keitai, which uses contactless IC cards installed in mobile
phones. By promoting the penetration of iD payment terminals, we will work to expand the number of stores at
which iD can be used and to promote increased usage. Specifically, we will work to acquire new DCMX mem-
bers at DOCOMO shops throughout the country, aiming for ��.8 million subscriptions by the end of fiscal �009,
an increase of �.8� million subscriptions from the end of fiscal �008. We will make efforts to expand the use of
the DCMX credit service by increasing the number of shops where “docomo points” can be obtained through
the use of DCMX and by conducting promotions on the DCMX DOCOMO Point Mall Internet site.
Supporting “Change and Challenge”
FOUNDATION OF PROGRESS IN SERVICES: MORE ADVANCED NETWORKS AND HANDSET EVOLUTION
> More advanced networks
Customer demands for stress-free access to video and other rich content are expected to rise as the enjoyment
of rich content on mobile phones becomes commonplace. Accordingly, we expect data communications traffic
to increase. To respond to these needs with stable communications quality, DOCOMO will construct a high-
speed, low-latency, large-capacity network.
In June �009, we introduced our HSUPA� service, which has a maximum uplink transmission rate of 5.7
Mbps. In �0�0, we will introduce an LTE service realizing a maximum downlink transmission rate of 300 Mbps
under 3GPP standard technical specifications. LTE is an advanced version of W-CDMA, the third-generation mo-
bile phone technology. With this service, we will construct a high-speed, low-latency, large-capacity network
that will facilitate advanced services.
� HSUPA: High Speed Uplink Packet Access
100 M
1 G
10 M
1 M
100 K
Network Evolution
Time
Transmission rates (bps)
~ 2007 2008 2009 2010 2011 2012 ~
W-CDMADL: 384K UL: 384K2
HSPADL: 7.2/14M UL: 5.7M2,3
4G
HSDPADL: 3.6/7.2M UL: 384K 2,3
1 LTE: Long-Term Evolution. Also known as “Super 3G,” as proposed by DOCOMO, or “3.9G.”
2 DL: Downlink, UL: Uplink
3 Transmission rates in the chart are the maximum transmission rates defined in the standard specifications.
Continual network evolution
HSUPA (HSPA): Introduced in June 2009
LTE: As one of the first adopters in the world, planning introduction in 2010
Years ended March 31
LTE1
DL: 300M UL: 75M2,3
�5

> Handset evolution
The adoption of open platforms for handsets is one way DOCOMO is supporting handset evolution. The objective
of these initiatives is to continually strengthen DOCOMO’s handset competitiveness and to reduce handset procure-
ment costs through reductions in their development costs and through the mutual market entry of manufacturers in
Japan and overseas. Currently, in middleware, there is an ongoing separation into global applications (standard appli-
cation sets that can be used around the world), and Operator Packs, which comprise DOCOMO-specific services.
We are proceeding with development, with a goal of installing Operator Packs on handsets introduced in the second
half of the fiscal year ended March 3�, �0�0. In addition to middleware, DOCOMO is also supporting progress in op-
erating systems. By promoting the adoption of globally standardized, open platforms, such as Android, Symbian, and
Windows Mobile, we will work to achieve service diversification and the overseas adoption of DOCOMO’s services.
Physical handset constraints, such as size and thickness, will become a bottleneck in efforts to advance services.
DOCOMO will strive to resolve this challenge by placing a portion of the processing load on a high-speed, low-
latency, large-capacity network. This will make possible more-advanced services, such as thin client services and
intuitive search using handset cameras.
> Capital expenditures and improvement of cost efficiency
Capital expenditures have followed a declining trend since the fiscal year ended March 3�, �007, when the area
coverage of W-CDMA was expanding and capital expenditures were ¥934.4 billion. In the fiscal year ended March
3�, �009, capital expenditures were ¥737.6 billion. In the coming years, we plan to keep capital investment below
¥700.0 billion per year, including investment in LTE and new services. To increase customer satisfaction, we will
move forward with efficient investment and improved cost efficiency through measures such as reduction of equip-
ment procurement costs and efficient designing, construction, and deployment of economical equipment, in tan-
dem with measures targeting further improvement in area quality and enhancement of equipment in response to
the increase in the volume of data communication.
Also, in conjunction with the efforts to improve our top line, described above, we will work to increase cost
efficiency, with a target of ¥�00.0 billion in cost reductions, or about �0% of the ¥� trillion in operating expenses,
such as network-related costs and general expenses. In this way, we are aiming to achieve more than ¥900.0 billion
in operating income, as indicated in our medium-term vision.
Under its medium-term vision, DOCOMO is reviewing every aspect of its business from the customer’s perspective,
while strengthening relationships with customers and fostering innovation taking advantage of the unique character-
istics of mobile communications. In this way, DOCOMO will continue to take on the challenge of creating new value.
“Pursuing higher levels of satisfaction for 55 million customers.”
With this strong determination, we will do our utmost to execute the “Change and Challenge” action plan, tar-
geting the realization of our medium-term vision.
Cost Reduction Targets and Major Initiatives by FieldsField Principal initiatives Reduction targets in fiscal �009 Reduction targets by fiscal �0�� (In comparison with the results of fiscal �007) (In comparison with the results of fiscal �007)
Network- • Reduction of base station construction costs ¥�0�.5 billion ¥�40.0 billion related costs • Network streamlining
• Reduction of communication network charges
General expenses • Leveraging our status as a single entity, ¥40.0 billion ¥60.0 billion
such as reviewing operational processes,
handset logistics, and implementing
integration and efficiency improvement
initiatives at various centers
• Optimal allocation of human resources
Total ¥�4�.5 billion ¥�00.0 billion
�6 OPENING DOORS : INCREASING CUSTOMER SATISFACTION AND REALIZING OUR MEDIUM-TERM VISION
opening doorsReview of Operations
To strengthen our relationships with customers, we are reviewing
all aspects of our business operations in accordance with the New
DOCOMO Commitments. These initiatives include mobile phones that
match customers’ lifestyles, a network environment that supports
comfortable mobile communications, after-service for safe and secure
use of mobile phones, and easy-to-use billing plans.
�7

Fiscal 2008 Overview
OPERATING REVENUES
> Down 5.6% year-on-year due to a decline in wireless services revenues
caused by the expansion of new discount services
Operating revenues were down 5.6%, or ¥�63.8 billion, to ¥4,448.0 billion.
On the one hand, equipment sales rose ��.0%, or ¥60.3 billion year-on-year,
to ¥606.9 billion, due to the decline in distributor commissions, which are
deducted from equipment sales, despite a decline in the number of handsets
sold caused by the expanded uptake of Value Course, a new handset purchase
method, and by sluggish business conditions.
On the other hand, wireless services revenues were down 7.8%, or ¥3�4.�
billion year-on-year, to ¥3,84�.� billion.
The decrease in wireless services revenues was attributable to factors such as
a decline in voice revenues. Voice revenues decreased �8.7%, or ¥495.5 billion,
mainly due to the wider acceptance of new discount services and a decrease in
voice ARPU, while packet communications revenues increased �0.0%, or ¥�37.8
billion year-on-year, due to an increase in packet ARPU.
Operating RevenuesYears ended March 3� Billions of yen
�008 2009 Increase (Decrease)
Wireless services 4,�65.� 3,841.1 (7.8)%
Cellular services revenues 4,0�9.0 3,661.3 (8.9)%
Voice revenues �,645.� 2,149.6 (�8.7)%
FOMA services �,084.3 1,877.8 (9.9)%
Packet communications revenues �,373.9 1,511.7 �0.0 %
FOMA services �,�54.6 1,449.4 �5.5 %
Other revenues* �46.� 179.8 ��.9 %
Equipment sales 546.6 606.9 ��.0 %
Total operating revenues 4,7��.8 4,448.0 (5.6)%
* ”PHS service revenues” for the year ended March 3�, �008 has been reclassified into ”Other revenues.”
OPERATING EXPENSES AND OPERATING INCOME
> Operating income was up 2.8%. Operating expenses declined due
to a decrease in the number of handsets sold and to wider customer
acceptance of the new handset purchase method, and the decrease
in operating expenses exceeded the decline in operating revenues.
Depreciation and amortization increased 3.6%, or ¥�7.7 billion year-on-year,
to ¥804.� billion, due to such factors as the accelerated depreciation of commu-
nications equipment related to mova, our second-generation cellular services.
Personnel expenses were up 8.9%, or ¥�0.7 billion year-on-year, to ¥�54.�
billion, due in part to settlement gain recognized in the previous fiscal year,
which arose from the transfer of substitutional obligation and related plan assets
to the government by NTT Welfare Pension Fund. On the other hand, non-
personnel expenses decreased to ¥�,�33.6 billion, down ��.4%, or ¥300.8 bil-
lion year-on-year, due to such factors as a decline in cost of equipment sold
resulting from lower handset procurement costs and a decrease in the number of
mobile phones sold, and a decline in distributor commissions accompanying the
wider customer acceptance of Value Course, a new handset purchase method.
Review of Operations
* For a more detailed analysis of business results in fiscal �008, see the Operating
and Financial Review and Prospects section on pages 50 to 70.
�8 OPENING DOORS : REVIEW OF OPERATIONS : OVERVIEW
Overview

In addition, communication network charges were down ¥�8.4 billion, to
¥3�6.7 billion. Consequently, total operating expenses declined 7.3%, or
¥�86.5 billion, to ¥3,6�7.0 billion.
Operating income increased ¥��.6 billion, or �.8% year-on-year, to
¥83�.0 billion, and the operating income margin rose to �8.7% from �7.�%
in the previous fiscal year.
Operating ExpensesYears ended March 3� Billions of yen
�008 2009 Increase (Decrease)
Personnel expenses �33.4 254.1 8.9%
Non-personnel expenses �,434.4 2,133.6 (��.4)%
Depreciation and amortization 776.4 804.2 3.6%
Loss on disposal of property, plant and
equipment and intangible assets 75.4 69.7 (7.6)%
Communication network charges 345.� 316.7 (8.�)%
Taxes and public dues 38.8 38.7 (0.�)%
Total operating expenses 3,903.5 3,617.0 (7.3)%
Overview of Operations
NUMBER OF SUBSCRIPTIONS AND CHURN RATE
> The churn rate reached a record low level of 0.50%
The aggregate number of cellular (FOMA + mova) subscriptions rose by �.��
million from the previous fiscal year, to 54.60 million as of the end of March
�009. The number of FOMA subscriptions increased 5.09 million, to 49.04
million at the end of March �009, as a result of the migration of subscribers
from the mova service. At the end of fiscal �008, the number of FOMA sub-
scriptions accounted for 89.8% of the total subscriptions.
Our churn rate improved significantly from the level of 0.80% during the
previous fiscal year, reaching a record low level of 0.50% for the fiscal year
ended March 3�, �009. This improvement reflected the growing acceptance
of our new business model consisting of new handset purchase methods and
new discount services, which is appropriate for a mature market environment,
as well as a range of initiatives targeting higher customer satisfaction in accor-
dance with the New DOCOMO Commitments. We also recorded significant
improvement in the number of subscriptions lost through the use of Mobile
Number Portability, and the number of net additions is on a recovery track.
STATUS OF NEW BUSINESS MODEL
(NEW HANDSET PURCHASE METHOD AND NEW DISCOUNT SERVICES)
> Strong results in subscriber acquisition and steady progress in
becoming firmly established in the market
Value Course, the new handset purchase method that was introduced in
November �007, maintained a selection rate of more than 90% for fiscal
�008, and the cumulative total number of subscriptions to Value Plan, a dis-
count service exclusively for Value Course customers, surpassed �0 million.
The new discount services, including Fami-wari MAX 50, have attracted 30
million subscriptions, approximately 60% of aggregate subscriptions. This is
an example of how the new business model, which was introduced with the
objective of fostering stable, long-term relationships with existing customers,
is showing steady results.
ARPU
> Progress in raising packet ARPU
The aggregate ARPU (FOMA + mova) decreased ¥650 year-on-year, to
¥5,7�0. The voice ARPU declined ¥830, to ¥3,330, as a result of the estab-
lishment of Value Plan, which reduces basic monthly charges; the increase
in subscriptions to new discount services, such as Fami-wari MAX 50; and
the provision of free voice calls between family members subscribing to Fami-
wari MAX 50. On the other hand, packet ARPU increased ¥�80 year-on-year,
to ¥�,380. We have implemented a number of initiatives intended to increase
packet ARPU, such as enhancing the Pake-hodai flat-rate packet service,
i-channel services, and video content services, and providing i-concier, which
was launched in November �008. These initiatives showed favorable results
and contributed to the increase in packet ARPU.
ARPUYears ended March 3� Yen
�008 2009 1Q 2Q 3Q 4Q
Aggregate ARPU
(FOMA + mova) 6,360 5,710 5,890 5,860 5,730 5,390
Voice ARPU 4,�60 3,330 3,560 3,450 3,340 2,970
Packet ARPU �,�00 2,380 2,330 2,410 2,390 2,420
Operating Revenues, Operating Income, and Operating Income Margin
Billions of yen
0
1,000
2,000
3,000
4,000
5,000
6,000
200920082007200620050.0
5.0
10.0
15.0
20.0
25.0
30.0%
784.2
16.217.5 16.2 17.2
832.6 773.5 808.3
4,844.6 4,765.9 4,788.1 4,711.8
18.7
831.0
4,448.0
Operating revenues (left) Operating income (left)
Operating income margin (right)
Years ended March 31
Number of Cumulative Mobile Phone Subscriptions (FOMA + mova), FOMA Subscriptions, and Churn Rate
Thousands
0
10,000
20,000
30,000
40,000
50,000
60,000
0.0
0.3
0.6
0.9
1.2
1.5
1.8%
20092008200720062005
11,501
1.01
0.77
35,529
43,949
23,463
0.78 0.80
48,82551,144 52,621 53,388 54,601
49,040
0.50
Number of cumulative mobile phone subscriptions (FOMA + mova) (left) FOMA subscriptions (left)
Churn rate (right)
Years ended March 31
�9
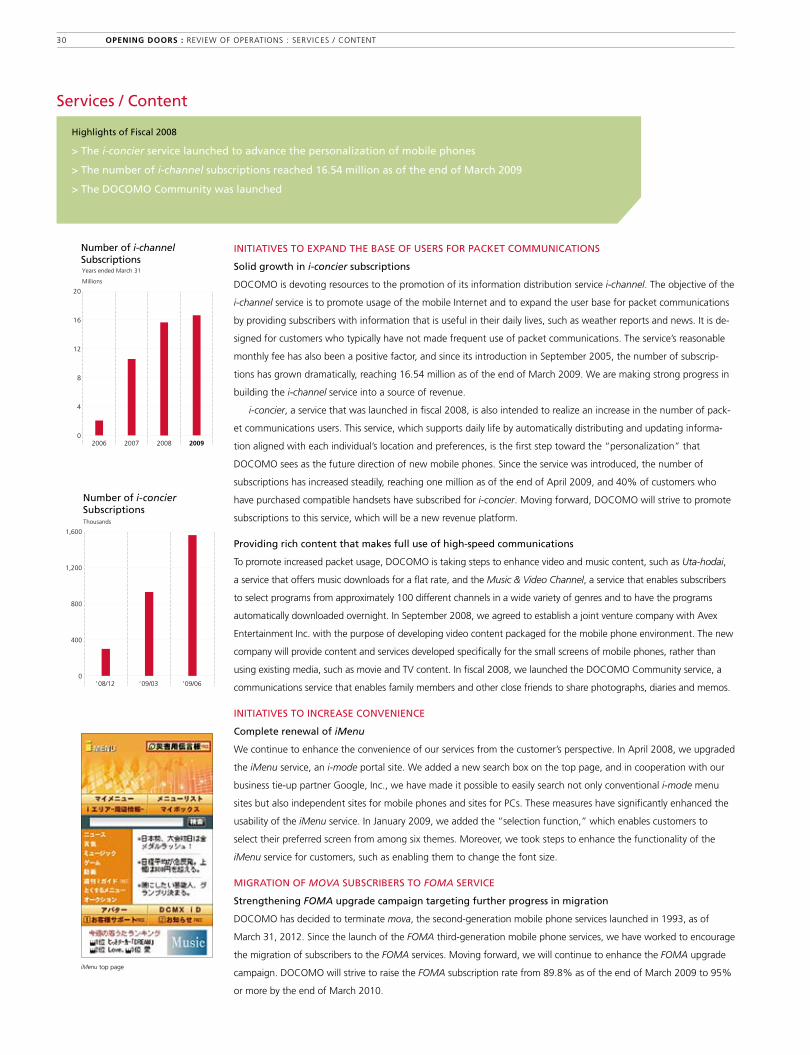
INITIATIVES TO EXPAND THE BASE OF USERS FOR PACKET COMMUNICATIONS
Solid growth in i-concier subscriptions
DOCOMO is devoting resources to the promotion of its information distribution service i-channel. The objective of the
i-channel service is to promote usage of the mobile Internet and to expand the user base for packet communications
by providing subscribers with information that is useful in their daily lives, such as weather reports and news. It is de-
signed for customers who typically have not made frequent use of packet communications. The service’s reasonable
monthly fee has also been a positive factor, and since its introduction in September �005, the number of subscrip-
tions has grown dramatically, reaching �6.54 million as of the end of March �009. We are making strong progress in
building the i-channel service into a source of revenue.
i-concier, a service that was launched in fiscal �008, is also intended to realize an increase in the number of pack-
et communications users. This service, which supports daily life by automatically distributing and updating informa-
tion aligned with each individual’s location and preferences, is the first step toward the “personalization” that
DOCOMO sees as the future direction of new mobile phones. Since the service was introduced, the number of
subscriptions has increased steadily, reaching one million as of the end of April �009, and 40% of customers who
have purchased compatible handsets have subscribed for i-concier. Moving forward, DOCOMO will strive to promote
subscriptions to this service, which will be a new revenue platform.
Providing rich content that makes full use of high-speed communications
To promote increased packet usage, DOCOMO is taking steps to enhance video and music content, such as Uta-hodai,
a service that offers music downloads for a flat rate, and the Music & Video Channel, a service that enables subscribers
to select programs from approximately �00 different channels in a wide variety of genres and to have the programs
automatically downloaded overnight. In September �008, we agreed to establish a joint venture company with Avex
Entertainment Inc. with the purpose of developing video content packaged for the mobile phone environment. The new
company will provide content and services developed specifically for the small screens of mobile phones, rather than
using existing media, such as movie and TV content. In fiscal �008, we launched the DOCOMO Community service, a
communications service that enables family members and other close friends to share photographs, diaries and memos.
INITIATIVES TO INCREASE CONVENIENCE
Complete renewal of iMenu
We continue to enhance the convenience of our services from the customer’s perspective. In April �008, we upgraded
the iMenu service, an i-mode portal site. We added a new search box on the top page, and in cooperation with our
business tie-up partner Google, Inc., we have made it possible to easily search not only conventional i-mode menu
sites but also independent sites for mobile phones and sites for PCs. These measures have significantly enhanced the
usability of the iMenu service. In January �009, we added the “selection function,” which enables customers to
select their preferred screen from among six themes. Moreover, we took steps to enhance the functionality of the
iMenu service for customers, such as enabling them to change the font size.
MIGRATION OF MOVA SUBSCRIBERS TO FOMA SERVICE
Strengthening FOMA upgrade campaign targeting further progress in migration
DOCOMO has decided to terminate mova, the second-generation mobile phone services launched in �993, as of
March 3�, �0��. Since the launch of the FOMA third-generation mobile phone services, we have worked to encourage
the migration of subscribers to the FOMA services. Moving forward, we will continue to enhance the FOMA upgrade
campaign. DOCOMO will strive to raise the FOMA subscription rate from 89.8% as of the end of March �009 to 95%
or more by the end of March �0�0.
Highlights of Fiscal 2008
> The i-concier service launched to advance the personalization of mobile phones
> The number of i-channel subscriptions reached 16.54 million as of the end of March 2009
> The DOCOMO Community was launched
Services / Content
30 OPENING DOORS : REVIEW OF OPERATIONS : SERVICES / CONTENT
0
400
800
1,200
1,600
’09/06’09/03’08/12
Number of i-concierSubscriptionsThousands
0
200
400
600
800
1,000
’09/06’09/03’08/12
Number of i-concierSubscriptionsThousands
0
4
8
12
16
20
2009200820072006
Number of i-channelSubscriptions
Millions
Years ended March 31
iMenu top page

PACKET FLAT-RATE SERVICE
Steady growth in the number of subscriptions to the Pake-hodai service
In fiscal �008, the packet ARPU increased ¥�80 year-on-year, to ¥�,380. Over the past several years, packet
ARPU has consistently remained on this growth trend, against a background of an increasing number of sub-
scriptions to DOCOMO’s packet flat-rate services.
To meet the needs of customers who want to enjoy data communications services without worrying about
how much it is going to cost, DOCOMO offers a packet flat-rate service, Pake-hodai. Since the service was intro-
duced, we have worked to expand the number of subscriptions by enhancing the lineup and revising the rates.
In fiscal �008, we took steps to further bolster the competitiveness of the service. We launched Pake-hodai dou-
ble and Biz-hodai double, new packet flat-rate services under which the monthly fee is adjusted in line with each
month’s usage volume.
As a result, the number of subscriptions to Pake-hodai increased 4.87 million year-on-year, to �7.6� million.
The subscription rate of Pake-hodai against the total number of i-mode subscriptions was about 36%, compared
with about �7% at the end of the previous year. Initiatives to boost packet ARPU are steadily showing results.
In May �009, with the objective of promoting subscriptions to Pake-hodai double and Biz-hodai double,
we further reduced the entry rate for these services from ¥�,�09 to ¥490, and in July �009, we introduced Flat-
Rate Data Plan Standard, which is for use with data cards. In these ways, we are enhancing our lineup of packet
flat-rate services.
BILLING PLANS THAT ENCOURAGE LONG-TERM CONTRACTS
Steady user acceptance is a major factor in churn rate improvement
Under the Value Course, which is a new handset purchase method suitable to a mature market, customers pay an
amount equivalent to the actual cost of the handset, and an amount corresponding to the handset sales incentive
is discounted from their basic monthly charges. Since its introduction in November �007, Value Course has been
chosen by more than 90% of customers utilizing one of the new purchase methods. The number of subscriptions
to Value Plan, a discount plan exclusively for Value Course subscribers, has surpassed �0 million.
A two-year contract is a condition for the new discount services, including Fami-wari MAX 50. These services,
which are offered as a set with Value Course, offer discounts of 50% on basic monthly charges, without regard
to how long customers have subscribed in the past. These services, which are intended to stabilize our business
foundation by building long-term relationships with customers, are billing plans that comprise a key part of our
strategy of focusing on existing customers. In April �008, we made domestic voice calls among family group
members free of charge �4 hours a day for FOMA subscribers to the Fami-wari MAX 50 service. In addition, we
have enhanced this service to include free i-mode mail among family group members. As a result of these initia-
tives, subscriptions to new discount services, such as Fami-wari MAX 50, have recorded favorable growth, and
the number of subscriptions as of the end of March �009 was 3�.7� million, or approximately 60% of the total
number of FOMA subscriptions.
In this way, the variety of billing plans intended to foster longer subscription periods has earned the strong
support of customers as the expansion of services targeting enhanced customer satisfaction have taken effect.
DOCOMO is working to further enhance its services. For example, from May �009, we extended the scope of
free i-mode mail available to family group members to include video files and other large attachments, which
were excluded from the free i-mode mail in the past.
Highlights of Fiscal 2008
> The number of subscriptions to Pake-hodai surpassed 17 million
> The number of subscriptions to the Value Plan surpassed 20 million. The selection rate remained above 90%
> The number of subscriptions to Fami-wari MAX 50 and other new discount services reached 32.72 million
> The share of total subscriptions reached about 60%
Rate Structure
REVIEW OF OPERATIONS : RATE STRUCTURE 3�
Pake-hodai + Pake-hodai Full
Pake-hodai double
0
5
10
15
20
20092008200720062005
Pake-hodai Subscriptions
Millions
Years ended March 31
0
5
10
15
20
20092008200720062005
Pake-hodai Subscriptions
Millions
Years ended March 31
Pake-hodai + Pake-hodai Full
0
5
10
15
20
20092008200720062005
Pake-hodai Subscriptions
Millions
Years ended March 31
0
¥1,029(previous)
¥490
¥4,410
52,5005,838
Revision of Pake-hodai double Rate
(after revision)
No. of packets
Moreaffordablerates
packets packets
0
¥1,029(previous)
Moreaffordablerates
¥490
¥5,985
71,2505,838
Revision of Biz-hodaidouble Rate
packets packets
(after revision)
No. of packets

> docomo STYLE series
Customers select a model that matches their
style. Highly fashionable mobile phones.
> docomo PRIME series
Full-featured. Leading-edge. New-generation
entertainment mobile phones.
> docomo SMART series
Manage professional and private lives.
Intelligent mobile phones for adults.
> docomo PRO series
Unrestricted use of cutting-edge technologies.
Advanced high-spec mobile phones.
From Functionality to Lifestyles
HANDSET DEVELOPMENT
We reorganized our lineup with four series from which customers can select a model that fits
their own lifestyle
In November �008, as one facet of initiatives to review all our activities from the customer’s point of view in
accordance with the New DOCOMO Commitments, we fundamentally changed our previous approach to the
handset lineup. We announced four new series – the docomo STYLE series, docomo PRIME series, docomo
SMART series, and docomo PRO series. Previously, the Company’s lineup was basically divided into two catego-
ries by grade and functionality, the 9 series and the 7 series. In contrast, with the new lineup, our goal was to
categorize the handsets by lifestyle and values and to provide a more focused response to customer needs in
each segment. In the future, we will enhance the new series and work to offer a product lineup that satisfies
every customer.
HANDSET SALES
Covering a wide range of customers with an enhanced lineup
In fiscal �008, we introduced 8 models in the 9 series and �3 models in the 7 series. In the new lineup, we
introduced 9 models in the docomo STYLE series, such as the N-03A, which is the result of collaboration with
Pierre Herme, a leading French brand of pastry. In the docomo PRIME series, we introduced 7 models, includ-
ing the N-01A, which has an easy-to-use touch panel and style change functionality. These models have func-
tions that facilitate the enjoyment of entertainment, such as video and games. In the docomo SMART series,
we introduced 4 models, including the P-04A, which offers functions useful in business, such as compatibility
with the WORLD WING� international roaming service, in the world’s thinnest (9.8 mm)� folding mobile phone.
In the docomo PRO series, we introduced 4 models, including models with the latest technologies and leading-
edge digital tools. In addition, we also introduced new models in the Raku Raku PHONE series. This series has
received overwhelming support from middle-aged and older users and opened up the new seniors market.
We also introduced new models in the Kids’ PHONE series, which has a variety of functions to protect children.
Consequently, in fiscal �008, including models in conventional categories and models in new lineups,
we introduced 54 models, compared with 47 models in the previous year.
� DOCOMO’s international roaming service that is compatible with both W-CDMA (3G), a third-generation international standard, and GSM,
which can be used in many countries.
� As of February 4, �009.
Accompanying the introduction of new handset purchase methods, distributor commissions declined
The new handset purchase methods were well accepted, but as economic conditions worsened, consumer
spending declined. Due to these and other factors, the number of handsets sold was down ��.8% year-on-
year, to �0.�3 million. In regard to distributor commissions paid to sales agents, the number of sales through
Value Course accounted for more than 90% of the number of sales through the new handset purchase meth-
ods introduced in November �007, and as a result handset sales incentives declined substantially. On the other
hand, we implemented initiatives to increase the efficiency and reduce the operational costs of sales agents,
such as nationwide sharing of distribution centers and the introduction of a framework for nationwide transfer
of sales agent inventories.
Highlights of Fiscal 2008
> Shifted the lineup focus from functionality to lifestyles
> Distributor commissions declined substantially accompanying the introduction of new handset purchase methods
Handsets
3� OPENING DOORS : REVIEW OF OPERATIONS : HANDSETS
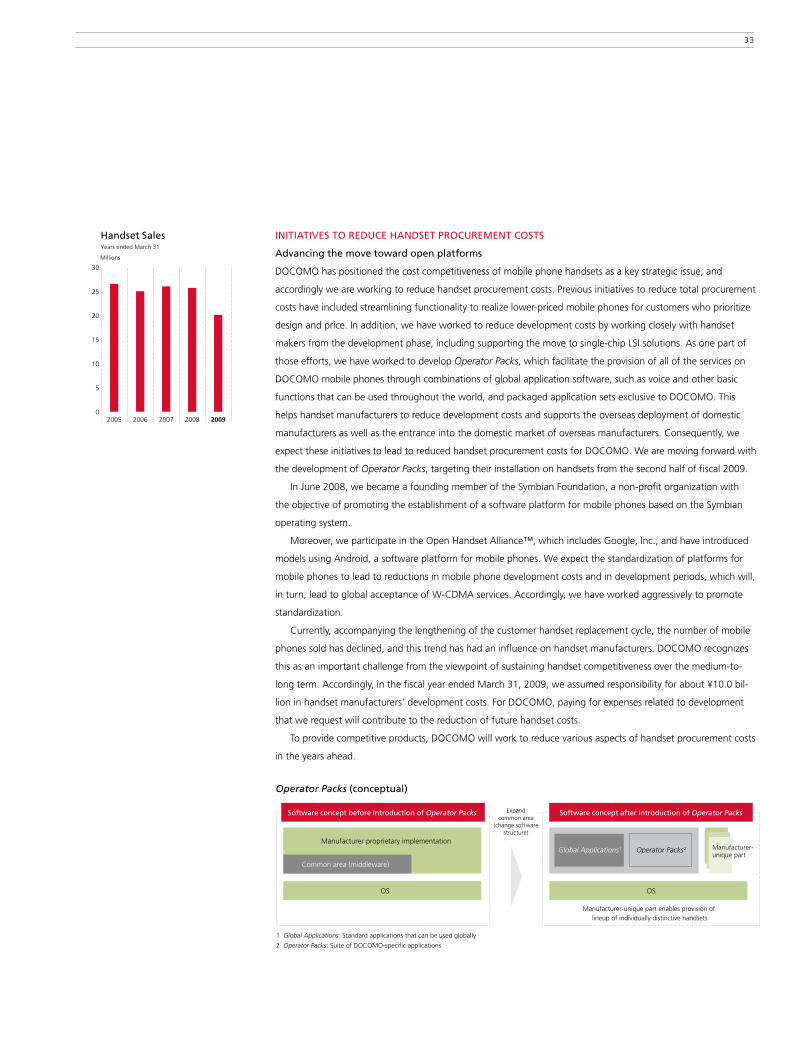
INITIATIVES TO REDUCE HANDSET PROCUREMENT COSTS
Advancing the move toward open platforms
DOCOMO has positioned the cost competitiveness of mobile phone handsets as a key strategic issue, and
accordingly we are working to reduce handset procurement costs. Previous initiatives to reduce total procurement
costs have included streamlining functionality to realize lower-priced mobile phones for customers who prioritize
design and price. In addition, we have worked to reduce development costs by working closely with handset
makers from the development phase, including supporting the move to single-chip LSI solutions. As one part of
those efforts, we have worked to develop Operator Packs, which facilitate the provision of all of the services on
DOCOMO mobile phones through combinations of global application software, such as voice and other basic
functions that can be used throughout the world, and packaged application sets exclusive to DOCOMO. This
helps handset manufacturers to reduce development costs and supports the overseas deployment of domestic
manufacturers as well as the entrance into the domestic market of overseas manufacturers. Consequently, we
expect these initiatives to lead to reduced handset procurement costs for DOCOMO. We are moving forward with
the development of Operator Packs, targeting their installation on handsets from the second half of fiscal �009.
In June �008, we became a founding member of the Symbian Foundation, a non-profit organization with
the objective of promoting the establishment of a software platform for mobile phones based on the Symbian
operating system.
Moreover, we participate in the Open Handset Alliance™, which includes Google, Inc., and have introduced
models using Android, a software platform for mobile phones. We expect the standardization of platforms for
mobile phones to lead to reductions in mobile phone development costs and in development periods, which will,
in turn, lead to global acceptance of W-CDMA services. Accordingly, we have worked aggressively to promote
standardization.
Currently, accompanying the lengthening of the customer handset replacement cycle, the number of mobile
phones sold has declined, and this trend has had an influence on handset manufacturers. DOCOMO recognizes
this as an important challenge from the viewpoint of sustaining handset competitiveness over the medium-to-
long term. Accordingly, in the fiscal year ended March 3�, �009, we assumed responsibility for about ¥�0.0 bil-
lion in handset manufacturers’ development costs. For DOCOMO, paying for expenses related to development
that we request will contribute to the reduction of future handset costs.
To provide competitive products, DOCOMO will work to reduce various aspects of handset procurement costs
in the years ahead.
33
0
5
10
15
20
25
30
20092008200720062005
Handset Sales
Millions
Years ended March 31
Expandcommon area
(change softwarestructure)
Manufacturer-unique part enables provision of lineup of individually distinctive handsets
1 Global Applications: Standard applications that can be used globally
2 Operator Packs: Suite of DOCOMO-specific applications
Operator Packs (conceptual)
Software concept before introduction of Operator Packs
Manufacturer proprietary implementation
Common area (middleware)
OS
Software concept after introduction of Operator Packs
OS
Global Applications 1 Operator Packs2 Manufacturer-unique part
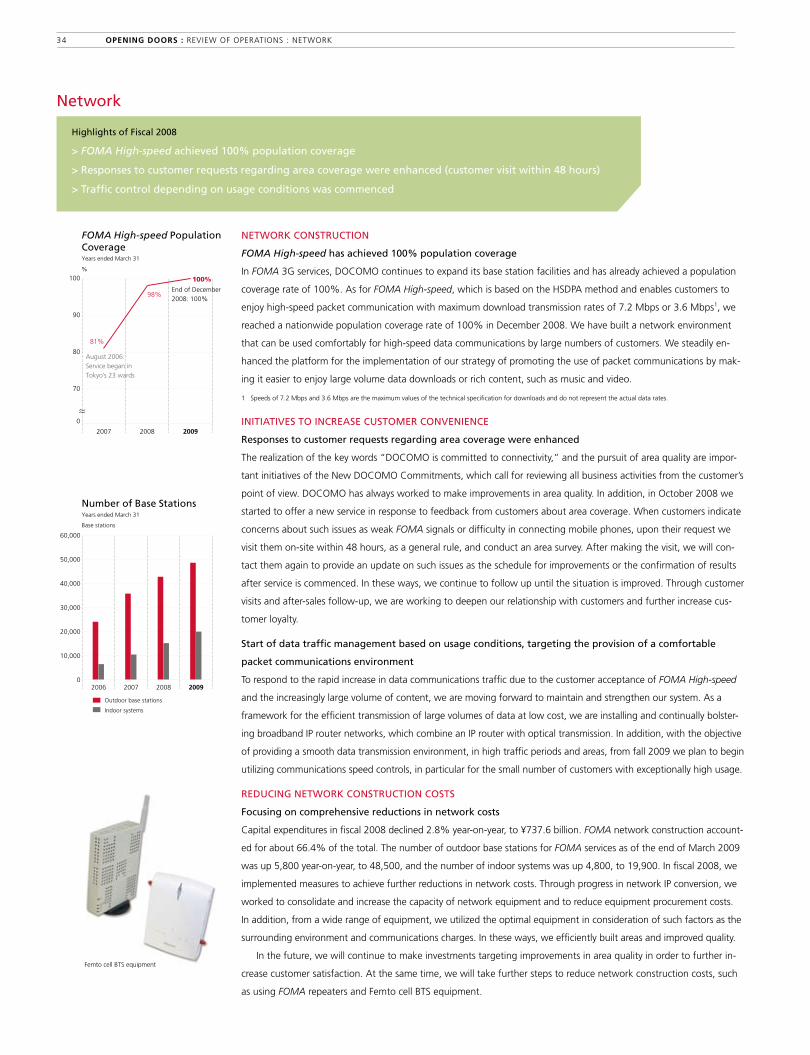
NETWORK CONSTRUCTION
FOMA High-speed has achieved 100% population coverage
In FOMA 3G services, DOCOMO continues to expand its base station facilities and has already achieved a population
coverage rate of �00%. As for FOMA High-speed, which is based on the HSDPA method and enables customers to
enjoy high-speed packet communication with maximum download transmission rates of 7.� Mbps or 3.6 Mbps�, we
reached a nationwide population coverage rate of �00% in December �008. We have built a network environment
that can be used comfortably for high-speed data communications by large numbers of customers. We steadily en-
hanced the platform for the implementation of our strategy of promoting the use of packet communications by mak-
ing it easier to enjoy large volume data downloads or rich content, such as music and video.
� Speeds of 7.� Mbps and 3.6 Mbps are the maximum values of the technical specification for downloads and do not represent the actual data rates.
INITIATIVES TO INCREASE CUSTOMER CONVENIENCE
Responses to customer requests regarding area coverage were enhanced
The realization of the key words “DOCOMO is committed to connectivity,” and the pursuit of area quality are impor-
tant initiatives of the New DOCOMO Commitments, which call for reviewing all business activities from the customer’s
point of view. DOCOMO has always worked to make improvements in area quality. In addition, in October �008 we
started to offer a new service in response to feedback from customers about area coverage. When customers indicate
concerns about such issues as weak FOMA signals or difficulty in connecting mobile phones, upon their request we
visit them on-site within 48 hours, as a general rule, and conduct an area survey. After making the visit, we will con-
tact them again to provide an update on such issues as the schedule for improvements or the confirmation of results
after service is commenced. In these ways, we continue to follow up until the situation is improved. Through customer
visits and after-sales follow-up, we are working to deepen our relationship with customers and further increase cus-
tomer loyalty.
Start of data traffic management based on usage conditions, targeting the provision of a comfortable
packet communications environment
To respond to the rapid increase in data communications traffic due to the customer acceptance of FOMA High-speed
and the increasingly large volume of content, we are moving forward to maintain and strengthen our system. As a
framework for the efficient transmission of large volumes of data at low cost, we are installing and continually bolster-
ing broadband IP router networks, which combine an IP router with optical transmission. In addition, with the objective
of providing a smooth data transmission environment, in high traffic periods and areas, from fall �009 we plan to begin
utilizing communications speed controls, in particular for the small number of customers with exceptionally high usage.
REDUCING NETWORK CONSTRUCTION COSTS
Focusing on comprehensive reductions in network costs
Capital expenditures in fiscal �008 declined �.8% year-on-year, to ¥737.6 billion. FOMA network construction account-
ed for about 66.4% of the total. The number of outdoor base stations for FOMA services as of the end of March �009
was up 5,800 year-on-year, to 48,500, and the number of indoor systems was up 4,800, to �9,900. In fiscal �008, we
implemented measures to achieve further reductions in network costs. Through progress in network IP conversion, we
worked to consolidate and increase the capacity of network equipment and to reduce equipment procurement costs.
In addition, from a wide range of equipment, we utilized the optimal equipment in consideration of such factors as the
surrounding environment and communications charges. In these ways, we efficiently built areas and improved quality.
In the future, we will continue to make investments targeting improvements in area quality in order to further in-
crease customer satisfaction. At the same time, we will take further steps to reduce network construction costs, such
as using FOMA repeaters and Femto cell BTS equipment.
Highlights of Fiscal 2008
> FOMA High-speed achieved 100% population coverage
> Responses to customer requests regarding area coverage were enhanced (customer visit within 48 hours)
> Traffic control depending on usage conditions was commenced
Network
34 OPENING DOORS : REVIEW OF OPERATIONS : NETWORK
70
0
80
90
100
200920082007
FOMA High-speed PopulationCoverage
%
81%
98%
100%
August 2006: Service began in Tokyo’s 23 wards
End of December2008: 100%
Years ended March 31
Outdoor base stations
Indoor systems
0
10,000
20,000
30,000
40,000
50,000
60,000
2009200820072006
Number of Base Stations
Base stations
Years ended March 31
Femto cell BTS equipment
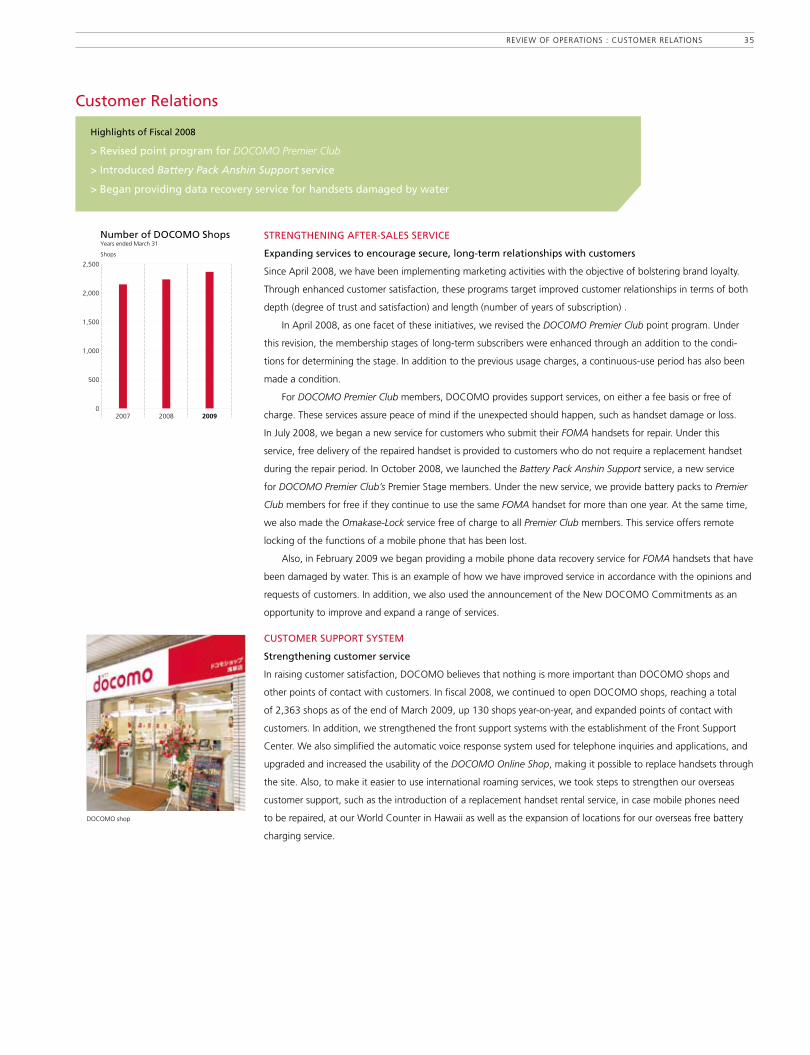
STRENGTHENING AFTER-SALES SERVICE
Expanding services to encourage secure, long-term relationships with customers
Since April �008, we have been implementing marketing activities with the objective of bolstering brand loyalty.
Through enhanced customer satisfaction, these programs target improved customer relationships in terms of both
depth (degree of trust and satisfaction) and length (number of years of subscription) .
In April �008, as one facet of these initiatives, we revised the DOCOMO Premier Club point program. Under
this revision, the membership stages of long-term subscribers were enhanced through an addition to the condi-
tions for determining the stage. In addition to the previous usage charges, a continuous-use period has also been
made a condition.
For DOCOMO Premier Club members, DOCOMO provides support services, on either a fee basis or free of
charge. These services assure peace of mind if the unexpected should happen, such as handset damage or loss.
In July �008, we began a new service for customers who submit their FOMA handsets for repair. Under this
service, free delivery of the repaired handset is provided to customers who do not require a replacement handset
during the repair period. In October �008, we launched the Battery Pack Anshin Support service, a new service
for DOCOMO Premier Club’s Premier Stage members. Under the new service, we provide battery packs to Premier
Club members for free if they continue to use the same FOMA handset for more than one year. At the same time,
we also made the Omakase-Lock service free of charge to all Premier Club members. This service offers remote
locking of the functions of a mobile phone that has been lost.
Also, in February �009 we began providing a mobile phone data recovery service for FOMA handsets that have
been damaged by water. This is an example of how we have improved service in accordance with the opinions and
requests of customers. In addition, we also used the announcement of the New DOCOMO Commitments as an
opportunity to improve and expand a range of services.
CUSTOMER SUPPORT SYSTEM
Strengthening customer service
In raising customer satisfaction, DOCOMO believes that nothing is more important than DOCOMO shops and
other points of contact with customers. In fiscal �008, we continued to open DOCOMO shops, reaching a total
of �,363 shops as of the end of March �009, up �30 shops year-on-year, and expanded points of contact with
customers. In addition, we strengthened the front support systems with the establishment of the Front Support
Center. We also simplified the automatic voice response system used for telephone inquiries and applications, and
upgraded and increased the usability of the DOCOMO Online Shop, making it possible to replace handsets through
the site. Also, to make it easier to use international roaming services, we took steps to strengthen our overseas
customer support, such as the introduction of a replacement handset rental service, in case mobile phones need
to be repaired, at our World Counter in Hawaii as well as the expansion of locations for our overseas free battery
charging service.
Highlights of Fiscal 2008
> Revised point program for DOCOMO Premier Club
> Introduced Battery Pack Anshin Support service
> Began providing data recovery service for handsets damaged by water
Customer Relations
REVIEW OF OPERATIONS : CUSTOMER RELATIONS 35
0
500
1,000
1,500
2,000
2,500
200920082007
Number of DOCOMO Shops
Shops
Years ended March 31
DOCOMO shop
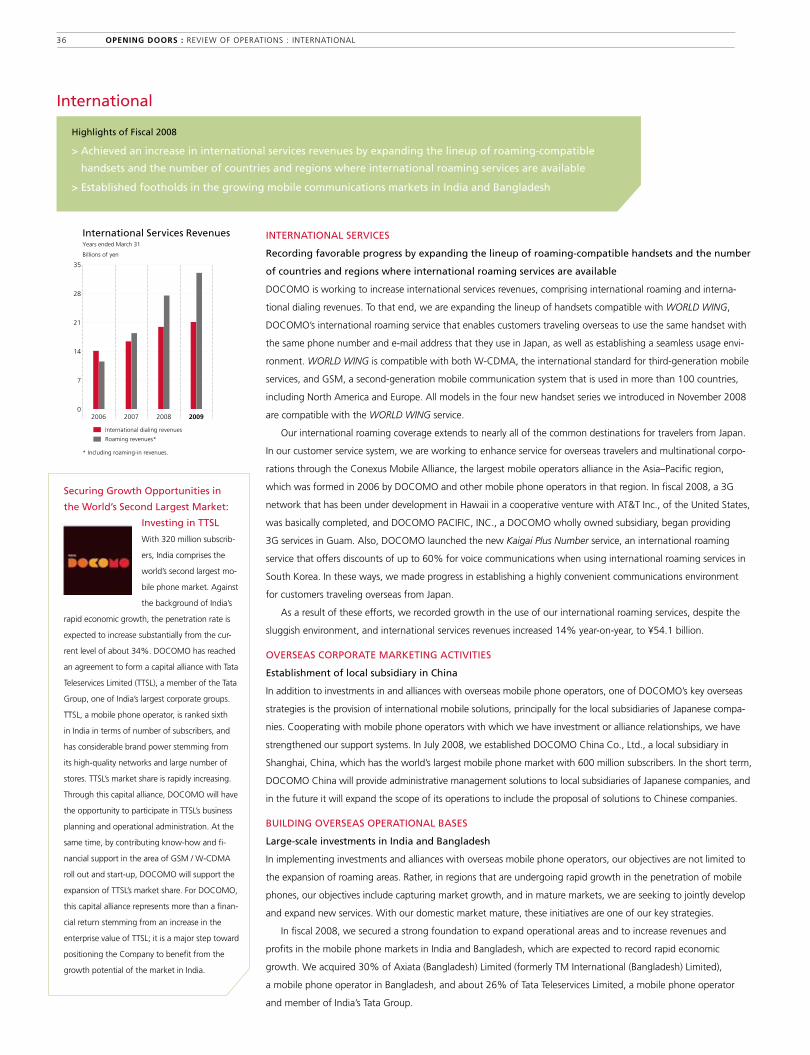
INTERNATIONAL SERVICES
Recording favorable progress by expanding the lineup of roaming-compatible handsets and the number
of countries and regions where international roaming services are available
DOCOMO is working to increase international services revenues, comprising international roaming and interna-
tional dialing revenues. To that end, we are expanding the lineup of handsets compatible with WORLD WING,
DOCOMO’s international roaming service that enables customers traveling overseas to use the same handset with
the same phone number and e-mail address that they use in Japan, as well as establishing a seamless usage envi-
ronment. WORLD WING is compatible with both W-CDMA, the international standard for third-generation mobile
services, and GSM, a second-generation mobile communication system that is used in more than �00 countries,
including North America and Europe. All models in the four new handset series we introduced in November �008
are compatible with the WORLD WING service.
Our international roaming coverage extends to nearly all of the common destinations for travelers from Japan.
In our customer service system, we are working to enhance service for overseas travelers and multinational corpo-
rations through the Conexus Mobile Alliance, the largest mobile operators alliance in the Asia–Pacific region,
which was formed in �006 by DOCOMO and other mobile phone operators in that region. In fiscal �008, a 3G
network that has been under development in Hawaii in a cooperative venture with AT&T Inc., of the United States,
was basically completed, and DOCOMO PACIFIC, INC., a DOCOMO wholly owned subsidiary, began providing
3G services in Guam. Also, DOCOMO launched the new Kaigai Plus Number service, an international roaming
service that offers discounts of up to 60% for voice communications when using international roaming services in
South Korea. In these ways, we made progress in establishing a highly convenient communications environment
for customers traveling overseas from Japan.
As a result of these efforts, we recorded growth in the use of our international roaming services, despite the
sluggish environment, and international services revenues increased �4% year-on-year, to ¥54.� billion.
OVERSEAS CORPORATE MARKETING ACTIVITIES
Establishment of local subsidiary in China
In addition to investments in and alliances with overseas mobile phone operators, one of DOCOMO’s key overseas
strategies is the provision of international mobile solutions, principally for the local subsidiaries of Japanese compa-
nies. Cooperating with mobile phone operators with which we have investment or alliance relationships, we have
strengthened our support systems. In July �008, we established DOCOMO China Co., Ltd., a local subsidiary in
Shanghai, China, which has the world’s largest mobile phone market with 600 million subscribers. In the short term,
DOCOMO China will provide administrative management solutions to local subsidiaries of Japanese companies, and
in the future it will expand the scope of its operations to include the proposal of solutions to Chinese companies.
BUILDING OVERSEAS OPERATIONAL BASES
Large-scale investments in India and Bangladesh
In implementing investments and alliances with overseas mobile phone operators, our objectives are not limited to
the expansion of roaming areas. Rather, in regions that are undergoing rapid growth in the penetration of mobile
phones, our objectives include capturing market growth, and in mature markets, we are seeking to jointly develop
and expand new services. With our domestic market mature, these initiatives are one of our key strategies.
In fiscal �008, we secured a strong foundation to expand operational areas and to increase revenues and
profits in the mobile phone markets in India and Bangladesh, which are expected to record rapid economic
growth. We acquired 30% of Axiata (Bangladesh) Limited (formerly TM International (Bangladesh) Limited),
a mobile phone operator in Bangladesh, and about �6% of Tata Teleservices Limited, a mobile phone operator
and member of India’s Tata Group.
Highlights of Fiscal 2008
> Achieved an increase in international services revenues by expanding the lineup of roaming-compatible
handsets and the number of countries and regions where international roaming services are available
> Established footholds in the growing mobile communications markets in India and Bangladesh
International
Securing Growth Opportunities in
the World’s Second Largest Market:
Investing in TTSL
With 3�0 million subscrib-
ers, India comprises the
world’s second largest mo-
bile phone market. Against
the background of India’s
rapid economic growth, the penetration rate is
expected to increase substantially from the cur-
rent level of about 34%. DOCOMO has reached
an agreement to form a capital alliance with Tata
Teleservices Limited (TTSL), a member of the Tata
Group, one of India’s largest corporate groups.
TTSL, a mobile phone operator, is ranked sixth
in India in terms of number of subscribers, and
has considerable brand power stemming from
its high-quality networks and large number of
stores. TTSL’s market share is rapidly increasing.
Through this capital alliance, DOCOMO will have
the opportunity to participate in TTSL’s business
planning and operational administration. At the
same time, by contributing know-how and fi-
nancial support in the area of GSM / W-CDMA
roll out and start-up, DOCOMO will support the
expansion of TTSL’s market share. For DOCOMO,
this capital alliance represents more than a finan-
cial return stemming from an increase in the
enterprise value of TTSL; it is a major step toward
positioning the Company to benefit from the
growth potential of the market in India.
36 OPENING DOORS : REVIEW OF OPERATIONS : INTERNATIONAL
International dialing revenues
Roaming revenues*
0
7
14
21
28
35
2009200820072006
International Services Revenues
Billions of yen
* Including roaming-in revenues.
Years ended March 31
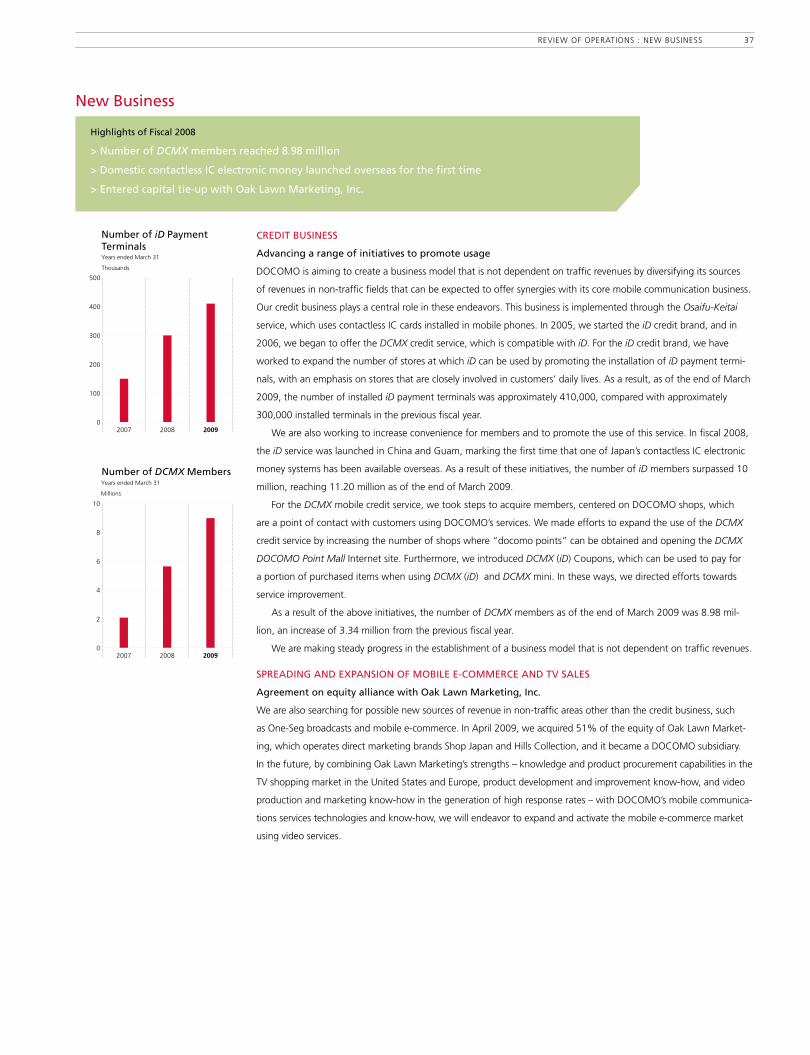
Highlights of Fiscal 2008
> Number of DCMX members reached 8.98 million
> Domestic contactless IC electronic money launched overseas for the first time
> Entered capital tie-up with Oak Lawn Marketing, Inc.
New Business
CREDIT BUSINESS
Advancing a range of initiatives to promote usage
DOCOMO is aiming to create a business model that is not dependent on traffic revenues by diversifying its sources
of revenues in non-traffic fields that can be expected to offer synergies with its core mobile communication business.
Our credit business plays a central role in these endeavors. This business is implemented through the Osaifu-Keitai
service, which uses contactless IC cards installed in mobile phones. In �005, we started the iD credit brand, and in
�006, we began to offer the DCMX credit service, which is compatible with iD. For the iD credit brand, we have
worked to expand the number of stores at which iD can be used by promoting the installation of iD payment termi-
nals, with an emphasis on stores that are closely involved in customers’ daily lives. As a result, as of the end of March
�009, the number of installed iD payment terminals was approximately 4�0,000, compared with approximately
300,000 installed terminals in the previous fiscal year.
We are also working to increase convenience for members and to promote the use of this service. In fiscal �008,
the iD service was launched in China and Guam, marking the first time that one of Japan’s contactless IC electronic
money systems has been available overseas. As a result of these initiatives, the number of iD members surpassed �0
million, reaching ��.�0 million as of the end of March �009.
For the DCMX mobile credit service, we took steps to acquire members, centered on DOCOMO shops, which
are a point of contact with customers using DOCOMO’s services. We made efforts to expand the use of the DCMX
credit service by increasing the number of shops where “docomo points” can be obtained and opening the DCMX
DOCOMO Point Mall Internet site. Furthermore, we introduced DCMX (iD) Coupons, which can be used to pay for
a portion of purchased items when using DCMX (iD) and DCMX mini. In these ways, we directed efforts towards
service improvement.
As a result of the above initiatives, the number of DCMX members as of the end of March �009 was 8.98 mil-
lion, an increase of 3.34 million from the previous fiscal year.
We are making steady progress in the establishment of a business model that is not dependent on traffic revenues.
SPREADING AND EXPANSION OF MOBILE E-COMMERCE AND TV SALES
Agreement on equity alliance with Oak Lawn Marketing, Inc.
We are also searching for possible new sources of revenue in non-traffic areas other than the credit business, such
as One-Seg broadcasts and mobile e-commerce. In April �009, we acquired 5�% of the equity of Oak Lawn Market-
ing, which operates direct marketing brands Shop Japan and Hills Collection, and it became a DOCOMO subsidiary.
In the future, by combining Oak Lawn Marketing’s strengths – knowledge and product procurement capabilities in the
TV shopping market in the United States and Europe, product development and improvement know-how, and video
production and marketing know-how in the generation of high response rates – with DOCOMO’s mobile communica-
tions services technologies and know-how, we will endeavor to expand and activate the mobile e-commerce market
using video services.
REVIEW OF OPERATIONS : NEW BUSINESS 37
0
100
200
300
400
500
200920082007
Number of iD Payment Terminals
Thousands
Years ended March 31
0
2
4
6
8
10
200920082007
Number of DCMX Members
Millions
Years ended March 31

BASIC R&D POLICIES AND STRUCTURES
DOCOMO’s R&D activities extend over a wide range of areas, from technologies that will contribute to increasing
its competitiveness in the short term to basic research focused on changes in the telecommunications industry in
the future. We have built an R&D system that covers all aspects of mobile communication systems, from networks
to handsets. This facilitates coordinated R&D in networks and handsets in line with our operational strategies in
each of these fields. As a result, we are developing original technologies that will enable us to provide handsets
and services that leverage close links between infrastructure and handsets.
In Japan, the DOCOMO R&D Center at the Yokosuka Research Park (YRP), which is our core R&D facility,
conducts original research in a wide range of mobile communications fields. In addition, we are working to
achieve integration with technologies from other fields by conducting joint research with other R&D institutes
and university laboratories. Moreover, to keep up to date with the latest international trends in leading-edge
technologies and to work towards the standardization of mobile communications systems, we have R&D centers
in the U.S., Germany and China.
MAJOR INITIATIVES IN FISCAL 2008
DOCOMO is working to develop LTE (Super 3G), which will realize high-speed data transmission of up to 300
Mbps and is the next stage in the evolution of third-generation mobile phones. In July �007 we began indoor
testing, and from February �008, we commenced outdoor field tests of LTE. In March �008, we successfully
achieved a downlink transmission speed of �50 Mbps. In December �008, we successfully built a prototype of
a low-power LSI that consumes less than 0.04 W of power yet supports signal detection and decoding for
downlink transmissions at �00 Mbps, the speed required for the LTE system. Moving forward, we will continue
development activities, with the goal of starting service in �0�0.
Also, at Wireless Japan �008, held in July �008, we exhibited a prototype of the Intelligent Battery Pack,
which diagnoses the degradation and faults of a lithium ion secondary battery for mobile phones. We are devel-
oping this device jointly with Mitsumi Electric Co., Ltd. In this battery pack, a semiconductor has been added to
the circuit protection module. The semiconductor measures voltage, current, and resistance, thereby enabling
confirmation of the optimal charging schedule and timing for battery replacement. DOCOMO will work to rap-
idly commercialize this battery pack, which will contribute to the increased reliability of mobile phones.
DOCOMO is aiming to provide a wearable communications environment through the development of tech-
nologies for “human body” communications that utilize the human body as a communications medium for the
transmission of data. Human body communications makes it possible to exchange data with devices on the
body, such as a mobile phone, even if the mobile phone is in a pocket and is not directly touched. This is accom-
plished through communications technologies that entail the mutual exchange of small electrical signals among
highly sensitive components mounted in devices, such as mobile phones, that are close to the body. For exam-
ple, when a user touches a door knob, an electronic key system could verify the identity transmitted from the
mobile phone and unlock the door, or data could be exchanged just by shaking hands. In the short term, we will
work toward the practical implementation of such functions as low-volume data exchange, ID verification, con-
trol commands, and voice transmission, centered on links between mobile phone components and nearby wire-
less technologies. In the future, we will strive to realize high-speed, large-volume transmission on the order of
�00 Mbps, which will enable the transmission of images.
In fiscal �008, our R&D expenses were ¥�00.8 billion, compared with ¥�00.0 billion in the previous fiscal year.
Highlights of Fiscal 2008
> Made progress in the development of LTE (Super 3G) commercial system
> Exhibited a prototype of the Intelligent Battery Pack at Wireless Japan 2008
Research & Development
38 OPENING DOORS : REVIEW OF OPERATIONS : RESEARCH & DEVELOPMENT
0
20
40
60
80
100
120
20092008200720062005
Research and DevelopmentExpenses
Billions of yen
Years ended March 31

opening doorsManagement System and CSR
As it conducts its business activities, DOCOMO maintains close
relationships with an extremely broad range of stakeholders.
DOCOMO believes that it can ensure sustained growth by meeting
the expectations of all of its stakeholders, and to that end
the Company has created a highly transparent corporate
governance system and strives to contribute to society through
its business activities.
39
A GOVERNANCE STRUCTURE THAT ENSURES PROMPTNESS,
TRANSPARENCY AND SOUNDNESS IN BUSINESS MANAGEMENT
Aiming to achieve the goal of ensuring promptness, transparency and
soundness in our business management, we have been working to estab-
lish a governance structure that allows us to both make management
decisions without delay and reinforce our audit and internal controls, as
well as to improve our communications with stakeholders. Specifically, we
have adopted the Board of Directors/Corporate Auditors system. Under
this system, directors make decisions pertaining to important matters of
the Company, directors who have also been assigned responsibility for
business execution supervise each other, and corporate auditors, including
outside auditors, audit business management.
To further strengthen business execution capability and to enhance
management supervision, we introduced the corporate officer system and
transferred a portion of business execution authority from the Board to the
representative directors, corporate officers, and executive officers. We be-
lieve this allows flexible business execution by the responsible corporate
officers. More than half of the Board members are assigned the responsi-
bility of serving concurrently as corporate officers. As a result, the effec-
tiveness of the mutual supervision of Board members in business execution
is enhanced, and the management supervision function is strengthened.
BUSINESS EXECUTION AND MANAGEMENT SUPERVISION SYSTEM
The Board of Directors consists of �3 members, including one outside
director. In principle, the Board meets once a month, and extraordinary
meetings are convened if necessary. In this way, decisions are made on
important business matters, status reports are received as needed from
Board members assigned the responsibility for business execution, and
management supervision is implemented. The Management Committee,
which includes representative directors, executive vice presidents and full-
time corporate auditors, meets in principle once a week, and extraordinary
meetings are convened if necessary. In this way, we support flexible, rapid
decision-making on important matters related to business execution.
AUDIT STRUCTURE The Board of Corporate Auditors consists of five
members, including three outside corporate auditors. The Board of Cor-
porate Auditors in principle meets once a month to make decisions on
audit policies, plans, methods, and other important issues relating to the
audit of the Company. Each corporate auditor, in accordance with audit
policies and audit plans determined by the Board of Corporate Auditors,
attends important meetings, such as meetings of the Board of Directors,
and receives reports from directors, examines important documents, and
conducts on-site examinations of the head office, major work sites, and
major subsidiaries. In this way, corporate auditors appropriately conduct
audits of the status of business execution by the directors and report to
the Board of Corporate Auditors on the status of audit implementation.
DOCOMO recognizes that robust corporate governance
is an important management issue for the purpose
of achieving ongoing growth in corporate value,
and accordingly, the Company is working to steadily
enhance its corporate governance.
Corporate Governance
40 OPENING DOORS : MANAGEMENT SYSTEM AND CSR : CORPORATE GOVERNANCE

As of July 1, 2009
DOCOMO’s Business Execution and Management Supervision Mechanism
General Meeting of Shareholders
CorporateAuditors’ Office
Internal AuditDepartment
Board of Directors 13 (of which 1 is an outside director)
Board of Corporate Auditors5 (of which 3 are outside corporate auditors)
Advisory Board
Independent Registered Public Accountants
Division General Managers, Branch General Managers, and others
Executive Vice President (Corporate Officer)
Senior Vice President(Corporate Officer)
Election / dismissal of directors Election / dismissal of Corporate Auditors
Advice
SuperviseAppointment / dismissal Report
Audit
Report
Monitor Report Liaise
Appointment / dismissal
Liaise
Internal audit
Transfer business execution authorityReference and reporton important matters
Accounting audit
Management Committee
Internal Control Committee
President and Chief Executive Officer
The Company’s corporate auditors promote mutual understanding and
information-sharing with the corporate auditors of subsidiaries. Corporate
auditors ensure the effectiveness of audits by collaborating and exchanging
information on audit plans and results with the Internal Audit Department,
an independent unit established to perform internal audits of the Company,
and our registered public accountants on a regular basis.
MANAGEMENT INCORPORATING OBJECTIVE EXPERT OPINION
The Company has established an advisory board composed of experts in
various fields, including an advisory board in the United States to receive
advice from a global viewpoint. In this way, the opinions and proposals
of advisory board members are reflected in management. To ensure that
we receive a diverse range of advice, advisory board members are invited
from a wide array of fields and include financial experts, academics,
commentators, and journalists.
COMPENSATION OF DIRECTORS AND CORPORATE AUDITORS
Matters regarding the compensation of directors are determined by the
Board of Directors. The compensation of directors (excluding outside
directors) comprises monthly compensation as well as bonuses. Monthly
compensation is paid in accordance with such factors as the importance
and scope of responsibilities for each management level. Bonuses are paid
in consideration of such factors as the Company’s results. To reflect results
over the medium-to-long term, a portion of monthly compensation is
contributed to a director stock purchase plan. The shares of the Company
that are purchased through the plan are held throughout the term of office.
In consultation with the corporate auditors, it has been decided to pay
only monthly compensation to corporate auditors in order to ensure a high
degree of independence.
The aggregate compensation, paid to the directors and corporate
auditors during the fiscal year ended March 3�, �009, was as follows:
Aggregate Compensation Paid to Directors and Corporate Auditors Millions of yen
Position Number Total Compensation
Director s �5 50�
Corporate Auditors 7 ��9
Total �� 63�
The above total includes the following compensation to outside directors
Total amount of compensation
for the outside directors 3 69
RELATIONSHIP WITH PARENT COMPANY The corporate group led
by our parent company, NTT, operates a wide array of telecommunications
services, including local, long-distance, international, and mobile and data
telecommunications services. As of March 3�, �009, NTT owned 66.�9%
of the voting rights of the Company and was in a position to influence
the Company’s management decision-making through the exercise of
majority shareholder rights. However, the Company has its own manage-
ment responsibility and conducts operational management in accordance
with its own decision-making.
INVESTOR RELATIONS ACTIVITIES Our efforts to achieve transparency
in management include timely and fair disclosure of management infor-
mation, enabled by developing disclosure controls and procedures. We are
also implementing IR activities with an emphasis on fair disclosure, such
as simultaneously disseminating IR information through the Internet and
streaming results presentations in real time. We are also working to create
opportunities for direct communication between our top management and
investors, such as through presentations for institutional investors in Japan
and overseas and IR seminars targeted at individual investors. The opinions
the Company receives are duly considered in the management of the
Company and are also shared internally to improve our services and
operating results.
4�
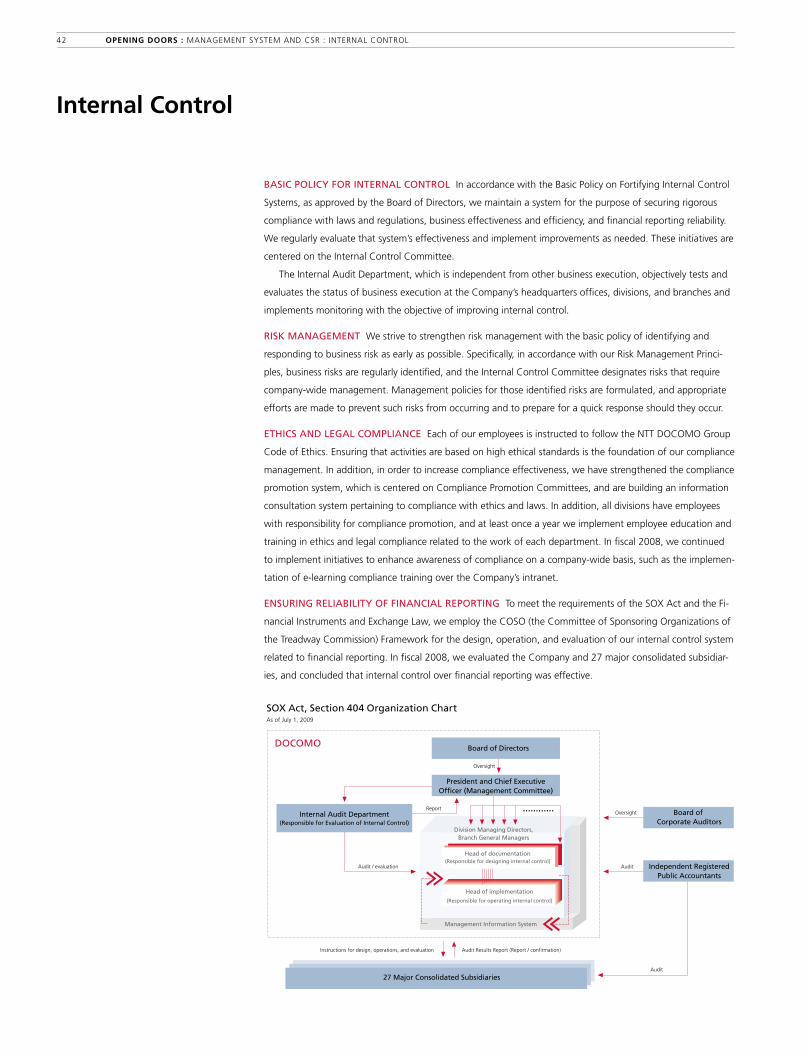
BASIC POLICY FOR INTERNAL CONTROL In accordance with the Basic Policy on Fortifying Internal Control
Systems, as approved by the Board of Directors, we maintain a system for the purpose of securing rigorous
compliance with laws and regulations, business effectiveness and efficiency, and financial reporting reliability.
We regularly evaluate that system’s effectiveness and implement improvements as needed. These initiatives are
centered on the Internal Control Committee.
The Internal Audit Department, which is independent from other business execution, objectively tests and
evaluates the status of business execution at the Company’s headquarters offices, divisions, and branches and
implements monitoring with the objective of improving internal control.
RISK MANAGEMENT We strive to strengthen risk management with the basic policy of identifying and
responding to business risk as early as possible. Specifically, in accordance with our Risk Management Princi-
ples, business risks are regularly identified, and the Internal Control Committee designates risks that require
company-wide management. Management policies for those identified risks are formulated, and appropriate
efforts are made to prevent such risks from occurring and to prepare for a quick response should they occur.
ETHICS AND LEGAL COMPLIANCE Each of our employees is instructed to follow the NTT DOCOMO Group
Code of Ethics. Ensuring that activities are based on high ethical standards is the foundation of our compliance
management. In addition, in order to increase compliance effectiveness, we have strengthened the compliance
promotion system, which is centered on Compliance Promotion Committees, and are building an information
consultation system pertaining to compliance with ethics and laws. In addition, all divisions have employees
with responsibility for compliance promotion, and at least once a year we implement employee education and
training in ethics and legal compliance related to the work of each department. In fiscal �008, we continued
to implement initiatives to enhance awareness of compliance on a company-wide basis, such as the implemen-
tation of e-learning compliance training over the Company’s intranet.
ENSURING RELIABILITY OF FINANCIAL REPORTING To meet the requirements of the SOX Act and the Fi-
nancial Instruments and Exchange Law, we employ the COSO (the Committee of Sponsoring Organizations of
the Treadway Commission) Framework for the design, operation, and evaluation of our internal control system
related to financial reporting. In fiscal �008, we evaluated the Company and �7 major consolidated subsidiar-
ies, and concluded that internal control over financial reporting was effective.
As of July 1, 2009
Head of implementation
(Responsible for operating internal control)
Management Information System
Board of Directors
Board of Corporate Auditors
Independent RegisteredPublic Accountants
President and Chief ExecutiveOfficer (Management Committee)
Internal Audit Department(Responsible for Evaluation of Internal Control)
27 Major Consolidated Subsidiaries
Head of documentation(Responsible for designing internal control)
SOX Act, Section 404 Organization Chart
DOCOMO
Oversight
ReportOversight
Audit / evaluation Audit
Audit
Instructions for design, operations, and evaluation Audit Results Report (Report / confirmation)
Division Managing Directors,Branch General Managers
............
Internal Control
4� OPENING DOORS : MANAGEMENT SYSTEM AND CSR : INTERNAL CONTROL

Specific Initiatives
In working to strengthen information management,
we are advancing and developing the following safety
management measures:
(1) Physical Security
• Restrictions on numbers of information management ter-
minals, continuous optimization of installed locations and
authorized people
• Rigorous control of the lending and checking-out of porta-
ble information terminals (notebook PCs, etc.)
• Secure storage of all types of recording media, and strict
control of number stored and checking-in and checking-out
• Consolidation and special monitoring of terminals used to
extract large amounts of customer information (lists)
(Restricted room entry / biometric identity confirmation at
entry and exit / Usage-prevention and encryption measures
for media / Implementation of continuous monitoring
through monitoring cameras)
• Transition to paperless handling of documents, such as
customer applications
(2) Technical Security
• Periodic, mandatory password changes for information
management terminals
• Information system access-log retention and periodic
(monthly) checks
• Introduction of biometric identity confirmation for use of
customer information management systems
• Stricter customer information search parameters
• Prevention of misdirected faxes through the introduction
of virtual private networking (VPN) for fax lines (secure fax)
• Introduction of encryption software for information system
terminals
(3) Human Security
• Implementation of information management training
(more than once a year) for all employees, from top man-
agement to temporary employees, for Group companies,
and for customer service agents (DOCOMO shops, etc.)
• Production and distribution of various tools for use in
information management training
• Confirmation of implementation of information
management training and evaluation of effectiveness
(use of e-learning, etc.)
(4) Organizational Security
• Establishment of system for assignment of responsibility
for information management
• Advance confirmation of personal information manage-
ment status prior to conclusion of consignment contracts
• Mandatory conclusion of information protection agree-
ments and receipt of written pledges from all employees
• Uniform, periodic inspections at all work sites handling
customer information and audits by the head office
ENHANCEMENT OF INFORMATION MANAGEMENT SYSTEM The DOCOMO Group has been
entrusted with personal information (customer information) for 55 million people, and accordingly
ensuring information security is an important management issue.
As a telecommunications company with public-oriented operations, the rigorous management
and protection of customer information is our most important duty. The Information Management
Committee, which is led by the Vice President and Representative Officer (Chief Privacy Officer (CPO)),
meets on a regular basis. The committee considers and promotes personal information protection
measures. In addition, to advance integrated information management, we have established informa-
tion security departments and each work site has an employee who is responsible for information
management. Outside contractors who perform work for the Company are required to designate a
person responsible for the handling of that work for each organization and policy. We have established
and are advancing a system that assigns responsibility for personal information management in each
organization and operation.
FORMULATION OF MANAGEMENT AND ADMINISTRATION RULES To fulfill our obligations, in
regard to the handling of information of customers, shareholders, employees, etc., we have systemat-
ically formulated internal regulations in accordance with the Personal Information Protection Act and
the guidelines of related government ministries and agencies, clarified internal rules regarding infor-
mation management, and formulated and announced a privacy policy that clarifies detailed handling
policies in accordance with basic principles regarding customer information protection.
(http://www.nttdocomo.co.jp/english/utility/privacy/)
Information Management System
Information ManagementCommittee (Company-wide)
Executive Office (Information Security Department)
Chairman, Information Management CommitteeCPO: Chief Privacy Officer
(Senior Executive Vice President)
Information Committee Member
Vice Chairman, InformationManagement Committee(Managing Director of
Information Security Department)
Head Office (Offices, Branches)
Person Responsible for Information Management (Manager)
Person Responsible for Information Management – Deputy A
Person Responsible for Information Management (Manager)
Person Responsible for Information Management – Deputy D
Person Responsible for Information Management – Deputy A
Person Responsible forInformation Management – Deputy D
Regional Office
Person Responsible for Information Management (Managing Director of Regional Office)
Person Responsible for Information Management – Deputy (Regional Office Information Security Manager)
Regional Office (Offices, Branches)
As of July 1, 2009
......
Information Management
MANAGEMENT SYSTEM AND CSR : INFORMATION MANAGEMENT 43

DOCOMO’S CSR ACTIVITIES Through our business activities, we will strive to contribute to the realiza-
tion of a sustainable society. Our CSR Message articulates this approach.
FOUR CHALLENGES THAT DOCOMO WILL ADDRESS
Conservation of the global environment We have formulated the DOCOMO Global Environmental
Charter, and the entire Group is working together to respond to environmental issues, centered on increas-
ing the energy efficiency of handsets and communications facilities, using clean energy, and promoting
recycling and waste reduction. Initiatives to reduce emissions of greenhouse gases include the ICT Ecology
Project, which targets further reductions in the electricity consumption of communications equipment.
This project was launched in February �009, and we have begun testing to verify the practicality of leading-
edge technologies. Moreover, we will also continue to implement such initiatives as the use of natural ener-
gy, such as adoption of solar power systems, and the introduction of optical fiber connection base stations,
high-efficiency electrical power supply equipment, and high-efficiency air-conditioning systems. In the recy-
cling of mobile phones, we are strengthening our customer awareness and PR campaigns, and as of the end
of March �009, we had collected a cumulative total of 68.78 million used mobile phones. The “DOCOMO
Woods” forestation activities had been extended to 43 locations as of the end of March �009, and we plan
to expand these activities to all 47 prefectures in Japan during the fiscal year ending March 3�, �0�0.
Promotion of universal design Mobile phones have become an indispensable part of everyday life, and
DOCOMO is committed to providing products and services that are easy for all of our customers to use, in-
cluding the elderly and the disabled. To that end, we are implementing initiatives, known as Hearty Style,
to promote universal design (UD) in our products and shops.
We connect people to people, and people to their world. We open the door to the future.
In accordance with its CSR Message, DOCOMO implements CSR activities with the aim of
creating abundance and comfort in life and culture.
Creatingabundance andconvenience inlife and culture
Working for the individual user
We carefully design our services so that all of our customers will find them convenient and easy to use.
Reliable quality
We provide stable communications quality everywhere and at all times, and offer critical communications functions even in disasters and other emergency situations.
Safe and secure
We make a serious effort to deal with information security and other issues that arise in society as a result of the use of communications technologies.
Protecting the global environment
We reduce environmental impact in each process of our business activities, and work closely with our customers to protect the global environment.
We connect people to people, and people to their world. We open the door to the future.
Any time, any place, we connect people to people, and people to the future.
That is our mission at DOCOMO, in our aim to be a “Relation Service Company.”
We listen to each individual customer and to society.
We innovate toward the future. We create abundance and convenience in life and culture.
We address issues of the global environment and society, as part of our commitment
to contribute to sustainable development of the society.
CSR Message of NTT DOCOMO
Corporate Social Responsibility (CSR)
44 OPENING DOORS : MANAGEMENT SYSTEM AND CSR : CORPORATE SOCIAL RESPONSIBILITY (CSR)
In products, we have formulated Universal Design Guidelines. We are working to implement development
that reflects consideration for ease of use, and in August �008, we introduced the 706ie. Also, the cumula-
tive nationwide sales of Raku Raku PHONE series handsets, which have enjoyed a favorable reputation among
many users since their introduction in �999, exceeded �5 million in April �009. In shops, by taking such steps
as establishing counters based on UD principles, distributing guidebooks to staff members, and conducting
training, we are working to further enhance our shops in both tangible and intangible ways. In fiscal �008,
we took steps to make existing DOCOMO shops barrier-free, such as installing wheelchair ramps at entrances
and wheelchair accessible toilets (�49 shops in fiscal �008).
Realization of a safer, more secure mobile society The rapid adoption of mobile phones has facilitated
convenient, abundant communications. On the other hand, there has been an increase in incidents where mi-
nors can access inappropriate content or become involved in trouble. DOCOMO believes taking steps to deal
with these problems is a natural duty of a telecommunications company. To help resolve these problems, we
are working to implement educational activities regarding their safe use, such as Mobile Phone Safety Program
classes for minors, parents and teachers. From April �009, we began to offer Mobile Phone Safety Program
classes for seniors. These classes include countermeasures for telephone scams targeting seniors. In June �009,
we updated the video educational materials (DVD/VHS) that are used by various organizations to teach children
how to use mobile phones safely and securely. With the objective of making them even more widely used, we
distributed these materials to more than 33,000 Japanese elementary schools and junior high schools.
In regard to our access filtering services, the i-mode filter is compliant with third-party certification stan-
dards. In addition, we also began to offer web filtering, which limits access to web sites, and custom access
filtering, which makes it possible for customers to use separate filter settings to either permit or not permit
viewing in accordance with usage preferences. In addition, filtering has been made the default i-mode setting
for newly subscribing minors, and as a result the i-mode filter is turned on unless specifically requested
otherwise. Furthermore, with the April �, �009 enforcement of the Act on Establishment of Enhanced Envi-
ronment for Youth’s Safe and Secure Internet Use, we strongly recommend use of the filtering service when
new i-mode contracts are concluded. We are working to promote the further adoption of these services.
Wide-ranging response in times of disaster When earthquakes or other disasters occur, the safety
and reliability of communications networks are vitally important. Accordingly, we have formulated Three
Principles of Disaster Preparedness – (�) enhancing system reliability, (�) ensuring essential communications,
and (3) rapidly restoring communications services. Before the occurrence of a disaster, DOCOMO strives to
create telecommunications networks that can offer mobile phone connections in times of disaster and
that are highly safe and reliable. In an effort to secure means for communication in the event of a disaster,
we have constructed backup circuits and facilities by adopting multiple transmission lines or looped transport
circuits and installing redundancy systems in communication facilities or decentralizing equipment
installations, and reinforced the earthquake resistance of our buildings and radio towers, Also, through
the Area Mail emergency alert service, in December �007 we began to provide the earthquake early warn-
ings issued by the Japan Meteorological Agency. Since that time, we have provided these warnings nine
times, and this service has been introduced and is being used in 9 municipalities as a means of transmitting
disaster and emergency information to residents. In response to the June �008 Iwate–Miyagi Earthquake, we
secured the service area by deploying power supply vehicles and power generators as quickly as possible in
base stations where electricity supply was suspended. In addition, we provided free loans of mobile phones,
free phone battery charging services, etc., at emergency shelters following the earthquake.
Major CSR Evaluations
DJSI Asia Pacific Indexes DOCOMO is a
component of DJSI Asia Pacific, the Asia–Pacific
version of the DJSI (Dow Jones Sustainability
Indexes), which are global stock indexes for
socially responsible investing (SRI).
MS-SRI DOCOMO is a
component of the Morning-
star Socially Responsible
Investment Index (MS-SRI).
FTSE4Good Index
DOCOMO is a component
of the FTSE4Good Index,
an SRI index produced by
FTSE International Limited, a subsidiary of The
Financial Times, of the U.K., and the London
Stock Exchange.
oekom research
oekom research AG is
an independent CSR
evaluation company
based in Germany.
In the corporate responsibility rating for environ-
mental and social/cultural factors, DOCOMO
received a Prime rating as one of the �6 leaders
in the telecommunications industry.
Selected by Innovest Strategic
Value Advisors Inc. as “one of
the world’s 100 most sustain-
able companies.” The Global
�00 Most Sustainable Corpora-
tions in the World is a project
that was initiated by Corporate
Knights Inc., a Canadian publisher,
and Innovest Strategic Value
Advisors Inc., a U.S. SRI research company.
About �,800 major companies in a wide range
of industries are evaluated, and the top �00
companies in terms of superior performance on
social, environmental, and strategic governance
issues are selected for inclusion in the Global
�00 Most Sustainable Corporations in the World.
DOCOMO has been selected for inclusion in
the top �00 for five consecutive years, since the
project was launched in �005. >> For further information, please refer to the NTT DOCOMO Group CSR Report �009, which is scheduled
for publication in September �009, and the Company’s web site (http://www.nttdocomo.com/about/
csr/index.html)
45
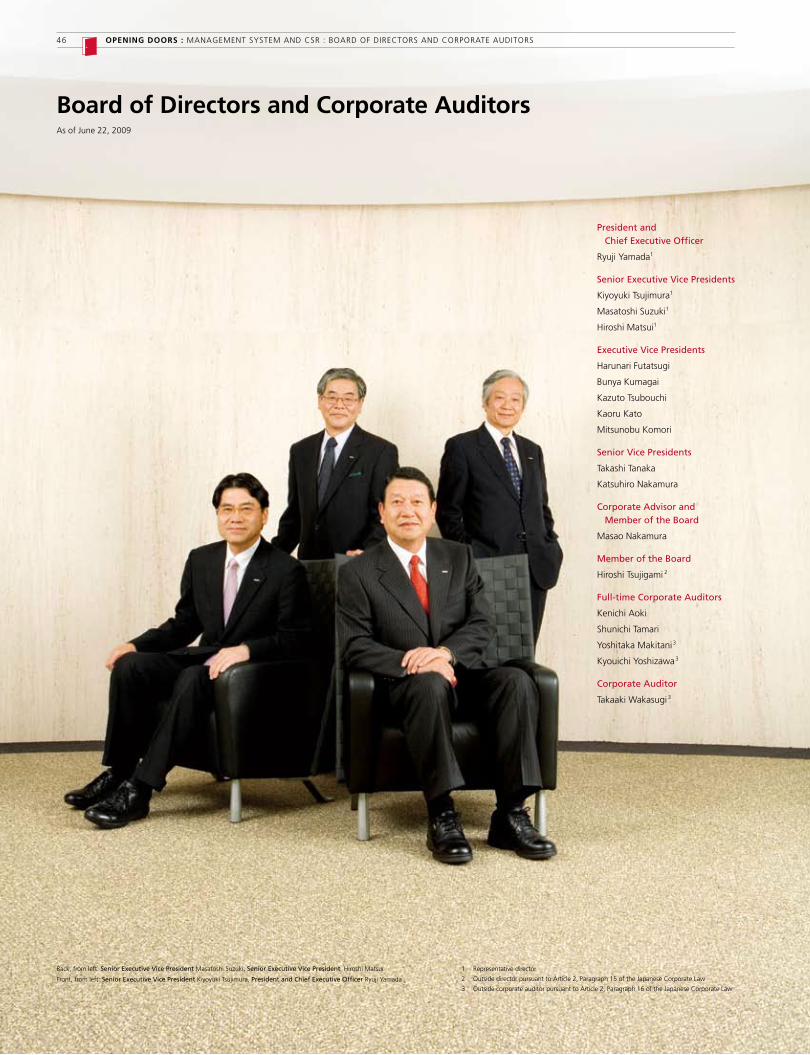
Board of Directors and Corporate AuditorsAs of June ��, �009
Back, from left: Senior Executive Vice President Masatoshi Suzuki, Senior Executive Vice President Hiroshi Matsui
Front, from left: Senior Executive Vice President Kiyoyuki Tsujimura, President and Chief Executive Officer Ryuji Yamada
President and Chief Executive Officer
Ryuji Yamada�
Senior Executive Vice Presidents
Kiyoyuki Tsujimura�
Masatoshi Suzuki�
Hiroshi Matsui�
Executive Vice Presidents
Harunari Futatsugi
Bunya Kumagai
Kazuto Tsubouchi
Kaoru Kato
Mitsunobu Komori
Senior Vice Presidents
Takashi Tanaka
Katsuhiro Nakamura
Corporate Advisor and Member of the Board
Masao Nakamura
Member of the Board
Hiroshi Tsujigami �
Full-time Corporate Auditors
Kenichi Aoki
Shunichi Tamari
Yoshitaka Makitani3
Kyouichi Yoshizawa3
Corporate Auditor
Takaaki Wakasugi3
� Representative director
� Outside director pursuant to Article �, Paragraph �5 of the Japanese Corporate Law
3 Outside corporate auditor pursuant to Article �, Paragraph �6 of the Japanese Corporate Law
46 OPENING DOORS : MANAGEMENT SYSTEM AND CSR : BOARD OF DIRECTORS AND CORPORATE AUDITORS

Financial Section Financial Summary (U.S. GAAP) 48
Operating and Financial Review and Prospects 50
A. Operating Results 50
B. Liquidity and Capital Resources 65
C. Research and Development 69
D. Trend Information 69
Risk Factors 71
Consolidated Financial Statements 76
Notes to Consolidated Financial Statements 81
Report of Independent Registered Public Accounting Firm 114
Reconciliations of the Disclosed NON-GAAP Financial Measures to
the Most Directly Comparable GAAP Financial Measures 115
47

Financial Summary (U.S. GAAP)NTT DOCOMO, INC. AND SUBSIDIARIES
Years ended March 31
48 OPENING DOORS : FINANCIAL SECTION : FINANCIAL SUMMARY (U.S. GAAP)
Millions of yen Millions of U.S. dollars1
(excluding per share data) (excluding per share data)
2005 2006 2007 2008 2009 2009
OperatingResults
Operating revenues ¥4,844,610 ¥4,765,872 ¥4,788,093 ¥4,711,827 ¥4,447,980 $ 44,861
Wireless services 4,296,537 4,295,856 4,314,140 4,165,234 3,841,082 38,740
Equipment sales 548,073 470,016 473,953 546,593 606,898 6,121
Operating expenses 4,060,444 3,933,233 4,014,569 3,903,515 3,617,021 36,480
Operating income 784,166 832,639 773,524 808,312 830,959 8,381
Other income (expense) 504,055 119,664 (581) (7,624) (50,486) (509)
Income before income taxes, equity in
net income of affiliates and
minority interests 1,288,221 952,303 772,943 800,688 780,473 7,872
Net income ¥ 747,564 ¥ 610,481 ¥ 457,278 ¥ 491,202 ¥ 471,873 $ 4,759
PerShareData2 (Yen and U.S. dollars)
Basic and diluted earnings per share ¥ 15,771 ¥ 13,491 ¥ 10,396 ¥ 11,391 ¥ 11,172 $ 112.67
Shareholders’ equity per share 84,455 91,109 95,457 100,321 103,966 1,048.57
Cash dividends declared per share3 2,000 4,000 4,000 4,800 4,800 48.41
1 Translations of the Japanese yen amounts into U.S. dollars are included solely for the convenience of readers by using the noon buying rate in New York City for cable transfers in foreign currencies as certified for customs purposes by the Federal Reserve Bank of New York on March 31, 2009, which was ¥99.15 to U.S.$1.00.
2 In the calculation of per share data, treasury stock is not included in the number of outstanding shares during or at the end of the year.3 Cash dividends declared per share are presented in the fiscal year to which each record date for the dividends belongs.
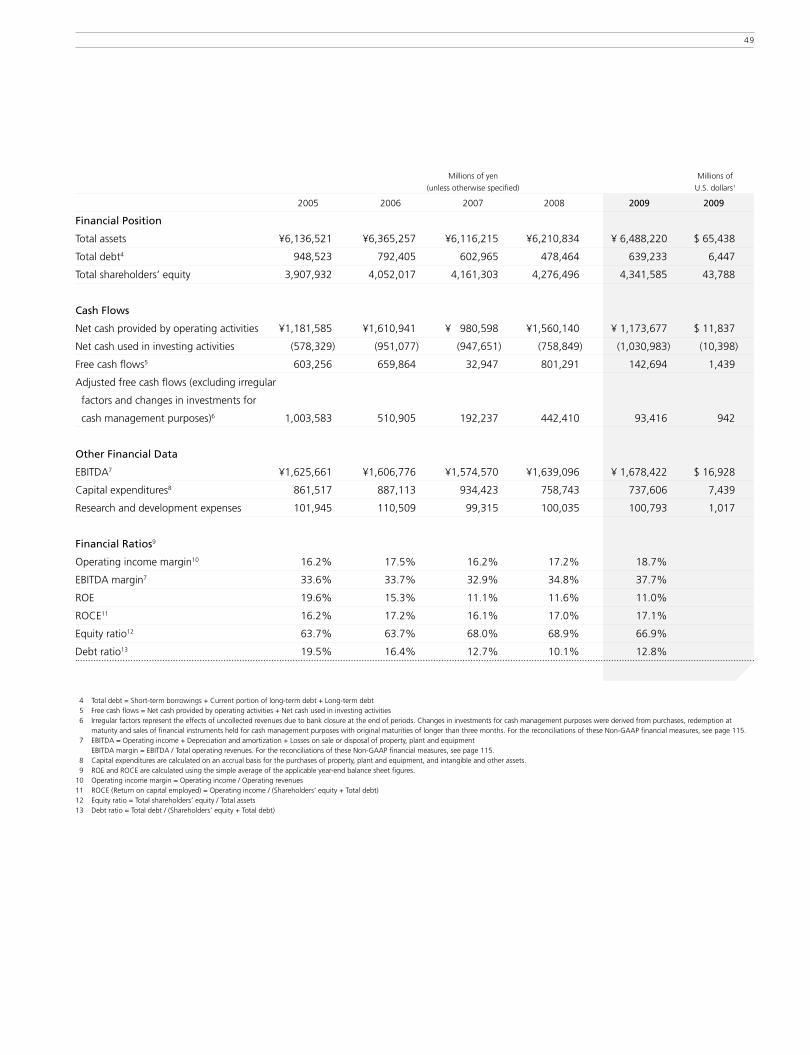
49
Millions of yen Millions of
(unless otherwise specified) U.S. dollars1
2005 2006 2007 2008 2009 2009
FinancialPosition
Total assets ¥6,136,521 ¥6,365,257 ¥6,116,215 ¥6,210,834 ¥ 6,488,220 $ 65,438
Total debt4 948,523 792,405 602,965 478,464 639,233 6,447
Total shareholders’ equity 3,907,932 4,052,017 4,161,303 4,276,496 4,341,585 43,788
CashFlows
Net cash provided by operating activities ¥1,181,585 ¥1,610,941 ¥ 980,598 ¥1,560,140 ¥ 1,173,677 $ 11,837
Net cash used in investing activities (578,329) (951,077) (947,651) (758,849) (1,030,983) (10,398)
Free cash flows5 603,256 659,864 32,947 801,291 142,694 1,439
Adjusted free cash flows (excluding irregular
factors and changes in investments for
cash management purposes)6 1,003,583 510,905 192,237 442,410 93,416 942
OtherFinancialData
EBITDA7 ¥1,625,661 ¥1,606,776 ¥1,574,570 ¥1,639,096 ¥ 1,678,422 $ 16,928
Capital expenditures8 861,517 887,113 934,423 758,743 737,606 7,439
Research and development expenses 101,945 110,509 99,315 100,035 100,793 1,017
FinancialRatios9
Operating income margin10 16.2% 17.5% 16.2% 17.2% 18.7%
EBITDA margin7 33.6% 33.7% 32.9% 34.8% 37.7%
ROE 19.6% 15.3% 11.1% 11.6% 11.0%
ROCE11 16.2% 17.2% 16.1% 17.0% 17.1%
Equity ratio12 63.7% 63.7% 68.0% 68.9% 66.9%
Debt ratio13 19.5% 16.4% 12.7% 10.1% 12.8%
4 Total debt = Short-term borrowings + Current portion of long-term debt + Long-term debt 5 Free cash flows = Net cash provided by operating activities + Net cash used in investing activities 6 Irregular factors represent the effects of uncollected revenues due to bank closure at the end of periods. Changes in investments for cash management purposes were derived from purchases, redemption at
maturity and sales of financial instruments held for cash management purposes with original maturities of longer than three months. For the reconciliations of these Non-GAAP financial measures, see page 115. 7 EBITDA = Operating income + Depreciation and amortization + Losses on sale or disposal of property, plant and equipment EBITDA margin = EBITDA / Total operating revenues. For the reconciliations of these Non-GAAP financial measures, see page 115. 8 Capital expenditures are calculated on an accrual basis for the purchases of property, plant and equipment, and intangible and other assets. 9 ROE and ROCE are calculated using the simple average of the applicable year-end balance sheet figures. 10 Operating income margin = Operating income / Operating revenues 11 ROCE (Return on capital employed) = Operating income / (Shareholders’ equity + Total debt) 12 Equity ratio = Total shareholders’ equity / Total assets 13 Debt ratio = Total debt / (Shareholders’ equity + Total debt)

Operating and Financial Review and Prospects
Youshouldreadthefollowingdiscussionofourfinancialconditionandresultsofoperationstogetherwithourconsolidated
financialstatementsandthenotestheretoincludedinthisannualreport.
Thisdiscussionandanalysiscontainsforward-lookingstatementsthatinvolverisks,uncertaintiesandassumptions.
Ouractualresultsmaydiffermateriallyfromthoseanticipatedintheseforward-lookingstatementsasaresultofcertain
factors,including,butnotlimitedto,thosesetforthunder“RiskFactors”andelsewhereinthisannualreport.
Wewilldiscussthefollowingmattersinthissection:
A. Operating Results • Our Business • Trends in the Mobile Communications Industry in Japan • Operating Strategies • Operating Trends • Operating Results for the years ended March 31, 2009
and 2008
• Segment Information • Recent Accounting Pronouncements and Critical Accounting
Policies B. Liquidity and Capital Resources C. Research and Development D. Trend Information
A.OPeRATingReSulTS
Our Business
We are the largest cellular network operator in Japan in terms of both revenues
and number of subscriptions. As of March 31, 2009, we had approximately
54.60 million subscriptions, which represented 50.8% of all cellular subscrip-
tions in Japan. We earn revenues and generate cash primarily by offering a
variety of wireless voice and data communications services and products. In
cellular services, which account for the majority of our revenues, we provide
voice communication services as well as “i-mode” services, which enable our
subscribers to exchange e-mails and to access various sources of information
including the Internet via our nationwide packet communications network.
In addition to cellular services, we presently provide wireless LAN services nation-
wide, a mobile credit payment platform and mobile credit payment services.
We have been the market leader in the Japanese mobile communications
industry as the demand for mobile communications has grown very rapidly.
Now that a cellular phone has already become a part of daily life in Japan, it
is difficult to duplicate the speedy growth we experienced in the first decade
of our operations. However, in order to achieve sustainable growth and
establish new sources of revenues, we are committed to upgrading our cellular
communications services from a telecommunication infrastructure to a life-
style infrastructure so that cellular services will be rooted even more deeply in
the daily lives of our subscribers and further enrich their lives and businesses.
Trends in the Mobile Communications Industry in Japan
According to a release from the Telecommunications Carriers Association, the
mobile communications market in Japan saw a 4.71 million net increase in
cellular and PHS subscriptions for the year ended March 31, 2009. As of
March 31, 2009, the total number of wireless subscriptions including cellular
and PHS reached 112.05 million and the market penetration rate reached
87.7%. The annual growth rate of cellular subscriptions dropped to 4.6% for
the year ended March 31, 2009 after a temporary rebound in a recent
downward trend from 5.4% to 6.2% for the years ended March 31, 2007
and 2008, respectively. However, given the maturity of the market and the
declining population trend, we expect that the growth rate of cellular
subscriptions in Japan will be limited in the future.
As of March 31, 2009, cellular services were provided by four network
operators including us and their subsidiaries in Japan. In addition to providing
cellular services, the network operators also collaborate with handset
manufacturers to develop handsets compatible with the specifications of their
wireless services and then sell them primarily to agent resellers, who in turn
sell such handsets to the subscribers. As for cellular services, since the year
2001, when we first launched “FOMA” services, our third generation (“3G”)
cellular services based on W-CDMA technology, our competitors have
followed us in the launch of their 3G services. The network operators have
been in an intense competition in pursuit of the acquisition of new subscribers
and the migration of their current subscribers to 3G services. As of March 31,
2009, the number of 3G service subscriptions in Japan reached 99.63 million,
which represented 92.7% of the total number of cellular subscriptions.
Competition among the network operators in Japan has become more
intense under present market conditions as the needs of subscribers diversify
and growth in new subscriptions slows. The network operators in Japan have
been eager to differentiate themselves as they pursue the acquisition of new
subscriptions and encourage the migration of their current subscribers to 3G
services. The differentiation efforts include:
• Offering of free voice calls among family members under the same
discount account with the same operators, free voice calls among sub-
scribers under the same corporate subscription account with the same
operators, introduction of new discount services to cut basic monthly 200920082007
mova
0
10,000
20,000
30,000
40,000
50,000
60,000
52,621 53,388 54,601
17,092(32.5%)
9,438(17.7%)
35,529(67.5%)
43,949(82.3%)
5,560(10.2%)
49,040(89.8%)
Number of Cellular Subscriptions
Thousands
Years ended March 31
FOMA
50 OPENING DOORS : FINANCIAL SECTION : OPERATING AND FINANCIAL REvIEW AND PROSPECTS

charges by half upon commitment of long-term subscriptions, and
introduction of packet flat-rate services;
• Introduction of installment sales for handsets and mobile phone
protection and delivery service;
• Launching of new services such as providing mobile credit payment
services, music downloading, video downloading and streaming, news
casting, customized information delivery service, web-browsing filtering,
location information services and high-speed data transmission;
• Equipping new handsets with various new functions including a Tv tuner,
radio tuner, music player, video player, contact-less IC (Integrated Circuit)
chip capability, GPS (Global Positioning System), enlarged memory
capability, compatibility with GSM network or security function; and
• Partnering with entities of different industries including retail,
manufacturing and financial institutions.
Recently, domestic deregulation of the industry has accelerated competition
among cellular network operators, who have already implemented discounts
in their service charges. Mobile Number Portability, which enables subscribers
to switch subscriptions from one operator to another without changing their
telephone numbers, was introduced in October 2006. In September 2007, the
Mobile Business Study Group, which was appointed by the Ministry of Internal
Affairs and Communications, concluded a report in which it proposed certain
actions to be taken by regulatory authorities including (1) reformation on
methods of cellular handset sales, (2) promotion of new MvNO entrants to the
market and (3) development of the market environment to invigorate the
mobile business. Although some of these proposals have been already imple-
mented, further implementation of these proposals by the regulatory authori-
ties is expected to change revenue structures and business models of
incumbent cellular network operators including us.
It is possible that innovations in Internet technology will have a material
impact on the mobile communications industry as well. IP (Internet Protocol)
phone, voice communications based on IP technology, is becoming a popular
means of fixed line communications as a result of the penetration of local
broadband access. If IP phone technology is applied to the mobile communi-
cations field, we expect that it will have a material impact on the current
revenue structure of the mobile communications industry. The penetration
of local broadband access and cellular phones has produced an expectation
for new services in the future, converging fixed and mobile communications.
A “Fixed-Mobile Convergence” concept has already been partially realized
when some network operators issued a single bill for both fixed and mobile
subscriptions or others enable their subscribers to access common contents
or e-mail accounts via both a PC and a cellular phone. The demand for a
seamless service between the fixed and mobile network and a common
handset compatible with both fixed and mobile network service will possibly
increase in the future. In the field of high-speed wireless networks, WiMAX
has been standardized by the Institute of Electrical and Electronic Engineers
in the United States. In Japan, two network operators were licensed to
operate a 2.5GHz wide-band wireless broadband system in December 2007
and plan to launch commercial services during the year 2009.
Thus, we expect that the competitive environment for the mobile commu-
nications market will become increasingly severe in the future due to market,
regulatory and technology changes.
Operating Strategies
We recognize that the cellular market in Japan has already entered into a
phase of saturation as total cellular subscription exceeded 100 million in
December 2007. In a phase of saturation, it is necessary to attract subscribers
of competitors as it is difficult to rely on those who have not owned a cellular
phone as a driving force of acquisition of new subscriptions. It is also indis-
pensable to minimize the loss of subscriptions to competitors subsequent to
intensified competition. As a market leader, we have put a top priority on the
retention of our current subscriptions.
In November 2007, we abolished “handset sales incentives”, which were
one of the components of commissions we pay to agent resellers, and intro-
duced a new handset sales method or “value Course”, and a discounted
billing plan or “value Plan”. Subscriber acquisitions by offering inexpensive
discounted handsets by applying the “handset sales incentives” was an
adequate business model for the penetration of cellular subscription in a
growing market. However, as the market has moved into a matured phase,
such business model lacked transparency on the cost allocation of handsets
and network services, brought about unfairness on cost allocation among
subscribers dependent on the duration of subscriptions and put downward
pressure on the operating income of network operators.
“value Course” is a new handset sales method, where purchase of
a handset not discounted by the “handset sales incentive” awards the
subscriber with a subscription to a billing plan with discounted basic monthly
charges called “value Plan”. Payment in installments is available for purchase
of a handset in this “value Course”. If a subscriber chooses to make install-
ment payments, under agreements entered into among the subscriber, the
agent reseller and us, we provide financing by paying for the purchased
handset to the agent resellers and include the installment charge for the
purchased handset in the monthly bill for network usage for the installment
payment term. Because equipment sales are recognized upon delivery of
handsets to agent resellers, the advance payment for the purchased handset
to agent resellers and the subsequent cash collection of the installment
receivable for the purchased handset from subscribers do not have an impact
on our equipment sales, but do have an impact on cash flows from operating
activities. While we simultaneously introduced another handset sales method
called “Basic Course”, where a subscriber purchases a handset discounted
by our direct subsidy specifically designed for “Basic Course” and undis-
counted billing plans are applied, more than 90% of subscribers opted for
“value Course” under the new handset sales method and the number of
subscribers to “value Plan” exceeded 20 million as of March 31, 2009.
In August and September 2007, we also introduced new discount services
called “Fami-wari MAX50”, “Hitoridemo Discount50” and “Office-wari
MAX50” (“new discount services”), all of which discount basic monthly
charges by half upon the commitment of a two-year subscription, and more
than 60% of our subscribers utilized these new discount services as of March
31, 2009. We expect to realize the extension of subscriptions of current
subscribers and a continued decline in our churn rate through these new
handset sales methods and new discount services. Please refer to “B. Liquidity
and Capital Resources” for the impact of the introduction of “value Course”
on our financial position.
51

In April 2008, we announced “New DOCOMO Commitments”
re-positioning where we will stand in the future, and, taking this opportu-
nity, changed our corporate branding. We reorganized our group structure
in July 2008 by integrating eight regional subsidiaries for the purpose of
enhancing the speed and effectiveness of our operations. We also
announced our future business direction based on a new action plan
“DOCOMO’s Change and Challenge to Achieve New Growth” in October
2008. “DOCOMO’s Change” includes concrete actions to revisit every
aspect of business from the customer’s perspective from customer relations
to handsets and networks based on a thoroughly hands-on approach to
serving customers at all levels of our group under “New DOCOMO
Commitments”. “DOCOMO’s Challenge” includes action plans to drive
innovation in collaboration with a wide range of partners, committing us
to take on the challenges of creating new value by leveraging the virtually
unlimited potential of mobile phones by responding to further advancements
and diversifications in the mobile market, where development of services
that take advantage of unique mobile properties such as real time
immediacy, personal authentication, and GPS capabilities in conjunction
with the evolution of networks and handsets, as well as new services that
transcend conventional boundaries through the increasing adoption of
open-platform handsets and entry of new global players are taking place.
Operating Trends
This section describes our operating trends from the perspectives of revenues
and expenses.
Revenues
WirelessServices
We earn our wireless services revenues primarily from basic monthly charges,
calling charges for outgoing calls, revenues from incoming calls including
interconnection charges and charges for optional value-added services and
features. Cellular services, which earn the majority of our overall revenues,
consist of the third generation FOMA services, the second generation mova
services and other services. FOMA’s packet transmission technology allows
our subscribers to transmit more packets per minute and the per-packet
charges for data communications of FOMA services are set lower than those
of mova services. As mova subscribers have been steadily migrating to FOMA
services, we have decided to discontinue mova services on March 31, 2012
and focus our business resources on FOMA services. We will continue our
efforts to induce existing mova subscribers to migrate to FOMA services.
As of March 31, 2009, the number of FOMA subscriptions reached 49.04
million or 89.8% of our total number of cellular subscriptions, the largest
number of 3G subscriptions among cellular operators in Japan. Cellular
services revenues include voice revenues and packet communications
revenues. voice revenues are derived from a combination of basic monthly
charges for service and additional calling charges depending on connection
time. Our packet communications revenues, which are currently dominated
by i-mode revenues, accounted for a greater portion of our wireless services
revenues for the year ended March 31, 2009, representing 39.4% of wireless
services revenues, as compared to 33.0% and 28.8% for the years ended
March 31, 2008 and 2007, respectively. As a result of the continued
migration of mova subscribers to FOMA services, the portion of FOMA packet
communications revenues increased to 95.9% of the total packet communi-
cations revenues for the year ended March 31, 2009 from 91.3% and 78.2%
for the years ended March 31, 2008 and 2007, respectively.
Our top operational priorities include maintaining our current subscribers
and the level of our average monthly revenue per unit (“ARPU”) despite
the increasingly competitive market environment in which we are operating
after the introduction of Mobile Number Portability. Our cellular services
revenues are essentially a function of our number of active subscriptions
multiplied by ARPU.
Our number of subscriptions continues to grow while the growth rate of
subscriptions has declined. Our subscription churn rate, or contract termina-
tion rate, is an important performance indicator for us to achieve retention
of our current subscriptions. The churn rate has an impact on our number of
subscriptions and in particular affects our number of net additional subscrip-
tions for a given period. Efforts to reduce our churn rate through discount
services and other customer incentive programs can increase our revenues
by increasing our number of net additional subscriptions, but they can also
have an adverse impact on our revenues by decreasing the amount of
revenues we are able to collect from each subscriber on average. In order to
keep our churn rate low, we have focused on subscriber retention by imple-
menting certain measures including offering discounts for long-term
subscribers. During the year ended March 31, 2009, we have taken
2009200820070
2,000
1,000
3,000
4,000
5,000 4,788.1 4,711.8
4,314.1(90.1%)
4,165.2(88.4%)
474.0(9.9%)
546.6(11.6%)
4,448.0
3,841.1(86.4%)
Operating Revenues
Billions of yen
Years ended March 31
Wireless services
Equipment sales
606.9(13.6%)
2009200820070
2,000
1,000
3,000
4,000
5,000
4,314.1 4,165.2131.5
(3.0%)
1,242.2(28.8%)
2,940.4(68.2%)
146.2(3.5%)
1,373.9(33.0%)
2,645.1(63.5%)
1,511.7(39.3%)
2,149.6(56.0%)
3,841.1179.8
(4.7%)
Revenues from Wireless Services
Billions of yen
Years ended March 31
Cellular services voice revenues
Cellular services packet communications revenues
Other revenues*
* “PHS services revenues” for the years ended March 31, 2007 and 2008 has been reclassified into “Other revenues.”
52 OPENING DOORS : FINANCIAL SECTION : OPERATING AND FINANCIAL REvIEW AND PROSPECTS

53
2009200820070
2,000
1,000
3,000
4,000
5,000
6,000
7,000
8,000
6,7006,360
2,0102,200
4,6904,160
–5.1%
5,710
2,380
3,330
–10.2%
Aggregate ARPU (FOMA+mova)
Yen
Years ended March 31
Packet ARPU
Voice ARPU
measures such as lowering basic monthly charge of “Type SS value” billing
plan, introduction of new packet flat-rate services “Pake-hodai double” and
“Biz-hodai double”, enhancement of services for the loyalty membership
program “docomo Premier Club”, rollout of newly organized handset series,
expansion of FOMA high speed areas (achieved 100% POP coverage) and
on-site visits and investigations in response to customers’ claims for network
area quality, normally within 48 hours of contacts from our investigation
staffs. We also continued to release handsets such as “Kids’ PHONE”
designed specifically for children and “Raku-Raku PHONE PREMIUM”,
“Raku-Raku PHONE v” universally designed for elderly users in an effort
to pioneer such new market segments.
ARPU is calculated by dividing various revenue items included in operating
revenues from our wireless services, such as basic monthly charges, calling
charges and packet communications charges, from designated services by
the number of active subscriptions to the relevant services. ARPU is another
important performance indicator for us to measure average monthly revenues
per subscription. Accordingly, the calculation of ARPU excludes revenues that
are not representative of monthly average usage such as subscription activa-
tion fees. We believe that our ARPU figures calculated in this way provide
useful information to analyze the trend of monthly average usage of our
subscribers over time and the impact of changes in our billing arrangements.
The revenue items included in the numerators of our ARPU figures are based
on our U.S. GAAP results of operations. ARPU (FOMA+mova) has fallen over
the past few years, due to an increase in the number of subscribers to
“value Plan”, under which discounted monthly basic charges apply and new
discount services, as well as a gradual increase in the discount rate of basic
monthly charges according to an increase in the number of years of subscrip-
tions under long-term subscription discount. In order to boost ARPU, we
have been actively involved in the promotion of services including “Pake-
hodai double”, our optional packet flat-rate service for unlimited i-mode
usage, “i-channel”, a convenient and easy-to-use information push-delivery
optional service, and “i-concier”, an automated information delivery service
that is customized to suit each individual’s preferences and living area as if
one’s own butler or concierge would provide the service. We also introduced
more handsets compatible with international roaming service in order to
increase roaming revenues. Furthermore, we are promoting cellular usage
other than voice calls such as downloading of music or video-clips.
For the year ended March 31, 2007, although the decline in ARPU
continued, growth in the number of subscriptions, combined with our recog-
nition as revenue of the portion of “Nikagetsu Kurikoshi” (2 Month
CarryOver) allowance, a deferred revenue account, that was projected to
expire, resulted in an increase in cellular services revenues. Cellular services
revenues declined again during the year ended March 31, 2008 due to a
continued decline in ARPU as a result of the penetration of discount services
newly introduced for subscriber retention purposes. For the year ended
March 31, 2009, cellular services revenues continued to decline from the
prior year due to the penetration of “value Plan” and new discount services,
as well as a decrease of access charge revenues that we receive from other
operators for their network usage. We expect that the positive effects of the
moderate growth in the number of subscriptions and increase of packet
communications revenues will be more than offset by the negative effects
from the continued penetration of “value Plan” and new discount services,
and thus cellular services revenues will consequently decline for the year
ending March 31, 2010. Although ARPU has been on a declining trend, our
target is to halt the decline in fiscal year ending March 2012 when the effect
of an increase in packet ARPU overtakes the effect of a decrease in voice
ARPU. We intend to achieve sustainable growth by increasing revenues from
non-traffic business while we maintain the current level of revenues through
marketing activities with more focus on brand loyalty in the cellular business.
equipmentSales
We collaborate with handset manufacturers to develop handsets compatible
with our cellular services, purchase the handsets from those handset manufac-
turers and then sell those handsets to agent resellers for sale to our
subscribers. We had been offering handset series mainly comprising “FOMA
9 series”, which are equipped with most advanced functions, and “FOMA 7
series” which feature a sophisticated balance between unique designs and
functionalities. Starting from November 2008, as a response to market
changes such as maturity of the mobile phone market and diversification of
customer needs, we started to offer handsets in newly organized four series
which are closely attuned to the latest preferences and lifestyles of mobile
phone users – “docomo STYLE series”, “docomo PRIME series”, “docomo
SMART series” and “docomo PRO series”.
Revenues from equipment sales, primarily sales of handsets and other
telecommunications equipment to agent resellers, accounted for 13.6% of
total operating revenues for the year ended March 31, 2009. We adopted
Emerging Issues Task Force (“EITF”) Issue No. 01-9, “Accounting for
Consideration Given by a vendor to a Customer (Including a Reseller of the
vendor’s Products),” and therefore account for a portion of the sales
commissions that we pay to agent resellers as a reduction in equipment sales
revenues and selling, general and administrative expenses. As a result, struc-
turally, the cost of equipment sold has exceeded equipment sales revenues,
and thus the sale of an extra handset has had a negative impact on our
operating income. However, with the introduction of “value Course” in
November 2007, the amount of sales commissions deducted from equip-
ment sales revenues decreased significantly, and the effects of pushing down
operating income through the sale of handsets has lessened. During the year
ended March 31, 2009, equipment sales revenues before the deduction of
sales commissions to agent resellers decreased due mainly to the significant

decrease in the number of handsets sold to agent resellers affected by the
economic downturn and introduction of new sales method, in addition to
a decrease in revenue per handset. However, sales revenues after the
deduction of sales commissions increased significantly since the effect of
decrease in sales commission for “value Course” to be deducted from
equipment sales revenues was applied throughout the year. For the year
ending March 31, 2010, we expect a slight decrease in the number of
handsets sold to agent resellers reflecting a decreased demand of handsets
for new subscriptions given the high penetration rate of the mobile market.
Because the trend of handset sales is closely interrelated with the cost of
handsets sold, please refer to the “Cost of Equipment Sold” section below.
expansionofOurBusinessDomain
In addition to the further buildup of our competitiveness in the cellular
business, we are actively involved in the diversification of revenue sources.
The most significant is our credit services business. We seek to reposition our
cellular phones as tools more deeply rooted in the daily life of our subscribers
by enabling transactional settlements through the use of cellular phones
equipped with contact-less IC chips. We launched a credit card brand called
“iD” for card issuers in December 2005 and “DCMX” credit issuing services
via the “iD” platform in April 2006. For the year ended March 31, 2009, we
were actively involved in the acquisition of DCMX subscriptions, promotion
of credit usage and expansion of stores equipped with iD readers/writers.
We are confident that our mobile credit service is steadily penetrating the
market as the number of DCMX subscriptions reached 8.98 million while
the number of “iD” compatible readers/writers installed reached 0.41 million
as of March 31, 2009.
We also started to offer, in collaboration with Google, Inc., search-words
related advertisement on the search page of iMenu, a portal site of i-mode,
and promoted the value of the mobile phone as a powerful advertisement
medium. In addition, we are promoting investments and alliances with the
aim of expanding businesses in fields where mobile communications can
make great contributions. In April 2009, we announced a capital alliance
with OAK LAWN MARKETING, INC., one of the largest Tv shopping service
companies, in order to promote the mobile e-commerce market, which has
a potential for further growth.
Although contribution from the credit service business and advertisement
business to our results of operations have not yet become material, we will
continue to be engaged in accelerating the development of these businesses.
expenses
CostofServices
Cost of services represents the expenses we incur directly in connection with
providing our subscribers with wireless communication services and includes
the cost for usage of other operators’ networks, maintenance of equipment
or facilities and payroll for employees dedicated to the operations and
maintenance of our wireless services. Cost of services accounted for 24.1%
of our total operating expenses for the year ended March 31, 2009.
Communication network charges, which we pay for the usage of other
operators’ networks or for access charges, occupy the largest part of cost
of services, accounting for 36.3% of the total. The amount of our communi-
cation network charges is dependent on the number of our base stations
installed and rates set by the other operators. In recent years, our communi-
cation network charges have steadily declined as a result of our buildup of
our own back-bone network to replace circuits leased from NTT.
Communication network charges decreased for the year ended March 31,
2009 as well due mainly to the discount in charges of NTT’s leased circuits
and decrease of access charges payable to other operators. We expect that
the downward trend will continue and the communication network charges
will decrease for the year ending March 31, 2010.
CostofequipmentSold
Cost of equipment sold arises mainly from our procurement of handsets
for sale to our new or current subscribers, which is basically dependent on
the number of handsets sold to agent resellers and the purchase price per
handset. Cost of equipment sold represented 22.9% of our operating
expenses for the year ended March 31, 2009. For the year ended March 31,
2009, the purchase price per handset remained about the same level as in
the prior year although influenced by the introduction of newly organized
handset series line-up and an increase of per-unit development costs effected
by a decrease in the number of units purchased. The total number of
handsets sold decreased due to the introduction of new sales methods and
overall sluggish consumer spending. As a result, cost of equipment sold
decreased from the prior fiscal year. For the year ending March 31, 2010,
we expect that the level of the purchase price per handset will increase due
to an increase of material costs for enhanced features and a decrease in
handset procurement, but we also expect a slight decrease in the number of
handsets sold resulting from a decreasing demand of handsets for new
subscribers. As a result, we expect that cost of equipment sold will be about
the same level as in the current fiscal year for the year ending March 31, 2010.
We have taken some measures to control the cost of equipment sold.
We have saved on FOMA handset development cost by introducing a single-
chip LSI and common platforms for the handset operating system. We have
provided packaged software dedicated to our handsets to handset manufac-
turers to facilitate development of FOMA handsets to hold down cost of
equipment sold. In addition, we are planning to optimize the level of equip-
ment inventories as a part of efficiency improvements accompanied by a
review of handset logistics, such as integration of handset logistics contractors.
DepreciationandAmortization
We expense the acquisition cost of a fixed asset such as telecommunications
equipment, a network facility and software during its estimated useful life
as depreciation and amortization. Depreciation and amortization accounted
for 22.2% of our operating expenses for the year ended March 31, 2009.
In order to respond attentively to demand from our subscribers, we invested
in the FOMA services network during the year ended March 31, 2009.
Our investments in the FOMA network included:
• further enhancement of FOMA network service area quality;
• buildup of FOMA network capacity in response to an increase in data
traffic following the penetration of our packet flat-rate service for
unlimited i-mode usage; and
• further expansion of HSDPA service coverage. (achieved 100%
POP coverage)
54 OPENING DOORS : FINANCIAL SECTION : OPERATING AND FINANCIAL REvIEW AND PROSPECTS

55
Active capital expenditures in the FOMA network in recent years are
followed by an upward trend in depreciation and amortization expenses.
However, our capital expenditures in the FOMA network peaked in the fiscal
year ended March 31, 2007, and we expect that depreciation and amortiza-
tion expenses will show downward trend in the future. In addition, we have
been involved with cost saving efforts such as economized procurement,
design and installment of low-cost devices and improvements in construction
processes. Depreciation and amortization expenses for the year ended March
31, 2009 increased from the prior fiscal year, but the increase was caused
by the effect of accelerated depreciation charges of mova-related assets
through the changes in estimated useful lives accompanied by our decision
to discontinue mova services on March 31, 2012. Without this effect, depre-
ciation and amortization expenses would have decreased from the prior
fiscal year. Depreciation and amortization expenses are expected to decrease
for the year ending March 31, 2010 following the recent downward trend.
As for our capital expenditures, please refer to “Capital Expenditures” to
be hereinafter described.
Selling,generalandAdministrativeexpenses
Selling, general and administrative expenses represented 30.8% of our total
operating expenses for the year ended March 31, 2009. The primary compo-
nents included in our selling, general and administrative expenses are
expenses related to acquisition of new subscribers and retention of current
subscribers, the most significant of which was commissions paid to agent
resellers. While some of these commissions are linked to sales activities such
as new subscriptions and handset upgrades, others result from non-sales
activities such as processing of billing plan changes and handset repairs.
In addition, we provide subsidies directly to our subscribers in the form of
a discount to the handset price to be purchased subject to competition in
the market. As already discussed in the “Operating Strategies” section,
under the new handset sales method, we abolished “handset sales incen-
tives”, which were paid to agent resellers depending on the type of handset
a subscriber purchased.
We applied EITF 01-9 and therefore a portion of the sales commissions
paid to agent resellers is recognized as a deduction from equipment sales
revenues and selling, general and administrative expenses. Due to the
introduction of “value Course”, sales commissions, both before and after
the deduction of certain sales commissions to agent resellers, decreased for
the year ended March 31, 2009 compared with the prior fiscal year. For the
year ending March 31, 2010, we expect that the gross and net amount of
sales commissions will continue to decrease with the further penetration of
“value Course”.
Operatingincome
For the year ended March 31, 2009, a decrease in wireless services revenues,
due mainly to penetration of “value Course” and new discount services,
exceeded an increase in equipment sales, which resulted in a decrease in
operating revenues. On the other hand, a decrease in operating expenses
due mainly to a decrease in costs of equipment sold as well as sales commis-
sions subsequent to the introduction of “value Course” exceeded the decrease
in operating revenues. As a result, operating income increased. The factors
contributing to the increase in operating income are summarized as follows:
• cellular services revenues decreased due to a decrease in ARPU caused by
the penetration of “value Course” and new discount services, even though
the number of subscribers increased from the prior fiscal year. Equipment
sales increased from the prior fiscal year despite the decreased number of
units sold to agent resellers, because the sales commissions which are
deducted from the equipment sales revenues decreased significantly with
the introduction of “value Course”. Operating revenues decreased from
the prior fiscal year because the increase in equipment sales was not suffi-
cient enough to make up for the decrease in cellular services revenues.
• operating expenses decreased reflecting a decrease in cost of equipments
sold due to a fewer number of units being sold and a decrease in sales
commissions as a result of the penetration of “value Course”.
The market environment has become increasingly competitive after the
introduction of Mobile Number Portability. We will be engaged in reinforcing
our competitiveness by executing action plans of “DOCOMO’s Change and
Challenge” in the area of customer satisfaction, actions to expand usage,
creation of new revenue sources, and improvement of cost efficiency. For the
year ending March 31, 2010, we expect operating revenues to decrease and
operating income to remain the same level as the prior fiscal year for the
following reasons:
200920082007
Cost of services
Cost of equipment sold
Depreciation and amortization
Selling, general and administrative
0
2,000
1,000
3,000
4,000
5,000
4,014.6 3,903.5
745.3(18.5%)
1,283.6(32.0%)
776.4(19.9%)
1,150.3(29.5%)
1,218.7(30.4%)
767.0(19.1%)
811.1(20.8%)
1,165.7(29.9%)
3,617.0
804.2(22.2%)
827.8(22.9%)
872.4(24.1%)
1,112.6(30.8%)
Operating Expenses
Billions of yen
Years ended March 31
%
Operating Revenues, Operating Income and Operating Income Margin
Billions of yen
Years ended March 31
1,000
2,000
3,000
4,000
5,000 4,788.1 4,711.8
16.2 17.2
773.5 808.3
4,448.0
18.7
831.0 6
12
18
24
30
%
Operating Revenues, Operating Income, and Operating Income Margin
Billions of yen
Years ended March 31
0
1,000
2,000
3,000
4,000
5,000
Operating revenues (left)
Operating income (left)
Operating income margin (right)
4,788.1 4,711.8
16.2 17.2
773.5 808.3
4,448.0
18.7
831.0
0
6
12
18
24
30
200920082007

• we expect cellular services revenues to decrease because a continued
decline in ARPU caused by penetration of “value Plan”, for which the basic
monthly charge is discounted and penetration of new discount services
will more than offset the positive effect of our acquisition of new subscriptions;
• we expect equipment sales to increase despite the decreased number of
handsets sold through a continued decrease in sales commissions that are
deducted from sales revenue under the “value Course”. However, the
increase in equipment sales is not sufficient to make up for the decrease
in cellular services revenues; and
• we expect operating expenses to decrease through our continuous efforts
to lower costs including distributor commissions, network-related costs
and general expenditures. As a result, operating profits should remain
about the same level as prior fiscal year, as decrease in operating revenues
and operating expenses nearly offset each other.
Actions to expand cellular phone usage include the followings:
• offering billing plans that customers need not worry about charges,
improvement of handset functionalities, and promotion of packet commu-
nications by offering various contents; and
• increasing product line-ups and enhancement of sales for smart phones
and data communication terminals.
Creation of new revenue sources includes the followings:
• offering new services in the area of personalization, social support,
and converged services (such as “i-concier” and its subscriber growth);
• investments and alliances with the aim of expanding businesses in fields
where mobile communications can make great contributions;
• strengthening activities to boost usage of our DCMX credit services and
increase users; and
• promotion of usage of international calls and roaming services, and
growth through investment and partnership in Asia-Pacific regions.
Improvement of cost efficiency includes the followings:
• reduction of base station construction costs, streamlining of network,
and reduction of communication network charges; and
• further reduction of general expenses, operational process review
and operational efficiency improvement through integration of former
regional subsidiaries.
Otherincomeandexpenses
As part of our corporate strategy, we have made investments in foreign and
domestic companies in businesses that complement our mobile communica-
tions business. In accordance with U.S. GAAP, the investment is accounted
for under the equity method and recognized under “Investments in affili-
ates” in our consolidated balance sheets when our equity in the investee’s
issued and outstanding capital is between 20% and 50% or we are able to
exercise significant influence over the investee. In accordance with equity
method accounting, we include equity in net income or losses of affiliates in
our consolidated income. Where our equity in the investee’s issued and
outstanding capital is less than 20%, we include the investment as
“Marketable securities and other investments” in our consolidated balance
sheets. Our results of operations can be affected by impairments of such
investments and losses and gains on the sale of such investments. In the
past, we experienced material impairments in the value of our investments
in equity method affiliates that were included in “Equity in net losses of affil-
iates” in our consolidated statements of income and comprehensive income
for relevant years. It is possible that we could experience similar impairments
with respect to our investments in affiliates and marketable securities and
other investments again in the future. Please refer to “- Critical Accounting
Policies—Impairment of investments”. We may also experience material
gains or losses on the sale of our investments. As of March 31, 2009, the
total carrying value of our investments in affiliates was ¥572.0 billion, while
the total carrying value for investments in marketable equity securities and
equity securities accounted for under the cost method was ¥141.5 billion.
56 OPENING DOORS : FINANCIAL SECTION : OPERATING AND FINANCIAL REvIEW AND PROSPECTS
Operating Results for the year ended March 31, 2009
The following discussion includes analysis of our operating results for the year ended March 31, 2009. The tables below describe selected operating data and
income statement data:
KeyPerformanceindicators Years ended March 31
2008 2009 Increase (Decrease) Change (%)
CellularSubscriptions (thousands) 53,388 54,601 1,213 2.3%
FOMA services (thousands) 43,949 49,040 5,091 11.6%
mova services (thousands) 9,438 5,560 (3,878) (41.1)%
i-mode services (thousands) 47,993 48,474 481 1.0 %
Market Share (%)1, 2 52.0 50.8 (1.2) —
Aggregate ARPU (FOMA+mova) (yen/month/contract)3 6,360 5,710 (650) (10.2)%
voice ARPU (yen/month/contract)4 4,160 3,330 (830) (20.0)%
Packet ARPU (yen/month/contract) 2,200 2,380 180 8.2 %
MOU (FOMA+mova) (minutes/month/contract)3, 5 138 137 (1) (0.7)%
Churn Rate (%)2 0.80 0.50 (0.30) —
1 Source for other cellular telecommunications operators: Data announced by Telecommunications Carriers Association2 Data calculated including Communication Module Services subscriptions. 3 Data calculated excluding Communication Module Services-related revenues and Communication Module Services subscriptions. 4 Inclusive of circuit switched data communications.5 MOU (Minutes of usage): Average communication time per month per subscription

57
AnalysisofoperatingresultsfortheyearendedMarch31,2009
andcomparisonwiththepriorfiscalyear
As of March 31, 2009, the number of our cellular (FOMA+mova) subscrip-
tions reached 54.60 million and increased by 1.21 million (2.3%) from 53.39
million at the end of the prior fiscal year. We expect that the growth rate of
our cellular subscriptions will decelerate in the future as the growth rate of
cellular subscriptions declines due to the maturity of the market in Japan.
The number of FOMA subscriptions increased by 5.09 million (11.6%) to
49.04 million as of March 31, 2009 from 43.95 million at the end of the
prior fiscal year. The ratio of FOMA subscriptions to the total cellular
subscriptions reached 89.8% as of March 31, 2009. On the other hand,
the number of mova subscriptions, which has decreased since the year
ended March 31, 2004, decreased by 3.88 million (41.1%) to 5.56 million as
of March 31, 2009 from 9.44 million as of the end of the prior fiscal year.
We have decided to discontinue mova services on March 31, 2012 and focus
our business resources on FOMA services. Our market share decreased by
1.2 point to 50.8% as of March 31, 2009 from 52.0% as of the end of
the prior fiscal year. The number of i-mode subscriptions increased by 0.48
million (1.0%) to 48.47 million as of March 31, 2009 from 47.99 million
at the end of the prior fiscal year.
Aggregate ARPU of cellular (FOMA+mova) service decreased by ¥650
(10.2%) to ¥5,710 for the year ended March 31, 2009 from ¥6,360 in
the prior fiscal year. voice ARPU decreased by ¥830 (20.0%) to ¥3,330
for the year ended March 31, 2009 from ¥4,160 in the prior fiscal year.
This decrease in voice ARPU was due to the large increase in the number
of subscribers to “value Plan” and new discount services introduced in the
last fiscal year. Packet ARPU increased by ¥180 (8.2%) to ¥2,380 for the
year ended March 31, 2009 from ¥2,200 in the prior fiscal year. This increase
in packet ARPU was due to penetration of services such as “i-channel”,
which promote i-mode usage and of an optional packet flat-rate service
for unlimited i-mode usage, in addition to a raise in the i-mode
monthly subscription fee of ¥100 per month effective from June 2008.
Millions of yen
BreakdownofFinancialinformation Years ended March 31
2008 2009 Increase (Decrease) Change (%)
Operatingrevenues:
Wireless services ¥4,165,234 ¥3,841,082 ¥(324,152) (7.8)%
Cellular services revenues 4,018,988 3,661,283 (357,705) (8.9)%
–voice revenues6 2,645,096 2,149,617 (495,479) (18.7)%
Including: FOMA services 2,084,263 1,877,835 (206,428) (9.9)%
–Packet communications revenues 1,373,892 1,511,666 137,774 10.0%
Including: FOMA services 1,254,648 1,449,440 194,792 15.5%
Other revenues7 146,246 179,799 33,553 22.9%
Equipment sales 546,593 606,898 60,305 11.0%
Total operating revenues 4,711,827 4,447,980 (263,847) (5.6)%
Operatingexpenses
Cost of services 811,133 872,438 61,305 7.6%
Cost of equipment sold 1,150,261 827,856 (322,405) (28.0)%
Depreciation and amortization 776,425 804,159 27,734 3.6 %
Selling, general and administrative 1,165,696 1,112,568 (53,128) (4.6)%
Total operating expense 3,903,515 3,617,021 (286,494) (7.3)%
Operatingincome 808,312 830,959 22,647 2.8%
Otherincome(expense) (7,624) (50,486) (42,862) (562.2)%
incomebeforeincometaxes,equityinnetincome(losses)
ofaffiliatesandminorityinterests: 800,688 780,473 (20,215) (2.5)%
incometaxes 322,955 308,400 (14,555) (4.5)%
incomebeforeequityinnetincome(losses)ofaffiliatesandminorityinterests: 477,733 472,073 (5,660) (1.2)%
Equity in net income (losses) of affiliates (net of applicable taxes) 13,553 (672) (14,225) —
Minority interests (84) 472 556 —
netincome ¥ 491,202 ¥ 471,873 ¥ (19,329) (3.9)%
6 Inclusive of circuit switched data communications. 7 “PHS services revenues” for the year ended March 31, 2008 has been reclassified into “Other revenues.”

The MOU (FOMA+mova) decreased by 1 minute (0.7%) to 137 minutes from
138 minutes in the prior fiscal year.
Our churn rate for cellular subscriptions was 0.50% and 0.80% for the
years ended March 31, 2009 and 2008, respectively. The churn rate
decreased by 0.30 point and was one of the lowest levels, reflecting our
efforts to promote new sales methods and improve customer satisfaction.
We believe that, due to various factors, such as the implementation of
competitive billing arrangements, customer confidence in our network and
services and the introduction of new services, our churn rate was lower than
that of other operators. However, no assurance can be given that our churn
rate will decline or remain low.
During the year ended March 31, 2009, in order to improve customer
satisfaction, we have taken measures such as lowering basic monthly charge
of “Type SS value” billing plan, introduction of new packet flat-rate services
“Pake-hodai double” and “Biz-hodai double”, enhancement of services for
the loyalty membership program “docomo Premier Club”, rollout of newly
organized handset series, expansion of FOMA high speed areas (achieved
100% POP coverage) and on-site visits and investigations in response to
customers' claims for network area quality, normally within 48 hours of
contacts from our investigation staffs.
Operating revenues decreased by ¥263.8 billion (5.6%) to ¥4,448.0 billion
for the year ended March 31, 2009 from ¥4,711.8 billion in the prior fiscal
year. Wireless services revenues decreased by ¥324.2 billion (7.8 %) to
¥3,841.1 billion from ¥4,165.2 billion in the prior fiscal year. As a result,
wireless services accounted for 86.4% of operating revenues for the year
ended March 31, 2009, decreasing from 88.4% in the prior fiscal year. The
decrease in wireless services revenues resulted from a decrease in cellular
services revenues, especially voice revenues. The decrease in cellular services
revenues was a net of a decrease in voice revenues by ¥495.5 billion (18.7%)
to ¥2,149.6 billion from ¥2,645.1 billion in the prior fiscal year, and an
increase in packet communications revenues by ¥137.8 billion (10.0%) to
¥1,511.7 billion from ¥1,373.9 billion in the prior fiscal year. The factors for
the decrease in cellular services revenues and the increase in packet commu-
nications revenues were already discussed in the analysis of changes in
ARPU. voice revenues from FOMA services decreased by ¥206.4 billion
(9.9%) to ¥1,877.8 billion from ¥2,084.3 billion in the prior fiscal year, while
packet communications revenues increased by ¥194.8 billion (15.5%) to
¥1,449.4 billion from ¥1,254.6 billion in the prior fiscal year. Equipment sales
increased by ¥60.3 billion (11.0%) to ¥606.9 billion for the year ended
March 31, 2009 from ¥546.6 billion in the prior fiscal year because of a
decrease in sales commissions to be deducted from gross equipment sales
due to the introduction of “value Course”.
Operating expenses decreased by ¥286.5 billion (7.3%) to ¥3,617.0 billion
for the year ended March 31, 2009 from ¥3,903.5 billion in the prior fiscal
year. This decrease resulted mainly from a decrease in cost of equipments
sold by ¥322.4 billion (28.0%) to ¥827.9 billion for the year ended March
31, 2009 from ¥1,150.3 billion in the prior fiscal year and in selling, general
and administrative expenses, by ¥53.1 billion (4.6%) to ¥1,112.6 billion for
the year ended March 31, 2009 from ¥1,165.7 billion for the prior fiscal
year, due to the decrease in sales commissions through the penetration of
“value Course”. Cost of services increased by ¥61.3 billion (7.6%) to ¥872.4
billion for the year ended March 31, 2009 from ¥811.1 billion in the prior
fiscal year due to an increase in customer service related costs. Depreciation
and amortization increased by ¥27.7 billion (3.6%) to ¥804.2 billion for the
year ended March 31, 2009 from ¥776.4 billion in the prior fiscal year, due
to the effect of accelerated depreciation charges of mova-related assets
through the changes in estimated useful lives of such assets based on our
decision to discontinue mova services on March 31, 2012.
The operating income margin improved to 18.7% for the year ended
March 31, 2009 from 17.2% for the prior fiscal year. The decrease in cost
of equipment sold due to the decrease in the number of handsets sold and
the decrease in selling, general and administrative expenses contributed to
this improvement.
As a result of the foregoing, our operating income increased by ¥22.6
billion (2.8%) to ¥831.0 billion for the year ended March 31, 2009 from
¥808.3 billion for the prior fiscal year.
Other income (or expense) includes items such as interest income, interest
expense, gains and losses on sale of marketable securities and other invest-
ments and foreign exchange gains and losses. We accounted for ¥50.5
billion as other expenses for the year ended March 31, 2009 as we recorded
other than temporary impairment charges for marketable securities and
other investments of ¥57.8 billion. Other expenses increased by ¥42.9 billion
from ¥7.6 billion for the year ended March 31, 2008. For the year ended
March 31, 2009, other than temporary impairment charges included an
impairment of ¥26.3 billion for KT Freetel Co., Ltd. (KTF) common shares
based on its fair value as of March 31, 2009 in connection with the merger
between KTF and KT Corporation (KT) in June 2009, under which KTF shares
would be exchanged for KT common shares and KT exchangeable bonds.
Income before income taxes, equity in net income of affiliates and
minority interests decreased by ¥20.2 billion (2.5%) to ¥780.5 billion for the
year ended March 31, 2009 from ¥800.7 billion for the prior fiscal year.
Income taxes were ¥308.4 billion for the year ended March 31, 2009 and
¥323.0 billion in the prior fiscal year, representing effective income tax rates
of approximately 39.5% and 40.3%, respectively. We are subject to income
taxes imposed by various taxing authorities in Japan, including corporate
income tax, corporate enterprise tax and corporate inhabitant income taxes,
which in the aggregate amounted to a statutory income tax rate of approxi-
mately 40.8% and 40.9% for the years ended March 31, 2009 and 2008,
respectively. The Japanese government introduced various special tax benefits,
one of which enabled us to deduct from our taxable income a portion of
investments in research and development (“R&D investment tax incentive”).
The difference between our effective income tax rate and statutory income
tax rate for the year ended March 31, 2009 and 2008 arose primarily from
such special tax allowances. In addition, for the year ended March 31, 2009,
there was a tax refund of interests and penalties previously paid, which
lowered the effective income tax rate for the year ended March 31, 2009.
Equity in net losses of affiliates (net of applicable taxes) was ¥0.7 billion
for the year ended March 31, 2009 compared to net income of ¥13.6 billion
for the prior fiscal year. The decrease resulted from the adjustment to
reflect the earnings impact of purchase price allocations in Philippine Long
Distance Telephone Company, a telecommunications operator in the
Philippines (“PLDT”).
58 OPENING DOORS : FINANCIAL SECTION : OPERATING AND FINANCIAL REvIEW AND PROSPECTS
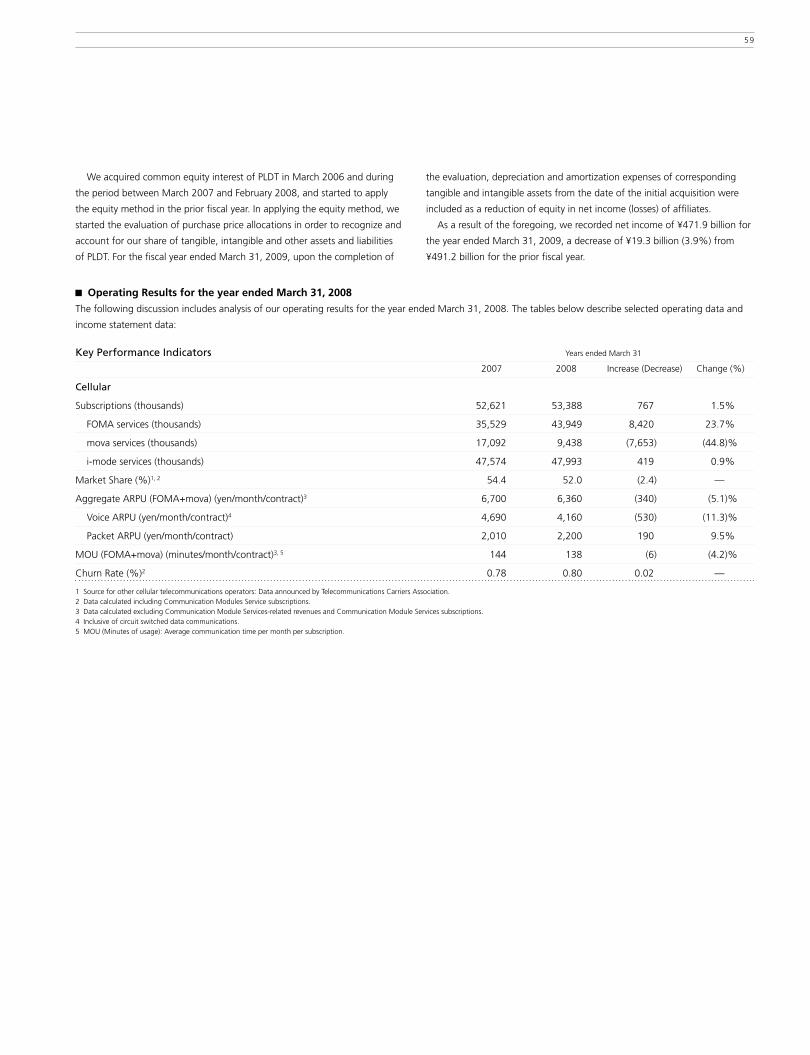
59
We acquired common equity interest of PLDT in March 2006 and during
the period between March 2007 and February 2008, and started to apply
the equity method in the prior fiscal year. In applying the equity method, we
started the evaluation of purchase price allocations in order to recognize and
account for our share of tangible, intangible and other assets and liabilities
of PLDT. For the fiscal year ended March 31, 2009, upon the completion of
the evaluation, depreciation and amortization expenses of corresponding
tangible and intangible assets from the date of the initial acquisition were
included as a reduction of equity in net income (losses) of affiliates.
As a result of the foregoing, we recorded net income of ¥471.9 billion for
the year ended March 31, 2009, a decrease of ¥19.3 billion (3.9%) from
¥491.2 billion for the prior fiscal year.
Operating Results for the year ended March 31, 2008
The following discussion includes analysis of our operating results for the year ended March 31, 2008. The tables below describe selected operating data and
income statement data:
KeyPerformanceindicators Years ended March 31
2007 2008 Increase (Decrease) Change (%)
Cellular
Subscriptions (thousands) 52,621 53,388 767 1.5%
FOMA services (thousands) 35,529 43,949 8,420 23.7%
mova services (thousands) 17,092 9,438 (7,653) (44.8)%
i-mode services (thousands) 47,574 47,993 419 0.9%
Market Share (%)1, 2 54.4 52.0 (2.4) —
Aggregate ARPU (FOMA+mova) (yen/month/contract)3 6,700 6,360 (340) (5.1)%
voice ARPU (yen/month/contract)4 4,690 4,160 (530) (11.3)%
Packet ARPU (yen/month/contract) 2,010 2,200 190 9.5%
MOU (FOMA+mova) (minutes/month/contract)3, 5 144 138 (6) (4.2)%
Churn Rate (%)2 0.78 0.80 0.02 —
1 Source for other cellular telecommunications operators: Data announced by Telecommunications Carriers Association. 2 Data calculated including Communication Modules Service subscriptions. 3 Data calculated excluding Communication Module Services-related revenues and Communication Module Services subscriptions. 4 Inclusive of circuit switched data communications.5 MOU (Minutes of usage): Average communication time per month per subscription.
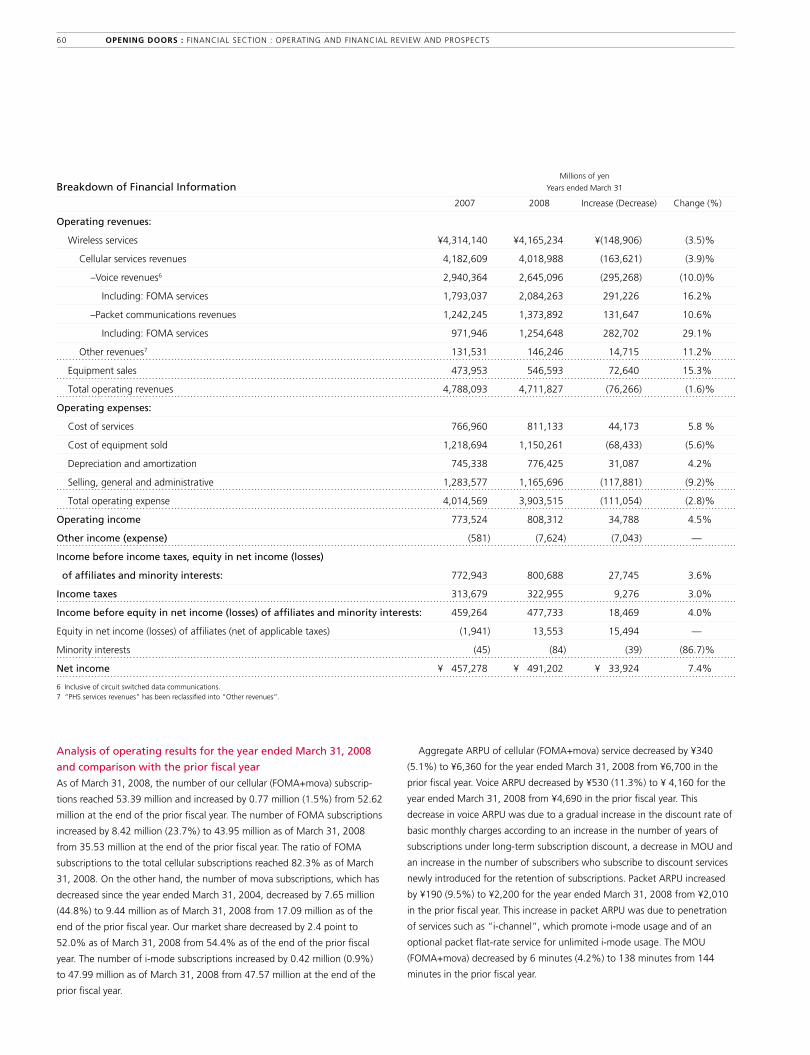
AnalysisofoperatingresultsfortheyearendedMarch31,2008
andcomparisonwiththepriorfiscalyear
As of March 31, 2008, the number of our cellular (FOMA+mova) subscrip-
tions reached 53.39 million and increased by 0.77 million (1.5%) from 52.62
million at the end of the prior fiscal year. The number of FOMA subscriptions
increased by 8.42 million (23.7%) to 43.95 million as of March 31, 2008
from 35.53 million at the end of the prior fiscal year. The ratio of FOMA
subscriptions to the total cellular subscriptions reached 82.3% as of March
31, 2008. On the other hand, the number of mova subscriptions, which has
decreased since the year ended March 31, 2004, decreased by 7.65 million
(44.8%) to 9.44 million as of March 31, 2008 from 17.09 million as of the
end of the prior fiscal year. Our market share decreased by 2.4 point to
52.0% as of March 31, 2008 from 54.4% as of the end of the prior fiscal
year. The number of i-mode subscriptions increased by 0.42 million (0.9%)
to 47.99 million as of March 31, 2008 from 47.57 million at the end of the
prior fiscal year.
Aggregate ARPU of cellular (FOMA+mova) service decreased by ¥340
(5.1%) to ¥6,360 for the year ended March 31, 2008 from ¥6,700 in the
prior fiscal year. voice ARPU decreased by ¥530 (11.3%) to ¥ 4,160 for the
year ended March 31, 2008 from ¥4,690 in the prior fiscal year. This
decrease in voice ARPU was due to a gradual increase in the discount rate of
basic monthly charges according to an increase in the number of years of
subscriptions under long-term subscription discount, a decrease in MOU and
an increase in the number of subscribers who subscribe to discount services
newly introduced for the retention of subscriptions. Packet ARPU increased
by ¥190 (9.5%) to ¥2,200 for the year ended March 31, 2008 from ¥2,010
in the prior fiscal year. This increase in packet ARPU was due to penetration
of services such as “i-channel”, which promote i-mode usage and of an
optional packet flat-rate service for unlimited i-mode usage. The MOU
(FOMA+mova) decreased by 6 minutes (4.2%) to 138 minutes from 144
minutes in the prior fiscal year.
60 OPENING DOORS : FINANCIAL SECTION : OPERATING AND FINANCIAL REvIEW AND PROSPECTS
Millions of yen
BreakdownofFinancialinformation Years ended March 31
2007 2008 Increase (Decrease) Change (%)
Operatingrevenues:
Wireless services ¥4,314,140 ¥4,165,234 ¥(148,906) (3.5)%
Cellular services revenues 4,182,609 4,018,988 (163,621) (3.9)%
–voice revenues6 2,940,364 2,645,096 (295,268) (10.0)%
Including: FOMA services 1,793,037 2,084,263 291,226 16.2%
–Packet communications revenues 1,242,245 1,373,892 131,647 10.6%
Including: FOMA services 971,946 1,254,648 282,702 29.1%
Other revenues7 131,531 146,246 14,715 11.2%
Equipment sales 473,953 546,593 72,640 15.3%
Total operating revenues 4,788,093 4,711,827 (76,266) (1.6)%
Operatingexpenses:
Cost of services 766,960 811,133 44,173 5.8 %
Cost of equipment sold 1,218,694 1,150,261 (68,433) (5.6)%
Depreciation and amortization 745,338 776,425 31,087 4.2%
Selling, general and administrative 1,283,577 1,165,696 (117,881) (9.2)%
Total operating expense 4,014,569 3,903,515 (111,054) (2.8)%
Operatingincome 773,524 808,312 34,788 4.5%
Otherincome(expense) (581) (7,624) (7,043) —
Incomebeforeincometaxes,equityinnetincome(losses)
ofaffiliatesandminorityinterests: 772,943 800,688 27,745 3.6%
incometaxes 313,679 322,955 9,276 3.0%
incomebeforeequityinnetincome(losses)ofaffiliatesandminorityinterests: 459,264 477,733 18,469 4.0%
Equity in net income (losses) of affiliates (net of applicable taxes) (1,941) 13,553 15,494 —
Minority interests (45) (84) (39) (86.7)%
netincome ¥ 457,278 ¥ 491,202 ¥ 33,924 7.4%
6 Inclusive of circuit switched data communications. 7 “PHS services revenues” has been reclassified into “Other revenues”.
61
Our churn rate for cellular subscriptions was 0.80% and 0.78% for the
years ended March 31, 2008 and 2007, respectively. The churn rate
increased by 0.02 point due to Mobile Number Portability. Although the
churn rate for the six months ended September 30, 2007 rose to 0.90%,
the introduction of new discount services in August and September 2007
and “value Course” in November 2007 helped lower the churn rate to
0.71% for the six months ended March 31, 2008.
During the year ended March 31, 2008, we implemented various
measures with focus on benefit for our subscribers, such as the introduction
of “value Course” and “value Plan”, new discount services, expansion of
HSDPA services areas, releases of attractive FOMA handsets and the
expansion of FOMA coverage areas, both indoors and outdoors.
Operating revenues decreased by ¥76.3 billion (1.6%) to ¥4,711.8 billion
for the year ended March 31, 2008 from ¥4,788.1 billion in the prior fiscal
year. Wireless services revenues decreased by ¥148.9 billion (3.5%) to
¥4,165.2 billion from ¥4,314.1 billion in the prior fiscal year. As a result,
wireless services accounted for 88.4% of operating revenues for the year
ended March 31, 2008, decreasing from 90.1% in the prior fiscal year.
The decrease in wireless services revenues resulted from a decrease in cellular
services revenues, especially voice revenues, and in PHS services revenues due
to our termination of PHS services in January 2008. The decrease in cellular
services revenues was a net of a decrease in voice revenues by ¥295.3 billion
(10.0%) to ¥2,645.1 billion from ¥2,940.4 billion in the prior fiscal year, and
an increase in packet communications revenues by ¥131.6 billion (10.6%)
to ¥1,373.9 billion from ¥1,242.2 billion in the prior fiscal year. The factors
for the decrease in cellular services revenues and the increase in packet
communications revenues were already discussed in the analysis of changes
in ARPU. The decrease in cellular services revenues was due partially to the
adverse impact of changes in estimates during the prior fiscal year regarding
initially recognizing as revenues the portion of “Nikagetsu Kurikoshi (2
Month CarryOver)” allowances that are estimated to expire. voice revenues
from FOMA services increased by ¥291.2 billion (16.2%) to ¥2,084.3 billion
from ¥1,793.0 billion in the prior fiscal year and packet communications
revenues also increased by ¥282.7 billion (29.1%) to ¥1,254.6 billion from
¥971.9 billion in the prior fiscal year. Equipment sales increased by ¥72.6
billion (15.3%) to ¥546.6 billion for the year ended March 31, 2008 from
¥474.0 billion in the prior fiscal year because of a decrease in sales commis-
sions to be deducted from gross equipment sales due to the introduction
of “value Course”.
Operating expenses decreased by ¥111.1 billion (2.8%) to ¥3,903.5 billion
for the year ended March 31, 2008 from ¥4,014.6 billion in the prior fiscal
year. This decrease resulted mainly from a decrease in selling, general and
administrative expenses, by ¥117.9 billion (9.2%) to ¥1,165.7 billion for the
year ended March 31, 2008 from ¥1,283.6 billion for the prior fiscal year,
due to the decrease in sales commissions subsequent to the introduction of
“value Course”. As the NTT Corporate Defined Benefit Pension Plan (“NTT
CDBP”) transferred its substitutional obligation and related plan assets of
the National Welfare Pension Plan to the government in February 2008,
the aggregate amount of ¥24.7 billion was recognized as a decrease in
operating expenses. Cost of services increased by ¥44.2 billion (5.8%)
to ¥811.1 billion for the year ended March 31, 2008 from ¥767.0 billion
in the prior fiscal year due to an increased number of FOMA base stations
installed. Depreciation and amortization increased by ¥31.1 billion (4.2%)
to ¥776.4 billion for the year ended March 31, 2008 from ¥745.3 billion in
the prior fiscal year, reflecting intensive capital expenditures on the FOMA
network in prior fiscal years.
The operating income margin improved to 17.2% for the year ended
March 31, 2008 from 16.2% for the prior fiscal year. The decrease in cost of
equipment sold due to the decrease in the number of handsets sold and the
decrease in selling, general and administrative expenses contributed to this
improvement.
As a result of the foregoing, our operating income increased by ¥34.8
billion (4.5%) to ¥808.3 billion for the year ended March 31, 2008 from
¥773.5 billion for the prior fiscal year.
Other income (or expense) includes items such as interest income, interest
expense, gains and losses on sale of marketable securities and other invest-
ments and foreign exchange gains and losses. We accounted for ¥7.6 billion
as other expenses for the year ended March 31, 2008. Other expenses
increased by ¥7.0 billion from ¥0.6 billion for the year ended March 31, 2007.
Income before income taxes, equity in net income of affiliates and
minority interests increased by ¥27.7 billion (3.6%) to ¥800.7 billion for the
year ended March 31, 2008 from ¥772.9 billion for the prior fiscal year.
Income taxes were ¥323.0 billion for the year ended March 31, 2008 and
¥313.7 billion in the prior fiscal year, representing effective income tax rates
of approximately 40.3% and 40.6%, respectively. We are subject to income
taxes imposed by various taxing authorities in Japan, including corporate
income tax, corporate enterprise tax and corporate inhabitant income taxes,
which in the aggregate amounted to a statutory income tax rate of approxi-
mately 40.9% for the years ended March 31, 2008 and 2007. The Japanese
government introduced various special tax benefits, one of which is R&D
investment tax incentive. The government also introduced an arrangement
where we could deduct a certain amount of investments in IT systems for
two years effective April 1, 2006. The difference between our effective
income tax rate and statutory income tax rate for the year ended March 31,
2008 and 2007 arose primarily from such special tax allowances.
Equity in net income of affiliates (net of applicable taxes) was ¥13.6 billion
for the year ended March 31, 2008 compared to net losses of ¥1.9 billion for
the prior fiscal year, due to the application of the equity method to our
investment in PLDT.
As a result of the foregoing, we recorded net income of ¥491.2 billion
for the year ended March 31, 2008, an increase of ¥33.9 billion (7.4%) from
¥457.3 billion for the prior fiscal year.
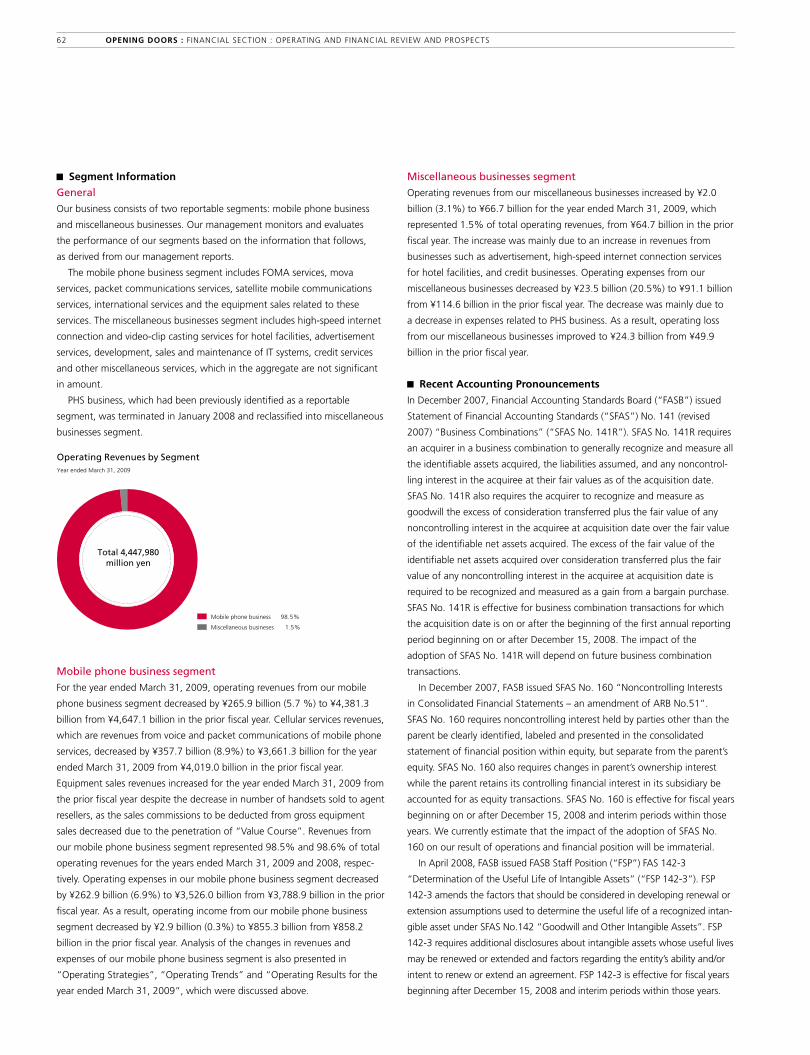
Segment Information
general
Our business consists of two reportable segments: mobile phone business
and miscellaneous businesses. Our management monitors and evaluates
the performance of our segments based on the information that follows,
as derived from our management reports.
The mobile phone business segment includes FOMA services, mova
services, packet communications services, satellite mobile communications
services, international services and the equipment sales related to these
services. The miscellaneous businesses segment includes high-speed internet
connection and video-clip casting services for hotel facilities, advertisement
services, development, sales and maintenance of IT systems, credit services
and other miscellaneous services, which in the aggregate are not significant
in amount.
PHS business, which had been previously identified as a reportable
segment, was terminated in January 2008 and reclassified into miscellaneous
businesses segment.
Mobilephonebusinesssegment
For the year ended March 31, 2009, operating revenues from our mobile
phone business segment decreased by ¥265.9 billion (5.7 %) to ¥4,381.3
billion from ¥4,647.1 billion in the prior fiscal year. Cellular services revenues,
which are revenues from voice and packet communications of mobile phone
services, decreased by ¥357.7 billion (8.9%) to ¥3,661.3 billion for the year
ended March 31, 2009 from ¥4,019.0 billion in the prior fiscal year.
Equipment sales revenues increased for the year ended March 31, 2009 from
the prior fiscal year despite the decrease in number of handsets sold to agent
resellers, as the sales commissions to be deducted from gross equipment
sales decreased due to the penetration of “value Course”. Revenues from
our mobile phone business segment represented 98.5% and 98.6% of total
operating revenues for the years ended March 31, 2009 and 2008, respec-
tively. Operating expenses in our mobile phone business segment decreased
by ¥262.9 billion (6.9%) to ¥3,526.0 billion from ¥3,788.9 billion in the prior
fiscal year. As a result, operating income from our mobile phone business
segment decreased by ¥2.9 billion (0.3%) to ¥855.3 billion from ¥858.2
billion in the prior fiscal year. Analysis of the changes in revenues and
expenses of our mobile phone business segment is also presented in
“Operating Strategies”, “Operating Trends” and “Operating Results for the
year ended March 31, 2009”, which were discussed above.
Miscellaneousbusinessessegment
Operating revenues from our miscellaneous businesses increased by ¥2.0
billion (3.1%) to ¥66.7 billion for the year ended March 31, 2009, which
represented 1.5% of total operating revenues, from ¥64.7 billion in the prior
fiscal year. The increase was mainly due to an increase in revenues from
businesses such as advertisement, high-speed internet connection services
for hotel facilities, and credit businesses. Operating expenses from our
miscellaneous businesses decreased by ¥23.5 billion (20.5%) to ¥91.1 billion
from ¥114.6 billion in the prior fiscal year. The decrease was mainly due to
a decrease in expenses related to PHS business. As a result, operating loss
from our miscellaneous businesses improved to ¥24.3 billion from ¥49.9
billion in the prior fiscal year.
Recent Accounting Pronouncements
In December 2007, Financial Accounting Standards Board (“FASB”) issued
Statement of Financial Accounting Standards (“SFAS”) No. 141 (revised
2007) “Business Combinations” (“SFAS No. 141R”). SFAS No. 141R requires
an acquirer in a business combination to generally recognize and measure all
the identifiable assets acquired, the liabilities assumed, and any noncontrol-
ling interest in the acquiree at their fair values as of the acquisition date.
SFAS No. 141R also requires the acquirer to recognize and measure as
goodwill the excess of consideration transferred plus the fair value of any
noncontrolling interest in the acquiree at acquisition date over the fair value
of the identifiable net assets acquired. The excess of the fair value of the
identifiable net assets acquired over consideration transferred plus the fair
value of any noncontrolling interest in the acquiree at acquisition date is
required to be recognized and measured as a gain from a bargain purchase.
SFAS No. 141R is effective for business combination transactions for which
the acquisition date is on or after the beginning of the first annual reporting
period beginning on or after December 15, 2008. The impact of the
adoption of SFAS No. 141R will depend on future business combination
transactions.
In December 2007, FASB issued SFAS No. 160 “Noncontrolling Interests
in Consolidated Financial Statements – an amendment of ARB No.51”.
SFAS No. 160 requires noncontrolling interest held by parties other than the
parent be clearly identified, labeled and presented in the consolidated
statement of financial position within equity, but separate from the parent’s
equity. SFAS No. 160 also requires changes in parent’s ownership interest
while the parent retains its controlling financial interest in its subsidiary be
accounted for as equity transactions. SFAS No. 160 is effective for fiscal years
beginning on or after December 15, 2008 and interim periods within those
years. We currently estimate that the impact of the adoption of SFAS No.
160 on our result of operations and financial position will be immaterial.
In April 2008, FASB issued FASB Staff Position (“FSP”) FAS 142-3
“Determination of the Useful Life of Intangible Assets” (“FSP 142-3”). FSP
142-3 amends the factors that should be considered in developing renewal or
extension assumptions used to determine the useful life of a recognized intan-
gible asset under SFAS No.142 “Goodwill and Other Intangible Assets”. FSP
142-3 requires additional disclosures about intangible assets whose useful lives
may be renewed or extended and factors regarding the entity’s ability and/or
intent to renew or extend an agreement. FSP 142-3 is effective for fiscal years
beginning after December 15, 2008 and interim periods within those years.
Total 4,447,980million yen
Mobile phone business 98.5%
Miscellaneous busineses 1.5%
Operating Revenues by SegmentYear ended March 31, 2009
62 OPENING DOORS : FINANCIAL SECTION : OPERATING AND FINANCIAL REvIEW AND PROSPECTS

63
We are currently evaluating the impact of adoption of FSP 142-3 on our result
of operations and financial position and considering the additional disclosures in
accordance with FSP 142-3.
In December 2008, FASB issued FSP FAS 132(R)-1 “Employers’ Disclosures
about Postretirement Benefit Plan Assets” (“FSP 132R-1”). FSP 132R-1
requires additional disclosures about investments polices and strategies,
major categories of plan assets, development of fair value measurements,
and concentrations of risk. FSP 132R-1 is effective for fiscal years ending
after December 15, 2009. The adoption of FSP 132R-1 will not have any
impact on our results of operations and financial position. We are currently
considering the additional disclosures in accordance with FSP 132R-1.
In April 2009, FASB issued FSP FAS 115-2 and FAS 124-2 “Recognition
and Presentation of Other-Than-Temporary Impairments” (“FSP 115-2 and
124-2”). FSP 115-2 and 124-2 amends the other than temporary impairment
guidance for debt securities to make the guidance more operational and
changes the presentation and disclosure of other than temporary impair-
ments on debt and equity securities in the financial statements. FSP 115-2
and 124-2 is effective for interim and annual periods ending after June 15,
2009. We are currently evaluating the impact of adoption of FSP 115-2 and
124-2 on our result of operations and financial position.
Critical Accounting Policies
The preparation of our consolidated financial statements requires our
management to make estimates about expected future cash flows and other
matters that affect the amounts reported in our financial statements in accor-
dance with accounting policies established by our management. Note 2 to
our consolidated financial statements includes a summary of the significant
accounting policies used in the preparation of our consolidated financial
statements. Certain accounting policies are particularly sensitive because of
their significance to our reported results and because of the possibility that
future events may differ significantly from the conditions and assumptions
underlying the estimates used and judgments relating thereto made by our
management in preparing our financial statements. Our senior management
has discussed the selection and development of the accounting estimates
and the following disclosure regarding the critical accounting policies with
our independent public accountants as well as our corporate auditors.
The corporate auditors attend meetings of the board of directors and certain
executive meetings to express their opinion and are under a statutory duty
to oversee the administration of our affairs by our directors and to examine
our financial statements. Our critical accounting policies are as follows.
usefullivesofproperty,plantandequipment,internaluse
softwareandotherintangibleassets
The values of our property, plant and equipment, such as the base stations,
antennas, switching centers and transmission lines used by our cellular
business, our internal-use software and our other intangible assets are
recorded in our financial statements at acquisition or development cost and
depreciated or amortized over their estimated useful lives. We estimate the
useful lives of property, plant and equipment, internal-use software and
other intangible assets in order to determine the amount of depreciation and
amortization expense to be recorded in each fiscal year. Our total deprecia-
tion and amortization expenses for the years ended March 31, 2009, 2008
and 2007 were ¥804.2 billion, ¥776.4 billion and ¥745.3 billion, respectively.
For the year ended March 31, 2009, depreciation and amortization expenses
included the effect of accelerated depreciation charges of mova-related assets
through the changes in estimated useful lives accompanied by our decision
to discontinue mova services on March 31, 2012. We determine the useful
lives of our assets at the time the assets are acquired and base our determi-
nations on expected usage, experience with similar assets, established laws
and regulations as well as taking into account anticipated technological or
other changes. The estimated useful lives of our wireless telecommunications
equipment are generally set at from 8 to 16 years. The estimated useful life
of our internal-use software is set at 5 years. If technological or other changes
occur more rapidly or in a different form than anticipated, new laws or regula-
tions are enacted, or the intended usage changes, the useful lives assigned
to these assets may need to be shortened, resulting in recognition of additional
depreciation and amortization expenses or losses in future periods.
impairmentoflong-livedassets
We perform an impairment review for our long-lived assets to be held and
used, including fixed assets such as our property, plant and equipment and
certain identifiable intangibles such as software for telecommunications
network, internal-use software and rights to use telecommunications facili-
ties of wire line network operators, whenever events or changes in circum-
stances indicate that the carrying amount of the assets may not be
recoverable. This analysis is separate from our analysis of the useful lives of
our assets, although it is affected by some similar factors. Factors that we
consider important and that can trigger an impairment review include, but
are not limited to, the following trends or conditions related to the business
that utilizes a particular asset:
• significant decline in the market value of an asset;
• loss of operating cash flow in current period;
• introduction of competitive technologies and services;
• significant underperformance of expected or historical cash flows;
• significant or continuing decline in subscriptions;
• changes in the manner of usage of an asset; and
• other negative industry or economic trends.
When we determine that the carrying amount of specific assets may not
be recoverable based on the existence or occurrence of one or more of the
above or other factors, we estimate the future cash inflows and outflows
expected to be generated by the assets over their expected useful lives. We
also estimate the sum of expected undiscounted future net cash flows based
upon historical trends adjusted to reflect our best estimate of future market
and operating conditions. If the carrying value of the assets exceeds the sum
of the expected undiscounted future net cash flows, we record an impair-
ment loss based on the fair values of the assets. Such fair values may be based
on established markets, independent appraisals and valuations or discounted
cash flows. If actual market and operating conditions under which assets are
used are less favorable or subscriber numbers are less than those projected
by management, either of which results in loss of cash flows, additional
impairment charges for assets not previously written-off may be required.

impairmentofinvestments
We have made investments in certain domestic and foreign entities. These
investments are accounted for under the equity method, cost method, or
at fair value as appropriate based on various conditions such as ownership
percentages, exercisable influence over the investments and marketability of
the investments. The total carrying value for the investments in affiliates was
¥572.0 billion, while the total carrying value for investments in marketable
equity securities and equity securities accounted for under the cost method
was ¥141.5 billion as of March 31, 2009. Equity method and cost method
accounting require that we assess if a decline in value or an associated event
regarding any such investment has occurred and, if so, whether such decline
is other than temporary. We perform a review for impairment whenever events
or changes in circumstances indicate that the carrying amount of an invest-
ment may not be recoverable. Factors that we consider important and that
can trigger an impairment review include, but are not limited to, the following:
• significant or continued declines in the market values of the investee;
• loss of operating cash flow in current period;
• significant underperformance of historical cash flows of the investee;
• significant impairment losses or write-downs recorded by the investee;
• significant changes in the quoted market price of public investee affiliates;
• negative results of competitors of investee affiliates; and
• other negative industry or economic trends.
In performing our evaluations, we utilize various information including
discounted cash flow valuations, independent valuations and, if available,
quoted market values. Determination of recoverable amounts sometimes
require estimates involving results of operations and financial position of
the investee, changes in technology, capital expenditures, market growth
and share, discount factors and terminal values.
In the event we determine as a result of such evaluations that there are
other than temporary declines in value of investment below its carrying
value, we record an impairment charge. Such write-down to fair value estab-
lishes a new cost basis in the carrying amount of the investment. The impair-
ment charge of investment in affiliates is included in “Equity in losses of
affiliates” while the impairment charge of marketable securities or equity
securities under the cost method is reflected in “Other income (expense)”
in our consolidated statements of income and comprehensive income. For
the year ended March 31, 2009, 2008 and 2007, we recorded impairment
charges accompanying with other than temporary declines in the values of
certain investee affiliates, but the impairment charges did not have a material
impact on our results of operations and financial position. We also recorded
impairment charges on certain investments which were classified as market-
able securities or equity securities under the cost method. For the year ended
March 31, 2009, the amount of impairment charges was ¥57.8 billion. For
the year ended March 31, 2008 and 2007, the impairment charges did not
have a material impact on our results of operations and financial position.
While we believe that the remaining carrying values of our investments
are nearly equal to their fair value, circumstances in which the value of an
investment is below its carrying amount or changes in the estimated
realizable value can require additional impairment charges to be recognized
in the future.
Deferredtaxassets
We record deferred tax assets and liabilities based on enacted tax rates for
the estimated future tax effects of carry-forwards and temporary differences
between the tax basis of an asset or liability and the amount reported in
the balance sheet. In determining the amounts of the deferred tax assets
or liabilities, we have to estimate the tax rates expected to be in effect
during the carry-forward periods or when the temporary differences reverse.
We recognize a valuation allowance against certain deferred tax assets when
it is determined that it is more likely than not some or all of future tax
benefits will not be realized. In determining the valuation allowance, we
estimate expected future taxable income and the timing for claiming and
realizing tax deductions and assess available tax planning strategies. If we
determine that future taxable income is lower than expected or that the tax
planning strategies cannot be implemented as anticipated, the valuation
allowance may need to be additionally recorded in the future in the period
when such determination is made.
Pensionliabilities
We sponsor a non-contributory defined benefit pension plan which covers
almost all of our employees. We also participate in the NTT CDBP, a contribu-
tory defined benefit welfare pension plan sponsored by NTT group.
Calculation of the amount of pension cost and liabilities for retirement
allowances requires us to make various judgments and assumptions
including the discount rate, expected long-term rate of return on plan assets,
long-term rate of salary increases and expected remaining service lives of our
plan participants. We believe that the most significant of these assumptions
in the calculations are the discount rate and the expected long-term rate of
return on plan assets. We determine an appropriate discount rate based on
current market interest rates on high-quality, fixed-rate debt securities that
are currently available and expected to be available during the period to
maturity of the pension benefits. In determining the expected long-term rate
of return on plan assets, we consider the current and projected asset alloca-
tions, as well as expected long-term investment returns and risks for each
category of the plan assets based on analysis of historical performances.
The rates are reviewed annually and we review our assumptions in a timely
manner when an event occurs that would have significant influence on the
rates or the investment environment changes dramatically.
64 OPENING DOORS : FINANCIAL SECTION : OPERATING AND FINANCIAL REvIEW AND PROSPECTS

65
Revenuerecognition
We defer upfront activation fees and recognize them as revenues over
the expected term of a subscription. Related direct cost to the extent of
the activation fee amount are also being deferred and amortized over the
same period. The reported amounts of revenue and cost of services are
affected by the level of activation fees, related direct cost and the estimated
length of the subscription period over which such fees and cost are
amortized. Factors that affect our estimate of the subscription period over
which such fees and cost are amortized include subscriber churn rate and
newly introduced or anticipated competitive products, services and
technology. The current amortization periods are based on an analysis of
historical trends and our experiences. For the years ended March 31, 2009,
2008 and 2007, we recognized as revenues deferred activation fees of ¥29.0
billion, ¥38.2 billion and ¥45.2 billion, respectively, as well as corresponding
amounts of related deferred cost. As of March 31, 2009, remaining unrecog-
nized deferred activation fees were ¥89.1 billion.
B.liquiDiTYAnDCAPiTAlReSOuRCeS
Cash Requirements
As discussed in “Operational Strategies” section of “A. Operating Results”, we
introduced a new handset sales method called “value Course” in November
2007. Under “value Course”, if a subscriber chooses to pay for a handset in
installments, we pay for the purchased handset to agent resellers and then
charge the installment receivable for the handset in the monthly bill to the
subscriber for the installment payment term. Thus, the advance payment for
the purchased handset to the agent reseller is likely to have an impact on our
cash flow and liquidity. Our cash requirements for the year ending March 31,
2010 include cash needed to pay for the purchased handsets to the agent
resellers, to expand our FOMA infrastructure, to invest in other facilities, to
make repayments for interest bearing liabilities and other contractual obliga-
tions and to pay for strategic investments, acquisitions, joint ventures or other
investments. We believe that cash generated from our operating activities,
future borrowings from banks and other financial institutions or future
The discount rates applied in determination of the projected benefit obligations as of March 31, 2009 and 2008, and expected long-term rates of return on
plan assets for the years ended March 31, 2009 and 2008 were as follows: Years ended March 31
2008 2009
Non-contributory defined benefit pension plan
Discount rate 2.3% 2.2%
Expected long-term rate of return on plan assets 2.5% 2.5%
Actual return on plan assets Approximately (9)% Approximately (17)%
NTT CDBP
Discount rate 2.3% 2.2%
Expected long-term rate of return on plan assets 2.5% 2.5%
Actual return on plan assets Approximately (5)% Approximately (12)%
The following table shows the sensitivity of our non-contributory defined benefit pension plan and the NTT CDBP as of March 31, 2009 to the change in the
discount rate or the expected long-term rate of return on plan assets, while holding other assumptions constant. Billions of yen
Accumulated other Change in Change in pension comprehensive projected benefit cost, before income, net of Change in assumptions obligation applicable taxes applicable taxes
Non-contributory defined benefit pension plan
0.5% increase/decrease in discount rate (12.0) / 12.9 0.3 / (0.2) 7.3 / (7.8)
0.5% increase/decrease in expected long-term rate of return on plan assets — (0.3) / 0.5 —
NTT CDBP
0.5% increase/decrease in discount rate (8.5) / 9.6 0.0 / (0.0) 5.1 / (5.7)
0.5% increase/decrease in expected long-term rate of return on plan assets — (0.3) / 0.3 —
Please also refer to Note 16 “Employees’ retirement benefits” to our consolidated financial statements for further discussion.
The amount of projected benefit obligations of our non-contributory
defined benefit pension plan as of March 31, 2009 and 2008 was ¥186.2
billion and ¥182.2 billion, respectively. The amount of projected benefit
obligations of the NTT CDBP as of March 31, 2009 and 2008, based on
actuarial computations which covered only DOCOMO employees’ participa-
tion, was ¥83.5 billion and ¥78.3 billion, respectively. The amount is subject
to a substantial change due to differences in actual performance or changes
in assumptions. In conjunction with the differences between estimates and
the actual benefit obligations, net losses in excess of 10% of the greater of
the projected benefit obligation or the fair value of plan assets are amortized
from “Accumulated other comprehensive income” over the expected
average remaining service life of employees in accordance with U.S. GAAP.

offerings of debt or equity securities in the capital markets will provide suffi-
cient financial resources to meet our currently anticipated capital and other
expenditure requirements and to satisfy our debt service requirements.
Although the overall environment surrounding the financial markets has been
negatively affected by the recent global financial crisis, we believe we have
enough financing ability supported by our high creditworthiness resulting from
our stable financial performance and strong financial standing. When we
determine the necessity for external financing, we take into consideration the
amount of cash demand, timing of payments, available reserves of cash and
cash equivalents and expected cash flows from operations. If we determine
that demand for cash exceeds the amount of available reserves of cash and
cash equivalents and expected cash flows from operations, we plan on
obtaining external financing through borrowing or the issuance of debt or
equity securities. Additional debt, equity or other financing may be required
if we underestimate our capital or other expenditure requirements, or
overestimate our future cash flows. There can be no assurance that such
external financing will be available on commercially acceptable terms or in
a timely manner.
Capital Expenditures
The wireless telecommunications industry is highly capital intensive because
significant capital expenditures are required for the construction of wireless
telecommunications network. Our capital requirements for our networks are
determined by the nature of facility or equipment, the timing of its install-
ment, the nature and the area of coverage desired, the number of
subscribers served in the area and the expected volume of traffic. They are
also influenced by the number of cells required in the service area, the
number of radio channels in the cell and the switching equipment required.
Capital expenditures are also required for information technology and servers
for Internet-related services.
Our capital expenditures for the year ended March 31, 2009 decreased
from the prior fiscal year. During the prior fiscal year, we made intensive
capital expenditures for expansion of the FOMA network to enhance our
competitiveness after the introduction of Mobile Number Portability.
During the year ended March 31, 2009, we added approximately 5,800
outdoor base stations for our FOMA services for an aggregate of approxi-
mately 48,500 installed base stations as of March 31, 2009. We also
promoted the installment of indoor systems for our FOMA services to
complete coverage of approximately 19,900 facilities as of March 31, 2009.
By taking measures such as conversion into IP networks, we were involved
with capacity enhancement and integration of network facilities along with
economized procurement, as well as efficient facility build-up and quality
improvements by selecting the most appropriate devices among various
types in consideration of conditions including surrounding environments and
traffic volumes.
Total capital expenditures for the years ended March 31, 2009, 2008 and
2007 were ¥737.6 billion, ¥758.7 billion and ¥934.4 billion, respectively.
For the year ended March 31, 2009, 66.4% of capital expenditures were
used for construction of the FOMA network, 1.5% for construction of the
second generation mova network, 13.6% for other cellular facilities and
equipment and 18.5% for general capital expenditures such as an internal
IT system. By comparison, in the prior fiscal year, 68.6% of capital expendi-
tures were used for construction of the FOMA network, 1.9% for the mova
network, 11.7% for other cellular facilities and equipment, and 17.8% for
general capital expenditures.
For the year ending March 31, 2010, we expect total capital expenditures
to be ¥690.0 billion, of which approximately 65.9% will be for the FOMA
network, 0.7% for the mova network, 13.0% for other cellular facilities
and equipment and 20.4% for general capital expenditures. We intend to
promote further quality improvement of FOMA service area, enhancement
of facilities against the increase of data traffic volume, as well as cost saving
and efficiency efforts of capital expenditures through economized procure-
ment, design and installment of low-cost devices, and improvements in
construction processes.
We currently expect that capital expenditures for the next few fiscal years
will be at a lower level primarily because capital expenditures related to
expanding, maintaining and upgrading our FOMA network already peaked
in the fiscal year ended March 31, 2007, resulting in an expected decrease
in subsequent fiscal years.
Our level of capital expenditures may vary significantly from expected
levels for a number of reasons. Capital expenditures for expansion and
enhancement of our existing cellular network may be influenced by the
growth in subscriptions and traffic, which is difficult to predict with certainty,
the ability to identify and procure suitably located base station sites on
commercially reasonable terms, competitive environments in particular
regions and other factors. The nature, scale and timing of capital expendi-
tures to reinforce our 3G network may be materially different from our
current plans due to demand for the services, delays in the construction of
the network or in the introduction of services and changes in the variable
cost of components for the network. We expect that these capital expendi-
tures will be affected by market demand for our mobile multimedia services,
including i-mode and other data transmission services, and by our schedule
for ongoing expansion of the existing network to meet demand.
200920082007
FOMAmovaOther cellular facilities and equipment
PHSGeneral capital expenditures
0
400
200
600
800
1,000 934.4
758.710.5%0.1%
16.2%
11.7%1.9%
2.0%
71.2%68.6%
17.8%
737.6
13.6%1.5%
66.4%
18.5%
Capital Expenditures
Billions of yen
Years ended March 31
66 OPENING DOORS : FINANCIAL SECTION : OPERATING AND FINANCIAL REvIEW AND PROSPECTS
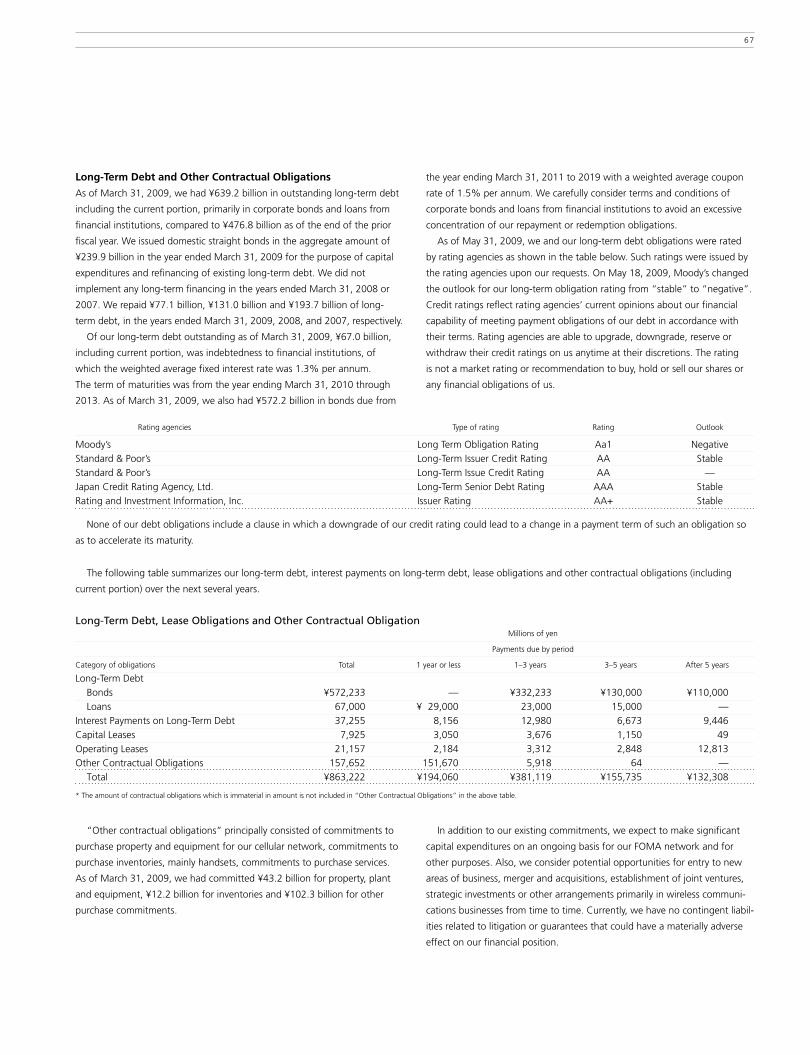
67
Long-Term Debt and Other Contractual Obligations
As of March 31, 2009, we had ¥639.2 billion in outstanding long-term debt
including the current portion, primarily in corporate bonds and loans from
financial institutions, compared to ¥476.8 billion as of the end of the prior
fiscal year. We issued domestic straight bonds in the aggregate amount of
¥239.9 billion in the year ended March 31, 2009 for the purpose of capital
expenditures and refinancing of existing long-term debt. We did not
implement any long-term financing in the years ended March 31, 2008 or
2007. We repaid ¥77.1 billion, ¥131.0 billion and ¥193.7 billion of long-
term debt, in the years ended March 31, 2009, 2008, and 2007, respectively.
Of our long-term debt outstanding as of March 31, 2009, ¥67.0 billion,
including current portion, was indebtedness to financial institutions, of
which the weighted average fixed interest rate was 1.3% per annum.
The term of maturities was from the year ending March 31, 2010 through
2013. As of March 31, 2009, we also had ¥572.2 billion in bonds due from
the year ending March 31, 2011 to 2019 with a weighted average coupon
rate of 1.5% per annum. We carefully consider terms and conditions of
corporate bonds and loans from financial institutions to avoid an excessive
concentration of our repayment or redemption obligations.
As of May 31, 2009, we and our long-term debt obligations were rated
by rating agencies as shown in the table below. Such ratings were issued by
the rating agencies upon our requests. On May 18, 2009, Moody’s changed
the outlook for our long-term obligation rating from “stable” to “negative”.
Credit ratings reflect rating agencies’ current opinions about our financial
capability of meeting payment obligations of our debt in accordance with
their terms. Rating agencies are able to upgrade, downgrade, reserve or
withdraw their credit ratings on us anytime at their discretions. The rating
is not a market rating or recommendation to buy, hold or sell our shares or
any financial obligations of us.
“Other contractual obligations” principally consisted of commitments to
purchase property and equipment for our cellular network, commitments to
purchase inventories, mainly handsets, commitments to purchase services.
As of March 31, 2009, we had committed ¥43.2 billion for property, plant
and equipment, ¥12.2 billion for inventories and ¥102.3 billion for other
purchase commitments.
In addition to our existing commitments, we expect to make significant
capital expenditures on an ongoing basis for our FOMA network and for
other purposes. Also, we consider potential opportunities for entry to new
areas of business, merger and acquisitions, establishment of joint ventures,
strategic investments or other arrangements primarily in wireless communi-
cations businesses from time to time. Currently, we have no contingent liabil-
ities related to litigation or guarantees that could have a materially adverse
effect on our financial position.
Rating agencies Type of rating Rating Outlook
Moody’s Long Term Obligation Rating Aa1 Negative
Standard & Poor’s Long-Term Issuer Credit Rating AA Stable
Standard & Poor’s Long-Term Issue Credit Rating AA —
Japan Credit Rating Agency, Ltd. Long-Term Senior Debt Rating AAA Stable
Rating and Investment Information, Inc. Issuer Rating AA+ Stable
None of our debt obligations include a clause in which a downgrade of our credit rating could lead to a change in a payment term of such an obligation so
as to accelerate its maturity.
The following table summarizes our long-term debt, interest payments on long-term debt, lease obligations and other contractual obligations (including
current portion) over the next several years.
long-TermDebt,leaseObligationsandOtherContractualObligation Millions of yen
Payments due by period
Category of obligations Total 1 year or less 1–3 years 3–5 years After 5 years
Long-Term Debt
Bonds ¥572,233 — ¥332,233 ¥130,000 ¥110,000
Loans 67,000 ¥ 29,000 23,000 15,000 —
Interest Payments on Long-Term Debt 37,255 8,156 12,980 6,673 9,446
Capital Leases 7,925 3,050 3,676 1,150 49
Operating Leases 21,157 2,184 3,312 2,848 12,813
Other Contractual Obligations 157,652 151,670 5,918 64 —
Total ¥863,222 ¥194,060 ¥381,119 ¥155,735 ¥132,308
* The amount of contractual obligations which is immaterial in amount is not included in “Other Contractual Obligations” in the above table.
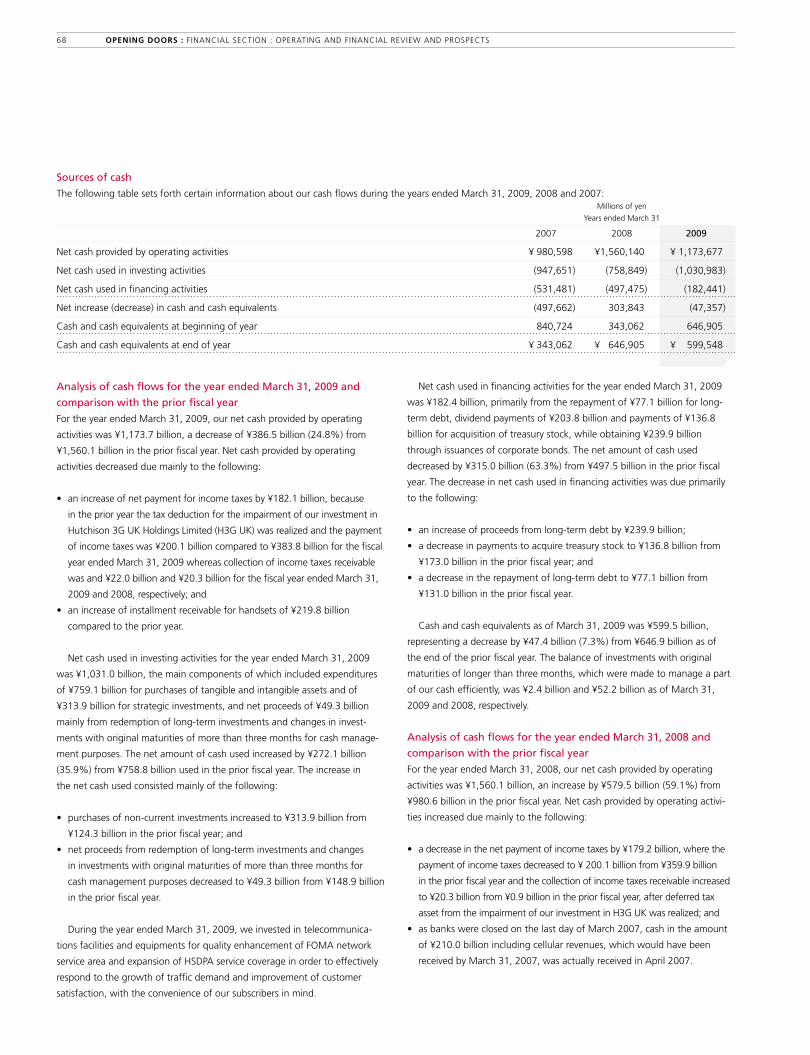
AnalysisofcashflowsfortheyearendedMarch31,2009and
comparisonwiththepriorfiscalyear
For the year ended March 31, 2009, our net cash provided by operating
activities was ¥1,173.7 billion, a decrease of ¥386.5 billion (24.8%) from
¥1,560.1 billion in the prior fiscal year. Net cash provided by operating
activities decreased due mainly to the following:
• an increase of net payment for income taxes by ¥182.1 billion, because
in the prior year the tax deduction for the impairment of our investment in
Hutchison 3G UK Holdings Limited (H3G UK) was realized and the payment
of income taxes was ¥200.1 billion compared to ¥383.8 billion for the fiscal
year ended March 31, 2009 whereas collection of income taxes receivable
was and ¥22.0 billion and ¥20.3 billion for the fiscal year ended March 31,
2009 and 2008, respectively; and
• an increase of installment receivable for handsets of ¥219.8 billion
compared to the prior year.
Net cash used in investing activities for the year ended March 31, 2009
was ¥1,031.0 billion, the main components of which included expenditures
of ¥759.1 billion for purchases of tangible and intangible assets and of
¥313.9 billion for strategic investments, and net proceeds of ¥49.3 billion
mainly from redemption of long-term investments and changes in invest-
ments with original maturities of more than three months for cash manage-
ment purposes. The net amount of cash used increased by ¥272.1 billion
(35.9%) from ¥758.8 billion used in the prior fiscal year. The increase in
the net cash used consisted mainly of the following:
• purchases of non-current investments increased to ¥313.9 billion from
¥124.3 billion in the prior fiscal year; and
• net proceeds from redemption of long-term investments and changes
in investments with original maturities of more than three months for
cash management purposes decreased to ¥49.3 billion from ¥148.9 billion
in the prior fiscal year.
During the year ended March 31, 2009, we invested in telecommunica-
tions facilities and equipments for quality enhancement of FOMA network
service area and expansion of HSDPA service coverage in order to effectively
respond to the growth of traffic demand and improvement of customer
satisfaction, with the convenience of our subscribers in mind.
Net cash used in financing activities for the year ended March 31, 2009
was ¥182.4 billion, primarily from the repayment of ¥77.1 billion for long-
term debt, dividend payments of ¥203.8 billion and payments of ¥136.8
billion for acquisition of treasury stock, while obtaining ¥239.9 billion
through issuances of corporate bonds. The net amount of cash used
decreased by ¥315.0 billion (63.3%) from ¥497.5 billion in the prior fiscal
year. The decrease in net cash used in financing activities was due primarily
to the following:
• an increase of proceeds from long-term debt by ¥239.9 billion;
• a decrease in payments to acquire treasury stock to ¥136.8 billion from
¥173.0 billion in the prior fiscal year; and
• a decrease in the repayment of long-term debt to ¥77.1 billion from
¥131.0 billion in the prior fiscal year.
Cash and cash equivalents as of March 31, 2009 was ¥599.5 billion,
representing a decrease by ¥47.4 billion (7.3%) from ¥646.9 billion as of
the end of the prior fiscal year. The balance of investments with original
maturities of longer than three months, which were made to manage a part
of our cash efficiently, was ¥2.4 billion and ¥52.2 billion as of March 31,
2009 and 2008, respectively.
AnalysisofcashflowsfortheyearendedMarch31,2008and
comparisonwiththepriorfiscalyear
For the year ended March 31, 2008, our net cash provided by operating
activities was ¥1,560.1 billion, an increase by ¥579.5 billion (59.1%) from
¥980.6 billion in the prior fiscal year. Net cash provided by operating activi-
ties increased due mainly to the following:
• a decrease in the net payment of income taxes by ¥179.2 billion, where the
payment of income taxes decreased to ¥ 200.1 billion from ¥359.9 billion
in the prior fiscal year and the collection of income taxes receivable increased
to ¥20.3 billion from ¥0.9 billion in the prior fiscal year, after deferred tax
asset from the impairment of our investment in H3G UK was realized; and
• as banks were closed on the last day of March 2007, cash in the amount
of ¥210.0 billion including cellular revenues, which would have been
received by March 31, 2007, was actually received in April 2007.
68 OPENING DOORS : FINANCIAL SECTION : OPERATING AND FINANCIAL REvIEW AND PROSPECTS
Sourcesofcash
The following table sets forth certain information about our cash flows during the years ended March 31, 2009, 2008 and 2007: Millions of yen
Years ended March 31
2007 2008 2009
Net cash provided by operating activities ¥ 980,598 ¥1,560,140 ¥ 1,173,677
Net cash used in investing activities (947,651) (758,849) (1,030,983)
Net cash used in financing activities (531,481) (497,475) (182,441)
Net increase (decrease) in cash and cash equivalents (497,662) 303,843 (47,357)
Cash and cash equivalents at beginning of year 840,724 343,062 646,905
Cash and cash equivalents at end of year ¥ 343,062 ¥ 646,905 ¥ 599,548

69
Net cash used in investing activities for the year ended March 31, 2008
was ¥758.8 billion, the main components of which included expenditures of
¥765.3 billion for purchases of tangible and intangible assets and of ¥124.3
billion for strategic investments, and net proceeds of ¥148.9 billion mainly
from redemption of long-term investments and changes in investments
with original maturities of more than three months for cash management
purposes. The net amount of cash used decreased by ¥188.8 billion (19.9%)
from ¥947.7 billion used in the prior fiscal year. The decrease in the net cash
used consisted mainly of the following:
• expenditures for purchases of tangible and intangible assets decreased
to ¥765.3 billion from ¥948.7 billion in the prior fiscal year;
• net proceeds from redemption of long-term investments and changes in
investments with original maturities of more than three months for cash
management purposes increased to ¥148.9 billion from ¥50.7 billion in
the prior fiscal year; and
• purchases of non-current investments increased to ¥124.3 billion from
¥41.9 billion in the prior fiscal year.
During the year ended March 31, 2008, in order to respond attentively to
diverse demand from our subscribers, we invested in telecommunications
facilities and equipment to expand the network coverage of HSDPA services
and to enhance FOMA network reliability and capacity against the growth of
traffic demand.
Net cash used in financing activities for the year ended March 31, 2008
was ¥497.5 billion, primarily from the repayment of ¥131.0 billion for long-
term debt, dividend payments of ¥190.5 billion and payments of ¥173.0
billion for acquisition of treasury stock. The net amount of cash used decreased
by ¥34.0 billion (6.4%) from ¥531.5 billion in the prior fiscal year. The decrease
in net cash used in financing activities was due primarily to the following:
• a decrease in the repayment of long-term debt to ¥131.0 billion from
¥193.7 billion in the prior fiscal year;
• an increase in dividend payments to ¥190.5 billion from ¥176.9 billion in
the prior fiscal year; and
• an increase in payments to acquire treasury stock to ¥173.0 billion from
¥157.2 billion in the prior fiscal year.
Cash and cash equivalents as of March 31, 2008 amounted to ¥646.9
billion, representing an increase by ¥303.8 billion (88.6%) from ¥343.1
billion as of the end of the prior fiscal year. The balance of investments with
original maturities of longer than three months, which were made to
manage a part of our cash efficiently, was ¥52.2 billion and ¥200.5 billion as
of March 31, 2008 and 2007, respectively.
ProspectofcashflowsfortheyearendingMarch31,2010
As for our sources of cash for the year ending March 31, 2010, we currently
expect our net cash flows from operating activities to decrease from the prior
fiscal year due to an increase in the payment of income taxes and a decrease
of non-cash expenditures such as depreciation expense, even though cash
collection of installment receivable for handsets is expected to increase from
the prior fiscal year due to the penetration of installment sales methods.
Our net cash flow used in investing activities for the year ending March
31, 2010 is expected to decrease due to factors including a decrease in our
capital expenditures to approximately ¥690.0 billion from ¥737.6 billion for
the year ended March 31, 2009.
C.ReSeARChAnDDevelOPMenT
Our research and development activities include development of new
products and services, development related to LTE and research on fourth-
generation systems, and conversion into IP networks for economical network
constructions. Research and development expenditures are charged to
expenses as incurred. We incurred ¥100.8 billion, ¥100.0 billion and ¥99.3
billion as research and development expenses for the years ended March 31,
2009, 2008 and 2007, respectively.
D.TRenDinFORMATiOn
The mobile communication market in Japan is undergoing changes brought
about by such factors as increasing rate of mobile phone penetration, diver-
sification of customer needs, the introduction of Mobile Number Portability,
and market entry by new competitors. In such an environment, with
operators taking such measures as the enhancement of handset lineups,
the introduction of value added services, lower billing plans and the intro-
duction of handset purchase methods, including installment payments,
competition among the operators is expected to become increasingly fierce.
Cash Flows
Billions of yen
Years ended March 31
–1,500
–1,000
–500
0
500
1,000
1,500
2,000
Net cash provided by operating activities
Net cash used in investing activities
980.6
1,560.1
1,173.7
–1,031.0–758.8
–947.7
200920082007 2009200820070
20
40
60
80
100
120
99.3 100.0 100.8
Research and Development Expenses
Billions of yen
Years ended March 31
In the fiscal year ending March 31, 2010, we expect that our operating
revenues will decrease and operating income will remain the same level
compared to the prior fiscal year, based on the following trends in our business:
• While it is anticipated that any increase in new subscriptions will be limited
due to the high penetration rate of mobile phone, we are anticipating
acquiring a similar level of net increase in the number of subscriptions in
the fiscal year ending March 31, 2010 as in the fiscal year ended March 31,
2009 by taking measures such as lowering the churn rate through
marketing directed at strengthening brand loyalty through greater satisfac-
tion of existing customers, and thus we expect an increase in total number
of subscriptions. Further, the proportion of FOMA subscriptions is expected
to increase to approximately 95% of our total cellular services subscriptions
with the ongoing migration of our mova subscribers to FOMA services;
• Both aggregate ARPU (FOMA+mova) and voice ARPU (FOMA+mova)
decreased, while packet ARPU (FOMA+mova) increased in the fiscal year
ended March 31, 2009 as compared to the prior fiscal year. These trends
are expected to continue in the fiscal year ending March 31, 2010. We
consider that several discount services, which implemented in prior years
to strengthen our competitiveness, will continue to become widespread,
revenue will decrease with the penetration of the “value Plan,” which
provides lower basic monthly charges in exchange for payment of handset
purchase costs which is not discounted by sales incentives, and then with
regard to packet ARPU, the increase is primarily due to the increase in
subscriptions to packet flat-rate services and the uptrend in monthly
payments caused by the migration from mova to FOMA;
• With regard to equipment sales, in the fiscal year ended March 31, 2009,
the number of handsets sold to agent resellers declined from the previous
fiscal year, but with the introduction of the “value Course” in November
2007, sales commissions deducted from equipment sales were reduced,
and after deduction of sales commissions, equipment sales increased over
the prior fiscal year. Similarly, in the fiscal year ending March 31, 2010, the
number of handsets sold wholesale to agencies is expected to decrease
slightly, but the market penetration by the “value Course” is expected to
have the effect of reducing sales commissions deducted from equipment
sales, and equipment sales after deduction of sales commissions are
expected to increase over the prior fiscal year.
• Due to the above, operating revenue for the fiscal year ending March 31,
2010 will decrease from the prior fiscal year primarily as a result of the
decrease in aggregate ARPU more than offsetting the effects of increased
revenue by the increase of subscriptions.
• SG&A expenses, network costs (communication network charges, depreci-
ation and amortization costs, loss on sales of disposals of fixed assets) and
other operating expenses for the fiscal year ending March 31, 2010 are
expected to decrease from the previous fiscal year due to higher cost
efficiency resulting from a review of sales policies, higher operating
efficiency as a result of the consolidation of the regional subsidiaries into
DOCOMO and reorganization of principal subsidiaries, and efficient facility
construction resulting from a review of design methods.
Due to the above, we expect operating income for the year ending March
31, 2010 to be at a similar level to the prior fiscal year, and net income to
increase from the prior fiscal year, due to a decrease of non-operating
expense.
It should be noted that in the “value Course” introduced in November
2007, sales commissions that had been previously applied on handset sales
are reduced, but on the other hand, in the accompanying “value Plan,” a
discount on basic monthly charges is applied continuously. This will result in
a one-time contribution to increased profits. It is expected that this effect will
diminish in the fiscal year ending March 31, 2010 and beyond.
70 OPENING DOORS : FINANCIAL SECTION : OPERATING AND FINANCIAL REvIEW AND PROSPECTS
Changes in the business environment in the telecommunications industry, such as intensifying competition from other service providers or other technologies caused by Mobile Number Portability, new market entrants and other factors, could limit our acquisition of new subscriptions and retention of existing subscriptions, or may lead to diminishing ARPU or an increase in our costs and expenses.
Market changes such as the introduction of Mobile Number Portability (MNP)
and the emergence of new service providers are resulting in increasing
competition with other service providers in the telecommunications industry.
For example, other mobile service providers have introduced new products
and services including 3G handsets, music player handsets, music distribution
services, and flat-rate services for voice communications and e-mail limited
to specified recipients, and new installment sale methods for handsets.
There are also providers that now offer or may in the future offer services
such as combined billing, aggregated point programs, and services offering
free calls between fixed-line and cellular phones in conjunction with fixed-
line communications, which may be more convenient for customers.
At the same time, there may be increased competition resulting from the
introduction of other new services and technologies, especially low-priced
and flat-rate services, such as fixed-line or mobile IP phones, high-speed
fixed-line broadband Internet service and digital broadcasting, wireless LAN,
and so on or convergence of these services.
In addition to competition from other service providers and technologies,
there are other factors increasing competition among mobile network
operators in Japan such as saturation in the Japanese cellular market,
changes to business and market structures due to the entry of new competi-
tors in the market, including MvNOs*, changes in the regulatory environ-
ment, and increased rate competition.
Under these circumstances, the number of net new subscriptions we
acquire may continue to decline in the future and may not reach the number
we expect. Also, in addition to difficulty acquiring new subscriptions, we
may not be able to maintain existing subscriptions at expected levels due to
increased competition among cellular service providers in the areas of rates
and services. Furthermore, in order to capture new subscriptions and
maintain existing subscriptions, we may need to incur higher than expected
costs. In this fierce market environment, in order to provide advanced
services and increase convenience to our customers, we have made various
rate revisions such as the introduction in June 2004 of “Pake-hodai,” which
is a packet flat-rate service for FOMA i-mode, the introduction of a new
unified rate plan for FOMA services and mova services in November 2005
that users find simple and easy to understand, the introduction in March
2006 of a new rate plan that enables users to apply Pake-hodai to all FOMA
services, the introduction in March 2007 of “Pake-hodai full,” a service that
enables subscribers with full-browser handsets to view not only i-mode but
also PC websites and video for a flat monthly rate, the introduction in
August 2007 of “Fami-wari MAX 50” and “Hitoridemo Discount 50,” which
give a uniform 50% discount on basic monthly charges, regardless of length
of continuous service, the introduction in April 2008 of a new rate plan that
allows users in the same “Family Discount” group to make free domestic
calls to each other 24 hours a day, and the introduction in October 2008 of
the packet flat-rate service, “Pake-hodai double,” with monthly charges
varying according to usage. However, we cannot be certain that these
measures will enable us to acquire new and maintain existing subscribers.
Furthermore, these rate revisions are expected to lead to a certain decline
in ARPU, but if the trend of subscribers using “Family Discount” and
switching to flat-rate services increases more than we expect, our ARPU may
decrease more than we expect. Furthermore, if the market growth slows or
the market shrinks due to the economic downturn, APRU may decrease even
more than forecast and we may not be able to capture new subscriptions
or maintain the existing number of subscriptions at the level we expect.
The foregoing factors may have a material adverse effect on our financial
condition and operating results.
* Abbreviation of Mobile virtual Network Operator. A business that borrows the wireless communication infrastructure of other companies to provide services.
Current and new services, usage patterns, and sales schemes introduced by our corporate group may not develop as planned, which could affect our financial condition and limit our growth.
We view increase in revenue through the expansion of packet communica-
tion services and other data communication services from promotion of use
of various i-mode services and through the development and expansion of
new services focused on i-mode FeliCa, such as credit services, which are
useful in everyday life and business, as important factors to our future
growth. However, a number of uncertainties may arise to prevent the devel-
opment of these services and constrain our growth.
Furthermore, if market growth slows or the market shrinks due to the
economic downturn, the services, forms of usage, and sales methods
provided by us may not develop sufficiently, which could affect our financial
conditions and limit our growth. In particular, we cannot be certain whether
or not the following can be achieved:
• We will be able to find the partners and content providers needed to
provide the new services and forms of usage we are introducing and
persuade a sufficient number of vendors and other establishments to
install i-mode FeliCa readers;
• We will be able to provide planned new services and forms of usage as
scheduled and keep costs needed for the deployment and expansion of
such services within budget;
• The services and installment sale and other methods we offer and plan to
offer will be attractive to current and potential subscribers and there will
be sufficient demand for such services;
• Manufacturers and content providers will steadily create and offer
products including handsets for our 3G system and handsets and
programming for our 3G i-mode services at appropriate prices and on a
timely basis;
• Our current and future data communication services including i-mode and
other services will be attractive to existing and potential subscribers and
achieve continued or new growth;
• Demand in the market for mobile handset functionality will be as we
envision and as a result our handset procurement costs will be reduced,
which will enable us to offer our handsets at appropriate prices; and
• We will be able to commence services with improved data communication
speed enabled by HSDPA* and HSUPA** technology as planned.
Risk Factors
FINANCIAL SECTION : RISK FACTORS 71

If the development of our new services or forms of use is limited, it may
have a material effect on our financial condition and results of operations.
* Abbreviation of High Speed Downlink Packet Access. A technology for high-speed packet data transmission from base station to handset based on Wideband Code Division Multiple Access, or W-CDMA.
** Abbreviation of High Speed Uplink Packet Access. A technology for high-speed packet data transmission from handset to base station based on W-CDMA.
The introduction or change of various laws or regulations or the application of such laws and regulations to our corporate group could restrict our business operations, which may adversely affect our financial condition and results of operations.
The Japanese telecommunications industry has been undergoing regulatory
reform in many areas including rate regulation. Because we operate on radio
spectrum allocated by the Government, the mobile telecommunications
industry in which we operate is particularly affected by the regulatory
environment. various governmental bodies have been recommending or
considering changes that could affect the mobile telecommunications
industry, and there may be continued reforms including the introduction
or revision of laws or regulations that could have an adverse effect on us.
These include:
• Revision of the spectrum allocation system such as reallocation of
spectrum and introduction of an auction system;
• Measures to open up some segments of telecommunication platform
functions such as authentication and payment collection to other
corporations;
• Rules that could require us to open our i-mode service to all content
providers and Internet service providers or that could prevent us from
setting or collecting i-mode content fees or putting i-mode service on
cellular phone handsets as an initial setting;
• Regulations to prohibit or restrict certain content or transactions or mobile
Internet services such as i-mode;
• Measures which would introduce new costs such as the designation of
mobile phone communication as a universal service and other changes
to the current universal service fund system;
• Regulations to increase handset competition such as SIM* unlocking
regulations;
• Fair competition measures to promote new entry by MvNOs;
• Introduction of new measures to promote competition based on a review
of the designated telecommunications facilities system (dominant carrier
regulation); and
• Other measures including competition safeguard measures directed
toward us, NTT East and NTT West, revision of the rules of access charge
between operators to enhance competition that would restrict our
business operations in the telecommunications industry.
It is difficult to predict with certainty if any of the above proposed changes
will be drafted into the relevant laws and regulations, and if they are imple-
mented, the extent to which our business will be affected. However, if the
implementation of one or more of the changes described above or other
changes to laws and regulations are made, we may experience constraints on
the provision of our mobile communication services and changes may arise in
our existing revenue structure, and this may have an adverse effect on our
financial condition and results of operations.
* Abbreviation of Subscriber Identity Module. An IC card inserted into a handset on which subscriber information is recorded, used to identify user.
Limitations in the amount of frequency spectrum or facilities made available to us could negatively affect our ability to maintain and improve our service quality and level of customer satisfaction.
One of the principal limitations on a cellular communication network’s
capacity is the available radio frequency spectrum it can use. We have limited
spectrum and facilities available to us to provide our services. As a result, in
certain parts of metropolitan Tokyo and Osaka, such as areas near major train
stations, our cellular communication network operates at or near the
maximum capacity of its available spectrum during peak periods, which may
cause reduced service quality. In addition, the quality of the services we
provide may also decrease due to the limited processing capacity of our base
stations and switching facilities during peak usage periods if our subscription
base dramatically increases or the volume of content such as images and
music provided through our i-mode service significantly expands. Also, in
relation to our FOMA services, packet flat-rate service for FOMA i-mode, and
our flat-rate service that enables subscribers to view full-browser PC websites
and video, an increase in the number of subscriptions and traffic volume of
our subscribers may go substantially beyond our projections, we may not be
able to process such traffic with our existing facilities and our quality of
service may decline.
Furthermore, with an increasing number of subscriptions and traffic
volume, our quality of service may decline if we cannot obtain the necessary
allocation of spectrum from the Government for the smooth operation of our
business.
We may not be able to avoid reduced quality of services despite our
continued efforts to improve the efficiency of our use of spectrum through
technology and to acquire new spectrum. If we are not able to successfully
address such problems in a timely manner, we may experience constraints on
the growth of our mobile communication services or lose subscribers to our
competitors, which may materially affect our financial condition and results
of operations.
The W-CDMA technology that we use for our 3G system and/or mobile multimedia services may not be introduced by other overseas operators, which could limit our ability to offer interna-tional services to our subscribers.
For our 3G system, we use W-CDMA technology. W-CDMA technology is
one of the global standards for cellular telecommunication technology
approved by the International Telecommunications Union (ITU). We may be
able to offer our services, such as global roaming, on a worldwide basis if
enough other mobile network operators adopt handsets and network
facilities based on W-CDMA standard technology that is compatible with
ours. We expect that the companies we have invested in overseas, our
overseas strategic partners and many other mobile network operators will
adopt this technology.
72 OPENING DOORS : FINANCIAL SECTION : RISK FACTORS

73
Also, we have technology alliances with overseas operators in relation
to i-mode services and we are aggressively promoting the spread and
expansion of i-mode services by overseas operators.
However, if a sufficient number of other mobile network operators do
not adopt W-CDMA technology or there is a delay in the introduction of
W-CDMA technology, we may not be able to offer global roaming services
as expected and we may not be able to offer our subscribers the convenience
of overseas service. Also, if adoption of W-CDMA technology abroad is not
conducted sufficiently and the number of i-mode subscribers among our
strategic partners and the usage of i-mode services by those subscribers
does not increase sufficiently, we may not realize the benefits of economies
of scale we currently expect in terms of purchasing network facilities and
offering handsets and contents developed for our services at appropriate
prices. Also, we cannot be sure that handset manufacturers or manufacturers
of network equipment will be able to appropriately and promptly adjust
their handsets and network equipment if we need to change the handsets
or network we currently use due to a change in W-CDMA technology as a
result of activities conducted by standard-setting organizations.
If W-CDMA technology and i-mode services do not develop as we expect
and we are not able to improve the quality of our overseas services or enjoy
the benefits of global economies of scale, this may have an adverse effect on
our financial condition and results of operations.
Our domestic and international investments, alliances and collab-orations may not produce the returns or provide the opportuni-ties we expect.
One of the major components of our strategy is to increase our corporate
value through domestic and overseas investments, alliances and collabora-
tions. We have entered into alliances and collaborations with other
companies and organizations overseas which we believe could help us
achieve this objective. We are also promoting this strategy by investing,
entering into alliances with and collaborating with domestic companies and
investing in new business areas.
However, there can be no assurance that we will be able to maintain or
enhance the value or performance of our past or future investments or that
we will receive the returns or benefits we expect from these investments,
alliances and collaborations. Our investments in new business areas outside
of the mobile telecommunication business may be accompanied by
challenges beyond our expectations, as we have little experience in such new
areas of business.
In recent years, the companies in which we have invested have experienced
a variety of negative developments, including severe competition, increased
debt burdens, worldwide economic recession, significant change in share
prices and financial difficulties. To the extent that these investments are
accounted for by the equity method and to the extent that the investee
companies have net losses, our financial results will be adversely affected by
our pro rata portion of these losses. If there is a loss in the value of our invest-
ment in any investee company and such loss in value is other than a
temporary decline, we may be required to adjust the book value and
recognize an impairment loss for such investment. Also, a business combina-
tion or other similar transaction involving any of our investee companies could
require us to realize impairment loss for any decline in the value of investment
in such investee company. In either event, our financial condition or results of
operations could be materially adversely affected.
As electronic payment capability and many other new features are built into our cellular phones, and services of parties other than those belonging to our corporate group are provided through our cellular handsets, potential problems resulting from malfunc-tions, defects or loss of handsets, or imperfection of services provided by such other parties may arise, which could have an adverse effect on our financial condition and results of operations.
various functions are mounted on the mobile handsets we provide, and if we
cannot appropriately deal with technological problems that may arise with
respect to current or future handsets or the malfunction, defect or loss of
handsets, our credibility may decline and our corporate image may be
damaged, leading to an increase in cancellations of subscription or an
increase in expenses for indemnity payments to subscribers and our financial
condition or results of operations may be affected. New issues may arise
which are different from those related to mobile communication services
which we have been providing, especially with i-mode handsets with FeliCa
capabilities that can be used for electronic payment and credit transactions.
Events that may lead to a decrease in our credibility and corporate image, or
an increase in cancellations of subscriptions and indemnity payments for
subscribers include the followings:
• Breakdown, defect and malfunction of our handsets;
• Loss of information, e-money or points due to a breakdown of handsets or
other factors;
• Illegal use of information, e-money, credit functions and points by third
parties due to a loss or theft of handsets;
• Illegal access to and use of user records and balances accumulated on
handsets by third-parties; and
• Inadequate and inappropriate management of e-money, credit functions
or points by companies with which we make alliances or collaborate.
Social problems that could be caused by misuse or misunder-standing of our products and services may adversely affect our credibility or corporate image.
We may face an increase in cancellations of existing subscriber contracts and
difficulty in acquiring new subscriptions due to decreased credibility of our
products and services and damaged corporate image caused by inappropriate
use of our products and services by unscrupulous subscribers.
One example is unsolicited bulk e-mail sent through our e-mail services,
including i-mode mail and SMS. Despite our extensive efforts to address
this issue caused by unsolicited bulk e-mails including notifying our
subscribers via various brochures, providing unsolicited bulk e-mail filtering
functions with our handsets and pursuing actions against companies which
distribute large amounts of such unsolicited bulk e-mails, the problem has
not yet been rooted out. If our subscribers receive a large amount of unsolic-
ited e-mail, it may cause a decrease in customer satisfaction and damage
our corporate image, leading to a reduction in the number of i-mode
subscriptions.

Mobile phones have been used in crimes such as the “it’s me” fraud,
whereby callers request an emergency bank remittance pretending to be a
relative. To combat these misuses of our services, we have introduced various
measures such as more strict identification confirmation at points of purchase
and ended new contracts for pre-paid mobile phones as of March 31, 2005
because pre-paid mobile phones are easier to use in criminal activities.
However, in the event criminal usage increases, mobile phones may be
regarded as a problem and lead to an increase in cancellation of contracts.
In addition, as our handsets and services become more sophisticated, new
issues may arise when subscribers are charged fees for packet communica-
tion at levels higher than they are aware of as a result of using handsets
without fully recognizing over use of packet communication in terms of
frequency and volume. Also, there are issues concerning manners for phone
usage in public places such as in trains and aircraft and the occurrence of car
accidents caused by the use of mobile phones while driving. Further, there
are a variety of issues concerning the possession of mobile phones by
children in elementary and junior high schools, and discussions concerning
whether our access restriction service to harmful web sites (“Filtering
service”), which applies basically to subscribers under 20 years of age as the
enforcement of the Act on Establishment of Enhanced Environment for
Youth’s Safe and Secure Internet Use, is sufficient and accurate. These issues
may similarly damage our corporate image.
We believe that we have properly addressed the social issues involving
mobile phones. However, it is uncertain whether we will be able to continue
addressing those issues appropriately in the future as well and if we fail to do
so, we may experience an increase in cancellation of existing subscriber
contracts or fail to acquire new subscribers as expected, and this may affect
our financial condition and results of operations.
Inadequate handling of confidential business information including personal information by our corporate group, contrac-tors and other factors, may adversely affect our credibility or corporate image.
We possess information on numerous subscribers in the telecommunications,
credit, and other businesses, and to appropriately and promptly address the
Law Concerning the Protection of Personal Information, we have put in place
comprehensive company-wide security management such as thorough
management of confidential information including personal information,
employee education, supervision of subcontractors and by strengthening
technological security.
However, in the event an information leak occurs despite these security
measures, our credibility may be significantly damaged and we may experi-
ence an increase in cancellation of subscriber contracts, an increase in
indemnity costs and slower increase in additional subscriptions, and our
financial condition and results of operations may be adversely affected.
Owners of intellectual property rights that are essential for our business execution may not grant us the right to license or other-wise use such intellectual property rights on acceptable terms or at all, which may limit our ability to offer certain technologies, products and/or services, and we may also be held liable for damage compensation if we infringe the intellectual property rights of others.
For us to carry out our business, it is necessary to obtain licenses and other
rights to use the intellectual property rights of third parties. Currently, we are
obtaining licenses from the holders of the rights concerned by concluding
license agreements. We will obtain the licenses from the holders of the rights
concerned if others have the rights to those intellectual property rights
necessary for us to operate our business in the future. However, if we cannot
come to an agreement with the holders of the rights concerned or a mutual
agreement concerning the granted rights cannot be maintained afterwards,
there is a possibility that we will not be able to provide our specific technolo-
gies, products or services. Also, if we receive claims of violation of intellectual
property rights from others, we may be forced to expend considerable time
and cost in reaching a resolution, and if such claims are recognized, we may
be liable to pay damages for infringement of the rights concerned, which
may adversely affect our financial condition and results of operations.
Earthquakes, power shortages, malfunctioning of equipment, software bugs, computer viruses, cyber attacks, hacking, unau-thorized access and other problems could cause systems failures in the networks required for the provision of service, disrupting our ability to offer services to our subscribers and may adversely affect our credibility or corporate image.
We have built a nationwide network including base stations, antennas,
switching centers and transmission lines and provide mobile communication
service using this network. In order to operate our network systems in a safe
and stable manner, we have various measures in place such as redundant
systems. However, despite these measures, our system could fail for various
reasons including hardware problems, network damage caused by earth-
quakes, power shortages, typhoons, floods, terrorism and similar phenomena
and events. These system failures can require an extended time for repair and
as a result, may lead to decreased revenues and increased repair costs, and
our financial condition and results of operations may be adversely affected.
There have been instances in which millions of computers worldwide were
infected by viruses through the Internet. Similar incidents could occur on our
mobile communication network. If such a virus entered our network or
handsets through such means as hacking, unauthorized access, or otherwise,
our system could fail and our mobile phones become unusable. In such an
instance, the credibility of our network and customer satisfaction could
decrease significantly. Although we have enhanced our security systems to
block unauthorized access and remote downloading in order to provide for
unexpected events, such precautions may not make our system fully
prepared for every event. In addition, our network could be affected by
software bugs, incorrect equipment settings and human errors which are not
the result of malfeasance, but also cause system failures or breakdowns.
74 OPENING DOORS : FINANCIAL SECTION : RISK FACTORS
75
In the event we are unable to properly respond to any such events, our
credibility or corporate image may be reduced, and we may experience a
decrease in revenues as well as significant repair costs, which may affect our
financial condition and results of operations.
Concerns about wireless telecommunication health risks may adversely affect our financial condition and results of operations.
Media and other reports have suggested that electric wave emissions from
wireless handsets and other wireless equipment may adversely affect the
health of mobile phone users and others such as by causing cancer and
vision loss and interfering with various electronic medical devices including
hearing aids and pacemakers, and also may present increased health risks
for users who are children. While these reports have not been conclusive,
and although the findings in such reports are disputed, the actual or
perceived risk of wireless telecommunication devices to the health of users
could adversely affect us through increased cancellation by existing
subscribers, reduced subscriber growth, reduced usage per subscriber or
litigation, and may also potentially adversely affect our corporate image,
financial condition and results of operations. The perceived risk of wireless
devices may have been elevated by certain wireless carriers and handset
manufactures affixing labels to their handsets showing levels of electric wave
emissions or warnings about possible health risks. Research and studies are
ongoing and we are actively attempting to confirm the safety of wireless
telecommunication, but there can be no assurance that further research and
studies will not demonstrate a relation between electric wave emissions and
health problems.
Furthermore, although the electric wave emissions of our cellular handsets
and base stations comply with the electromagnetic safety guidelines of
Japan, including guidelines regarding the specific absorption rate of electric
waves, and the International Commission on Non-Ionizing Radiation
Protection, the guidelines of which are regarded as an international safety
standard, the Electromagnetic Compatibility Conference Japan has
confirmed that some electronic medical devices are affected by the electro-
magnetic interference from cellular phones as well as other portable radio
transmitters. As a result, Japan has adopted a policy to restrict the use of
cellular services inside medical facilities. We are working to ensure that our
subscribers are aware of these restrictions when using cellular phones.
There is a possibility that modifications to regulations, new regulations or
restrictions could limit our ability to expand our market or our subscription
base or otherwise adversely affect us.
Our parent company, NIPPON TELEGRAPH AND TELEPHONE CORPORATION (NTT), could exercise influence that may not be in the interests of our other shareholders.
As of March 31, 2009, NTT owned 66.19% of our outstanding voting
shares. While being subject to the conditions for fair competition established
by the Ministry of Posts and Telecommunications (“MPT,” currently the
Ministry of Internal Affairs and Communications, or “MIC”) in April 1992,
NTT retains the right to control our management as a majority shareholder,
including the right to appoint directors. Currently, although we conduct our
day-to-day operations independently of NTT and its other subsidiaries,
certain important matters are discussed with, or reported to, NTT. As such,
NTT could take actions that are in its best interests, which may not be in the
interests of our other shareholders.

Consolidated Financial StatementsConsolidated Balance SheetsNTT DOCOMO, INC. AND SUBSIDIARIES
March 31, 2008 and 2009 Thousands of
Millions of yen U.S. dollars
2008 2009 2009
ASSETS
Current assets:
Cash and cash equivalents ¥ 646,905 ¥ 599,548 $ 6,046,878
Short-term investments
Third parties 2,208 2,448 24,690
Related parties 50,000 — —
Accounts receivable
Third parties 671,417 822,548 8,295,996
Related parties 15,256 12,515 126,223
Sub-total 686,673 835,063 8,422,219
Less: Allowance for doubtful accounts (15,037) (15,072) (152,012)
Total accounts receivable, net 671,636 819,991 8,270,207
Inventories 146,584 123,206 1,242,622
Deferred tax assets 108,037 102,903 1,037,852
Prepaid expenses and other current assets
Third parties 136,395 173,760 1,752,496
Related parties 6,015 5,872 59,224
Total current assets 1,767,780 1,827,728 18,433,969
Property, plant and equipment:
Wireless telecommunications equipment 5,346,486 5,361,043 54,070,025
Buildings and structures 797,904 814,056 8,210,348
Tools, furniture and fixtures 536,718 519,213 5,236,642
Land 198,958 198,985 2,006,909
Construction in progress 128,042 99,232 1,000,827
Sub-total 7,008,108 6,992,529 70,524,751
Accumulated depreciation and amortization (4,173,501) (4,301,044) (43,379,163)
Total property, plant and equipment, net 2,834,607 2,691,485 27,145,588
Non-current investments and other assets:
Investments in affiliates 349,488 572,014 5,769,178
Marketable securities and other investments 187,361 141,544 1,427,574
Intangible assets, net 555,259 578,728 5,836,894
Goodwill 158,889 154,385 1,557,085
Other assets
Third parties 222,225 261,724 2,639,677
Related parties 11,822 11,716 118,164
Deferred tax assets 123,403 248,896 2,510,298
Total non-current investments and other assets 1,608,447 1,969,007 19,858,870
Total assets ¥ 6,210,834 ¥ 6,488,220 $ 65,438,427
See accompanying notes to consolidated financial statements.
76 OPENING DOORS : FINANCIAL SECTION : CONSOLIDATED FINANCIAL STATEMENTS

Thousands of
Millions of yen U.S. dollars
2008 2009 2009
LIABILITIES, MINORITY INTERESTS AND SHAREHOLDERS’ EQUITY
Current liabilities:
Current portion of long-term debt ¥ 75,662 ¥ 29,000 $ 292,486
Short-term borrowings 1,712 — —
Accounts payable, trade
Third parties 626,992 545,717 5,503,954
Related parties 90,461 122,808 1,238,608
Accrued payroll 53,538 58,627 591,296
Accrued interest 710 1,187 11,972
Accrued income taxes 203,645 238,742 2,407,887
Other current liabilities
Third parties 179,513 150,241 1,515,290
Related parties 2,082 2,113 21,311
Total current liabilities 1,234,315 1,148,435 11,582,804
Long-term liabilities:
Long-term debt (exclusive of current portion) 401,090 610,233 6,154,644
Liability for employees’ retirement benefits 116,888 146,326 1,475,804
Other long-term liabilities
Third parties 177,002 237,126 2,391,589
Related parties 3,755 2,792 28,160
Total long-term liabilities 698,735 996,477 10,050,197
Total liabilities 1,933,050 2,144,912 21,633,001
Minority interests 1,288 1,723 17,378
Shareholders’ equity:
Common stock, without a stated value –
Authorized –188,130,000 shares and 188,130,000 shares
at March 31, 2008 and 2009, respectively
Issued – 44,870,000 and 43,950,000 shares
at March 31, 2008 and 2009, respectively
Outstanding – 42,627,927 and 41,759,807 shares
at March 31, 2008 and 2009, respectively 949,680 949,680 9,578,215
Additional paid-in capital 948,571 785,045 7,917,751
Retained earnings 2,793,814 3,061,848 30,880,967
Accumulated other comprehensive income (loss) 410 (65,689) (662,521)
Treasury stock, 2,242,073 and 2,190,193 shares
at March 31, 2008 and 2009, respectively, at cost (415,979) (389,299) (3,926,364)
Total shareholders’ equity 4,276,496 4,341,585 43,788,048
Commitments and contingencies
Total liabilities, minority interests and shareholders’ equity ¥6,210,834 ¥6,488,220 $65,438,427
See accompanying notes to consolidated financial statements.
77

Consolidated Financial StatementsConsolidated Statements of Income and Comprehensive IncomeNTT DOCOMO, INC. AND SUBSIDIARIES
Years ended March 31, 2007, 2008 and 2009 Thousands of
Millions of yen U.S. dollars
2007 2008 2009 2009Operating revenues: Wireless services Third parties ¥ 4,259,951 ¥ 4,107,844 ¥ 3,786,917 $38,193,818 Related parties 54,189 57,390 54,165 546,294 Equipment sales Third parties 465,924 538,195 600,630 6,057,791 Related parties 8,029 8,398 6,268 63,217 Total operating revenues 4,788,093 4,711,827 4,447,980 44,861,120 Operating expenses: Cost of services (exclusive of items shown separately below) Third parties 498,852 561,763 630,415 6,358,195 Related parties 268,108 249,370 242,023 2,440,978 Cost of equipment sold (exclusive of items shown separately below) 1,218,694 1,150,261 827,856 8,349,531 Depreciation and amortization 745,338 776,425 804,159 8,110,530 Selling, general and administrative Third parties 1,121,374 1,025,812 980,251 9,886,546 Related parties 162,203 139,884 132,317 1,334,513 Total operating expenses 4,014,569 3,903,515 3,617,021 36,480,293 Operating income 773,524 808,312 830,959 8,380,827 Other income (expense): Interest expense (5,749) (4,556) (4,618) (46,576) Interest income 1,459 2,487 2,162 21,806 Other, net 3,709 (5,555) (48,030) (484,418)Total other income (expense) (581) (7,624) (50,486) (509,188)Income before income taxes, equity in net income (losses) of affiliates and minority interests 772,943 800,688 780,473 7,871,639 Income taxes: Current 237,734 334,462 395,467 3,988,573 Deferred 75,945 (11,507) (87,067) (878,134)Total income taxes 313,679 322,955 308,400 3,110,439 Income before equity in net income (losses) of affiliates and minority interests 459,264 477,733 472,073 4,761,200 Equity in net income (losses) of affiliates, net of applicable taxes (1,941) 13,553 (672) (6,778)Minority interest (45) (84) 472 4,761 Net income ¥ 457,278 ¥ 491,202 ¥ 471,873 $ 4,759,183 Other comprehensive income (loss): Unrealized holding losses on available-for-sale securities, net of applicable taxes (15,364) (16,762) (30,319) (305,789) Less: Reclassification of realized gains and losses, net of applicable taxes included in net income (399) 431 28,709 289,551 Change in fair value of derivative instruments, net of applicable taxes 832 (525) (4) (40) Less: Reclassification of realized gains and losses, net of applicable taxes included in net income (798) 658 (121) (1,220) Foreign currency translation adjustment, net of applicable taxes 1,103 7,299 (47,532) (479,395) Less: Reclassification of realized gains and losses, net of applicable taxes included in net income — (127) (54) (545) Pension liability adjustment, net of applicable taxes: Actuarial gains (losses) arising during period, net — (4,909) (16,316) (164,559) Less: Amortization of prior service cost — (1,338) (1,340) (13,515) Less: Amortization of actuarial gains and losses — 502 797 8,038 Less: Amortization of transition obligation — 75 81 817 Less: Reclassification of actuarial gains and losses due to transfer of the substitutional portion to the government — 2,232 — — Minimum pension liability adjustment, net of applicable taxes 5,562 — — —Comprehensive income ¥ 448,214 ¥ 478,738 ¥ 405,774 $ 4,092,526 Per share data: Weighted average common shares outstanding – Basic and Diluted (shares) 43,985,082 43,120,586 42,238,715 42,238,715 Basic and Diluted earnings per share (Yen and U.S. dollars) ¥ 10,396.21 ¥ 11,391.36 ¥ 11,171.58 $ 112.67
See accompanying notes to consolidated financial statements.
78 OPENING DOORS : FINANCIAL SECTION : CONSOLIDATED FINANCIAL STATEMENTS
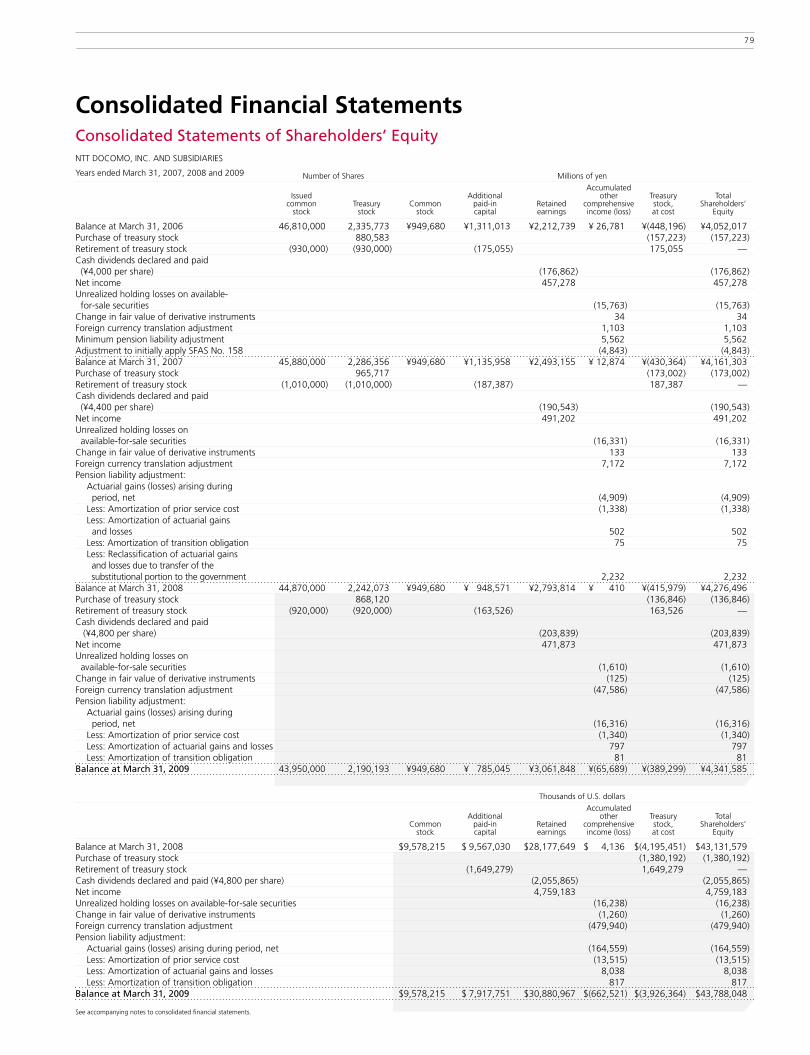
Number of Shares Millions of yen
Accumulated Issued Additional other Treasury Total common Treasury Common paid-in Retained comprehensive stock, Shareholders’ stock stock stock capital earnings income (loss) at cost Equity
Balance at March 31, 2006 46,810,000 2,335,773 ¥949,680 ¥1,311,013 ¥2,212,739 ¥ 26,781 ¥(448,196) ¥4,052,017Purchase of treasury stock 880,583 (157,223) (157,223)Retirement of treasury stock (930,000) (930,000) (175,055) 175,055 —Cash dividends declared and paid (¥4,000 per share) (176,862) (176,862)Net income 457,278 457,278Unrealized holding losses on available- for-sale securities (15,763) (15,763)Change in fair value of derivative instruments 34 34Foreign currency translation adjustment 1,103 1,103Minimum pension liability adjustment 5,562 5,562Adjustment to initially apply SFAS No. 158 (4,843) (4,843)Balance at March 31, 2007 45,880,000 2,286,356 ¥949,680 ¥1,135,958 ¥2,493,155 ¥ 12,874 ¥(430,364) ¥4,161,303Purchase of treasury stock 965,717 (173,002) (173,002)Retirement of treasury stock (1,010,000) (1,010,000) (187,387) 187,387 —Cash dividends declared and paid (¥4,400 per share) (190,543) (190,543)Net income 491,202 491,202Unrealized holding losses on available-for-sale securities (16,331) (16,331)Change in fair value of derivative instruments 133 133Foreign currency translation adjustment 7,172 7,172Pension liability adjustment: Actuarial gains (losses) arising during period, net (4,909) (4,909) Less: Amortization of prior service cost (1,338) (1,338) Less: Amortization of actuarial gains and losses 502 502 Less: Amortization of transition obligation 75 75 Less: Reclassification of actuarial gains and losses due to transfer of the substitutional portion to the government 2,232 2,232Balance at March 31, 2008 44,870,000 2,242,073 ¥949,680 ¥ 948,571 ¥2,793,814 ¥ 410 ¥(415,979) ¥4,276,496Purchase of treasury stock 868,120 (136,846) (136,846)Retirement of treasury stock (920,000) (920,000) (163,526) 163,526 —Cash dividends declared and paid (¥4,800 per share) (203,839) (203,839)Net income 471,873 471,873 Unrealized holding losses on available-for-sale securities (1,610) (1,610)Change in fair value of derivative instruments (125) (125)Foreign currency translation adjustment (47,586) (47,586)Pension liability adjustment: Actuarial gains (losses) arising during period, net (16,316) (16,316) Less: Amortization of prior service cost (1,340) (1,340) Less: Amortization of actuarial gains and losses 797 797 Less: Amortization of transition obligation 81 81 Balance at March 31, 2009 43,950,000 2,190,193 ¥949,680 ¥ 785,045 ¥3,061,848 ¥(65,689) ¥(389,299) ¥4,341,585
Thousands of U.S. dollars
Accumulated Additional other Treasury Total Common paid-in Retained comprehensive stock, Shareholders’ stock capital earnings income (loss) at cost Equity
Balance at March 31, 2008 $9,578,215 $ 9,567,030 $28,177,649 $ 4,136 $(4,195,451) $43,131,579 Purchase of treasury stock (1,380,192) (1,380,192)Retirement of treasury stock (1,649,279) 1,649,279 —Cash dividends declared and paid (¥4,800 per share) (2,055,865) (2,055,865)Net income 4,759,183 4,759,183 Unrealized holding losses on available-for-sale securities (16,238) (16,238)Change in fair value of derivative instruments (1,260) (1,260)Foreign currency translation adjustment (479,940) (479,940)Pension liability adjustment: Actuarial gains (losses) arising during period, net (164,559) (164,559) Less: Amortization of prior service cost (13,515) (13,515) Less: Amortization of actuarial gains and losses 8,038 8,038 Less: Amortization of transition obligation 817 817 Balance at March 31, 2009 $9,578,215 $ 7,917,751 $30,880,967 $(662,521) $(3,926,364) $43,788,048
See accompanying notes to consolidated financial statements.
Consolidated Financial StatementsConsolidated Statements of Shareholders’ EquityNTT DOCOMO, INC. AND SUBSIDIARIES
Years ended March 31, 2007, 2008 and 2009
79

Consolidated Financial StatementsConsolidated Statements of Cash FlowsNTT DOCOMO, INC. AND SUBSIDIARIES
Years ended March 31, 2007, 2008 and 2009 Thousands of
Millions of yen U.S. dollars
2007 2008 2009 2009Cash flows from operating activities:Net income ¥ 457,278 ¥ 491,202 ¥ 471,873 $ 4,759,183 Adjustments to reconcile net income to net cash provided by operating activities – Depreciation and amortization 745,338 776,425 804,159 8,110,530 Deferred taxes 74,987 (2,471) (87,626) (883,772) Loss on sale or disposal of property, plant and equipment 55,708 54,359 43,304 436,752 Impairment loss on marketable securities and other investments 8,086 11,418 57,812 583,076 Equity in net (income) losses of affiliates 2,791 (22,810) 1,239 12,496 Dividends from affiliates 1,258 15,349 15,500 156,329 Minority interests 45 84 (472) (4,761) Changes in assets and liabilities: (Increase) decrease in accounts receivable (262,032) 187,434 (148,909) (1,501,856) (Decrease) increase in allowance for doubtful accounts (1,600) 1,803 67 676 Decrease (increase) in inventories 83,716 (10) 23,327 235,270 (Increase) decrease in prepaid expenses and other current assets (39,254) 4,176 (14,661) (147,866) (Increase) in non-current installment receivable for handsets — (58,931) (37,712) (380,353) (Decrease) in accounts payable, trade (42,013) (50,477) (49,286) (497,085) (Decrease) increase in accrued income taxes (100,197) 134,912 35,158 354,594 Increase (decrease) in other current liabilities 534 6,206 (29,126) (293,757) Increase (decrease) in liability for employees’ retirement benefits 379 (19,002) 29,438 296,904 (Decrease) increase in other long-term liabilities (26,241) 8,780 55,143 556,157 Other, net 21,815 21,693 4,449 44,871 Net cash provided by operating activities 980,598 1,560,140 1,173,677 11,837,388 Cash flows from investing activities: Purchases of property, plant and equipment (735,650) (548,517) (517,776) (5,222,148) Purchases of intangible and other assets (213,075) (216,816) (241,373) (2,434,423) Purchases of non-current investments (41,876) (124,312) (313,889) (3,165,799) Proceeds from sale and redemption of non-current investments 50,594 101,341 660 6,657 Acquisitions of subsidiaries, net of cash acquired (8,392) (14,797) 568 5,729 Purchases of short-term investments (3,557) (6,562) (32,977) (332,597) Redemption of short-term investments 4,267 5,443 32,255 325,315 Proceeds from redemption of long-term bailment for consumption to a related party — 50,000 50,000 504,286 Other, net 38 (4,629) (8,451) (85,235) Net cash used in investing activities (947,651) (758,849) (1,030,983) (10,398,215)Cash flows from financing activities: Proceeds from long-term debt — — 239,913 2,419,697 Repayment of long-term debt (193,723) (131,005) (77,071) (777,317) Proceeds from short-term borrowings 18,400 15,249 62,274 628,079 Repayment of short-term borrowings (18,450) (15,351) (64,032) (645,809) Principal payments under capital lease obligations (3,621) (2,821) (2,837) (28,613) Payments to acquire treasury stock (157,223) (173,002) (136,846) (1,380,192) Dividends paid (176,862) (190,543) (203,839) (2,055,865) Other, net (2) (2) (3) (30) Net cash used in financing activities (531,481) (497,475) (182,441) (1,840,050)Effect of exchange rate changes on cash and cash equivalents 872 27 (7,610) (76,753)Net increase (decrease) in cash and cash equivalents (497,662) 303,843 (47,357) (477,630)Cash and cash equivalents at beginning of year 840,724 343,062 646,905 6,524,508 Cash and cash equivalents at end of year ¥ 343,062 ¥ 646,905 ¥ 599,548 $ 6,046,878 Supplemental disclosures of cash flow information: Cash received during the year for: Income tax refunds ¥ 925 ¥ 20,346 ¥ 21,999 $ 221,876 Cash paid during the year for: Interest, net of amount capitalized 6,203 4,656 4,141 41,765 Income taxes 359,861 200,079 383,838 3,871,286 Non-cash investing and financing activities: Assets acquired through capital lease obligations 3,530 2,579 2,334 23,540 Retirement of treasury stock 175,055 187,387 163,526 1,649,279
See accompanying notes to consolidated financial statements.
80 OPENING DOORS : FINANCIAL SECTION : CONSOLIDATED FINANCIAL STATEMENTS

Notes to Consolidated Financial StatementsNTT DOCOMO, INC. AND SUBSIDIARIES
1. NATURE OF OPERATIONS: NTT DoCoMo, Inc. and subsidiaries (“DOCOMO”) is a joint stock corporation
that was incorporated under the laws of Japan in August 1991 as the wireless
telecommunications arm of Nippon Telegraph and Telephone Corporation
(“NTT”). NTT, 33.71% of which is owned by the Japanese government,
owns 62.89% of DOCOMO’s issued stock and 66.19% of DOCOMO’s voting
stock outstanding as of March 31, 2009.
DOCOMO provides its subscribers with wireless telecommunications
services such as FOMA (3G wireless services), mova (2G wireless services),
packet communications services (wireless data communications services
using packet switching) and satellite mobile communications services,
primarily on its own nationwide networks. In addition, DOCOMO sells
handsets and related equipment primarily to agent resellers who in turn sell
such equipment to subscribers.
DOCOMO terminated Personal Handyphone System (“PHS”) services on
January 7, 2008. Also, DOCOMO plans to terminate mova services on March
31, 2012.
DOCOMO maintains its books and records and prepares its statutory financial
statements in conformity with the Japanese Telecommunications Business Law
and the related accounting regulations and accounting principles generally
accepted in Japan, which differ in certain respects from accounting principles
generally accepted in the United States of America (“U.S. GAAP”).
The accompanying consolidated financial statements are prepared in
accordance with U.S. GAAP and, therefore, reflect certain adjustments to
DOCOMO’s books and records.
(1) Adoption of new accounting standards Fair Value Measurements—Effective April 1, 2008, DOCOMO adopted Statement of Financial Accounting
Standards (“SFAS”) No. 157 “Fair Value Measurements”. SFAS No. 157
defines fair value, establishes a framework for measuring fair value in
generally accepted accounting principles and expands disclosures about fair
value measurements. Although the definition of fair value retains the
exchange price notion in earlier definitions of fair value, SFAS No. 157
clarifies that the exchange price is the price in an orderly transaction between
market participants to sell the asset or transfer the liability in the market and
emphasizes that fair value is a market-based measurement, rather than an
entity-specific measurement. SFAS No. 157 also expands disclosures about
the use of fair value to measure assets and liabilities subsequent to initial
recognition through fair value hierarchy as a framework for measurement.
In February 2008, Financial Accounting Standards Board (“FASB”) issued
FASB Staff Position (“FSP”) FAS 157-2 “Effective Date of FASB Statement No.
157” (“FSP 157-2”). FSP 157-2 defers the effective date of SFAS No.157 to
fiscal years beginning after November 15, 2008, and interim periods within
those fiscal years for nonfinancial assets and nonfinancial liabilities measured
on a nonrecurring basis. In accordance with FSP 157-2, DOCOMO has not
applied the provisions of SFAS No.157 to the fair value measurement of nonfi-
nancial assets and nonfinancial liabilities, including long-lived assets and asset
retirement obligations.
In October 2008, FASB issued FSP FAS 157-3 “Determining the Fair Value
of a Financial Asset When the Market for That Asset Is Not Active” (“FSP
157-3”). FSP 157-3 clarifies application of SFAS No. 157 in a market that is
not active. FSP 157-3 was effective upon issuance, including prior periods for
which financial statements have not been issued. DOCOMO has considered
the guidance provided by FSP 157-3 in its determination of fair value
measurements for the year ended March 31, 2009.
The initial adoption of SFAS No. 157, FSP 157-2 and FSP 157-3 did not
have a material impact on DOCOMO’s results of operations and financial
position. See Note 19 for further discussion.
Disclosures about Derivative Instruments and Hedging Activities— an amendment of SFAS No. 133Effective January 1, 2009, DOCOMO adopted SFAS No. 161 “Disclosures
about Derivative Instruments and Hedging Activities—an amendment of SFAS
No. 133”. SFAS No. 161 requires entities with derivative instruments to
disclose information that should enable financial statement users to under-
stand how and why an entity uses derivative instruments, how derivative
instruments and related hedged items are accounted for under SFAS No. 133
“Accounting for Derivative Instruments and Hedging Activities”, and how
derivative instruments and related hedged items affect an entity’s financial
position, financial performance, and cash flows. The adoption of SFAS No.
161 resulted in expanded disclosure but did not have any impact on
DOCOMO’s results of operations and financial position. See Note 20 for
further discussion.
(2) Significant accounting policies Principles of consolidation— The consolidated financial statements include accounts of DOCOMO and its
majority-owned subsidiaries. All significant intercompany balances and trans-
actions are eliminated in consolidation.
DOCOMO applies FASB Interpretation (“FIN”) No. 46 (revised 2003)
“Consolidation of Variable Interest Entities—an interpretation of Accounting
Research Bulletin (“ARB”) No. 51” (“FIN 46R”). FIN 46R addresses how a
business enterprise should evaluate whether it has a controlling financial
interest in an entity through means other than voting rights and accordingly
should consolidate the entity. For the years ended March 31, 2007, 2008
and 2009, DOCOMO had no variable interest entities to be consolidated
or disclosed.
Use of estimates— The preparation of DOCOMO’s consolidated financial statements in confor-
mity with U.S. GAAP requires management to make estimates and assump-
tions that affect the reported amounts of assets and liabilities and the
disclosure of contingent assets and liabilities at the date of the consolidated
financial statements, as well as the reported amounts of revenues and
expenses during the reporting period. Actual results could differ from those
estimates. DOCOMO has identified the following areas where it believes
estimates and assumptions are particularly critical to the consolidated financial
statements. These are determination of useful lives of property, plant and
equipment, internal use software and other intangible assets, impairment of
long-lived assets, impairment of investments, realization of deferred tax
assets, measurement of pension liabilities and revenue recognition.
Effective October 1, 2008, DOCOMO decreased the estimated useful lives
of its long lived assets related to its mova services. This change in accounting
estimate was due to the scheduled termination of mova services on March
31, 2012. As mova subscribers have been steadily migrating to FOMA,
DOCOMO has decided to discontinue mova services and concentrate on
FOMA services. The change resulted in a decrease of ¥60,072 million
($605,870 thousand) in “Income before income taxes, equity in net income
(losses) of affiliates and minority interests”, ¥35,563 million ($358,679
thousand) in “Net income” and ¥841.95 ($8.49) in “Basic and Diluted
2. SUMMARY OF SIgNIFICANT ACCOUNTINg AND REPORTINg POLICIES:
FINANCIAL SECTION : NOTES TO CONSOLIDATED FINANCIAL STATEMENTS 81

earnings per share” in the accompanying consolidated statement of income
and comprehensive income for the year ended March 31, 2009. In accor-
dance with SFAS No. 154, “Accounting Changes and Error Corrections, a
replacement of Accounting Principles Board (“APB”) Opinion No. 20 and
SFAS No. 3”, the change is reflected prospectively, and prior periods have
not been adjusted.
Cash and cash equivalents— DOCOMO considers cash in banks and short-term highly liquid investments
with original maturities of 3 months or less at the date of purchase to be
cash and cash equivalents.
Short-term investments— Highly liquid investments, which have original maturities of longer than 3
months at the date of purchase and remaining maturities of 1 year or less at
the end of fiscal year, are considered to be short-term investments.
Allowance for doubtful accounts— The allowance for doubtful accounts is computed based on historical bad
debt experience and the estimated uncollectible amount based on the
analysis of certain individual accounts, including claims in bankruptcy.
Inventories— Inventories are stated at the lower of cost or market. The cost of equipment
sold is determined by the first-in, first-out method. Inventories consist
primarily of handsets and accessories. DOCOMO evaluates its inventory for
obsolescence on a periodic basis and records valuation adjustments as
required. Due to the rapid technological changes associated with the wireless
communications business, DOCOMO wrote down and disposed of obsolete
handsets during the years ended March 31, 2007, 2008 and 2009 resulting
in losses totaling ¥21,353 million, ¥16,946 million and ¥14,180 million
($143,016 thousand), respectively, which were included in “Cost of
equipment sold” in the accompanying consolidated statements of income
and comprehensive income.
Property, plant and equipment— Property, plant and equipment are stated at cost and include interest cost
incurred during construction, as discussed below in “Capitalized interest”.
Property, plant and equipment under capital leases are stated at the present
value of minimum lease payments. Depreciation is computed by the
declining-balance method at rates based on the estimated useful lives of the
respective assets with the exception of buildings, which are depreciated on a
straight-line basis. Useful lives are determined at the time the asset is
acquired and are based on its expected use, past experience with similar
assets and anticipated technological or other changes. If technological or
other changes occur more or less rapidly or in a different form than antici-
pated or the intended use changes, the useful lives assigned to these assets
are adjusted as appropriate. Property, plant and equipment held under
capital leases and leasehold improvements are amortized using either the
straight-line method or the declining-balance method, depending on the
type of the assets, over the shorter of the lease term or estimated useful life
of the asset.
The estimated useful lives of major depreciable assets are as follows:
Major wireless telecommunications equipment 8 to 16 years
Steel towers and poles for antenna equipment 30 to 40 years
Reinforced concrete buildings 38 to 50 years
Tools, furniture and fixtures 4 to 15 years
Depreciation and amortization expenses for the years ended March 31,
2007, 2008 and 2009 were ¥553,510 million, ¥579,101 million, and
¥614,481 million ($6,197,489 thousand), respectively.
When depreciable telecommunications equipment is retired or abandoned
in the normal course of business, the amounts of such telecommunications
equipment and its accumulated depreciation are deducted from the respec-
tive accounts. Any remaining balance is charged to expense immediately.
DOCOMO accounts for legal or contractual obligations associated with the
retirement of tangible long-lived assets in accordance with SFAS No. 143,
“Accounting for Asset Retirement Obligations”. DOCOMO’s asset retirement
obligations subject to SFAS No. 143 primarily relate to its obligations to
restore certain leased land and buildings used for DOCOMO’s wireless tele-
communications equipment to their original states. DOCOMO has deter-
mined the aggregate fair values of its asset retirement obligations do not
have a material impact on DOCOMO’s results of operations or financial
position.
Expenditures for replacements and betterments are capitalized, while
expenditures for maintenance and repairs are expensed as incurred. Assets
under construction are not depreciated until placed in service. The rental
costs associated with ground or building operating leases that are incurred
during a construction period are expensed.
Capitalized interest— DOCOMO capitalizes interest related to the construction of property, plant
and equipment over the period of construction. DOCOMO also capitalizes
interest associated with the development of internal-use software. DOCOMO
amortizes such capitalized interest over the estimated useful lives of the
related assets.
Investments in affiliates— The equity method of accounting is applied to investments in affiliates where
DOCOMO owns an aggregate of 20% to 50% and/or is able to exercise
significant influence. Under the equity method of accounting, DOCOMO
records its share of earnings and losses of the affiliate and adjusts its carrying
amount. For investments of less than 20%, DOCOMO periodically reviews
the facts and circumstances related thereto to determine whether or not it
can exercise significant influence over the operating and financial policies of
the affiliate and therefore should apply the equity method of accounting. For
investees accounted for under the equity method whose fiscal year-end is
December 31, DOCOMO records its share of income or losses of such
investees with a 3 month lag in its consolidated statements of income and
comprehensive income. DOCOMO evaluates the recoverability of the
carrying value of its investments in affiliates, which includes investor level
goodwill, when there are indicators that a decline in value below its carrying
amount may be other than temporary. In performing its evaluations,
DOCOMO utilizes various information including cash flow projections, inde-
pendent valuations and, as applicable, quoted market values to determine
recoverable amounts and the length of time an investment’s carrying value
exceeds its estimated current recoverable amount. In the event of a determi-
nation that a decline in value is other than temporary, a charge to earnings is
recorded for the loss, and a new cost basis in the investment is established.
Marketable securities and other investments— Marketable securities consist of debt and equity securities. DOCOMO
accounts for such investments in debt and equity securities in accordance
with SFAS No. 115, “Accounting for Certain Investments in Debt and Equity
Securities”. Management determines the appropriate classification of its
investment securities at the time of purchase. DOCOMO periodically reviews
82 OPENING DOORS : FINANCIAL SECTION : NOTES TO CONSOLIDATED FINANCIAL STATEMENTS
the carrying amounts of its marketable securities for impairments that are
other than temporary. If this evaluation indicates that a decline in value is
other than temporary, the security is written down to its estimated fair value.
The impairment is charged to earnings and a new cost basis for the security
is established. To determine whether an impairment is other than temporary,
DOCOMO considers whether it has the ability and intent to hold the invest-
ment until a market price recovery and considers whether evidence indi-
cating the cost of the investment is recoverable outweighs evidence to the
contrary. Evidence considered in this assessment includes the reasons for the
impairment, the severity and duration of the impairment, changes in value
subsequent to year-end, forecasted performance of the investee and the
general market condition in the geographic area or industry the investee
operates in.
Equity securities held by DOCOMO, whose fair values are readily deter-
minable, are classified as available-for-sale. Available-for-sale equity securities
are carried at fair value with unrealized holding gains or losses, net of appli-
cable taxes, included as a component of “Accumulated other comprehensive
income (loss)” in shareholders’ equity. Realized gains and losses are deter-
mined using the average cost method and are reflected currently in earnings.
Debt securities held by DOCOMO, which DOCOMO has the positive intent
and ability to hold to maturity, are classified as held-to-maturity, and the
other debt securities that may be sold before maturity are classified as
available-for-sale securities. Held-to-maturity debt securities are carried at
amortized cost. Available-for-sale debt securities are carried at fair value with
unrealized holding gains or losses, net of applicable taxes, included as a
component of “Accumulated other comprehensive income (loss)” in share-
holders’ equity. Realized gains and losses are determined using the first-in,
first-out cost method and are reflected currently in earnings. Debt securities
with original maturities of 3 months or less at the date of purchase are
recorded as “Cash and cash equivalents”, while those with original maturi-
ties of longer than 3 months at the date of purchase and remaining maturi-
ties of 1 year or less at the end of fiscal year are recorded as “Short-term
investments” in the consolidated balance sheets.
DOCOMO did not hold or transact any trading securities during the years
ended March 31, 2007, 2008 and 2009.
Other investments include equity securities whose fair values are not
readily determinable. Equity securities whose fair values are not readily deter-
minable are carried at cost. Other than temporary declines in value are
charged to earnings. Realized gains and losses are determined using the
average cost method and are reflected currently in earnings.
goodwill and other intangible assets— Goodwill is the excess of the acquisition cost of businesses over the fair value
of the identifiable net assets acquired. Other intangible assets primarily
consist of software for telecommunications network, internal-use software,
software acquired to be used in manufacture of handsets, customer related
assets and rights to use certain telecommunications facilities of wireline
operators.
DOCOMO accounts for goodwill and other intangible assets in accordance
with SFAS No. 142 “Goodwill and Other Intangible Assets”. Accordingly,
DOCOMO does not amortize either goodwill, including investor level
goodwill related to the investments accounted for under the equity method,
or other intangible assets acquired in a purchase business combination and
determined to have an indefinite useful life. However, (1) goodwill, except
those related to equity method investments, and (2) other intangible assets
that have indefinite useful lives are tested for impairment at least annually.
The goodwill impairment test is a two-step test. Under the first step, the fair
value of the reporting unit is compared with its carrying value (including
goodwill). If the fair value of the reporting unit is less than its carrying value,
an indication of goodwill impairment exists for the reporting unit and
DOCOMO performs the second step of the impairment test (measurement).
Under the second step, an impairment loss is recognized for any excess of
the carrying amount of the reporting unit’s goodwill over the implied fair
value of that goodwill. The implied fair value of goodwill is determined by
allocating the fair value of the reporting unit in a manner similar to a
purchase price allocation. If the fair value of the reporting unit exceeds its
carrying value, the second step does not need to be performed.
Intangible assets that have finite useful lives, consisting primarily of
software for telecommunications network, internal-use software, software
acquired to be used in manufacture of handsets, customer related assets and
rights to use telecommunications facilities of wireline operators are
amortized on a straight-line basis over their useful lives.
Goodwill related to equity method investments is tested for impairment as
a part of the other than temporary impairment assessment of the equity
method investment as a whole in accordance with APB Opinion No. 18,
“The Equity Method of Accounting for Investments in Common Stock”.
DOCOMO capitalizes the cost of internal-use software which has a useful
life in excess of 1 year in accordance with American Institute of Certified
Public Accountants (AICPA) Statement of Position 98-1 “Accounting for the
Costs of Computer Software Developed or Obtained for Internal Use”.
Subsequent costs for additions, modifications or upgrades to internal-use
software are capitalized only to the extent that the software is able to
perform a task it previously did not perform. Software acquired to be used in
the manufacture of handsets is capitalized if the technological feasibility of
the handset to be ultimately marketed has been established at the time of
purchase in accordance with SFAS No. 86 “Accounting for the Costs of
Computer Software to Be Sold, Leased, or Otherwise Marketed”. Software
maintenance and training costs are expensed in the period in which they are
incurred. Capitalized software costs are being amortized over a period of 5
years at a maximum.
Customer related assets principally consist of contractual customer rela-
tionships in the mobile phone business that were recorded in connection
with the acquisition of minority interests of the regional subsidiaries in
November 2002 through the process of identifying separable intangible
assets apart from goodwill. The customer related assets had been amortized
over 6 years, which was the expected term of subscription in mobile phone
business.
Amounts capitalized related to rights to use certain telecommunications
assets of wireline operators, primarily NTT, are amortized over 20 years.
Impairment of long-lived assets— DOCOMO’s long-lived assets other than goodwill, such as property, plant
and equipment, software and intangibles subject to amortization, are
reviewed for impairment whenever events or changes in circumstances
indicate that the carrying amount may not be recoverable in accordance with
SFAS No. 144 “Accounting for the Impairment or Disposal of Long-Lived
Assets”. Recoverability of assets to be held for use is evaluated by a compar-
ison of the carrying amount of the asset with future undiscounted cash flows
expected to be generated by the asset or asset group. If the asset (or asset
group) is determined to be impaired, the loss recognized is the amount by
which the carrying value of the asset (or asset group) exceeds its fair value as
measured through various valuation techniques, including discounted cash
flow models, quoted market value and third-party independent appraisals, as
considered necessary.
83

Hedging activities— DOCOMO uses derivative instruments including interest rate swap, foreign
currency swap and foreign exchange forward contracts and other non-deriv-
ative financial instruments in order to manage its exposure to fluctuations in
interest rates and foreign exchange rates. DOCOMO does not hold or issue
derivative instruments for trading purposes.
These financial instruments are effective in meeting the risk reduction
objectives of DOCOMO by generating either transaction gains and losses
which offset transaction gains and losses of the hedged items or cash flows
which offset the cash flows related to the underlying position in respect of
amount and timing.
DOCOMO accounts for derivative instruments and other hedging activities
in accordance with SFAS No. 133 as amended by SFAS No. 138, No. 149,
No. 155 and No.161. All derivative instruments are recorded on the consoli-
dated balance sheets at fair value. The recorded fair values of derivative
instruments represent the amounts that DOCOMO would receive or pay to
terminate the contracts at each fiscal year end.
For derivative instruments that qualify as fair value hedge instruments, the
changes in fair value of the derivative instruments are recognized currently in
earnings, which offset the changes in fair value of the related hedged assets
or liabilities that are also recognized in earnings of the period.
For derivative instruments that qualify as cash flow hedge instruments, the
changes in fair value of the derivative instruments are initially recorded in
“Accumulated other comprehensive income (loss)” and reclassified into
earnings when the relevant hedged transaction is realized.
For derivative instruments that do not qualify as hedging instruments, the
changes in fair value of the derivative instruments are recognized currently in
earnings.
DOCOMO discontinues hedge accounting when it is determined that the
derivative or non-derivative instrument is no longer highly effective as a
hedge or when DOCOMO decides to discontinue the hedging relationship.
Cash flows from derivative instruments that are designated as qualifying
hedges are classified in the consolidated statements of cash flows under the
same categories as the cash flows from the relevant assets, liabilities or antic-
ipated transactions.
Employees’ retirement benefit plans— Effective March 31, 2007 in accordance with SFAS No. 158 “Employers’
Accounting for Defined Benefit Pension and Other Postretirement Plans – an
amendment of SFAS No. 87, 88, 106, and 132R”, DOCOMO recognizes the
funded status of its benefit plans, measured as the difference between the
plan assets at fair value and the benefit obligation, in the consolidated balance
sheets. Changes in the funded status are recognized as changes in compre-
hensive income (loss) during the fiscal period in which such changes occur.
Pension benefits earned during the year as well as interest on projected
benefit obligations are accrued currently. Prior service cost and net losses in
excess of 10% of the greater of the projected benefit obligation or the fair
value of plan assets, both of which are included in “Accumulated other
comprehensive income (loss)”, are amortized to earnings over the expected
average remaining service period of employees on a straight-line basis.
Revenue recognition— DOCOMO primarily generates revenues from two sources – wireless services
and equipment sales. These revenue sources are separate and distinct
earnings processes. Wireless service is sold to the subscriber directly or
through third-party resellers who act as agents, while equipment, including
handsets, are sold principally to agent resellers.
DOCOMO sets its wireless services rates in accordance with the Japanese
Telecommunications Business Law and government guidelines, which
currently allow wireless telecommunications operators to set their own tariffs
without government approval. Wireless service revenues primarily consist of
basic monthly charges, airtime charges and fees for activation.
Basic monthly charges and airtime charges are recognized as revenues at
the time the service is provided to the subscribers. DOCOMO’s monthly
billing plans for cellular (FOMA and mova) services generally include a certain
amount of allowances (free minutes and/or packets), and the used amount
of the allowances is subtracted from total usage in calculating the airtime
revenue from a subscriber for the month. DOCOMO offers a billing arrange-
ment called “Nikagetsu Kurikoshi” (2 month carry-over), in which the
unused allowances are automatically carried over for up to the following two
months. In addition, DOCOMO offers an arrangement which enables the
unused allowances that were carried over for two months to be automati-
cally used to cover the airtime and/or packet fees exceeding the allowances
of the other subscriptions in the “Family Discount” group, a discount billing
arrangement for families with between two and ten DOCOMO subscriptions.
Out of the unused allowance in a month, DOCOMO defers the revenues
based on the portion which is estimated to be used in the following two
months. As for the portion which is estimated to expire, DOCOMO recog-
nizes the revenue attributable to such portion of allowances ratably as the
remaining allowances are utilized, in addition to the revenue recognized
when subscribers make calls or utilize data transmissions.
Equipment sales are recognized as revenues when equipment is accepted
by the agent resellers and all inventory risk is transferred from DOCOMO.
Certain commissions paid to agent resellers are recognized as a reduction of
revenue upon delivery of the equipment to such agent resellers in accor-
dance with Emerging Issues Task Force (“EITF”) Issue No. 01-9 “Accounting
for Consideration Given by a Vendor to a Customer (Including a Reseller of
the Vendor’s Products)”.
Effective November 2007, DOCOMO introduced a new handset sales
scheme which enables subscribers to select installment payments over a
period of 12 or 24 months. When installment payments are selected, under
agreements entered into among DOCOMO, subscribers and agent resellers,
DOCOMO provides financing by providing funds for the purchase of the
handset by the subscribers. DOCOMO then includes current installments for
the receivable for the purchased handset with basic monthly charges and
airtime charges for the installment payment term. Because equipment sales
are recognized upon delivery of handsets to agent resellers, the advance
payment for the purchased handset to agent resellers and subsequent cash
collection of the installment receivable for the purchased handset from
subscribers do not have an impact on DOCOMO’s equipment sales. The
portion of installment receivable for the purchased handset which was
expected to be collected within 1 year or less as of the date of the consoli-
dated balance sheets was recorded as “Accounts receivable” and the other
portion of installment receivable was recorded as “Other assets” in the
consolidated balance sheets. The aggregate carrying amount of the install-
ment receivable for handsets before deducting allowance for doubtful
accounts, which was recorded as “Accounts receivable” and “Other assets”
as of March 31, 2008 was ¥111,789 million and ¥59,036 million, respec-
tively, and ¥293,845 million ($2,963,641 thousand) and ¥96,799 million
($976,288 thousand), respectively, as of March 31, 2009.
Non-recurring upfront fees such as activation fees are deferred and recog-
nized as revenues over the estimated average period of the subscription for
each service. The related direct costs are also deferred to the extent of the
related upfront fee amount and are amortized over the same period.
84 OPENING DOORS : FINANCIAL SECTION : NOTES TO CONSOLIDATED FINANCIAL STATEMENTS
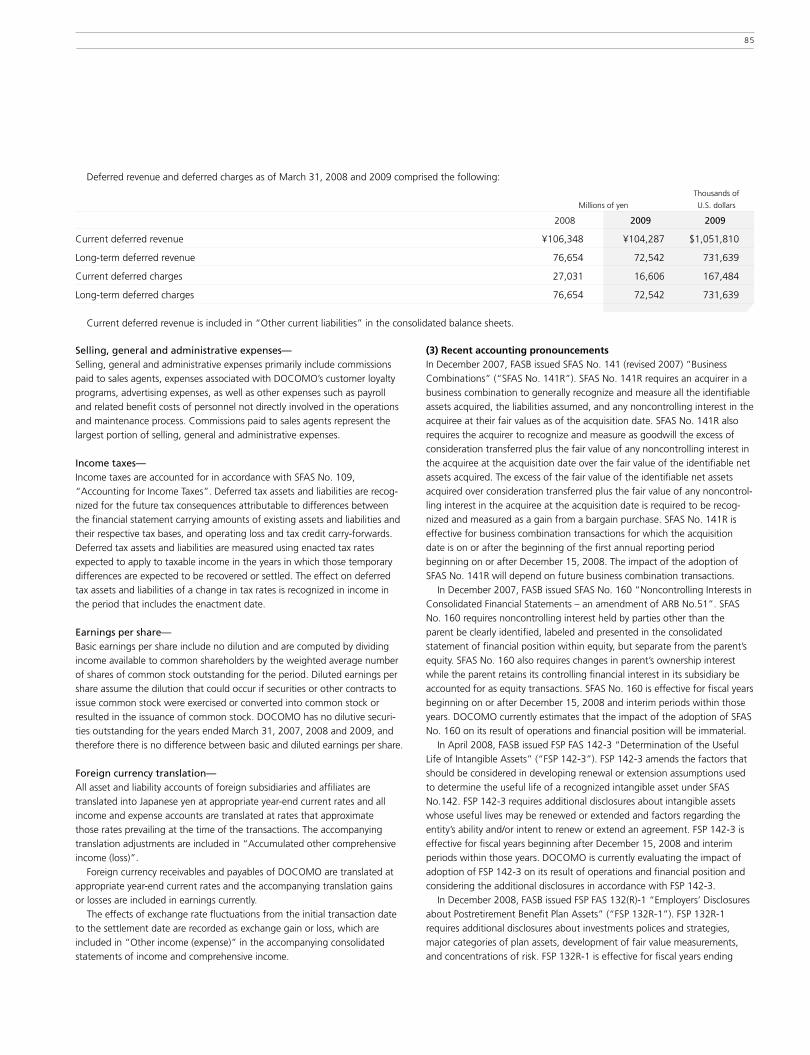
Deferred revenue and deferred charges as of March 31, 2008 and 2009 comprised the following:
Thousands of
Millions of yen U.S. dollars
2008 2009 2009
Current deferred revenue ¥106,348 ¥104,287 $1,051,810
Long-term deferred revenue 76,654 72,542 731,639
Current deferred charges 27,031 16,606 167,484
Long-term deferred charges 76,654 72,542 731,639
Current deferred revenue is included in “Other current liabilities” in the consolidated balance sheets.
Selling, general and administrative expenses— Selling, general and administrative expenses primarily include commissions
paid to sales agents, expenses associated with DOCOMO’s customer loyalty
programs, advertising expenses, as well as other expenses such as payroll
and related benefit costs of personnel not directly involved in the operations
and maintenance process. Commissions paid to sales agents represent the
largest portion of selling, general and administrative expenses.
Income taxes— Income taxes are accounted for in accordance with SFAS No. 109,
“Accounting for Income Taxes”. Deferred tax assets and liabilities are recog-
nized for the future tax consequences attributable to differences between
the financial statement carrying amounts of existing assets and liabilities and
their respective tax bases, and operating loss and tax credit carry-forwards.
Deferred tax assets and liabilities are measured using enacted tax rates
expected to apply to taxable income in the years in which those temporary
differences are expected to be recovered or settled. The effect on deferred
tax assets and liabilities of a change in tax rates is recognized in income in
the period that includes the enactment date.
Earnings per share— Basic earnings per share include no dilution and are computed by dividing
income available to common shareholders by the weighted average number
of shares of common stock outstanding for the period. Diluted earnings per
share assume the dilution that could occur if securities or other contracts to
issue common stock were exercised or converted into common stock or
resulted in the issuance of common stock. DOCOMO has no dilutive securi-
ties outstanding for the years ended March 31, 2007, 2008 and 2009, and
therefore there is no difference between basic and diluted earnings per share.
Foreign currency translation— All asset and liability accounts of foreign subsidiaries and affiliates are
translated into Japanese yen at appropriate year-end current rates and all
income and expense accounts are translated at rates that approximate
those rates prevailing at the time of the transactions. The accompanying
translation adjustments are included in “Accumulated other comprehensive
income (loss)”.
Foreign currency receivables and payables of DOCOMO are translated at
appropriate year-end current rates and the accompanying translation gains
or losses are included in earnings currently.
The effects of exchange rate fluctuations from the initial transaction date
to the settlement date are recorded as exchange gain or loss, which are
included in “Other income (expense)” in the accompanying consolidated
statements of income and comprehensive income.
(3) Recent accounting pronouncementsIn December 2007, FASB issued SFAS No. 141 (revised 2007) “Business
Combinations” (“SFAS No. 141R”). SFAS No. 141R requires an acquirer in a
business combination to generally recognize and measure all the identifiable
assets acquired, the liabilities assumed, and any noncontrolling interest in the
acquiree at their fair values as of the acquisition date. SFAS No. 141R also
requires the acquirer to recognize and measure as goodwill the excess of
consideration transferred plus the fair value of any noncontrolling interest in
the acquiree at the acquisition date over the fair value of the identifiable net
assets acquired. The excess of the fair value of the identifiable net assets
acquired over consideration transferred plus the fair value of any noncontrol-
ling interest in the acquiree at the acquisition date is required to be recog-
nized and measured as a gain from a bargain purchase. SFAS No. 141R is
effective for business combination transactions for which the acquisition
date is on or after the beginning of the first annual reporting period
beginning on or after December 15, 2008. The impact of the adoption of
SFAS No. 141R will depend on future business combination transactions.
In December 2007, FASB issued SFAS No. 160 “Noncontrolling Interests in
Consolidated Financial Statements – an amendment of ARB No.51”. SFAS
No. 160 requires noncontrolling interest held by parties other than the
parent be clearly identified, labeled and presented in the consolidated
statement of financial position within equity, but separate from the parent’s
equity. SFAS No. 160 also requires changes in parent’s ownership interest
while the parent retains its controlling financial interest in its subsidiary be
accounted for as equity transactions. SFAS No. 160 is effective for fiscal years
beginning on or after December 15, 2008 and interim periods within those
years. DOCOMO currently estimates that the impact of the adoption of SFAS
No. 160 on its result of operations and financial position will be immaterial.
In April 2008, FASB issued FSP FAS 142-3 “Determination of the Useful
Life of Intangible Assets” (“FSP 142-3”). FSP 142-3 amends the factors that
should be considered in developing renewal or extension assumptions used
to determine the useful life of a recognized intangible asset under SFAS
No.142. FSP 142-3 requires additional disclosures about intangible assets
whose useful lives may be renewed or extended and factors regarding the
entity’s ability and/or intent to renew or extend an agreement. FSP 142-3 is
effective for fiscal years beginning after December 15, 2008 and interim
periods within those years. DOCOMO is currently evaluating the impact of
adoption of FSP 142-3 on its result of operations and financial position and
considering the additional disclosures in accordance with FSP 142-3.
In December 2008, FASB issued FSP FAS 132(R)-1 “Employers’ Disclosures
about Postretirement Benefit Plan Assets” (“FSP 132R-1”). FSP 132R-1
requires additional disclosures about investments polices and strategies,
major categories of plan assets, development of fair value measurements,
and concentrations of risk. FSP 132R-1 is effective for fiscal years ending
85

4. CASH AND CASH EQUIVALENTS: Cash and cash equivalents as of March 31, 2008 and 2009 comprised the following:
Thousands of
Millions of yen U.S. dollars
2008 2009 2009
Cash ¥306,905 ¥349,564 $3,525,607
Certificates of deposit 280,000 160,000 1,613,717
Bailment for consumption 50,000 60,000 605,144
Other 10,000 29,984 302,410
Total ¥646,905 ¥599,548 $6,046,878
Information regarding “Bailment for consumption” is disclosed in Note 14.
5. INVENTORIES: Inventories as of March 31, 2008 and 2009 comprised the following:
Thousands of
Millions of yen U.S. dollars
2008 2009 2009
Telecommunications equipment to be sold ¥145,086 ¥121,315 $1,223,550
Materials and supplies 306 239 2,410
Other 1,192 1,652 16,662
Total ¥146,584 ¥123,206 $1,242,622
after December 15, 2009. The adoption of FSP 132R-1 will not have
any impact on DOCOMO’s results of operations and financial position.
DOCOMO is currently considering the additional disclosures in accordance
with FSP 132R-1.
In April 2009, FASB issued FSP FAS 115-2 and FAS 124-2 “Recognition
and Presentation of Other-Than-Temporary Impairments” (“FSP 115-2 and
124-2”). FSP 115-2 and 124-2 amends the other than temporary impairment
guidance for debt securities to make the guidance more operational
and changes the presentation and disclosure of other than temporary
impairments on debt and equity securities in the financial statements. FSP
115-2 and 124-2 is effective for interim and annual periods ending after
June 15, 2009. DOCOMO is currently evaluating the impact of adoption of
FSP 115-2 and 124-2 on its result of operations and financial position.
(4) ReclassificationsCertain reclassifications are made to the prior years’ consolidated financial
statements to conform to the presentation used for the year ended March
31, 2009.
3. CONVENIENT TRANSLATIONS: The consolidated financial statements are stated in Japanese yen. Translations
of the Japanese yen amounts into U.S. dollars are included solely for the
convenience of readers by applying the noon buying rate in New York City
for cable transfers in foreign currencies as certified for customs purposes by
the Federal Reserve Bank of New York on March 31, 2009, which was
¥99.15 to U.S. $1. The convenience translations should not be construed as
representations that the Japanese yen amounts have been, could have been,
or could in the future be, converted into U.S. dollars at this or any other rate
of exchange.
6. INVESTMENTS IN AFFILIATES: Sumitomo Mitsui Card Co., Ltd.— As of March 31, 2008 and 2009, DOCOMO held 34% of the outstanding
common shares of Sumitomo Mitsui Card Co., Ltd. (“Sumitomo Mitsui
Card”), which were acquired on July 11, 2005 for ¥98,713 million.
DOCOMO accounted for the investment using the equity method as of
March 31, 2008 and 2009. DOCOMO entered into an agreement with
Sumitomo Mitsui Card, Sumitomo Mitsui Financial Group, Inc. and
Sumitomo Mitsui Banking Corporation that DOCOMO and these companies
would jointly promote the credit transaction services which use mobile
phones compatible with “Osaifu-Keitai” (wallet-phone) service and that
DOCOMO would form a capital alliance with Sumitomo Mitsui Card.
Philippine Long Distance Telephone Company— As of March 31, 2008 and 2009, DOCOMO held approximately 14% of the
outstanding common shares of Philippine Long Distance Telephone Company
(“PLDT”), a telecommunication operator in the Philippines. PLDT is a public
company listed on the Philippine Stock Exchange and the New York Stock
Exchange. On March 14, 2006, DOCOMO acquired approximately 7% of
PLDT’s outstanding common shares for ¥52,213 million from NTT Communi-
cations Corporation (“NTT Com”), a subsidiary of NTT and accounted for the
investment under the cost method. From March 2007 to February 2008,
DOCOMO acquired approximately an additional 7% common equity interest
for ¥98,943 million in the market. Together with the PLDT common shares
continued to be held by NTT Com, on a consolidated basis NTT held approxi-
mately 21% of the total outstanding common shares of PLDT.
86 OPENING DOORS : FINANCIAL SECTION : NOTES TO CONSOLIDATED FINANCIAL STATEMENTS

In accordance with an agreement entered into on January 31, 2006
between PLDT and its major shareholders, including NTT Com and DOCOMO,
DOCOMO has the right to exercise the entire 21% voting rights associated
with the ownership interest collectively held by DOCOMO and NTT Com. As
DOCOMO obtained the ability to exercise significant influence over PLDT,
DOCOMO has accounted for the investment by applying the equity method
from the date of the initial acquisition of PLDT shares. The prior period
financial statements have not been retroactively adjusted to reflect the appli-
cation of the equity method from the date of the initial investments as
described in APB Opinion No.18 “The Equity Method of Accounting for
Investments in Common Stock” because the impact on results of operations
and net equity of DOCOMO is not material to the prior or current period
financial statements presented.
DOCOMO determined the fair value of tangible, intangible and other
assets and liabilities of PLDT with the assistance of an independent third party
appraiser in order to recognize and account for DOCOMO’s share of identifi-
able intangible assets and embedded goodwill of its investment in equity in
PLDT. During the year ended March 31, 2009, upon the completion of the
evaluation, adjustments to reflect the earnings impact of the final allocation
of the investment in PLDT were charged to equity in net income (loss) of affil-
iates. As a result, “Equity in net income (losses) of affiliates, net of applicable
taxes” in consolidated statements of income and comprehensive income for
the year ended March 31, 2009 decreased by ¥4,817 million ($48,583
thousand) and “Investments in affiliates” in consolidated balance sheets as of
March 31, 2009 decreased by ¥8,137 million ($82,068 thousand).
DOCOMO’s carrying amount of its investment in PLDT was ¥165,099
million and ¥109,042 million ($1,099,768 thousand) as of March 31, 2008
and 2009, respectively. The aggregate market price of the PLDT shares
owned by DOCOMO was ¥180,014 million and ¥119,801 million ($1,208,280
thousand) as of March 31, 2008 and 2009, respectively.
Tata Teleservices Limited—As of March 31, 2009, DOCOMO held approximately 26% of the
outstanding common shares of Tata Teleservices Limited (“TTSL”), which
were acquired for ¥252,321 million ($2,544,841 thousand).
On November 12, 2008, DOCOMO entered into a capital alliance with
TTSL and Tata Sons Limited, the parent company of TTSL. On March 25,
2009, DOCOMO acquired approximately 26% of the outstanding common
shares of TTSL pursuant to the capital alliance and accounted for the
investment by applying the equity method. DOCOMO is currently in the
process of determining the estimated fair value of tangible, intangible and
other assets and liabilities of TTSL with the assistance of an independent
third party appraiser in order to recognize and account for DOCOMO’s share
of identifiable intangible assets and embedded goodwill of its investment in
equity in TTSL. The purchase price allocation will be complete within the year
ending March 31, 2010.
Impairment— DOCOMO evaluates the recoverability of the carrying value of its investments
in affiliates including those mentioned above when there are indications that
a decline in value below carrying amount may be other than temporary. As a
result of such evaluations, DOCOMO recorded impairment charges for other
than temporary declines in the values in certain investee affiliates during
each of the years ended March 31, 2007, 2008 and 2009. The impairments
did not have a material impact on DOCOMO’s results of operations or
financial position. The impairment charges are included in “Equity in net
income (losses) of affiliates, net of applicable taxes” in the accompanying
statements of income and comprehensive income. DOCOMO believes the
estimated fair values of each of its investments in affiliates as of March 31,
2009 to equal or exceed the related carrying values on an individual basis.
All of the equity method investees, except for PLDT, are privately held
companies as of March 31, 2009.
DOCOMO’s cumulative share of the earnings or losses of affiliates, less
amounts distributed by affiliates as dividends, was ¥4,239 million, ¥8,469
million and ¥10,346 million ($104,347 thousand), as of March 31, 2007,
2008 and 2009, respectively. Dividends received from affiliates were ¥1,258
million, ¥15,349 million and ¥15,500 million ($156,329 thousand) for the
years ended March 31, 2007, 2008 and 2009, respectively. DOCOMO does
not have significant business transactions with its affiliates.
The total carrying value of DOCOMO’s investments in affiliates in the
accompanying consolidated balance sheets as of March 31, 2008 and 2009
was greater by ¥216,024 million and ¥210,600 million ($2,124,054
thousand), respectively, than its aggregate underlying equity in net assets of
such affiliates as of the date of the most recent available financial statements
of the investees. The difference mainly consisted of goodwill and amortizable
intangible assets. The difference as of March 31, 2009 does not include the
effect of the investment in TTSL, which was made on March 25, 2009.
7. MARkETABLE SECURITIES AND OTHER INVESTMENTS: “Marketable securities and other investments” as of March 31, 2008 and 2009 comprised the following:
Thousands of
Millions of yen U.S. dollars
2008 2009 2009
Marketable securities:
Available-for-sale ¥158,108 ¥112,967 $1,139,354
Other investments 29,253 28,582 288,270
Sub-total ¥187,361 ¥141,549 $1,427,624
Less: Available-for-sale securities classified as “Short-term investments” — (5) (50)
Marketable securities and other investments (Non-current) ¥187,361 ¥141,544 $1,427,574
87

Maturities of debt securities classified as available-for-sale as of March 31, 2008 and 2009 were as follows:
Millions of yen Thousands of U.S. dollars
2008 2009 2009
Carrying Fair Carrying Fair Carrying Fair amount value amount value amount value
Due within 1 year — — ¥5 ¥5 $50 $50
Due after 1 year through 5 years ¥5 ¥5 — — — —
Due after 5 years through 10 years — — — — — —
Due after 10 years — — — — — —
Total ¥5 ¥5 ¥5 ¥5 $50 $50
The aggregate cost, gross unrealized holding gains and losses and fair value by type of “Marketable securities and other investments” as of March 31, 2008
and 2009 were as follows: Millions of yen
2008
Cost / Amortized Gross unrealized Gross unrealized cost holding gains holding losses Fair value
Available-for-sale:
Equity securities ¥162,504 ¥17,403 ¥21,804 ¥158,103
Debt securities 5 0 — 5
Millions of yen
2009
Cost / Amortized Gross unrealized Gross unrealized cost holding gains holding losses Fair value
Available-for-sale:
Equity securities ¥118,509 ¥1,352 ¥6,899 ¥112,962
Debt securities 5 0 — 5
Thousands of U.S. dollars
2009
Cost / Amortized Gross unrealized Gross unrealized cost holding gains holding losses Fair value
Available-for-sale:
Equity securities $1,195,250 $13,636 $69,582 $1,139,304
Debt securities 50 0 — 50
The proceeds and gross realized gains (losses) from the sale of available-for-sale securities and other investments for the years ended March 31, 2007, 2008
and 2009 were as follows: Thousands of
Millions of yen U.S. dollars
2007 2008 2009 2009
Proceeds ¥448 ¥896 ¥ 660 $ 6,657
Gross realized gains 314 748 377 3,802
Gross realized losses (118) (2) (267) (2,693)
88 OPENING DOORS : FINANCIAL SECTION : NOTES TO CONSOLIDATED FINANCIAL STATEMENTS

Gross unrealized holding losses on and fair value of available-for-sale securities and cost method investments included in other investments as of March 31,
2008 and 2009, aggregated by investment category and length of time during which individual securities were in a continuous unrealized loss position were
as follows:
Millions of yen
2008
Less than 12 months 12 months or longer Total
Gross unrealized Gross unrealized Gross unrealized Fair value holding losses Fair value holding losses Fair value holding losses
Available-for-sale:
Equity securities ¥97,739 ¥20,122 ¥2,783 ¥1,682 ¥100,522 ¥21,804
Cost method investments 7 20 184 162 191 182
Millions of yen
2009
Less than 12 months 12 months or longer Total
Gross unrealized Gross unrealized Gross unrealized Fair value holding losses Fair value holding losses Fair value holding losses
Available-for-sale:
Equity securities ¥62,405 ¥6,899 — — ¥62,405 ¥6,899
Cost method investments 438 1,398 ¥35 ¥68 473 1,466
Thousands of U.S. dollars
2009
Less than 12 months 12 months or longer Total
Gross unrealized Gross unrealized Gross unrealized Fair value holding losses Fair value holding losses Fair value holding losses
Available-for-sale:
Equity securities $629,400 $69,582 — — $629,400 $69,582
Cost method investments 4,418 14,100 $353 $686 4,771 14,786
Other investments include long-term investments in various privately
held companies.
For long-term investments in various privately held companies for which
there are no quoted market prices, a reasonable estimate of fair value could
not be made without incurring excessive costs. Accordingly, DOCOMO
believes that it is not practicable to disclose estimated fair values of these cost
method investments. Unless DOCOMO identifies events or changes in circum-
stances that may have had a significant adverse effect on the fair value of
these investments, the fair value of such cost method investments are
not estimated.
The aggregate carrying amount of cost method investments included in other investments and the aggregate carrying amount of investments whose fair
values were not evaluated for impairment as of March 31, 2008 and 2009 was as follows: Thousands of
Millions of yen U.S. dollars
2008 2009 2009
Cost method investments included in other investments ¥29,209 ¥28,538 $287,827
Including: Investments whose fair values were not evaluated for impairment 26,383 25,709 259,294
The amount of other than temporary impairment of marketable securities
and other investments is disclosed in Note 13.
DOCOMO held approximately 11% of the outstanding common shares of
KT Freetel Co., Ltd. (“KTF”) as of March 31, 2009, with the initial acquisition
cost of ¥65,602 million. On January 20, 2009, DOCOMO agreed with KT
Corporation (“KT”) that DOCOMO would exchange 40% of its KTF share-
holding for KT common shares and the remaining 60% for KT exchangeable
bonds in connection with the proposed merger between KT and KTF. Therefore,
DOCOMO determined that the decline in value of KTF shares was other than
temporary and recognized ¥26,313 million ($265,386 thousand) of impair-
ment loss on the investment in KTF shares based on its fair value as of March
31, 2009. The loss is recorded in other income (expense) under the line item
“Other, net” in the consolidated statement of income and comprehensive
income. The exchange of KTF shares for KT exchangeable bonds and for
KT common shares was carried out on May 27, 2009 and June 1, 2009,
respectively.
89

8. gOODwILL AND OTHER INTANgIBLE ASSETS: goodwill— The majority of DOCOMO’s goodwill was recognized when DOCOMO purchased all the remaining minority interests in its eight regional subsidiaries through
share exchanges and made these subsidiaries wholly owned in November 2002.
The changes in the carrying amount of goodwill by business segment for the years ended March 31, 2008 and 2009 were as follows:
Millions of yen
2008
Mobile phone Miscellaneous business businesses Consolidated
Balance at beginning of year ¥140,165 ¥ 7,656 ¥147,821
Goodwill acquired during the year — 11,662 11,662
Foreign currency translation adjustment (275) (319) (594)
Balance at end of year ¥139,890 ¥18,999 ¥158,889
Millions of yen
2009
Mobile phone Miscellaneous business businesses Consolidated
Balance at beginning of year ¥139,890 ¥18,999 ¥158,889
Goodwill acquired during the year 18 102 120
Goodwill decreased during the year (0) (344) (344)
Foreign currency translation adjustment (1,293) (2,987) (4,280)
Balance at end of year ¥138,615 ¥15,770 ¥154,385
Thousands of U.S. dollars
2009
Mobile phone Miscellaneous business businesses Consolidated
Balance at beginning of year $1,410,893 $191,619 $1,602,512
Goodwill acquired during the year 181 1,029 1,210
Goodwill decreased during the year (0) (3,470) (3,470)
Foreign currency translation adjustment (13,041) (30,126) (43,167)
Balance at end of year $1,398,033 $159,052 $1,557,085
Information regarding business segments is discussed in Note 15.
Other intangible assets— The following tables display the major components of DOCOMO’s intangible assets, all of which are subject to amortization, as of March 31, 2008 and 2009.
Millions of yen
2008
Gross carrying Accumulated Net carrying amount amortization amount
Software for telecommunications network ¥ 623,107 ¥ 400,032 ¥223,075
Internal-use software 876,792 617,071 259,721
Software acquired to be used in the manufacture of handsets 89,560 40,480 49,080
Customer related assets 50,949 45,996 4,953
Rights to use telecommunications facilities of wireline operators 19,151 9,145 10,006
Other 11,300 2,876 8,424
Total ¥1,670,859 ¥1,115,600 ¥555,259
90 OPENING DOORS : FINANCIAL SECTION : NOTES TO CONSOLIDATED FINANCIAL STATEMENTS
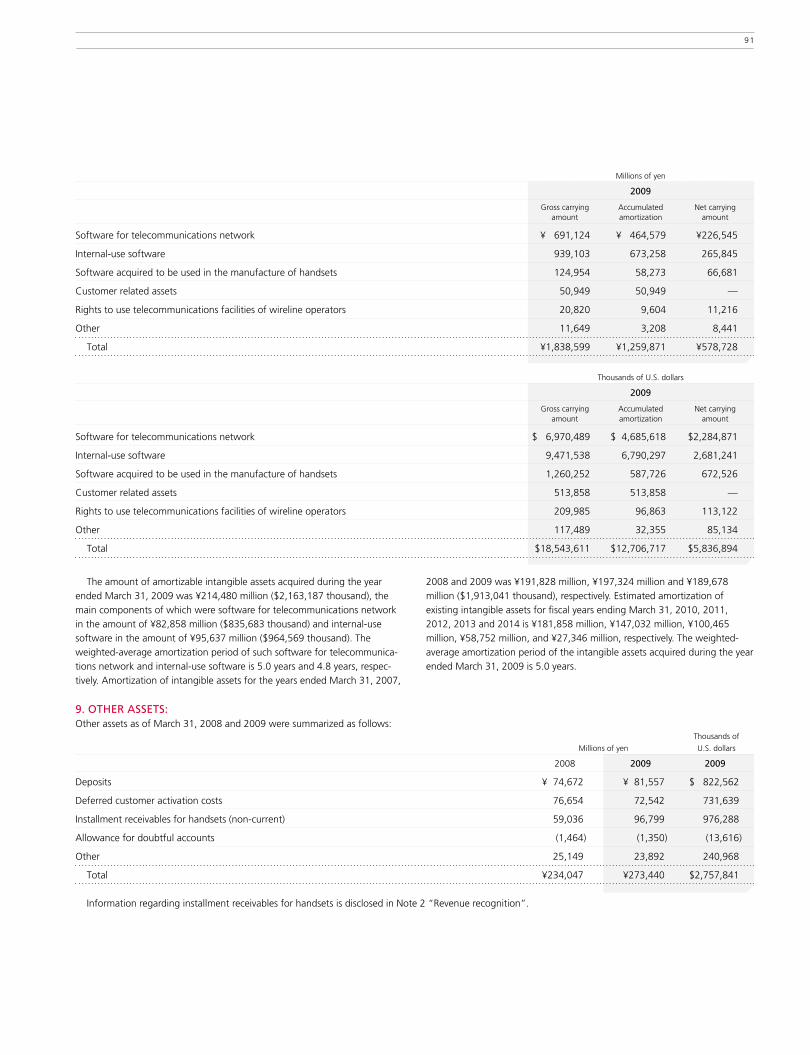
Millions of yen
2009
Gross carrying Accumulated Net carrying amount amortization amount
Software for telecommunications network ¥ 691,124 ¥ 464,579 ¥226,545
Internal-use software 939,103 673,258 265,845
Software acquired to be used in the manufacture of handsets 124,954 58,273 66,681
Customer related assets 50,949 50,949 —
Rights to use telecommunications facilities of wireline operators 20,820 9,604 11,216
Other 11,649 3,208 8,441
Total ¥1,838,599 ¥1,259,871 ¥578,728
Thousands of U.S. dollars
2009
Gross carrying Accumulated Net carrying amount amortization amount
Software for telecommunications network $ 6,970,489 $ 4,685,618 $2,284,871
Internal-use software 9,471,538 6,790,297 2,681,241
Software acquired to be used in the manufacture of handsets 1,260,252 587,726 672,526
Customer related assets 513,858 513,858 —
Rights to use telecommunications facilities of wireline operators 209,985 96,863 113,122
Other 117,489 32,355 85,134
Total $18,543,611 $12,706,717 $5,836,894
The amount of amortizable intangible assets acquired during the year
ended March 31, 2009 was ¥214,480 million ($2,163,187 thousand), the
main components of which were software for telecommunications network
in the amount of ¥82,858 million ($835,683 thousand) and internal-use
software in the amount of ¥95,637 million ($964,569 thousand). The
weighted-average amortization period of such software for telecommunica-
tions network and internal-use software is 5.0 years and 4.8 years, respec-
tively. Amortization of intangible assets for the years ended March 31, 2007,
2008 and 2009 was ¥191,828 million, ¥197,324 million and ¥189,678
million ($1,913,041 thousand), respectively. Estimated amortization of
existing intangible assets for fiscal years ending March 31, 2010, 2011,
2012, 2013 and 2014 is ¥181,858 million, ¥147,032 million, ¥100,465
million, ¥58,752 million, and ¥27,346 million, respectively. The weighted-
average amortization period of the intangible assets acquired during the year
ended March 31, 2009 is 5.0 years.
9. OTHER ASSETS:Other assets as of March 31, 2008 and 2009 were summarized as follows: Thousands of
Millions of yen U.S. dollars
2008 2009 2009
Deposits ¥ 74,672 ¥ 81,557 $ 822,562
Deferred customer activation costs 76,654 72,542 731,639
Installment receivables for handsets (non-current) 59,036 96,799 976,288
Allowance for doubtful accounts (1,464) (1,350) (13,616)
Other 25,149 23,892 240,968
Total ¥234,047 ¥273,440 $2,757,841
Information regarding installment receivables for handsets is disclosed in Note 2 “Revenue recognition”.
91
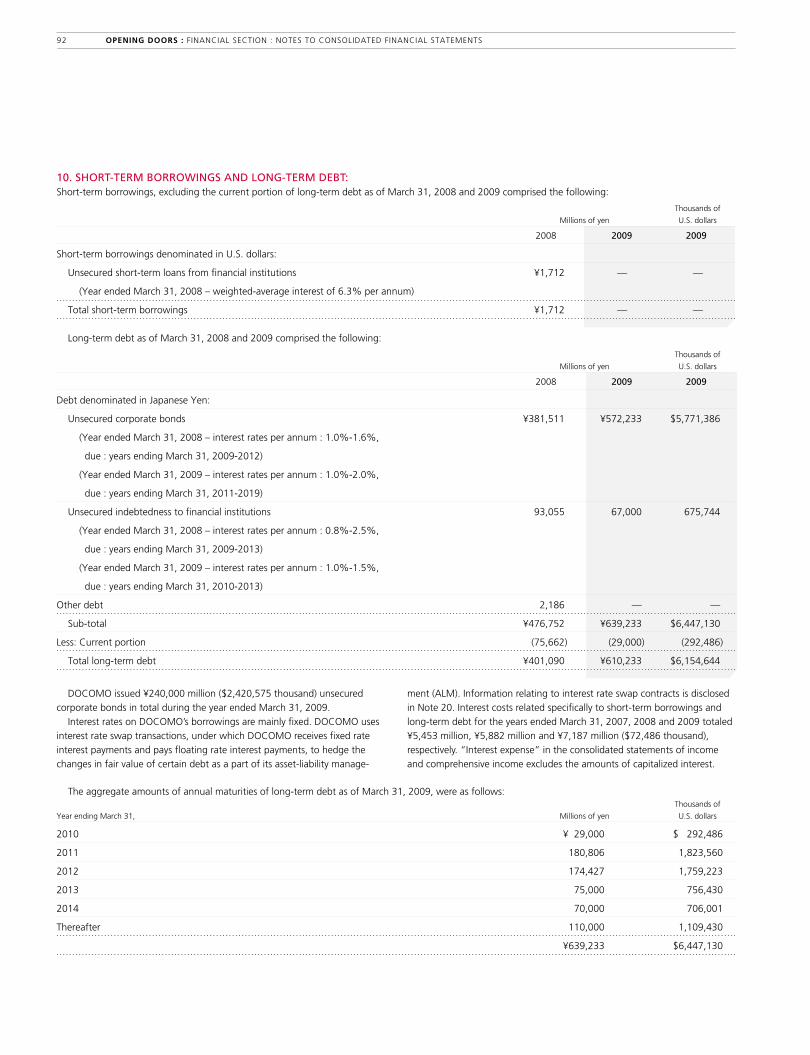
10. SHORT-TERM BORROwINgS AND LONg-TERM DEBT: Short-term borrowings, excluding the current portion of long-term debt as of March 31, 2008 and 2009 comprised the following:
Thousands of
Millions of yen U.S. dollars
2008 2009 2009
Short-term borrowings denominated in U.S. dollars:
Unsecured short-term loans from financial institutions ¥1,712 — —
(Year ended March 31, 2008 – weighted-average interest of 6.3% per annum)
Total short-term borrowings ¥1,712 — —
Long-term debt as of March 31, 2008 and 2009 comprised the following:
Thousands of
Millions of yen U.S. dollars
2008 2009 2009
Debt denominated in Japanese Yen:
Unsecured corporate bonds ¥381,511 ¥572,233 $5,771,386
(Year ended March 31, 2008 – interest rates per annum : 1.0%-1.6%,
due : years ending March 31, 2009-2012)
(Year ended March 31, 2009 – interest rates per annum : 1.0%-2.0%,
due : years ending March 31, 2011-2019)
Unsecured indebtedness to financial institutions 93,055 67,000 675,744
(Year ended March 31, 2008 – interest rates per annum : 0.8%-2.5%,
due : years ending March 31, 2009-2013)
(Year ended March 31, 2009 – interest rates per annum : 1.0%-1.5%,
due : years ending March 31, 2010-2013)
Other debt 2,186 — —
Sub-total ¥476,752 ¥639,233 $6,447,130
Less: Current portion (75,662) (29,000) (292,486)
Total long-term debt ¥401,090 ¥610,233 $6,154,644
DOCOMO issued ¥240,000 million ($2,420,575 thousand) unsecured
corporate bonds in total during the year ended March 31, 2009.
Interest rates on DOCOMO’s borrowings are mainly fixed. DOCOMO uses
interest rate swap transactions, under which DOCOMO receives fixed rate
interest payments and pays floating rate interest payments, to hedge the
changes in fair value of certain debt as a part of its asset-liability manage-
ment (ALM). Information relating to interest rate swap contracts is disclosed
in Note 20. Interest costs related specifically to short-term borrowings and
long-term debt for the years ended March 31, 2007, 2008 and 2009 totaled
¥5,453 million, ¥5,882 million and ¥7,187 million ($72,486 thousand),
respectively. “Interest expense” in the consolidated statements of income
and comprehensive income excludes the amounts of capitalized interest.
The aggregate amounts of annual maturities of long-term debt as of March 31, 2009, were as follows: Thousands of
Year ending March 31, Millions of yen U.S. dollars
2010 ¥ 29,000 $ 292,486
2011 180,806 1,823,560
2012 174,427 1,759,223
2013 75,000 756,430
2014 70,000 706,001
Thereafter 110,000 1,109,430
¥639,233 $6,447,130
92 OPENING DOORS : FINANCIAL SECTION : NOTES TO CONSOLIDATED FINANCIAL STATEMENTS
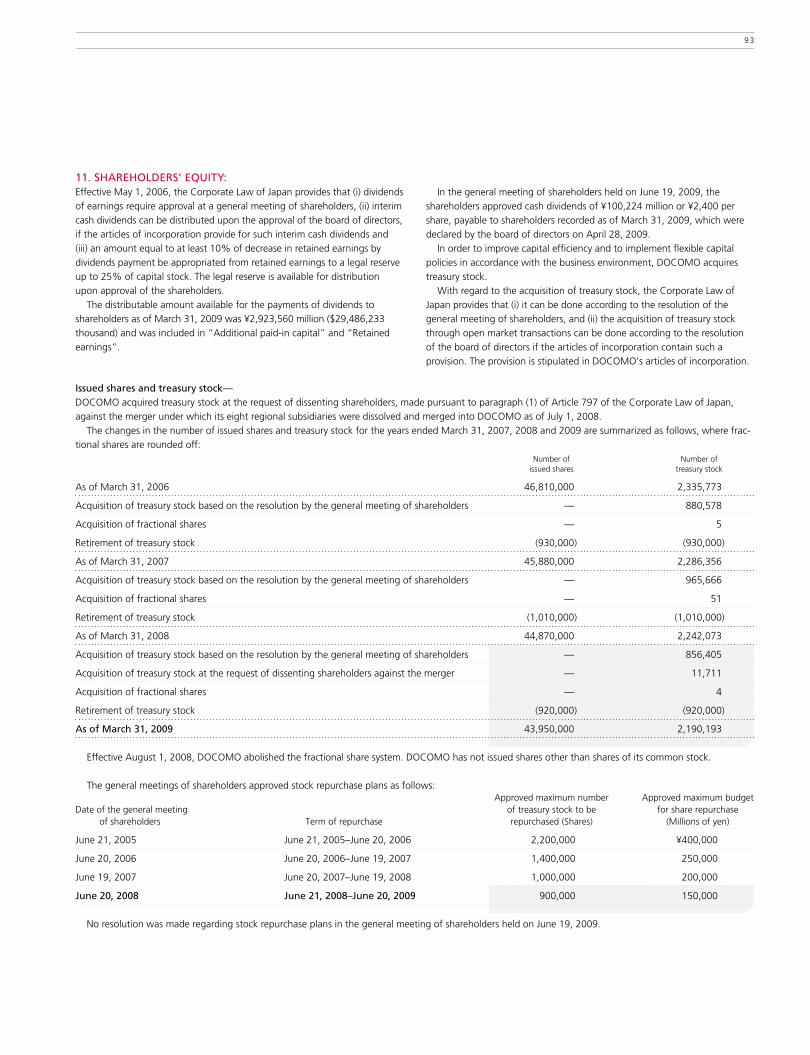
11. SHAREHOLDERS’ EQUITY: Effective May 1, 2006, the Corporate Law of Japan provides that (i) dividends
of earnings require approval at a general meeting of shareholders, (ii) interim
cash dividends can be distributed upon the approval of the board of directors,
if the articles of incorporation provide for such interim cash dividends and
(iii) an amount equal to at least 10% of decrease in retained earnings by
dividends payment be appropriated from retained earnings to a legal reserve
up to 25% of capital stock. The legal reserve is available for distribution
upon approval of the shareholders.
The distributable amount available for the payments of dividends to
shareholders as of March 31, 2009 was ¥2,923,560 million ($29,486,233
thousand) and was included in “Additional paid-in capital” and “Retained
earnings”.
In the general meeting of shareholders held on June 19, 2009, the
shareholders approved cash dividends of ¥100,224 million or ¥2,400 per
share, payable to shareholders recorded as of March 31, 2009, which were
declared by the board of directors on April 28, 2009.
In order to improve capital efficiency and to implement flexible capital
policies in accordance with the business environment, DOCOMO acquires
treasury stock.
With regard to the acquisition of treasury stock, the Corporate Law of
Japan provides that (i) it can be done according to the resolution of the
general meeting of shareholders, and (ii) the acquisition of treasury stock
through open market transactions can be done according to the resolution
of the board of directors if the articles of incorporation contain such a
provision. The provision is stipulated in DOCOMO's articles of incorporation.
Issued shares and treasury stock— DOCOMO acquired treasury stock at the request of dissenting shareholders, made pursuant to paragraph (1) of Article 797 of the Corporate Law of Japan,
against the merger under which its eight regional subsidiaries were dissolved and merged into DOCOMO as of July 1, 2008.
The changes in the number of issued shares and treasury stock for the years ended March 31, 2007, 2008 and 2009 are summarized as follows, where frac-
tional shares are rounded off: Number of Number of issued shares treasury stock
As of March 31, 2006 46,810,000 2,335,773
Acquisition of treasury stock based on the resolution by the general meeting of shareholders — 880,578
Acquisition of fractional shares — 5
Retirement of treasury stock (930,000) (930,000)
As of March 31, 2007 45,880,000 2,286,356
Acquisition of treasury stock based on the resolution by the general meeting of shareholders — 965,666
Acquisition of fractional shares — 51
Retirement of treasury stock (1,010,000) (1,010,000)
As of March 31, 2008 44,870,000 2,242,073
Acquisition of treasury stock based on the resolution by the general meeting of shareholders — 856,405
Acquisition of treasury stock at the request of dissenting shareholders against the merger — 11,711
Acquisition of fractional shares — 4
Retirement of treasury stock (920,000) (920,000)
As of March 31, 2009 43,950,000 2,190,193
Effective August 1, 2008, DOCOMO abolished the fractional share system. DOCOMO has not issued shares other than shares of its common stock.
The general meetings of shareholders approved stock repurchase plans as follows: Approved maximum number Approved maximum budget Date of the general meeting of treasury stock to be for share repurchase of shareholders Term of repurchase repurchased (Shares) (Millions of yen)
June 21, 2005 June 21, 2005–June 20, 2006 2,200,000 ¥400,000
June 20, 2006 June 20, 2006–June 19, 2007 1,400,000 250,000
June 19, 2007 June 20, 2007–June 19, 2008 1,000,000 200,000
June 20, 2008 June 21, 2008–June 20, 2009 900,000 150,000
No resolution was made regarding stock repurchase plans in the general meeting of shareholders held on June 19, 2009.
93
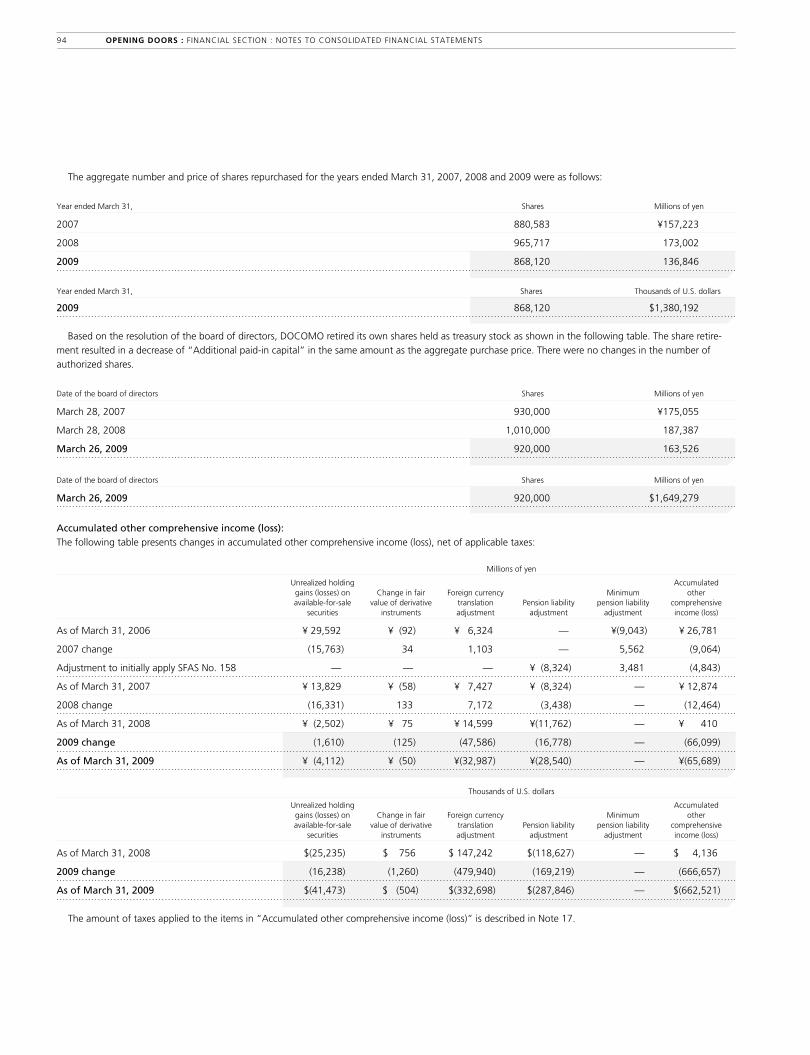
The aggregate number and price of shares repurchased for the years ended March 31, 2007, 2008 and 2009 were as follows:
Year ended March 31, Shares Millions of yen
2007 880,583 ¥157,223
2008 965,717 173,002
2009 868,120 136,846
Year ended March 31, Shares Thousands of U.S. dollars
2009 868,120 $1,380,192
Based on the resolution of the board of directors, DOCOMO retired its own shares held as treasury stock as shown in the following table. The share retire-
ment resulted in a decrease of “Additional paid-in capital” in the same amount as the aggregate purchase price. There were no changes in the number of
authorized shares.
Date of the board of directors Shares Millions of yen
March 28, 2007 930,000 ¥175,055
March 28, 2008 1,010,000 187,387
March 26, 2009 920,000 163,526
Date of the board of directors Shares Millions of yen
March 26, 2009 920,000 $1,649,279
Accumulated other comprehensive income (loss): The following table presents changes in accumulated other comprehensive income (loss), net of applicable taxes:
Millions of yen
Unrealized holding Accumulated gains (losses) on Change in fair Foreign currency Minimum other available-for-sale value of derivative translation Pension liability pension liability comprehensive securities instruments adjustment adjustment adjustment income (loss)
As of March 31, 2006 ¥ 29,592 ¥ (92) ¥ 6,324 — ¥(9,043) ¥ 26,781
2007 change (15,763) 34 1,103 — 5,562 (9,064)
Adjustment to initially apply SFAS No. 158 — — — ¥ (8,324) 3,481 (4,843)
As of March 31, 2007 ¥ 13,829 ¥ (58) ¥ 7,427 ¥ (8,324) — ¥ 12,874
2008 change (16,331) 133 7,172 (3,438) — (12,464)
As of March 31, 2008 ¥ (2,502) ¥ 75 ¥ 14,599 ¥(11,762) — ¥ 410
2009 change (1,610) (125) (47,586) (16,778) — (66,099)
As of March 31, 2009 ¥ (4,112) ¥ (50) ¥(32,987) ¥(28,540) — ¥(65,689)
Thousands of U.S. dollars
Unrealized holding Accumulated gains (losses) on Change in fair Foreign currency Minimum other available-for-sale value of derivative translation Pension liability pension liability comprehensive securities instruments adjustment adjustment adjustment income (loss)
As of March 31, 2008 $(25,235) $ 756 $ 147,242 $(118,627) — $ 4,136
2009 change (16,238) (1,260) (479,940) (169,219) — (666,657)
As of March 31, 2009 $(41,473) $ (504) $(332,698) $(287,846) — $(662,521)
The amount of taxes applied to the items in “Accumulated other comprehensive income (loss)” is described in Note 17.
94 OPENING DOORS : FINANCIAL SECTION : NOTES TO CONSOLIDATED FINANCIAL STATEMENTS

Research and development expenses— Expenditures for research and development are charged to expense as
incurred. Research and development expenses are included primarily in
“Selling, general and administrative” expenses and amounted to ¥99,315
million, ¥100,035 million and ¥100,793 million ($1,016,571 thousand) for
the years ended March 31, 2007, 2008 and 2009, respectively.
Advertising expenses— Expenditures for advertising are also expensed as incurred. Such expenditures
are included in “Selling, general and administrative” expenses and amounted
to ¥53,126 million, ¥55,357 million and ¥54,986 million ($554,574 thousand)
for the years ended March 31, 2007, 2008 and 2009, respectively.
13. OTHER INCOME (ExPENSE): Components of other income (expense) included in “Other, net” in the consolidated statements of income and comprehensive income for the years ended
March 31, 2007, 2008 and 2009 were as follows:
Thousands of
Millions of yen U.S. dollars
2007 2008 2009 2009
Net realized gains on investments in affiliates — ¥ 333 — —
Net realized gains on marketable securities and other investments ¥ 196 746 ¥ 110 $ 1,109
Other than temporary impairment of marketable securities and other investments (8,086) (11,418) (57,812) (583,076)
Foreign exchange gains (losses), net 281 (1,609) (851) (8,583)
Rental revenue received 2,407 2,256 2,144 21,624
Dividends income 7,203 3,310 2,951 29,763
Penalties and compensation for damages 2,000 2,193 4,161 41,967
Other, net (292) (1,366) 1,267 12,778
Total ¥ 3,709 ¥ (5,555) ¥(48,030) $(484,418)
14. RELATED PARTY TRANSACTIONS: As previously noted, DOCOMO is majority-owned by NTT, which is a holding
company for more than 400 companies comprising the NTT group.
DOCOMO has entered into a number of different types of transactions
with NTT, its other subsidiaries and its affiliated companies in the ordinary
course of business. DOCOMO’s transactions with NTT group companies
include purchases of wireline telecommunications services (i.e. for
DOCOMO’s offices and operations facilities) based on actual usage, leasing
of various telecommunications facilities and sales of DOCOMO’s various
wireless communications services.
Receivables primarily include customer accounts receivables related to
DOCOMO’s sales of wireless communications services to customers, which
NTT collects on behalf of DOCOMO. These sales are recorded as revenue
from each third-party customer receiving the services and are not included in
the amount of sales to related parties. During the years ended March 31,
2007, 2008 and 2009, DOCOMO purchased capital equipment from NTT
group companies in the amount of ¥103,728 million, ¥78,112 million and
¥70,840 million ($714,473 thousand), respectively.
DOCOMO has entered into contracts of bailment of cash for consumption
with NTT FINANCE CORPORATION (“NTT FINANCE”) for cash management
purposes. NTT and its subsidiaries collectively own 99.3% of the voting
interests in NTT FINANCE, of which DOCOMO owned 2.9% as of March 31,
2009. Accordingly, NTT FINANCE is a related party of DOCOMO. Under the
terms of the contracts, funds are bailed to NTT FINANCE and DOCOMO can
withdraw the funds upon its demand. The balance of bailment was
¥100,000 million as of March 31, 2008. The assets related to the contracts
were recorded as “Cash and cash equivalents” of ¥50,000 million and
“Short-term investments” of ¥50,000 million in the consolidated balance
sheet as of March 31, 2008. The contracts had remaining terms to maturity
ranging from 1 month to 3 months with an average interest rate of 0.4%
per annum as of March 31, 2008.
The balance of bailment was ¥60,000 million ($605,144 thousand) as of
March 31, 2009. The assets related to the contracts were recorded as “Cash
and cash equivalents” in the consolidated balance sheet as of March 31,
2009. The contracts had remaining terms to maturity ranging up to 1 month
with an average interest rate of 0.5% per annum as of March 31, 2009.
The average balance of the contracts of bailment expired during the year
ended March 31, 2007, 2008 and 2009 was ¥25,178 million, ¥51,243
million and ¥48,778 million ($491,962 thousand), respectively. The recorded
amount of interest income derived from the contracts was ¥269 million,
¥388 million and ¥270 million ($2,723 thousand) for the years ended March
31, 2007, 2008 and 2009, respectively.
12. RESEARCH AND DEVELOPMENT ExPENSES AND ADVERTISINg ExPENSES:
95
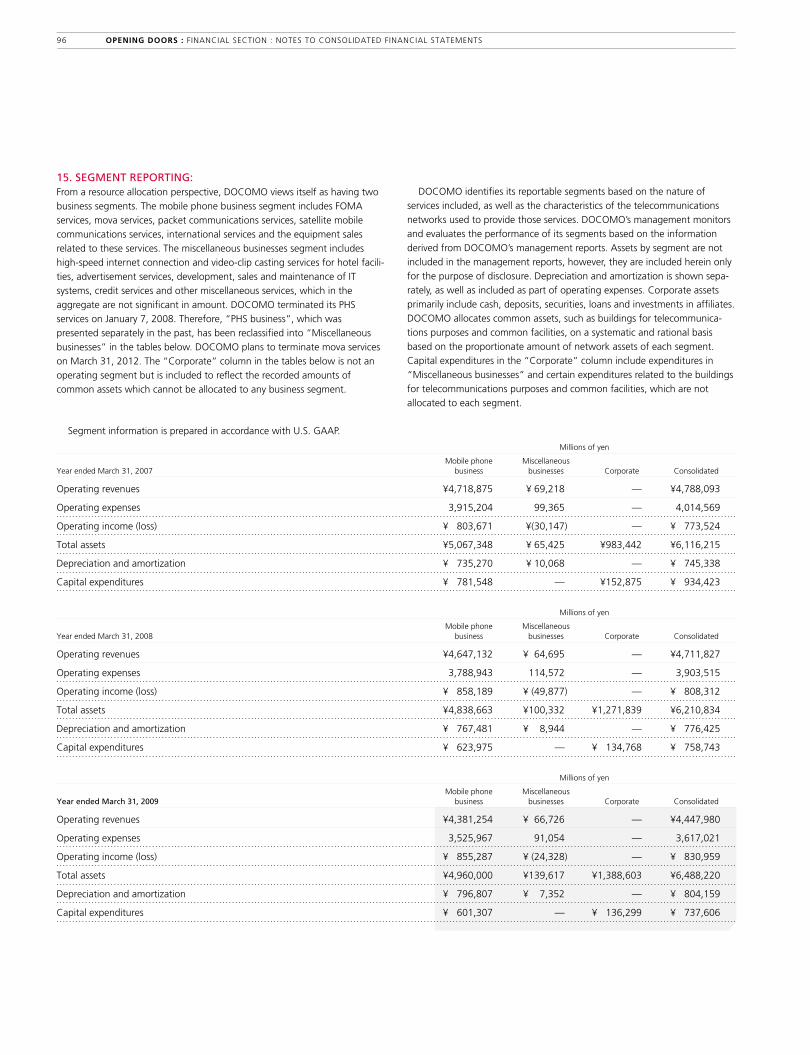
15. SEgMENT REPORTINg: From a resource allocation perspective, DOCOMO views itself as having two
business segments. The mobile phone business segment includes FOMA
services, mova services, packet communications services, satellite mobile
communications services, international services and the equipment sales
related to these services. The miscellaneous businesses segment includes
high-speed internet connection and video-clip casting services for hotel facili-
ties, advertisement services, development, sales and maintenance of IT
systems, credit services and other miscellaneous services, which in the
aggregate are not significant in amount. DOCOMO terminated its PHS
services on January 7, 2008. Therefore, “PHS business”, which was
presented separately in the past, has been reclassified into “Miscellaneous
businesses” in the tables below. DOCOMO plans to terminate mova services
on March 31, 2012. The “Corporate” column in the tables below is not an
operating segment but is included to reflect the recorded amounts of
common assets which cannot be allocated to any business segment.
DOCOMO identifies its reportable segments based on the nature of
services included, as well as the characteristics of the telecommunications
networks used to provide those services. DOCOMO’s management monitors
and evaluates the performance of its segments based on the information
derived from DOCOMO’s management reports. Assets by segment are not
included in the management reports, however, they are included herein only
for the purpose of disclosure. Depreciation and amortization is shown sepa-
rately, as well as included as part of operating expenses. Corporate assets
primarily include cash, deposits, securities, loans and investments in affiliates.
DOCOMO allocates common assets, such as buildings for telecommunica-
tions purposes and common facilities, on a systematic and rational basis
based on the proportionate amount of network assets of each segment.
Capital expenditures in the “Corporate” column include expenditures in
“Miscellaneous businesses” and certain expenditures related to the buildings
for telecommunications purposes and common facilities, which are not
allocated to each segment.
Segment information is prepared in accordance with U.S. GAAP.
Millions of yen
Mobile phone Miscellaneous Year ended March 31, 2007 business businesses Corporate Consolidated
Operating revenues ¥4,718,875 ¥ 69,218 — ¥4,788,093
Operating expenses 3,915,204 99,365 — 4,014,569
Operating income (loss) ¥ 803,671 ¥(30,147) — ¥ 773,524
Total assets ¥5,067,348 ¥ 65,425 ¥983,442 ¥6,116,215
Depreciation and amortization ¥ 735,270 ¥ 10,068 — ¥ 745,338
Capital expenditures ¥ 781,548 — ¥152,875 ¥ 934,423
Millions of yen
Mobile phone Miscellaneous Year ended March 31, 2008 business businesses Corporate Consolidated
Operating revenues ¥4,647,132 ¥ 64,695 — ¥4,711,827
Operating expenses 3,788,943 114,572 — 3,903,515
Operating income (loss) ¥ 858,189 ¥ (49,877) — ¥ 808,312
Total assets ¥4,838,663 ¥100,332 ¥1,271,839 ¥6,210,834
Depreciation and amortization ¥ 767,481 ¥ 8,944 — ¥ 776,425
Capital expenditures ¥ 623,975 — ¥ 134,768 ¥ 758,743
Millions of yen
Mobile phone Miscellaneous Year ended March 31, 2009 business businesses Corporate Consolidated
Operating revenues ¥4,381,254 ¥ 66,726 — ¥4,447,980
Operating expenses 3,525,967 91,054 — 3,617,021
Operating income (loss) ¥ 855,287 ¥ (24,328) — ¥ 830,959
Total assets ¥4,960,000 ¥139,617 ¥1,388,603 ¥6,488,220
Depreciation and amortization ¥ 796,807 ¥ 7,352 — ¥ 804,159
Capital expenditures ¥ 601,307 — ¥ 136,299 ¥ 737,606
96 OPENING DOORS : FINANCIAL SECTION : NOTES TO CONSOLIDATED FINANCIAL STATEMENTS
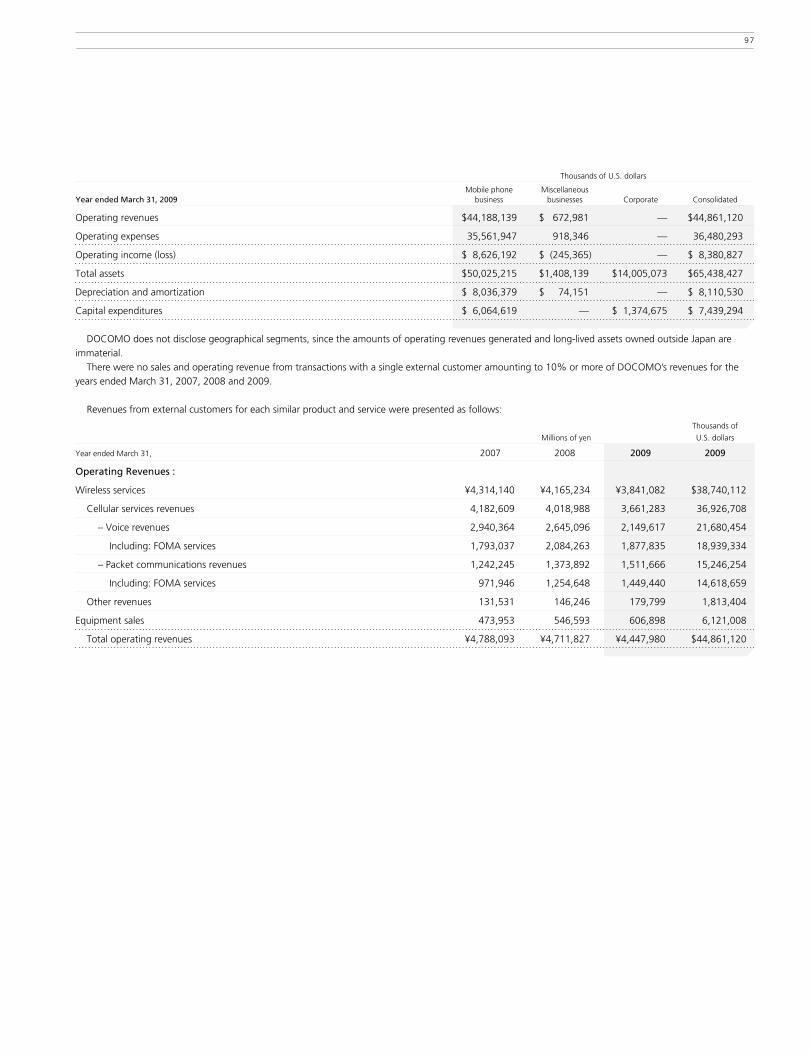
Thousands of U.S. dollars
Mobile phone Miscellaneous Year ended March 31, 2009 business businesses Corporate Consolidated
Operating revenues $44,188,139 $ 672,981 — $44,861,120
Operating expenses 35,561,947 918,346 — 36,480,293
Operating income (loss) $ 8,626,192 $ (245,365) — $ 8,380,827
Total assets $50,025,215 $1,408,139 $14,005,073 $65,438,427
Depreciation and amortization $ 8,036,379 $ 74,151 — $ 8,110,530
Capital expenditures $ 6,064,619 — $ 1,374,675 $ 7,439,294
DOCOMO does not disclose geographical segments, since the amounts of operating revenues generated and long-lived assets owned outside Japan are
immaterial.
There were no sales and operating revenue from transactions with a single external customer amounting to 10% or more of DOCOMO’s revenues for the
years ended March 31, 2007, 2008 and 2009.
Revenues from external customers for each similar product and service were presented as follows:
Thousands of
Millions of yen U.S. dollars
Year ended March 31, 2007 2008 2009 2009
Operating Revenues :
Wireless services ¥4,314,140 ¥4,165,234 ¥3,841,082 $38,740,112
Cellular services revenues 4,182,609 4,018,988 3,661,283 36,926,708
– Voice revenues 2,940,364 2,645,096 2,149,617 21,680,454
Including: FOMA services 1,793,037 2,084,263 1,877,835 18,939,334
– Packet communications revenues 1,242,245 1,373,892 1,511,666 15,246,254
Including: FOMA services 971,946 1,254,648 1,449,440 14,618,659
Other revenues 131,531 146,246 179,799 1,813,404
Equipment sales 473,953 546,593 606,898 6,121,008
Total operating revenues ¥4,788,093 ¥4,711,827 ¥4,447,980 $44,861,120
97
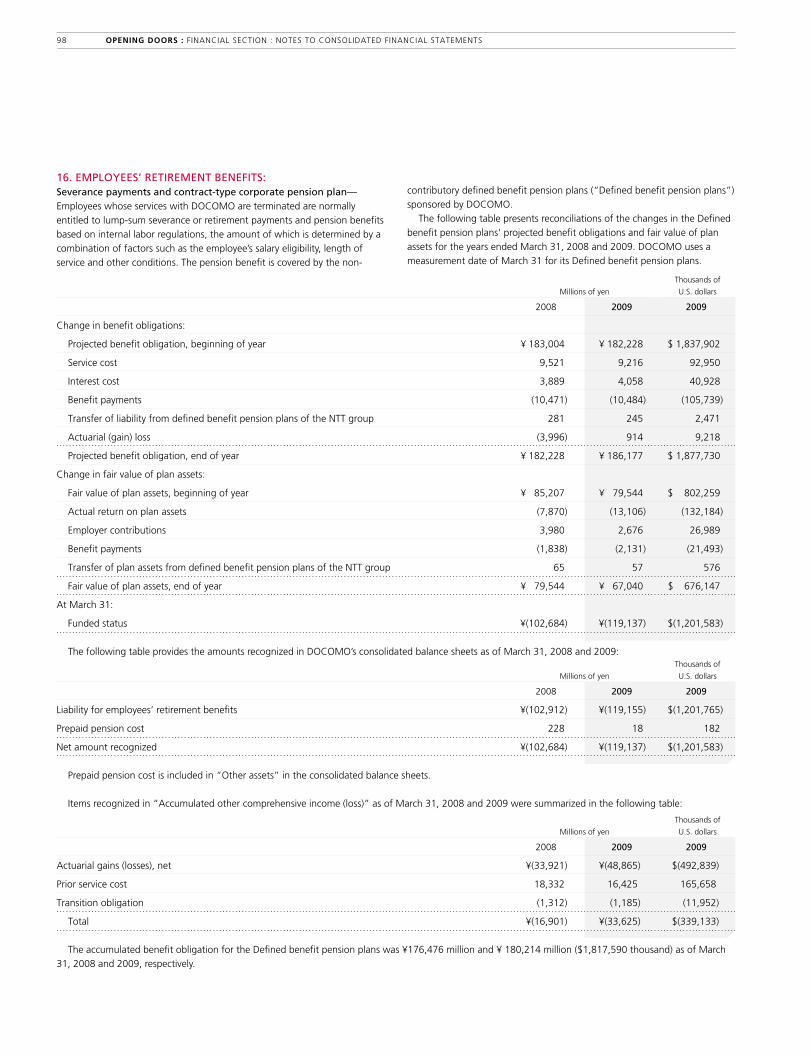
Thousands of
Millions of yen U.S. dollars
2008 2009 2009
Change in benefit obligations:
Projected benefit obligation, beginning of year ¥ 183,004 ¥ 182,228 $ 1,837,902
Service cost 9,521 9,216 92,950
Interest cost 3,889 4,058 40,928
Benefit payments (10,471) (10,484) (105,739)
Transfer of liability from defined benefit pension plans of the NTT group 281 245 2,471
Actuarial (gain) loss (3,996) 914 9,218
Projected benefit obligation, end of year ¥ 182,228 ¥ 186,177 $ 1,877,730
Change in fair value of plan assets:
Fair value of plan assets, beginning of year ¥ 85,207 ¥ 79,544 $ 802,259
Actual return on plan assets (7,870) (13,106) (132,184)
Employer contributions 3,980 2,676 26,989
Benefit payments (1,838) (2,131) (21,493)
Transfer of plan assets from defined benefit pension plans of the NTT group 65 57 576
Fair value of plan assets, end of year ¥ 79,544 ¥ 67,040 $ 676,147
At March 31:
Funded status ¥(102,684) ¥(119,137) $(1,201,583)
The following table provides the amounts recognized in DOCOMO’s consolidated balance sheets as of March 31, 2008 and 2009: Thousands of
Millions of yen U.S. dollars
2008 2009 2009
Liability for employees’ retirement benefits ¥(102,912) ¥(119,155) $(1,201,765)
Prepaid pension cost 228 18 182
Net amount recognized ¥(102,684) ¥(119,137) $(1,201,583)
Prepaid pension cost is included in “Other assets” in the consolidated balance sheets.
Items recognized in “Accumulated other comprehensive income (loss)” as of March 31, 2008 and 2009 were summarized in the following table:
Thousands of
Millions of yen U.S. dollars
2008 2009 2009
Actuarial gains (losses), net ¥(33,921) ¥(48,865) $(492,839)
Prior service cost 18,332 16,425 165,658
Transition obligation (1,312) (1,185) (11,952)
Total ¥(16,901) ¥(33,625) $(339,133)
The accumulated benefit obligation for the Defined benefit pension plans was ¥176,476 million and ¥ 180,214 million ($1,817,590 thousand) as of March
31, 2008 and 2009, respectively.
16. EMPLOYEES’ RETIREMENT BENEFITS: Severance payments and contract-type corporate pension plan— Employees whose services with DOCOMO are terminated are normally
entitled to lump-sum severance or retirement payments and pension benefits
based on internal labor regulations, the amount of which is determined by a
combination of factors such as the employee’s salary eligibility, length of
service and other conditions. The pension benefit is covered by the non-
contributory defined benefit pension plans (“Defined benefit pension plans”)
sponsored by DOCOMO.
The following table presents reconciliations of the changes in the Defined
benefit pension plans’ projected benefit obligations and fair value of plan
assets for the years ended March 31, 2008 and 2009. DOCOMO uses a
measurement date of March 31 for its Defined benefit pension plans.
98 OPENING DOORS : FINANCIAL SECTION : NOTES TO CONSOLIDATED FINANCIAL STATEMENTS

The projected benefit obligation, the accumulated benefit obligation and the fair value of plan assets in the pension plans with the projected or accumulated
benefit obligation in excess of the plan assets as of March 31, 2008 and 2009 were summarized as follows:
Thousands of
Millions of yen U.S. dollars
2008 2009 2009
Plans with projected benefit obligation in excess of plan assets
Projected benefit obligation ¥177,963 ¥186,169 $1,877,650
Fair value of plan assets 75,051 67,014 675,885
Plans with accumulated benefit obligation in excess of plan assets
Accumulated benefit obligation ¥172,239 ¥180,207 $1,817,519
Fair value of plan assets 75,051 67,014 675,885
The net periodic pension cost for the Defined benefit pension plans for the years ended March 31, 2007, 2008 and 2009 included the following
components:
Thousands of
Millions of yen U.S. dollars
2007 2008 2009 2009
Service cost ¥10,219 ¥ 9,521 ¥ 9,216 $ 92,950
Interest cost on projected benefit obligation 3,654 3,889 4,058 40,928
Expected return on plan assets (2,028) (2,144) (2,116) (21,341)
Amortization of prior service cost (1,907) (1,907) (1,907) (19,233)
Amortization of actuarial gains and losses 1,600 834 1,192 12,022
Amortization of transition obligation 127 127 127 1,281
Net periodic pension cost ¥11,665 ¥10,320 ¥10,570 $106,607
Other changes in plan assets and benefit obligations of the Defined benefit pension plans recognized in “Accumulated other comprehensive income (loss)”
for the years ended March 31, 2007, 2008 and 2009 included the following components:
Thousands of
Millions of yen U.S. dollars
2007 2008 2009 2009
Other changes in plan assets and benefit obligations recognized in
“Accumulated other comprehensive income (loss)”:
Adjustment to minimum pension liability ¥ (8,778) — — —
Actuarial (gains) losses arising during period, net 28,737 ¥ 6,018 ¥16,136 $162,743
Prior service cost arising during period (20,239) — — —
Transition obligation arising during period 1,439 — — —
Amortization of prior service cost — 1,907 1,907 19,233
Amortization of actuarial gains and losses — (834) (1,192) (12,022)
Amortization of transition obligation — (127) (127) (1,281)
Elimination of minimum pension liability (5,206) — — —
Total recognized in “Accumulated other comprehensive income (loss)” ¥ (4,047) ¥ 6,964 ¥16,724 $168,673
Total recognized in net periodic pension cost and
“Accumulated other comprehensive income (loss)” ¥ 7,618 ¥17,284 ¥27,294 $275,280
99
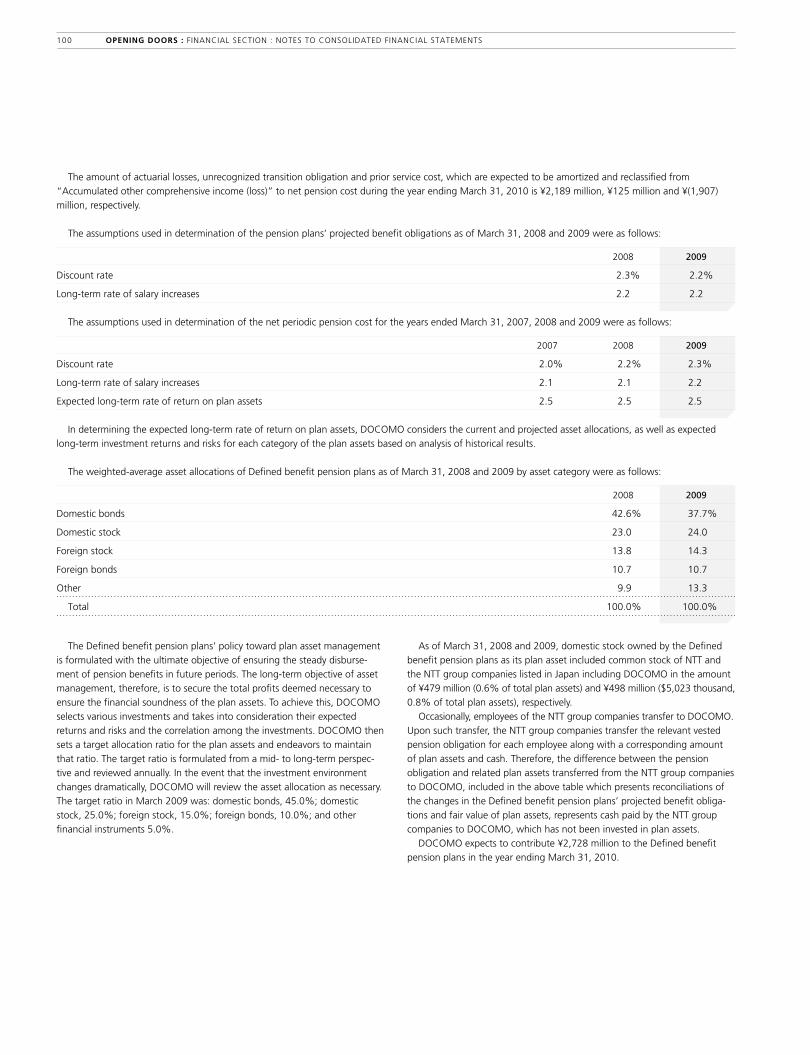
The amount of actuarial losses, unrecognized transition obligation and prior service cost, which are expected to be amortized and reclassified from
“Accumulated other comprehensive income (loss)” to net pension cost during the year ending March 31, 2010 is ¥2,189 million, ¥125 million and ¥(1,907)
million, respectively.
The assumptions used in determination of the pension plans’ projected benefit obligations as of March 31, 2008 and 2009 were as follows:
2008 2009
Discount rate 2.3% 2.2%
Long-term rate of salary increases 2.2 2.2
The assumptions used in determination of the net periodic pension cost for the years ended March 31, 2007, 2008 and 2009 were as follows:
2007 2008 2009
Discount rate 2.0% 2.2% 2.3%
Long-term rate of salary increases 2.1 2.1 2.2
Expected long-term rate of return on plan assets 2.5 2.5 2.5
In determining the expected long-term rate of return on plan assets, DOCOMO considers the current and projected asset allocations, as well as expected
long-term investment returns and risks for each category of the plan assets based on analysis of historical results.
The weighted-average asset allocations of Defined benefit pension plans as of March 31, 2008 and 2009 by asset category were as follows:
2008 2009
Domestic bonds 42.6% 37.7%
Domestic stock 23.0 24.0
Foreign stock 13.8 14.3
Foreign bonds 10.7 10.7
Other 9.9 13.3
Total 100.0% 100.0%
The Defined benefit pension plans’ policy toward plan asset management
is formulated with the ultimate objective of ensuring the steady disburse-
ment of pension benefits in future periods. The long-term objective of asset
management, therefore, is to secure the total profits deemed necessary to
ensure the financial soundness of the plan assets. To achieve this, DOCOMO
selects various investments and takes into consideration their expected
returns and risks and the correlation among the investments. DOCOMO then
sets a target allocation ratio for the plan assets and endeavors to maintain
that ratio. The target ratio is formulated from a mid- to long-term perspec-
tive and reviewed annually. In the event that the investment environment
changes dramatically, DOCOMO will review the asset allocation as necessary.
The target ratio in March 2009 was: domestic bonds, 45.0%; domestic
stock, 25.0%; foreign stock, 15.0%; foreign bonds, 10.0%; and other
financial instruments 5.0%.
As of March 31, 2008 and 2009, domestic stock owned by the Defined
benefit pension plans as its plan asset included common stock of NTT and
the NTT group companies listed in Japan including DOCOMO in the amount
of ¥479 million (0.6% of total plan assets) and ¥498 million ($5,023 thousand,
0.8% of total plan assets), respectively.
Occasionally, employees of the NTT group companies transfer to DOCOMO.
Upon such transfer, the NTT group companies transfer the relevant vested
pension obligation for each employee along with a corresponding amount
of plan assets and cash. Therefore, the difference between the pension
obligation and related plan assets transferred from the NTT group companies
to DOCOMO, included in the above table which presents reconciliations of
the changes in the Defined benefit pension plans’ projected benefit obliga-
tions and fair value of plan assets, represents cash paid by the NTT group
companies to DOCOMO, which has not been invested in plan assets.
DOCOMO expects to contribute ¥2,728 million to the Defined benefit
pension plans in the year ending March 31, 2010.
100 OPENING DOORS : FINANCIAL SECTION : NOTES TO CONSOLIDATED FINANCIAL STATEMENTS
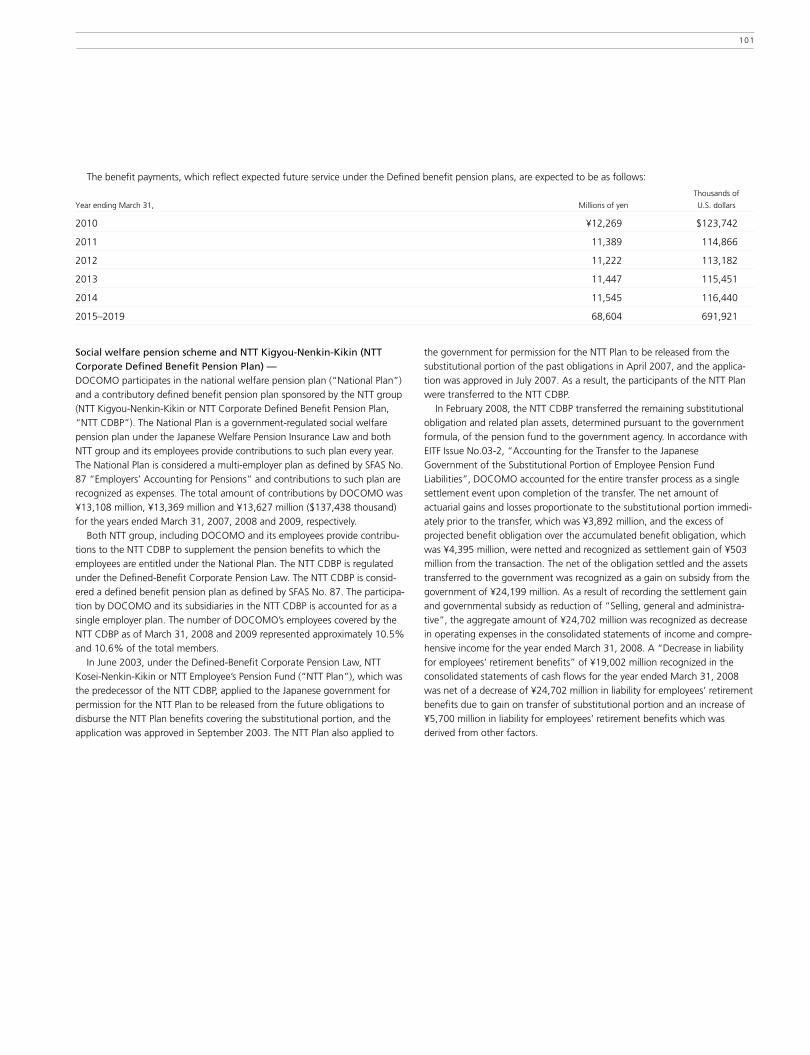
The benefit payments, which reflect expected future service under the Defined benefit pension plans, are expected to be as follows:
Thousands of
Year ending March 31, Millions of yen U.S. dollars
2010 ¥12,269 $123,742
2011 11,389 114,866
2012 11,222 113,182
2013 11,447 115,451
2014 11,545 116,440
2015–2019 68,604 691,921
Social welfare pension scheme and NTT kigyou-Nenkin-kikin (NTT Corporate Defined Benefit Pension Plan) —DOCOMO participates in the national welfare pension plan (“National Plan”)
and a contributory defined benefit pension plan sponsored by the NTT group
(NTT Kigyou-Nenkin-Kikin or NTT Corporate Defined Benefit Pension Plan,
“NTT CDBP”). The National Plan is a government-regulated social welfare
pension plan under the Japanese Welfare Pension Insurance Law and both
NTT group and its employees provide contributions to such plan every year.
The National Plan is considered a multi-employer plan as defined by SFAS No.
87 “Employers’ Accounting for Pensions” and contributions to such plan are
recognized as expenses. The total amount of contributions by DOCOMO was
¥13,108 million, ¥13,369 million and ¥13,627 million ($137,438 thousand)
for the years ended March 31, 2007, 2008 and 2009, respectively.
Both NTT group, including DOCOMO and its employees provide contribu-
tions to the NTT CDBP to supplement the pension benefits to which the
employees are entitled under the National Plan. The NTT CDBP is regulated
under the Defined-Benefit Corporate Pension Law. The NTT CDBP is consid-
ered a defined benefit pension plan as defined by SFAS No. 87. The participa-
tion by DOCOMO and its subsidiaries in the NTT CDBP is accounted for as a
single employer plan. The number of DOCOMO’s employees covered by the
NTT CDBP as of March 31, 2008 and 2009 represented approximately 10.5%
and 10.6% of the total members.
In June 2003, under the Defined-Benefit Corporate Pension Law, NTT
Kosei-Nenkin-Kikin or NTT Employee’s Pension Fund (“NTT Plan”), which was
the predecessor of the NTT CDBP, applied to the Japanese government for
permission for the NTT Plan to be released from the future obligations to
disburse the NTT Plan benefits covering the substitutional portion, and the
application was approved in September 2003. The NTT Plan also applied to
the government for permission for the NTT Plan to be released from the
substitutional portion of the past obligations in April 2007, and the applica-
tion was approved in July 2007. As a result, the participants of the NTT Plan
were transferred to the NTT CDBP.
In February 2008, the NTT CDBP transferred the remaining substitutional
obligation and related plan assets, determined pursuant to the government
formula, of the pension fund to the government agency. In accordance with
EITF Issue No.03-2, “Accounting for the Transfer to the Japanese
Government of the Substitutional Portion of Employee Pension Fund
Liabilities”, DOCOMO accounted for the entire transfer process as a single
settlement event upon completion of the transfer. The net amount of
actuarial gains and losses proportionate to the substitutional portion immedi-
ately prior to the transfer, which was ¥3,892 million, and the excess of
projected benefit obligation over the accumulated benefit obligation, which
was ¥4,395 million, were netted and recognized as settlement gain of ¥503
million from the transaction. The net of the obligation settled and the assets
transferred to the government was recognized as a gain on subsidy from the
government of ¥24,199 million. As a result of recording the settlement gain
and governmental subsidy as reduction of “Selling, general and administra-
tive”, the aggregate amount of ¥24,702 million was recognized as decrease
in operating expenses in the consolidated statements of income and compre-
hensive income for the year ended March 31, 2008. A “Decrease in liability
for employees’ retirement benefits” of ¥19,002 million recognized in the
consolidated statements of cash flows for the year ended March 31, 2008
was net of a decrease of ¥24,702 million in liability for employees’ retirement
benefits due to gain on transfer of substitutional portion and an increase of
¥5,700 million in liability for employees’ retirement benefits which was
derived from other factors.
101

Thousands of
Millions of yen U.S. dollars
2008 2009 2009
Change in benefit obligations:
Projected benefit obligation, beginning of year ¥131,405 ¥ 78,285 $ 789,561
Service cost 3,244 3,132 31,589
Interest cost 2,872 1,790 18,053
Benefit payments (1,123) (1,130) (11,397)
Internal adjustment due to transfer of employees within the NTT group (413) (715) (7,211)
Actuarial gain (loss) (2,412) 2,111 21,291
Transfer of the substitutional portion to the government (55,288) — —
Projected benefit obligation, end of year ¥ 78,285 ¥ 83,473 $ 841,886
Change in fair value of plan assets:
Fair value of plan assets, beginning of year ¥ 94,136 ¥ 64,309 $ 648,603
Actual return on plan assets (3,122) (7,535) (75,996)
Employer contributions 954 816 8,230
Employee contributions 452 416 4,196
Benefit payments (1,123) (1,130) (11,397)
Internal adjustment due to transfer of employees within the NTT group (294) (574) (5,789)
Transfer of the substitutional portion to the government (26,694) — —
Fair value of plan assets, end of year ¥ 64,309 ¥ 56,302 $ 567,847
At March 31:
Funded status ¥ (13,976) ¥(27,171) $(274,039)
Items recognized in “Accumulated other comprehensive income (loss)”, based on actuarial computations which covered only DOCOMO employees’ partici-
pation in the NTT CDBP, were summarized in the following table:
Thousands of
Millions of yen U.S. dollars
2008 2009 2009
Actuarial gains (losses), net ¥(5,221) ¥(16,383) $(165,234)
Prior service cost 2,140 1,783 17,983
Total ¥(3,081) ¥(14,600) $(147,251)
The accumulated benefit obligation regarding DOCOMO employees for the NTT CDBP based on actuarial computations which covered only DOCOMO
employees’ participation was ¥61,864 million and ¥66,585 million ($671,558 thousand) at March 31, 2008 and 2009, respectively.
The following table presents reconciliations of the changes in the NTT
CDBP’s projected benefit obligation and fair value of plan assets for the years
ended March 31, 2008 and 2009. The amount in the table is based on
actuarial computations which covered only DOCOMO employees’ participa-
tion in the NTT CDBP. The funded status was recognized as “Liability for
employees’ retirement benefits” in the consolidated balance sheets as of
March 31, 2008 and 2009.
102 OPENING DOORS : FINANCIAL SECTION : NOTES TO CONSOLIDATED FINANCIAL STATEMENTS
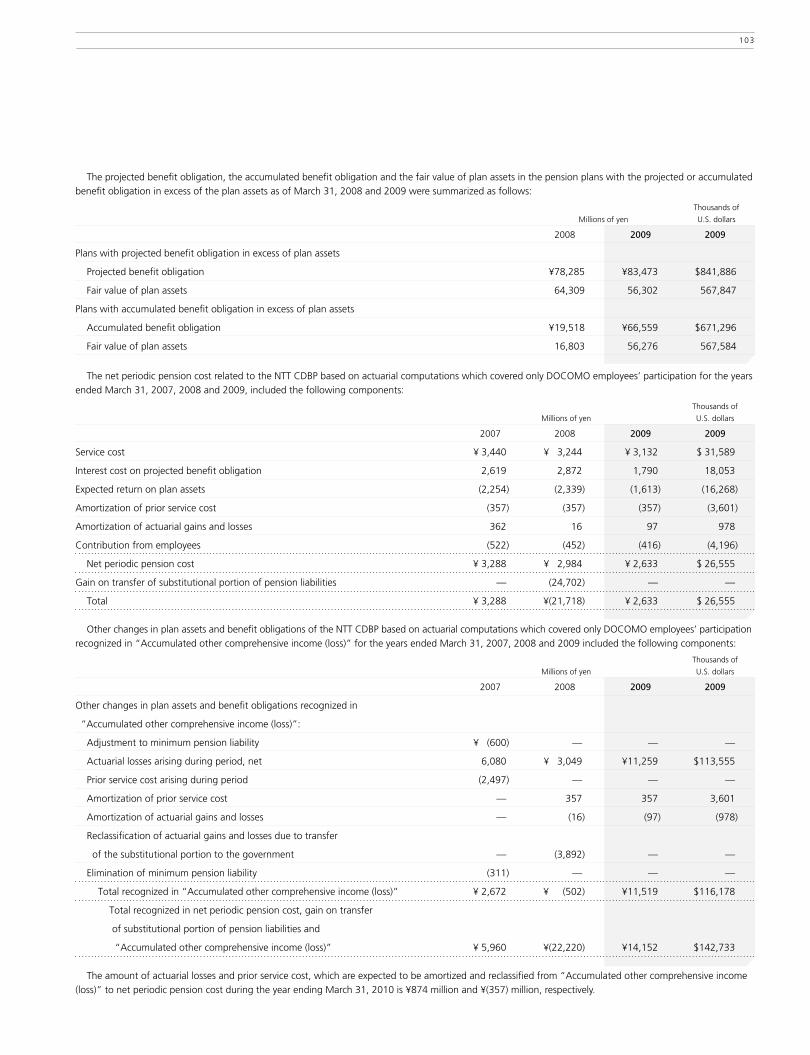
The projected benefit obligation, the accumulated benefit obligation and the fair value of plan assets in the pension plans with the projected or accumulated
benefit obligation in excess of the plan assets as of March 31, 2008 and 2009 were summarized as follows:
Thousands of
Millions of yen U.S. dollars
2008 2009 2009
Plans with projected benefit obligation in excess of plan assets
Projected benefit obligation ¥78,285 ¥83,473 $841,886
Fair value of plan assets 64,309 56,302 567,847
Plans with accumulated benefit obligation in excess of plan assets
Accumulated benefit obligation ¥19,518 ¥66,559 $671,296
Fair value of plan assets 16,803 56,276 567,584
The net periodic pension cost related to the NTT CDBP based on actuarial computations which covered only DOCOMO employees’ participation for the years
ended March 31, 2007, 2008 and 2009, included the following components:
Thousands of
Millions of yen U.S. dollars
2007 2008 2009 2009
Service cost ¥ 3,440 ¥ 3,244 ¥ 3,132 $ 31,589
Interest cost on projected benefit obligation 2,619 2,872 1,790 18,053
Expected return on plan assets (2,254) (2,339) (1,613) (16,268)
Amortization of prior service cost (357) (357) (357) (3,601)
Amortization of actuarial gains and losses 362 16 97 978
Contribution from employees (522) (452) (416) (4,196)
Net periodic pension cost ¥ 3,288 ¥ 2,984 ¥ 2,633 $ 26,555
Gain on transfer of substitutional portion of pension liabilities — (24,702) — —
Total ¥ 3,288 ¥(21,718) ¥ 2,633 $ 26,555
Other changes in plan assets and benefit obligations of the NTT CDBP based on actuarial computations which covered only DOCOMO employees’ participation
recognized in “Accumulated other comprehensive income (loss)” for the years ended March 31, 2007, 2008 and 2009 included the following components:
Thousands of
Millions of yen U.S. dollars
2007 2008 2009 2009
Other changes in plan assets and benefit obligations recognized in
“Accumulated other comprehensive income (loss)”:
Adjustment to minimum pension liability ¥ (600) — — —
Actuarial losses arising during period, net 6,080 ¥ 3,049 ¥11,259 $113,555
Prior service cost arising during period (2,497) — — —
Amortization of prior service cost — 357 357 3,601
Amortization of actuarial gains and losses — (16) (97) (978)
Reclassification of actuarial gains and losses due to transfer
of the substitutional portion to the government — (3,892) — —
Elimination of minimum pension liability (311) — — —
Total recognized in “Accumulated other comprehensive income (loss)” ¥ 2,672 ¥ (502) ¥11,519 $116,178
Total recognized in net periodic pension cost, gain on transfer
of substitutional portion of pension liabilities and
“Accumulated other comprehensive income (loss)” ¥ 5,960 ¥(22,220) ¥14,152 $142,733
The amount of actuarial losses and prior service cost, which are expected to be amortized and reclassified from “Accumulated other comprehensive income
(loss)” to net periodic pension cost during the year ending March 31, 2010 is ¥874 million and ¥(357) million, respectively.
103

The assumptions used in determining the NTT CDBP’s projected benefit obligations, based on actuarial computations which covered only DOCOMO
employees’ participation in the NTT CDBP, as of March 31, 2008 and 2009 were as follows:
2008 2009
Discount rate 2.3% 2.2%
Long-term rate of salary increases 2.6 2.6
The assumptions used in determining the net periodic pension cost, based on actuarial computations which covered only DOCOMO employees’ participation
in the NTT CDBP, for the years ended March 31, 2007, 2008 and 2009 were as follows:
2007 2008 2009
Discount rate 2.0% 2.2% 2.3%
Long-term rate of salary increases 2.6 2.6 2.6
Expected long-term rate of return on plan assets 2.5 2.5 2.5
In determining the expected long-term rate of return on plan assets, the NTT CDBP considers the current and projected asset allocations, as well as expected
long-term investment returns and risks for each category of the plan assets based on analysis of historical results.
The weighted-average asset allocations of the NTT CDBP as of March 31, 2008 and 2009 by asset category were as follows:
2008 2009
Domestic bonds 58.2% 58.3%
Domestic stock 17.4 17.1
Foreign stock 10.4 9.6
Foreign bonds 8.1 8.1
Other 5.9 6.9
Total 100.0% 100.0%
The NTT CDBP’s policy toward plan asset management is formulated with
the ultimate objective of ensuring the steady disbursement of pension
benefits in future periods. The long-term objective of asset management,
therefore, is to secure the total profits deemed necessary to ensure the
financial soundness of the plan assets. To achieve this, the NTT CDBP selects
various investments and takes into consideration their expected returns and
risks and the correlation among the investments. The NTT CDBP then sets a
target allocation ratio for the plan assets and endeavors to maintain that
ratio. The target ratio is formulated from a mid- to long-term perspective
and reviewed annually. In the event that the investment environment
changes dramatically, the NTT CDBP will review the asset allocation as
necessary. The target ratio in March 2009 was: domestic bonds, 61.5%;
domestic stock, 17.9%; foreign stock, 10.3%; foreign bonds, 7.6%; and
other financial instruments 2.7%. As of March 31, 2008 and 2009, domestic
stock owned by the NTT CDBP as its plan asset included common stock of
NTT and the NTT group companies including DOCOMO in the amount of
¥4,744 million (0.5% of total plan assets) and ¥4,739 million ($47,796
thousand, 0.6% of total plan assets), respectively.
DOCOMO expects to contribute ¥795 million to the NTT CDBP in the year
ending March 31, 2010.
The benefit payments, which reflect expected future service under the NTT CDBP, based on actuarial computations which covered only DOCOMO employees
are expected to be as follows: Thousands of
Year ending March 31, Millions of yen U.S. dollars
2010 ¥ 1,158 $ 11,679
2011 1,485 14,977
2012 1,657 16,712
2013 1,835 18,507
2014 2,014 20,313
2015–2019 12,228 123,328
104 OPENING DOORS : FINANCIAL SECTION : NOTES TO CONSOLIDATED FINANCIAL STATEMENTS

17. INCOME TAxES: Total income taxes for the years ended March 31, 2007, 2008 and 2009 were computed as follows:
Thousands of
Millions of yen U.S. dollars
2007 2008 2009 2009
Income from continuing operations before equity in net income (losses)
of affiliates and minority interests ¥313,679 ¥322,955 ¥308,400 $3,110,439
Equity in net income (losses) of affiliates (850) 9,257 (567) (5,719)
Other comprehensive income (loss):
Unrealized holding losses on available-for-sale securities (10,586) (11,668) (20,875) (210,540)
Less: Reclassification of realized gains and losses included in net income (276) 299 19,786 199,556
Change in fair value of derivative instruments 576 (363) (3) (30)
Less: Reclassification of realized gains and losses included in net income (552) 455 (84) (847)
Foreign currency translation adjustment 76 6,634 (20,991) (211,709)
Less: Reclassification of realized gains and losses included in net income — (88) (7) (71)
Adjustment to initially apply SFAS No. 158 (3,395) — — —
Pension liability adjustment:
Actuarial losses arising during period, net — (3,513) (11,229) (113,253)
Less: Amortization of prior service cost — (926) (923) (9,309)
Less: Amortization of actuarial gains and losses — 348 550 5,547
Less: Amortization of transition obligation — 52 56 565
Less: Reclassification of actuarial gains and losses due to transfer
of the substitutional portion to the government — 1,660 — —
Minimum pension liability adjustment 3,849 — — —
Total income taxes ¥302,521 ¥325,102 ¥274,113 $2,764,629
Substantially all income or loss before income taxes and income tax
expenses or benefits are domestic.
For the years ended March 31, 2007, 2008 and 2009, DOCOMO and its
domestic subsidiaries were subject to a National Corporate Tax of 30%, a
Corporate Inhabitant Tax of approximately 6% and a deductible Corporate
Enterprise Tax of approximately 8%. The rate of the Corporate Inhabitant Tax
and Corporate Enterprise Tax differs depending on the municipality.
The aggregate statutory income tax rate for the years ended March 31,
2007, 2008 and 2009 was 40.9%, 40.9% and 40.8%, respectively. The
effective income tax rate for the years ended March 31, 2007, 2008 and
2009 was 40.6%, 40.3% and 39.5%, respectively.
Reconciliation of the difference of the effective income tax rates of DOCOMO and the statutory tax rates are as follows:
2007 2008 2009
Statutory income tax rate 40.9% 40.9% 40.8%
Expenses not deductible for tax purposes 0.2 0.3 0.2
IT infrastructure tax incentive and tax credit for special tax treatment
such as R&D investment tax incentive (0.9) (0.8) (0.8)
Tax refund of interest and penalties previously paid — — (0.8)
Other 0.4 (0.1) 0.1
Effective income tax rate 40.6% 40.3% 39.5%
105

Deferred income taxes result from temporary differences between the financial statement carrying amounts and the tax bases of existing assets and liabili-
ties. Significant components of deferred tax assets and liabilities as of March 31, 2008 and 2009 were as follows:
Thousands of
Millions of yen U.S. dollars
2008 2009 2009
Deferred tax assets:
Property, plant and equipment and intangible assets principally due to differences
in depreciation and amortization ¥ 48,618 ¥ 84,816 $ 855,431
Reserve for point loyalty programs 46,004 72,073 726,909
Liability for employees’ retirement benefits 46,965 59,019 595,250
Deferred revenues regarding “Nikagetsu Kurikoshi” (2 month carry-over) 32,441 35,774 360,807
Marketable securities and other investments 7,873 21,164 213,454
Accrued enterprise tax 16,594 16,796 169,400
Foreign currency translation adjustment — 14,324 144,468
Compensated absences 12,455 12,809 129,188
Accrued bonus 6,897 7,059 71,195
Accrued commissions to agent resellers 9,343 4,502 45,406
Inventories 5,428 4,239 42,753
Investments in affiliates — 3,207 32,345
Unrealized holding losses on available–for-sale securities 1,746 2,835 28,593
Other 12,435 16,886 170,308
Total deferred tax assets ¥246,799 ¥355,503 $3,585,507
Deferred tax liabilities:
Property, plant and equipment due to differences in capitalized interest 2,343 2,818 28,421
Foreign currency translation adjustment 6,674 — —
Investments in affiliates 2,292 — —
Intangible assets (mainly customer related assets) 2,026 — —
Other 3,551 1,419 14,312
Total deferred tax liabilities ¥ 16,886 ¥ 4,237 $ 42,733
Net deferred tax assets ¥229,913 ¥351,266 $3,542,774
The components of net deferred tax assets included in the consolidated balance sheets as of March 31, 2008 and 2009 were as follows:
Thousands of
Millions of yen U.S. dollars
2008 2009 2009
Deferred tax assets (current assets) ¥108,037 ¥102,903 $1,037,852
Deferred tax assets (non-current investments and other assets) 123,403 248,896 2,510,298
Other current liabilities — (92) (928)
Other long-term liabilities (1,527) (441) (4,448)
Total ¥229,913 ¥351,266 $3,542,774
106 OPENING DOORS : FINANCIAL SECTION : NOTES TO CONSOLIDATED FINANCIAL STATEMENTS

18. COMMITMENTS AND CONTINgENCIES: Leases— DOCOMO leases certain facilities and equipment in the normal course of business under capital leases or operating leases.
Assets covered under capital leases at March 31, 2008 and 2009 were as follows:
Thousands of
Class of property Millions of yen U.S. dollars
2008 2009 2009
Tools, furniture and fixtures ¥11,699 ¥11,860 $119,617
Software 409 503 5,073
Sub-total 12,108 12,363 124,690
Less: Accumulated depreciation and amortization (7,833) (8,174) (82,441)
Total ¥ 4,275 ¥ 4,189 $ 42,249
Tools, furniture and fixtures are classified as part of property, plant and equipment, while software is classified as part of intangible assets.
Future minimum lease payments by year under capital leases together with the present value of the net minimum lease payments as of March 31, 2009
were as follows:
Thousands of
Year ending March 31, Millions of yen U.S. dollars
2010 ¥ 3,050 $ 30,761
2011 2,272 22,915
2012 1,404 14,160
2013 815 8,220
2014 335 3,379
Thereafter 49 494
Total minimum lease payments 7,925 79,929
Less: Amount representing interest (231) (2,329)
Present value of net minimum lease payments 7,694 77,600
Less: Amounts representing estimated executory costs (596) (6,011)
Net minimum lease payments 7,098 71,589
Less: Current obligation (2,787) (28,109)
Long-term capital lease obligations ¥ 4,311 $ 43,480
The above obligations are classified as part of other current and long-term liabilities as appropriate.
In assessing the realizability of deferred tax assets, management considers
whether it is more likely than not that some portion or all of the deferred tax
assets will not be realized. The ultimate realization of deferred tax assets is
dependent upon the generation of future taxable income during the periods
in which those temporary differences and tax loss carry-forwards become
deductible. Management considers the scheduled reversal of deferred tax
liabilities, projected future taxable income and tax planning strategies in
making this assessment. Management believes that the amount of the
deferred tax assets is realizable, however, it could be reduced in the near
term if estimates of future taxable income during the carry-forward period
are reduced.
Effective April 1, 2007, DOCOMO applied the provisions of FIN No. 48
“Accounting for Uncertainty in Income Taxes – an interpretation of SFAS
No. 109” (“FIN 48”), which, among other things, requires applying a
“more-likely-than-not” threshold to the recognition and measurement
of tax positions. As of and for the years ended March 31, 2008 and 2009,
DOCOMO had no material unrecognized tax benefits which would favorably
affect the effective income tax rate in future periods and does not believe
that there will be any significant increases or decreases within the next 12
months. DOCOMO has elected to classify interest and penalties related to
unrecognized tax benefits, if and when required, as part of income tax
expense in the consolidated statements of income and comprehensive
income. The total amounts of interest and penalties related to unrecognized
tax benefits for the years ended March 31, 2008 and 2009 are immaterial.
DOCOMO mainly files income tax returns in Japan. DOCOMO is no longer
subject to regular income tax examination by the tax authority before the
year ended March 31, 2008.
Other taxes— The consumption tax rate for all taxable goods and services, with minor
exceptions, is 5%. Consumption tax payable or receivable is determined
based on consumption taxes levied on operating revenues offset by
consumption taxes directly incurred by DOCOMO when purchasing goods
and services.
107

The minimum rental payments required under operating leases that have initial or remaining non-cancellable lease terms in excess of one year as of March
31, 2009 were as follows:
Thousands of
Year ending March 31, Millions of yen U.S. dollars
2010 ¥ 2,184 $ 22,027
2011 1,761 17,761
2012 1,551 15,643
2013 1,424 14,362
2014 1,424 14,362
Thereafter 12,813 129,229
Total minimum future rentals ¥21,157 $213,384
The following schedule shows total rental expense for all operating leases for the years indicated except those with terms of 1 month or less that were not
renewed:
Thousands of
Millions of yen U.S. dollars
2007 2008 2009 2009
Minimum rentals ¥67,897 ¥70,673 ¥67,954 $685,366
Litigation— As of March 31, 2009, DOCOMO had no litigation or claims outstanding,
pending or threatened against which in the opinion of management would
have a materially adverse effect on its results of operations or financial
position.
Purchase commitments— DOCOMO has entered into various contracts for the purchase of property,
plant and equipment, inventories (primarily handsets) and services.
Commitments outstanding as of March 31, 2009 amounted to ¥43,205
million ($435,754 thousand) (of which ¥5,030 million ($50,731 thousand)
are with related parties) for property, plant and equipment, ¥12,150 million
($122,542 thousand) (of which none are with related parties) for inventories
and ¥102,297 million ($1,031,740 thousand) (of which ¥3,372 million
($34,009 thousand) are with related parties) for the other purchase
commitments.
guarantees— DOCOMO applies FIN No. 45 “Guarantor’s Accounting and Disclosure
Requirements for Guarantees, Including Indirect Guarantees of Indebtedness
of Others” (“FIN 45”). FIN 45 requires a company that issues or modifies a
guarantee to recognize an initial liability for the fair value of the obligations
it has undertaken and disclose that information in its financial statements.
DOCOMO enters into agreements in the normal course of business that
provide guarantees for counterparties. These counterparties include
subscribers, related parties, foreign wireless telecommunications service
providers and other business partners.
DOCOMO provides subscribers with guarantees for product defects of
cellular phone handsets sold by DOCOMO, but DOCOMO is provided with
similar guarantees by the handset vendors and no liabilities were recognized
for these guarantees.
Though the guarantees or indemnifications provided in transactions other
than those with the subscribers are different in each contract, the likelihood
of almost all of the performance of these guarantees or indemnifications are
remote and amount of payments DOCOMO could be claimed for is not
specified in almost all of the contracts. Historically, DOCOMO has not made
any significant guarantee or indemnification payments under such agree-
ments. DOCOMO estimates the estimated fair value of the obligations
related to these agreements is not significant. Accordingly, no liabilities were
recognized for these obligations.
19. FAIR VALUE MEASUREMENTS: In September 2006, FASB issued SFAS No. 157. DOCOMO adopted SFAS No.
157 effective April 1, 2008, for fair value measurements of financial assets
and financial liabilities and for fair value measurements of nonfinancial items
that are recognized or disclosed at fair value in the financial statements on a
recurring basis.
SFAS No. 157 defines fair value as “the price that would be received to
sell an asset or paid to transfer a liability in an orderly transaction between
market participants at the measurement date”. SFAS No. 157 establishes a
three-tier fair value hierarchy, which prioritizes the inputs used in measuring
fair value according to observability as follows:
Level 1 – Inputs are quoted prices in active markets for identical assets
or liabilities.
Level 2 – Inputs are quoted prices for similar assets or liabilities in active
markets, quoted prices for identical or similar assets or
liabilities in markets that are not active and inputs that are
derived principally from observable markets data.
Level 3 – Inputs are unobservable inputs for the asset or liability.
SFAS No. 157 also distinguishes assets and liabilities measured at fair value
every period on a recurring basis from those measured on a nonrecurring
basis under specific situation (for example, impaired assets).
108 OPENING DOORS : FINANCIAL SECTION : NOTES TO CONSOLIDATED FINANCIAL STATEMENTS

20. FINANCIAL INSTRUMENTS: (1) Risk management The fair values for DOCOMO’s assets and liabilities and DOCOMO’s cash
flows may be negatively impacted by fluctuations in interest rates and
foreign exchange rates. To manage these risks, DOCOMO uses derivative
instruments such as interest rate swaps, currency swaps, foreign exchange
forward contracts and non-deliverable forward contracts (NDF) as needed.
The financial instruments are executed with creditworthy financial institu-
tions and DOCOMO management believes that there is little risk of default
by these counterparties. DOCOMO sets and follows internal regulations that
establish conditions to enter into derivative contracts and procedures of
approving and monitoring such contracts.
(2) Fair value of financial instrumentsShort-term financial instruments—All “Cash and cash equivalent”, “Accounts receivable”, “Accounts payable,
trade” and certain other short-term financial instruments are short-term in
nature. Therefore their carrying amounts approximate fair values except the
items separately referred below.
Long-term debt including current portion—The fair value of long-term debt including current portion is estimated based
on the discounted amounts of future cash flows using DOCOMO’s current
incremental borrowings rates for similar liabilities.
(1) Assets and liabilities measured at fair value on a recurring basisDOCOMO’s assets measured at fair value on a recurring basis include available-for-sale securities and derivatives.
DOCOMO’s assets that were measured at fair value on a recurring basis at March 31, 2009 were as follows:
Millions of yen
2009
Inputs used for measurement of fair value
Total Level 1 Level 2 Level 3
Assets
Available-for-sale securities ¥112,967 ¥112,967 — —
Derivatives 3,433 — ¥3,433 —
Total assets ¥116,400 ¥112,967 ¥3,433 —
Thousands of U.S. dollars
2009
Inputs used for measurement of fair value
Total Level 1 Level 2 Level 3
Assets
Available-for-sale securities $1,139,354 $1,139,354 — —
Derivatives 34,624 — $34,624 —
Total assets $1,173,978 $1,139,354 $34,624 —
Available-for-sale securities—Available-for-sale securities include marketable equity securities and debt
securities, which are valued using quoted prices in active markets for
identical assets. Therefore, these securities are classified as Level 1.
Derivatives—Derivative instruments are interest rate swap agreements valued by financial
institutions using observable market inputs. Therefore, these derivatives are
classified as Level 2. DOCOMO periodically validates the valuation of such
derivatives using observable market inputs, such as interest rates.
(2) Assets and liabilities measured at fair value on a nonrecurring basisCertain assets and liabilities are measured at fair value on a nonrecurring
basis and are not included in the table above. Such fair value measurements
typically result from impairments. DOCOMO may be required to measure fair
value of long-lived assets, equity securities whose fair values are not readily
determinable, and other assets or liabilities on a nonrecurring basis.
DOCOMO omitted the disclosure about financial assets and financial
liabilities measured on a nonrecurring basis because of its immateriality.
109

The carrying amount and the estimated fair value of long-term debt including current portion as of March 31, 2008 and 2009 were as follows:
Millions of yen Thousands of U.S. dollars
2008 2009 2009
Carrying Carrying Carrying amount Fair value amount Fair value amount Fair value
¥476,752 ¥481,832 ¥639,233 ¥645,504 $6,447,130 $6,510,378
Derivative instruments—(i) Fair value hedgeDOCOMO uses interest rate swap transactions, under which DOCOMO
receives fixed rate interest payments and pays floating rate interest
payments, to hedge the changes in fair value of certain debt as a part of its
asset-liability management (ALM).
DOCOMO designated these derivatives as fair value hedges utilizing the
short-cut method in SFAS No. 133, which permits an assumption of no inef-
fectiveness if the terms of these derivatives and the criteria of SFAS No. 133
are met.
The table below shows the contract amount and fair value of the interest rate swap agreement as of March 31, 2008 and 2009:
Millions of yen
Weighted average rate per annum 2008
Contract Term (in the year ended/ending March 31,) Receive fixed Pay floating Contract Amount Fair value
2004 – 2012 1.5% 1.2% ¥235,800 ¥3,511
Thousands of
Millions of yen U.S. dollars
Weighted average rate per annum 2009 2009
Contract Term (in the year ended/ending March 31,) Receive fixed Pay floating Contract Amount Fair value Contract Amount Fair value
2004 – 2012 1.5% 1.0% ¥235,800 ¥3,433 $2,378,215 $34,624
The interest rate swap agreements have remaining terms to maturity ranging from 2 years to 2 years and 9 months.
(ii) Cash flow hedgeFrom February 2005 to March 2008, DOCOMO entered into a currency swap
contract to hedge currency exchange risk associated with the principal and
interest payments of the $100 million unsecured corporate bonds. As this
currency swap contract qualified as a cash flow hedge instrument for
accounting purposes and all the essential terms of the currency swap and
the hedged item are identical, there was no ineffective portion to the hedge.
The gain or loss from the fluctuation in the fair value of the swap transaction
was recorded as “Accumulated other comprehensive income (loss)”. The
amount recorded as “Accumulated other comprehensive income (loss)” was
reclassified as gain or loss when the offsetting gain or loss derived from the
hedged item was recorded in the accompanying consolidated statements
of income and comprehensive income.
In March 2008, DOCOMO redeemed the $100 million unsecured
corporate bonds hedged by the contract. DOCOMO did not hold any
currency swap contracts as of March 31, 2008 or 2009.
(iii) Derivatives not designated as hedging instruments under SFAS No. 133DOCOMO had foreign exchange forward contracts to hedge currency
exchange risk associated with foreign currency assets and liabilities.
DOCOMO did not designate such derivative instruments as hedging
instruments under SFAS No. 133.
The table below shows the contract amount as of March 31, 2008 and 2009:
Thousands of
Millions of yen U.S. dollars
Class of property 2008 2009 2009
Foreign exchange risk management
Foreign exchange forward contracts ¥4,731 — —
Total ¥4,731 — —
110 OPENING DOORS : FINANCIAL SECTION : NOTES TO CONSOLIDATED FINANCIAL STATEMENTS

(iv) The effect on the consolidated balance sheets The locations and carrying amounts of the derivative instruments as of March 31, 2008 and 2009, recorded in the accompanying consolidated balance sheets,
were as follows:
Thousands of
Assets derivatives Millions of yen U.S. dollars
Instruments Locations 2008 2009 2009
Derivatives designated as hedging instruments under SFAS No. 133
Interest rate swap agreements Other assets ¥3,511 ¥3,433 $34,624
Total ¥3,511 ¥3,433 $34,624
Thousands of
Liability derivatives Millions of yen U.S. dollars
Instruments Locations 2008 2009 2009
Derivatives not designated as hedging instruments under SFAS No. 133
Foreign exchange forward contracts Other current liabilities ¥16 — —
Total ¥16 — —
The fair values of derivative instruments were obtained from counterparty financial institutions and represent the amount that DOCOMO could have settled
with the counterparties to terminate the contracts outstanding as of March 31, 2008 and 2009.
(v) The effect on the consolidated statements of income and comprehensive income The locations and gain (loss) amounts of the derivative instruments for the years ended March 31, 2007, 2008 and 2009, recognized in the accompanying
consolidated statements of income and comprehensive income, were as follows:
Amount of gain or (loss) recognized in income on derivative
Thousands of
Millions of yen U.S. dollars
Instruments Locations 2007 2008 2009 2009
Derivatives in SFAS No. 133 fair value hedging relationships
Interest rate swap agreements Other, net* ¥4,275 ¥2,653 ¥(78) $(787)
Total ¥4,275 ¥2,653 ¥(78) $(787)
Amount of gain or (loss) reclassified in OCI** on derivative
Thousands of
Millions of yen U.S. dollars
Instruments 2007 2008 2009 2009
Derivatives in SFAS No. 133 cash flow hedging relationships
Currency swap contract ¥(58) — — —
Total ¥(58) — — —
Amount of gain or (loss) reclassified from Accumulated OCI** into income
Thousands of
Millions of yen U.S. dollars
Instruments Locations 2007 2008 2009 2009
Derivatives in SFAS No.133 cash flow hedging relationships
Currency swap contract
Interest expenses ¥ 30 ¥ 348 — —
Other, net* 1,320 (1,462) — —
Total ¥1,350 ¥(1,114) — —
* “Other, net” was included in “Other income (expense)”.
** “Other comprehensive income (loss)”
111

Amount of gain or (loss) recognized in income on derivative
Thousands of
Millions of yen U.S. dollars
Instruments Locations 2007 2008 2009 2009
Derivatives not designated as hedging instruments
under SFAS No.133
Foreign exchange forward contracts Other, net* ¥393 ¥ 18 ¥(1,090) $(10,994)
Non-deliverable forward contracts (NDF) Other, net* 13 (13) (4,050) (40,847)
Foreign currency option contracts Other, net* 21 (110) — —
Total ¥427 ¥(105) ¥(5,140) $(51,841)
* “Other, net” was included in “Other income (expense)”.
(vi) Contingent features in derivatives As of March 31, 2009, DOCOMO had no derivative instruments with credit-risk-related contingent features.
Other—Information regarding “Investments in affiliates” and “Marketable securities and other investments” is disclosed in Notes 6 and 7, respectively.
(3) Concentrations of riskAs of March 31, 2009, DOCOMO did not have any significant concentration of business transacted with an individual counterparty or groups of counterparties
that could, if suddenly eliminated, severely impact its results of operations.
21. SUBSEQUENT EVENT: There were no significant subsequent events other than those described in other footnotes to these consolidated financial statements.
112 OPENING DOORS : FINANCIAL SECTION : NOTES TO CONSOLIDATED FINANCIAL STATEMENTS

SCHEDULE—VALUATION AND QUALIFYINg ACCOUNTS
Millions of yen
Balance at beginning of Balance at end year Additions Deductions* of year
2007
Allowance for doubtful accounts ¥14,740 ¥ 8,654 ¥(10,216) ¥13,178
2008
Allowance for doubtful accounts ¥13,178 ¥12,107 ¥ (8,784) ¥16,501
2009
Allowance for doubtful accounts ¥16,501 ¥ 9,898 ¥ (9,977) ¥16,422
Thousands of U.S. dollars
Balance at beginning of Balance at end year Additions Deductions* of year
2009
Allowance for doubtful accounts $166,425 $99,828 $(100,625) $165,628
* Amounts written off.
Financial Statement ScheduleNTT DOCOMO, INC. AND SUBSIDIARIES
Years ended March 31, 2007, 2008 and 2009
FINANCIAL SECTION : FINANCIAL STATEMENT SCHEDULE 113
114 OPENING DOORS : FINANCIAL SECTION : REPORT OF INDEPENDENT REGISTERED PUBLIC ACCOUNTING FIRM RECONCILIATIONS OF THE DISCLOSED NON-GAAP FINANCIAL MEASURES TO THE MOST DIRECTLY COMPARABLE GAAP FINANCIAL MEASURES 115
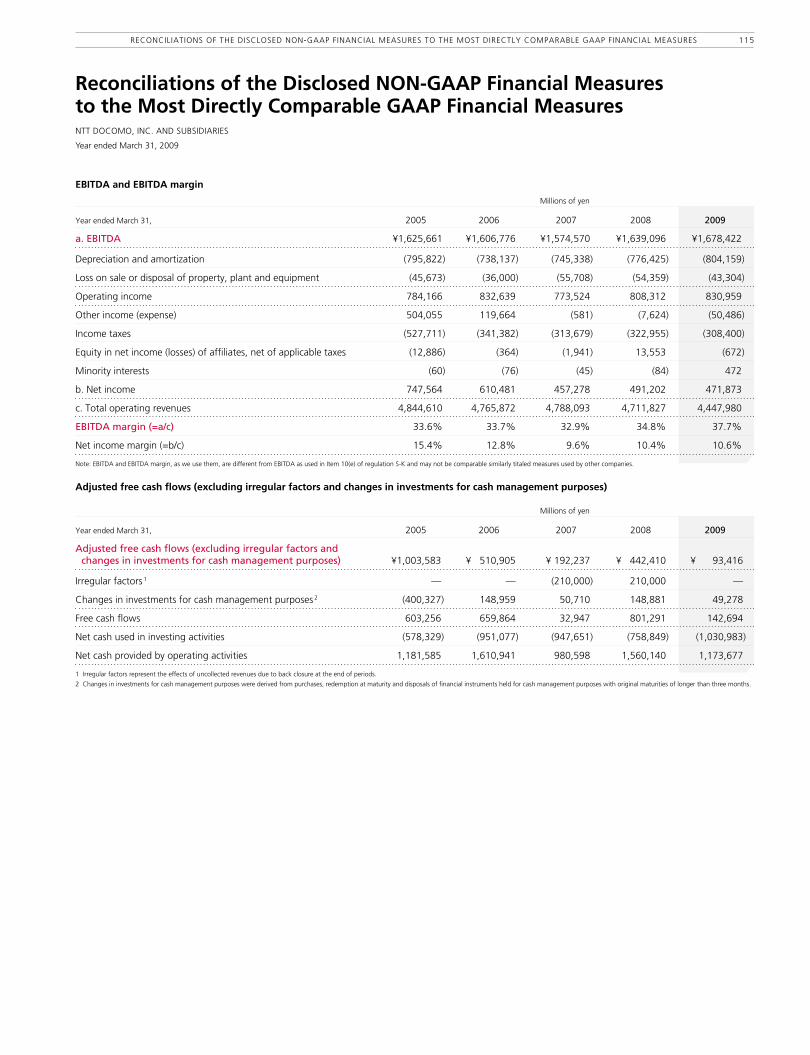
EBITDA and EBITDA margin
Millions of yen
Year ended March 31, 2005 2006 2007 2008 2009
a. EBITDA ¥1,625,661 ¥1,606,776 ¥1,574,570 ¥1,639,096 ¥1,678,422
Depreciation and amortization (795,822) (738,137) (745,338) (776,425) (804,159)
Loss on sale or disposal of property, plant and equipment (45,673) (36,000) (55,708) (54,359) (43,304)
Operating income 784,166 832,639 773,524 808,312 830,959
Other income (expense) 504,055 119,664 (581) (7,624) (50,486)
Income taxes (527,711) (341,382) (313,679) (322,955) (308,400)
Equity in net income (losses) of affiliates, net of applicable taxes (12,886) (364) (1,941) 13,553 (672)
Minority interests (60) (76) (45) (84) 472
b. Net income 747,564 610,481 457,278 491,202 471,873
c. Total operating revenues 4,844,610 4,765,872 4,788,093 4,711,827 4,447,980
EBITDA margin (=a/c) 33.6% 33.7% 32.9% 34.8% 37.7%
Net income margin (=b/c) 15.4% 12.8% 9.6% 10.4% 10.6%
Note: EBITDA and EBITDA margin, as we use them, are different from EBITDA as used in Item 10(e) of regulation S-K and may not be comparable similarly titaled measures used by other companies.
Adjusted free cash flows (excluding irregular factors and changes in investments for cash management purposes)
Millions of yen
Year ended March 31, 2005 2006 2007 2008 2009
Adjusted free cash flows (excluding irregular factors and changes in investments for cash management purposes) ¥1,003,583 ¥ 510,905 ¥ 192,237 ¥ 442,410 ¥ 93,416
Irregular factors 1 — — (210,000) 210,000 —
Changes in investments for cash management purposes 2 (400,327) 148,959 50,710 148,881 49,278
Free cash flows 603,256 659,864 32,947 801,291 142,694
Net cash used in investing activities (578,329) (951,077) (947,651) (758,849) (1,030,983)
Net cash provided by operating activities 1,181,585 1,610,941 980,598 1,560,140 1,173,677
1 Irregular factors represent the effects of uncollected revenues due to back closure at the end of periods.
2 Changes in investments for cash management purposes were derived from purchases, redemption at maturity and disposals of financial instruments held for cash management purposes with original maturities of longer than three months.
Reconciliations of the Disclosed NON-GAAP Financial Measures to the Most Directly Comparable GAAP Financial MeasuresNTT DOCOMO, INC. AND SUBSIDIARIES
Year ended March 31, 2009
RECONCILIATIONS OF THE DISCLOSED NON-GAAP FINANCIAL MEASURES TO THE MOST DIRECTLY COMPARABLE GAAP FINANCIAL MEASURES 115

Research Laboratories
R&D Strategy Department
Communication Device Development Department
Service & Solution Development Department
Core Network Development Department
Radio Access Network Development Department
R&D General Affairs Department
Strategic Marketing Department
Customer Satisfaction Department
Product Department
Consumer Services Department
Frontier Services Department
Ubiquitous Services Department
Network Department
Wireless Technology Standardization Department
Services Platform Department
Radio Access Network Engineering Department
Core Network Engineering Department
Network Service Operation Department
Communication Device Support Department
Advertising & Promotion Department
Sales Promotion Department
Front Support Center
Customer Service Department
Billing Service Department
Corporate Marketing Department I
Corporate Marketing Department II
Solution Business Department
Corporate Marketing Strategy Department
Information Systems Department
Procurement and Supply Department
Corporate Strategy & Planning Department
Business Alliance Department
Human Resources Management Department
General Affairs Department
Accounts and Finance Department
Intellectual Property Department
Legal Department
Internal Audit Department
Information Security Department
Public Relations Department
Corporate Citizenship Department
Investor Relations Department
Mobile Society Research Institute
Branches: Marunouchi, Shinjuku, Shibuya, Tama, Kanagawa, Chiba, Saitama, Ibaraki, Tochigi, Gunma, Yamanashi, Nagano, Niigata
Global Business Division
Credit Card Business Division
R&D Center
Corporate Marketing Division
Regional Offices:Hokkaido, Tohoku, Tokai, Hokuriku, Kansai, Chugoku, Shikoku, Kyushu
President and CEO
Board of Directors
CorporateAuditors’ Office
Corporate Auditors
Board ofCorporate Auditors
OrganizationNTT DOCOMO, INC.
As of July 1, 2009
116 OPENING DOORS : ORGANIzATION

Overseas Bases / Subsidiaries and AffiliatesAs of July 1, 2009
Subsidiaries and Affiliates Name Voting Right Ownership Main Line(s) of Business
Service and Subsidiaries: 26
DOCOMO Service Inc. 100.00% Support for billing services of mobile phones
DOCOMO Engineering Inc. 100.00% Design, construction, and maintenance of telecommunication facilities
DOCOMO Mobile Inc. 100.00% Maintenance and logistics of mobile phones and other terminals
DOCOMO Support Inc. 100.00% Operation of call centers and support for sales agents
DOCOMO Systems, Inc. 100.00% Development and maintenance of internal information systems Sales of hardware relating to information systems
DOCOMO Business Net, inc. 100.00% Sales agent business and sales support business
DOCOMO Technology, Inc. 100.00% Commissioned business from DOCOMO in R&D of mobile communication
and 19 other companies
Other Subsidiaries: 95
e Engineering Inc. 100.00% Support for maintenance of communication facilities of DOCOMO
Business Expert Inc. 100.00% Support for billing services of DOCOMO
D2 Communications Inc. 51.00% Management and posting of advertisements on i-mode website
DOCOMO.com, Inc. 100.00% Consulting for information providers on mobile Internet
NIPPON DATA COM Co., Ltd. 66.24% Information system operations and outsourcing operations
OAK LAWN MARKETING, INC. 51.00% Direct marketing business focused on TV shopping
DOCOMO interTouch Pte. Ltd. 100.00% Holding company for corporate group that provides high-speed Internet connection services and video distribution services for hotels worldwide
DOCOMO PACIFIC, INC. 100.00% Mobile phone business and miscellaneous businesses in Guam and the Commonwealth of Northern
Mariana Islands
Mobile Innovation Co., Ltd. 72.61% Vehicle traffic control business in Thailand
and 86 other companies
Affiliates: 19
Tower Records Japan Inc. 42.10% Sales of music software, movie software, and music-related products, etc.
Avex Broadcasting & Communications Inc. 30.00% Membership mobile video distribution business
FeliCa Networks, Inc. 38.00% Development, production/sales, and licensing of mobile FeliCa IC chip
Operation of mobile FeliCa services platform
Sumitomo Mitsui Card Co., Ltd. 34.00% Credit card business
Rakuten Auction, Inc. 40.00% PC/mobile-based Internet auction business
TATA TELESERVICES LIMITED 26.47% Mobile communications business in India
Philippine Long Distance Telephone Company 14.33% Fixed-line communications business in the Philippines
and 12 other companies
Overseas Bases Name Main Line(s) of Business
DOCOMO Europe Limited London Development of DOCOMO’s integrated overseas strategy in Europe
DOCOMO Netherlands B.V. Amsterdam Support of overseas expansion of i-mode in Europe and development of DOCOMO's integrated overseas strategy
NTT DOCOMO USA, Inc. New York Head Office New York Development of DOCOMO’s integrated overseas strategy in the United States
NTT DOCOMO USA, Inc. Washington D.C. Division Washington, D.C. Surveys on regulations in the United States
NTT DOCOMO USA, Inc. Hawaii Office Hawaii Management of the DOCOMO WORLD Counter Hawaii
NTT DOCOMO, Inc. Paris Representative Office Paris Research into regulations, markets, etc., in Europe
NTT DOCOMO, Inc. Beijing Representative Office Beijing Liaison with the Chinese government and related agencies Collection of data concerning China’s mobile communications
NTT DOCOMO, Inc. Shanghai Representative Office Shanghai Collection of data concerning opportunities for new business in China
NTT DOCOMO, Inc. Singapore Representative Office Singapore Collection of data concerning mobile communications in seven ASEAN countries (Singapore, Indonesia, Thailand, Philippines, Malaysia, Brunei, and Myanmar) and India
NTT DOCOMO, Inc. Hanoi Representative Office Hanoi Collection of data concerning mobile communications in three ASEAN countries (Vietnam, Laos, and Cambodia)
NTT DOCOMO, Inc. Philippine Branch Manila Advisory activities for PLDT and SMART
DOCOMO China Co., Ltd. Shanghai Provision of mobile solutions and other services for companies in China
Research & Development
DOCOMO Communications Laboratories Europe GmbH Munich Research focused on next-generation platform technology and research in Europe
Participation in standardization projects in Europe
DOCOMO Communications Laboratories USA, Inc. California Research focused on next-generation Internet technology Proposals and research concerning international standardization
DOCOMO Capital, Inc. California Search for and investment in venture companies with innovative state-of-the-art technology applicable to mobile communications services
DOCOMO Beijing Communications Laboratories Co., Ltd. Beijing Research focused on next-generation mobile communications technology Participation in standardization activities in China
OVERSEAS BASES / SUBSIDIARIES AND AFFILIATES 117
118 OPENING DOORS : CORPORATE DATA
Corporate DataAs of March 31, 2009
Company Name
NTT DoCoMo, Inc.
The name DoCoMo is derived from the first letters of the phrase:
“DO COmmunications Over The MObile Network”
Address
Head Office:
11-1, Nagata-cho 2-chome, Chiyoda-ku, Tokyo 100-6150, Japan
Tel: (03) 5156-1111
New York Head Office:
NTT DoCoMo USA, Inc.
101 Park Avenue, 41st F1, New York, NY 10178, U.S.A.
Tel: +1 212 994 7222
Common Stock
¥949,679,500,000
Date of Establishment
August 1991
Number of Employees (consolidated)
21,831
Independent Certified Public Accountants
KPMG AZSA & Co., an audit corporation incorporated under the Japanese
Certified Public Accountants Law, and the Japan member firm of KPMG
International, a Swiss Cooperative
IR Contact
IR Department
Tel: +81 3 5156 1111
Fax: +81 3 5156 0271
e-mail: [email protected]
http://www.nttdocomo.co.jp/english/ir/
NTT DOCOMO, INC. provides information on its own website
URL: http://www.nttdocomo.com/
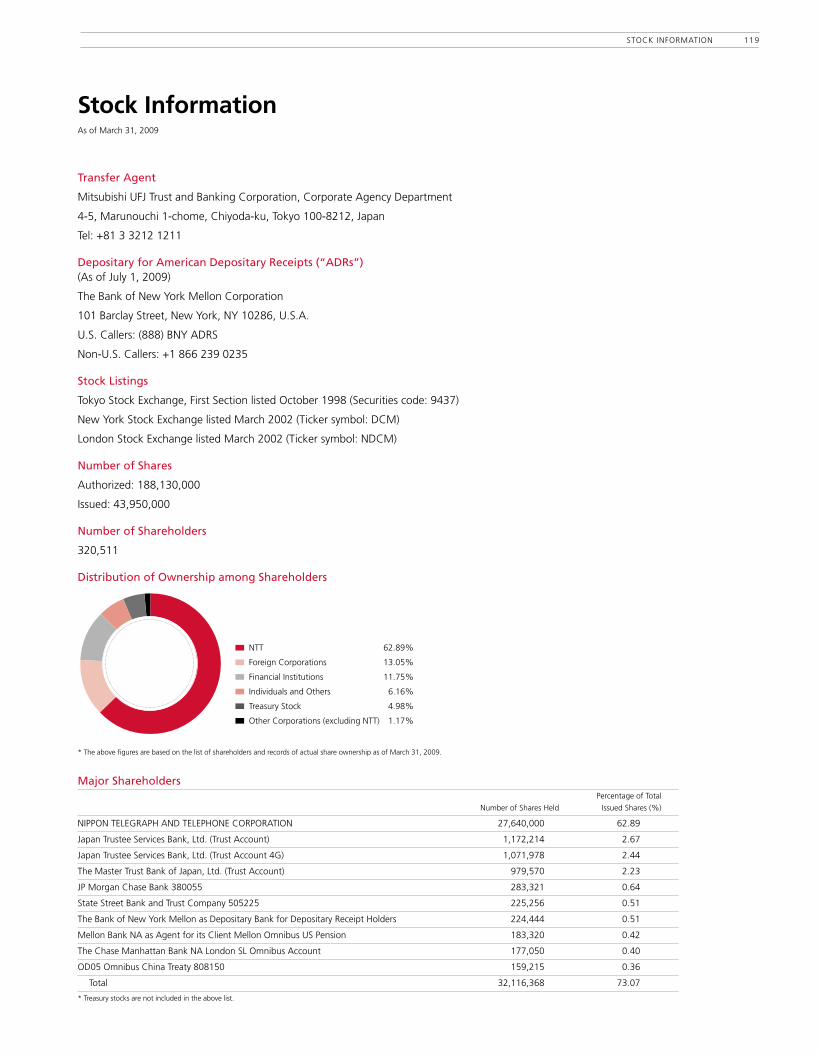
STock InforMaTIon 119
Unless specifically stated otherwise, information in this annual report is as of July 2009.as used in this annual report, references to “DocoMo”, “the company”, “we”, “our” , “our group” and “us” are to nTT DocoMo, Inc. and its consolidated subsidiaries except as the context otherwise requires. name of companies or products presented in this annual report are the trademarks or registered trademarks of their respective organizations.
DEFINITION OF TERMS“fiscal 2008” refers to our fiscal year ended March 31, 2009, and other fiscal years are referred to in a corresponding manner.
SPECIAL NOTE REGARDING FORWARD-LOOKING STATEMENTSThis Earnings release contains forward-looking statements such as forecasts of results of operations, management strategies, objectives and plans, forecasts of operational data such as expected number of subscribers, and expected dividend payments. all forward-looking statements that are not historical facts are based on management’s current plans, expectations, assumptions and estimates based on the information currently available. Some of the projected numbers in this report were derived using certain assumptions that are indispensable for making such projections in addition to historical facts. These forward-looking statements are subject to various known and unknown risks, uncertainties and other factors that could cause our actual results to differ materially from those contained in or suggested by any forward-looking statement. Potential risks and uncertainties include, without limitation, the following:
1. changes in the business environment in the telecommunications industry, such as intensifying competition from other service providers or other technologies caused by Mobile number Portability, new market entrants and other factors, could limit our acquisition of new subscriptions and retention of existing subscriptions, or may lead to diminishing arPU or an increase in our costs and expenses.
2. current and new services, usage patterns, and sales schemes introduced by our corporate group may not develop as planned, which could affect our financial condition and limit our growth.
3. The introduction or change of various laws or regulations or the application of such laws and regulations to our corporate group could restrict our business operations, which may adversely affect our financial condition and results of operations.
4. Limitations in the amount of frequency spectrum or facilities made available to us could negatively affect our ability to maintain and improve our service quality and level of customer satisfaction.
5. The W-cDMa technology that we use for our 3G system and/or mobile multimedia services may not be introduced by other overseas operators, which could limit our ability to offer international services to our subscribers.
6. our domestic and international investments, alliances and collaborations may not produce the returns or provide the opportunities we expect.
7. as electronic payment capability and many other new features are built into our cellular phones, and services of parties other than those belonging to our corporate group are provided through our cellular handsets, potential problems resulting from malfunctions, defects or loss of handsets, or imperfection of services provided by such other parties may arise, which could have an adverse effect on our financial condition and results of operations.
8. Social problems that could be caused by misuse or misunderstanding of our products and services may adversely affect our credibility or corporate image.
9. Inadequate handling of confidential business information including personal information by our corporate group, contractors and other factors, may adversely affect our credibility or corporate image.
10. owners of intellectual property rights that are essential for our business execution may not grant us the right to license or otherwise use such intellectual property rights on acceptable terms or at all, which may limit our ability to offer certain technologies, products and/or services, and we may also be held liable for damage compensation if we infringe the intellectual property rights of others.
11. Earthquakes, power shortages, malfunctioning of equipment, software bugs, computer viruses, cyber attacks, hacking, unauthorized access and other problems could cause systems failures in the networks required for the provision of service, disrupting our ability to offer services to our subscribers and may adversely affect our credibility or corporate image.
12. concerns about wireless telecommunication health risks may adversely affect our financial condition and results of operations.
13. our parent company, nippon Telegraph and Telephone corporation (nTT), could exercise influence that may not be in the interests of our other shareholders.
We want to open the door to the future,
and connect you to people in exciting new ways.
By getting to know you as an individual,
and understanding your aspirations...
Our goal is to deliver personalized services,
designed to meet your communication needs...
And to serve and support you in all that you do,
so you can discover the unlimited potential
that makes your dreams come true.
The key that opens the door to the future is in your hand.
Unlimited potential, in your hand.
Stock Informationas of March 31, 2009
Transfer Agent
Mitsubishi UfJ Trust and Banking corporation, corporate agency Department
4-5, Marunouchi 1-chome, chiyoda-ku, Tokyo 100-8212, Japan
Tel: +81 3 3212 1211
Depositary for American Depositary Receipts (“ADRs”) (as of July 1, 2009)
The Bank of new York Mellon corporation
101 Barclay Street, new York, nY 10286, U.S.a.
U.S. callers: (888) BnY aDrS
non-U.S. callers: +1 866 239 0235
Stock Listings
Tokyo Stock Exchange, first Section listed october 1998 (Securities code: 9437)
new York Stock Exchange listed March 2002 (Ticker symbol: DcM)
London Stock Exchange listed March 2002 (Ticker symbol: nDcM)
Number of Shares
authorized: 188,130,000
Issued: 43,950,000
Number of Shareholders
320,511
Distribution of Ownership among Shareholders
nTT 62.89%
foreign corporations 13.05%
financial Institutions 11.75%
Individuals and others 6.16%
Treasury Stock 4.98%
other corporations (excluding nTT) 1.17%
* The above figures are based on the list of shareholders and records of actual share ownership as of March 31, 2009.
Major Shareholders Percentage of Total
number of Shares Held Issued Shares (%)
nIPPon TELEGraPH anD TELEPHonE corPoraTIon 27,640,000 62.89
Japan Trustee Services Bank, Ltd. (Trust account) 1,172,214 2.67
Japan Trustee Services Bank, Ltd. (Trust account 4G) 1,071,978 2.44
The Master Trust Bank of Japan, Ltd. (Trust account) 979,570 2.23
JP Morgan chase Bank 380055 283,321 0.64
State Street Bank and Trust company 505225 225,256 0.51
The Bank of new York Mellon as Depositary Bank for Depositary receipt Holders 224,444 0.51
Mellon Bank na as agent for its client Mellon omnibus US Pension 183,320 0.42
The chase Manhattan Bank na London SL omnibus account 177,050 0.40
oD05 omnibus china Treaty 808150 159,215 0.36
Total 32,116,368 73.07
* Treasury stocks are not included in the above list.
Financial Structure at a Glance 3
Financial Highlights (U.S. GAAP) 4
DOCOMO in the Mobile
Communications Industry 6
a Major change in Strategy 6
In figures 8
To Our Shareholders 10
Financial and Capital Strategy 16
Increasing Customer Satisfaction and
Realizing Our Medium-Term Vision 17
Review of Operations 27
overview 28
Services / content 30
rate Structure 31
Handsets 32
network 34
customer relations 35
International 36
new Business 37
research & Development 38
Management System and CSR 39
corporate Governance 40
Internal control 42
Information Management 43
corporate Social responsibility (cSr) 44
Board of Directors and corporate auditors 46
Financial Section 47
Organization 116
Overseas Bases / Subsidiaries
and Affiliates 117
Corporate Data 118
Stock Information 119
contents

opening doors
Printed in Japan
op
en
ing
do
ors
contents Annual Report 2009
Year ended March 31, 2009
This annual report is printed with soy ink on recycled paper.
An
nu
al Rep
ort 2009
Year ended March 31, 2009

Financial Structure at a Glance 3
Financial Highlights (U.S. GAAP) 4
DOCOMO in the Mobile
Communications Industry 6
AMajorChangeinStrategy 6
InFigures 8
To Our Shareholders 10
Financial and Capital Strategy 16
Increasing Customer Satisfaction and
Realizing Our Medium-Term Vision 17
Review of Operations 27
Overview 28
Services/Content 30
RateStructure 31
Handsets 32
Network 34
CustomerRelations 35
International 36
NewBusiness 37
Research&Development 38
Management System and CSR 39
CorporateGovernance 40
InternalControl 42
InformationManagement 43
CorporateSocialResponsibility(CSR) 44
BoardofDirectorsandCorporateAuditors 46
Financial Section 47
Organization 116
Overseas Bases / Subsidiaries
and Affiliates 117
Corporate Data 118
Stock Information 119
contents