Open-system kinetics of myocardial phosphoenergetics ... · precise balance of ATP rates, there is...
14
Open-system kinetics of myocardial phosphoenergetics during coronary underperfusion KEITH KROLL, DANIEL J. KINZIE, AND LORI A. GUSTAF’SON Center for Bioengineering, University of Washington, Seattle, Washington 98195 Kroll, Keith, Daniel J. Kinzie, and Lori A. Gustafson. Open-system kinetics of myocardial phosphoenergetics dur- ing coronary underperfusion. Am. J. Physiol. 272 (Heart Circ. physiol. 41): H2563-H2576, 1997.-A novel hypothesis is proposed and tested describing open-system kinetics for myocardial phosphoenergetics. The hypothesis is that during severe coronary underperfusion there is precise matching of the rates of ATP synthesis and hydrolysis, but despite the precise balance of ATP rates, there is a decrease in the concentration of ATP and an increase in the concentration of phosphocreatine (PCr) caused by the hydrolysis of AMP to adenosine. Isolated rabbit hearts were perfused using a crystalloid medium, and coronary flow was reduced by 95% from baseline for 45 min followed by reperfusion. Phosphorus nuclear magnetic resonance spectroscopy showed a rapid decrease in PCr concentration to 25% of baseline at the onset of underperfusion followed by a gradual increase in PCr to 42% of baseline, while ATP decreased continuously to 65% of baseline. The kinetics of PCr and ATP could only be described by the precise matching of the rates of ATP synthesis and ATP hydrolysis and an open adenylate system that included the decrease in cytosolic AMP concentration via the production and efflux of adenosine. To confirm the hypothesis of open- system kinetics, two independent predictions were tested in separate experiments: 1) total coronary venous purine efflux (adenosine + inosine + hypoxanthine) during underperfu- sion was equal to the decrease in ATP concentration, and 2) there was no increase in PCr during moderate coronary underperfusion (80% flow reduction). In conclusion, the open nature of the myocardial adenylate system causes mass action effects that exert novel control over PCr and ATP concentrations during coronary underperfusion. The open- system kinetics cause ATP to decrease and PCr to increase, even though there is precise matching of the rates of ATP synthesis and hydrolysis. Finally, the hydrolysis of AMP to adenosine may benefit tissue survival during ischemia by improving the free energy ofATP hydrolysis, thereby delaying or preventing calcium overload. heart; rabbit; ischemia; nuclear magnetic resonance; myocar- dial hibernation; adenosine THE RATES OF MYOCARDIAL ATP synthesis and ATP hydrolysis are normally precisely matched. However, coronary underperfusion causes an abrupt mismatch in the rates ofATP synthesis and hydrolysis, leading to a rapid decrease in myocardial phosphocreatine (PC,) concentration and a more gradual decrease in ATP. The finding that PCr decreases within seconds while the decrease in ATP requires minutes indicates that the initial mismatch in the ATP rates is quickly improved, mainly due to decreased cardiac contraction. An unre- solved question is whether the rates of ATP synthesis and hydrolysis are precisely matched during coronary underperfusion (34) or whether ATP synthesis may even exceed ATP hydrolysis (3). Because it is not feasible to directly measure the individual rates of ATP synthesis and hydrolysis, inves- tigation of the regulation of myocardial energy balance during coronary underperfusion makes use of the con- servation of mass concept that the ATP concentration at any point in time is the integral of the difference in the rates ofATP production and removal [ ATQell (1) = Vcells,’ (ATP production - ATP removal) dt where Vcellis the cellular volume of distribution ofATP. The processes of ATP production comprise ATP synthe- sis (oxidative + glycolytic) and the unidirectional for- ward fluxes of the creatine kinase (PCr + ADP + H+ u Cr + ATP) and myokinase (2 ADP R ATP + AMP) reactions. The processes of ATP removal comprise ATP hydrolysis (for contraction, ion transport, glucose phos- phorylation) and the reverse fluxes of the creatine kinase and myokinase reaction. Although the above processes are important, the postulate of the present study is that they are not sufficient to permit an accurate analysis of myocardial energetics during underperfu- sion and that another factor must be considered. The 5’-nucleotidase reaction hydrolyzing AMP to adenosine (Fig. 1) makes the myocardial adenylate pool an open system, because although the membrane per- meability for adenine nucleotides is very low, adenosine has a high membrane permeability and is actively degraded metabolically. A well-recognized consequence of an open adenylate system is that the depletion of ATP during ischemia is mediated by the membrane efflux of purines (22). A novel consequence of an open adenylate system is that AMP hydrolysis to adenosine and membrane adenosine efflux may cause a decrease in the cytosolic concentration of ADP mediated by the myokinase reaction. If AMP hydrolysis to adenosine functions as a sink for cytosolic ADP during ischemia, then it could improve tissue survival by preventing calcium overload, since decreases in the ATP phosphor- ylation potential ([ATPl/[ADP][Pi]), where [ATP], [ADP], and [Pi] represent ATP, ADP, and Pi concentrations, respectively, due to increased ADP and Pi cause im- paired uptake of cytosolic calcium by the sarcoplasmic reticulum (1,8,23,47). Another unexpected consequence of an open adenyl- ate system can be predicted from the combined equilib- rium expression of the creatine kinase and myokinase reactions (2) H2563 0363-6135/97 $5.00 Copyright o 1997 the American Physiological Society
Transcript of Open-system kinetics of myocardial phosphoenergetics ... · precise balance of ATP rates, there is...

Open-system kinetics of myocardial phosphoenergetics during coronary underperfusion
KEITH KROLL, DANIEL J. KINZIE, AND LORI A. GUSTAF’SON Center for Bioengineering, University of Washington, Seattle, Washington 98195
Kroll, Keith, Daniel J. Kinzie, and Lori A. Gustafson. Open-system kinetics of myocardial phosphoenergetics dur- ing coronary underperfusion. Am. J. Physiol. 272 (Heart Circ. physiol. 41): H2563-H2576, 1997.-A novel hypothesis is proposed and tested describing open-system kinetics for myocardial phosphoenergetics. The hypothesis is that during severe coronary underperfusion there is precise matching of the rates of ATP synthesis and hydrolysis, but despite the precise balance of ATP rates, there is a decrease in the concentration of ATP and an increase in the concentration of phosphocreatine (PCr) caused by the hydrolysis of AMP to adenosine. Isolated rabbit hearts were perfused using a crystalloid medium, and coronary flow was reduced by 95% from baseline for 45 min followed by reperfusion. Phosphorus nuclear magnetic resonance spectroscopy showed a rapid decrease in PCr concentration to 25% of baseline at the onset of underperfusion followed by a gradual increase in PCr to 42% of baseline, while ATP decreased continuously to 65% of baseline. The kinetics of PCr and ATP could only be described by the precise matching of the rates of ATP synthesis and ATP hydrolysis and an open adenylate system that included the decrease in cytosolic AMP concentration via the production and efflux of adenosine. To confirm the hypothesis of open- system kinetics, two independent predictions were tested in separate experiments: 1) total coronary venous purine efflux (adenosine + inosine + hypoxanthine) during underperfu- sion was equal to the decrease in ATP concentration, and 2) there was no increase in PCr during moderate coronary underperfusion (80% flow reduction). In conclusion, the open nature of the myocardial adenylate system causes mass action effects that exert novel control over PCr and ATP concentrations during coronary underperfusion. The open- system kinetics cause ATP to decrease and PCr to increase, even though there is precise matching of the rates of ATP synthesis and hydrolysis. Finally, the hydrolysis of AMP to adenosine may benefit tissue survival during ischemia by improving the free energy ofATP hydrolysis, thereby delaying or preventing calcium overload.
heart; rabbit; ischemia; nuclear magnetic resonance; myocar- dial hibernation; adenosine
THE RATES OF MYOCARDIAL ATP synthesis and ATP hydrolysis are normally precisely matched. However, coronary underperfusion causes an abrupt mismatch in the rates ofATP synthesis and hydrolysis, leading to a rapid decrease in myocardial phosphocreatine (PC,) concentration and a more gradual decrease in ATP. The finding that PCr decreases within seconds while the decrease in ATP requires minutes indicates that the initial mismatch in the ATP rates is quickly improved, mainly due to decreased cardiac contraction. An unre- solved question is whether the rates of ATP synthesis and hydrolysis are precisely matched during coronary underperfusion (34) or whether ATP synthesis may even exceed ATP hydrolysis (3).
Because it is not feasible to directly measure the individual rates of ATP synthesis and hydrolysis, inves- tigation of the regulation of myocardial energy balance during coronary underperfusion makes use of the con- servation of mass concept that the ATP concentration at any point in time is the integral of the difference in the rates ofATP production and removal
[ ATQell
(1) = Vcell s,’ (ATP production - ATP removal) dt
where Vcell is the cellular volume of distribution ofATP. The processes of ATP production comprise ATP synthe- sis (oxidative + glycolytic) and the unidirectional for- ward fluxes of the creatine kinase (PCr + ADP + H+ u Cr + ATP) and myokinase (2 ADP R ATP + AMP) reactions. The processes of ATP removal comprise ATP hydrolysis (for contraction, ion transport, glucose phos- phorylation) and the reverse fluxes of the creatine kinase and myokinase reaction. Although the above processes are important, the postulate of the present study is that they are not sufficient to permit an accurate analysis of myocardial energetics during underperfu- sion and that another factor must be considered.
The 5’-nucleotidase reaction hydrolyzing AMP to adenosine (Fig. 1) makes the myocardial adenylate pool an open system, because although the membrane per- meability for adenine nucleotides is very low, adenosine has a high membrane permeability and is actively degraded metabolically. A well-recognized consequence of an open adenylate system is that the depletion of ATP during ischemia is mediated by the membrane efflux of purines (22). A novel consequence of an open adenylate system is that AMP hydrolysis to adenosine and membrane adenosine efflux may cause a decrease in the cytosolic concentration of ADP mediated by the myokinase reaction. If AMP hydrolysis to adenosine functions as a sink for cytosolic ADP during ischemia, then it could improve tissue survival by preventing calcium overload, since decreases in the ATP phosphor- ylation potential ([ATPl/[ADP][Pi]), where [ATP], [ADP], and [Pi] represent ATP, ADP, and Pi concentrations, respectively, due to increased ADP and Pi cause im- paired uptake of cytosolic calcium by the sarcoplasmic reticulum (1,8,23,47).
Another unexpected consequence of an open adenyl- ate system can be predicted from the combined equilib- rium expression of the creatine kinase and myokinase reactions
(2)
H2563 0363-6135/97 $5.00 Copyright o 1997 the American Physiological Society

HZ564 OPEN-SYSTEM MYOCARDIAL PHOSPHOENERGETICS
Cellular region
Cr
/, PS in PS ‘- PS ” Y u
/ / P pi Adenosine Inosine
\ v cvtraccll Extracellular region Flow
/
Fig. 1. Open-system description of important processes governing myocardial phosphoenergetics. A mathematical model of open system (see APPENDIX) was used for analyzing nuclear magnetic resonance kinetic data. PCr, phosphocreatine; Cr, creatine; ArATP, rate of ATP synthesis minus rate of ATP hydrolysis; Cr k’ase, creatine kinase; M k’ase, myokinase; 5 Nt, 5’-nucleotidase; A k’ase, adenosine kinase; A d’ase, adenosine deaminase; PS, permeability-surface area prod- uct; Vcell and V extracell, volumes of cellular and extracellular regions, respectively.
(44), where Cr is creatine and e: and cqK are the equilibrium constants for the creatine kinase and myo- kinase reactions, respectively. Equation 2 shows that if the cytosolic concentration ofAMP is decreased because of the production of adenosine during coronary under- perfusion, then the concentration of PCr will tend to increase. At the same time, the concentration of ATP would be decreased, since AMP hydrolysis and adeno- sine efflux would decrease the total adenine nucleotide pool. Thus mass action effects of an open adenylate system might cause a simultaneous increase in PCr and a decrease in ATP during underperfusion, even if the rates of ATP synthesis and hydrolysis were pre- cisely matched. Theoretical analyses of the kinetics of myocardial phosphoenergetics during ATP depletion did not investigate the effects of AMP hydrolysis to adenosine but, instead, were based on the concept of a thermodynamic closed system in which the total adenyl- ate pool was conserved (1,9).
The purpose of the present study was to investigate whether the postulated mass action effects of AMP hydrolysis to adenosine take place during coronary underperfusion in the intact heart. By accounting for possible mass action effects, it should be feasible to determine whether there is precise matching of the rates of ATP synthesis and hydrolysis. The strategy was to use a mechanistically realistic mathematical model (Fig. 1) to analyze data on PCr and ATP kinetics obtained by phosphorus nuclear magnetic resonance (NMR) spectroscopy in the underperfused rabbit heart. In addition, experimental tests were performed to confirm two independent predictions of the new hypoth- esis on open-system kinetics. The first prediction was that the total decrease in ATP during severe underper- fusion should be equal to the total coronary venous purine efflux from the heart (adenosine + in .osine + hypoxanthine). The second prediction was that there should be no recovery of PCr during a more moderate degree of coronary underperfusion. The rationale for
the second prediction was that the initial increase in cytosolic AMP should be less during more moderate underperfusion than during severe underperfusion, and therefore AMP hydrolysis to adenosine should cause little increase in PCr.
It was observed that AMP hydrolysis to adenosine during severe coronary underperfusion (95% flow reduc- tion) caused the predicted increase in PCr and simulta- neous decrease in ATP concentrations, despite rapid reestablishment of precise matching of the rates ofATP synthesis and hydrolysis. A previously unrecognized effect of AMP hydrolysis to adenosine is improvement in the ATP phosphorylation potential during ischemia, which may benefit tissue survival by preventing or delaying calcium overload.
METHODS
Animal Preparation
A total of 68 juvenile 2- to 3-kg New Zealand White rabbits of either sex were anesthetized [sedation: acetylpromazine (0.8 mg/kg SC); anesthesia: ketamine (40 mg/kg iv) + xylazine (5 mg/kg iv)] and were treated with heparin (200 U iv) for anticoagulation and &sulfophenyltheophylline (8-SPT, 10 mg/kg iv) to minimize possible cardiac adenosine receptor activation during the subsequent surgery to remove the heart. After 5 min, the heart was rapidly excised and perfused via the aorta according to the Langendorff technique with filtered (1.2 pm) modified Krebs-Ringer bicarbonate solution composed of (in mM) 148 Na, 5.0 K, 2.1 Ca, 0.7 Mg, 126 Cl, 25 HC03, 1.2 HzP04, 0.7 S04, 0.1 EDTA, 11 glucose, and 5 pyruvate and 0.1% bovine serum albumin and equilibrated with 95% Oz-5% CO2 at 37°C using a membrane oxygenator. A constant-flow peristaltic pump was adjusted to provide a coronary perfusion pressure between 80 and 100 mmHg. The mitral valve was cut, and a latex rubber balloon was installed in the left ventricle for measuring ventricular pressure. The balloon volume was adjusted to obtain left ventricular peak systolic pressure of 80-100 mmHg and end-diastolic pressure of ~10 mmHg. Leads were secured to the epicardial surface for electrical pacing at a rate of 200 beats/min.
Hearts studied in the NMR magnet were submerged in perfusate in a 3-cm-diameter plastic watertight cylinder, which was temperature controlled at 37°C. The plastic cradle holding the heart preparation and connected to the perfusion system via plastic tubing was inserted into the horizontal bore of the magnet. Hearts studied in non-NMR experiments were also submerged in 37°C perfusate after ligation of the azygous vein and superior vena cava and cannulation of the pulmonary artery and inferior vena cava for sampling of coronary effluent perfusate. At the end of each experiment the heart was removed from the perfusion cannula, dissected free of atria1 and connective tissue, and weighed. Ten hearts were dried in an oven to determine the wet-to-dry weight ratio of 7.5, a value indicative of edema.
Experimental Protocols
Severe underperfusion. NMR EXPERIMENTS. In 10 experi- ments the NMR gradient coils were shimmed (15 min), and a fully relaxed phosphorus spectrum was obtained (15 min). Coronary perfusion pressure was maintained between 80 and 100 mmHg for 10 min while baseline measurements were obtained. Coronary perfusion (pump flow) was then decreased to -0.26 mlmin-l *g-l and held constant for 45 min, then flow was restored to its baseline value for 15 min. Partially
OPEN-SYSTEM MYOCARDIAL PHOSPHOENERGETICS HZ565
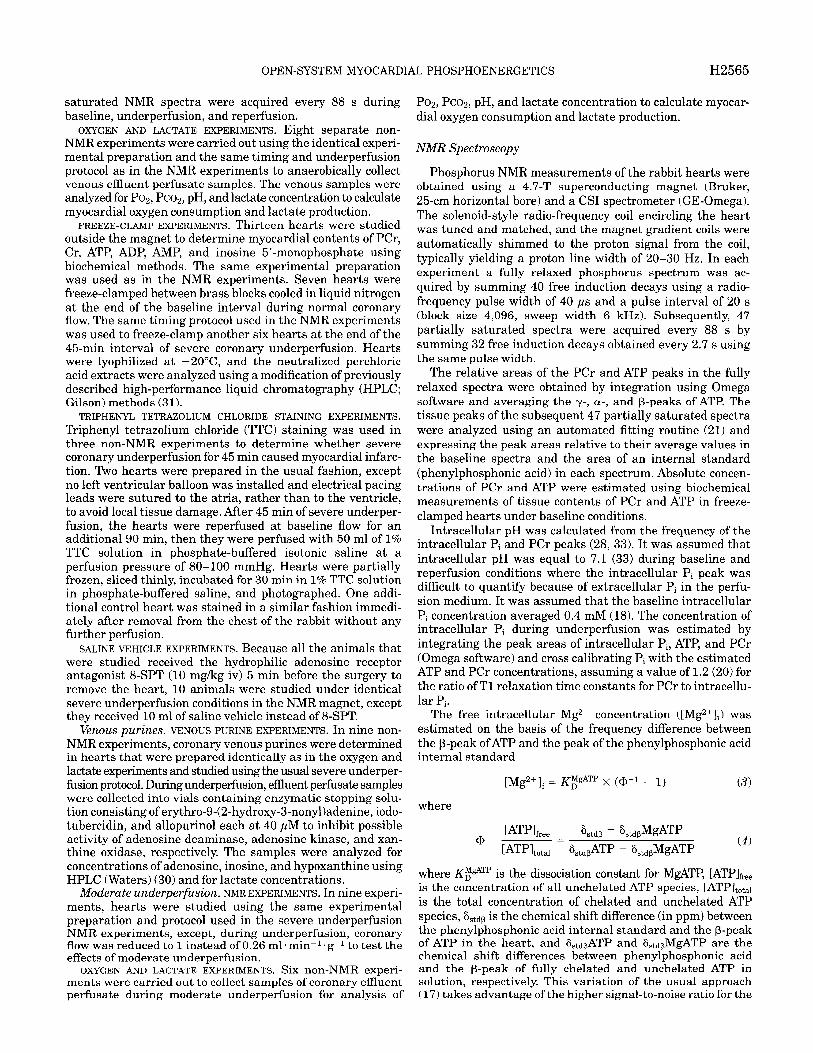
saturated NMR spectra were acquired every 88 s during POT, Pco~, pH, and lactate concentration to calculate myocar- baseline, underperfusion, and reperfusion. dial oxygen consumption and lactate production.
OXYGEN AND LACTATE EXPERIMENTS. Eight separate non- NMR experiments were carried out using the identical experi- mental preparation and the same timing and underperfusion protocol as in the NMR experiments to anaerobically collect venous effluent perfusate samples. The venous samples were analyzed for POT, Pco~, pH, and lactate concentration to calculate myocardial oxygen consumption and lactate production.
NMR Spectroscopy
FREEZE-CLAMP EXPERIMENTS. Thirteen hearts were studied outside the magnet to determine myocardial contents of PCr, Cr, ATP, ADP, AMP, and inosine 5’-monophosphate using biochemical methods, The same experimental preparation was used as in the NMR experiments. Seven hearts were freeze-clamped between brass blocks cooled in liquid nitrogen at the end of the baseline interval during normal coronary flow. The same timing protocol used in the NMR experiments was used to freeze-clamp another six hearts at the end of the 45min interval of severe coronary underperfusion. Hearts were lyophilized at -2O”C, and the neutralized perchloric acid extracts were analyzed using a modification of previously described high-performance liquid chromatography (HPLC; Gilson) methods (31).
Phosphorus NMR measurements of the rabbit hearts were obtained using a 4.7-T superconducting magnet (Bruker, 25-cm horizontal bore) and a CSI spectrometer (GE-Omega). The solenoid-style radio-frequency coil encircling the heart was tuned and matched, and the magnet gradient coils were automatically shimmed to the proton signal from the coil, typically yielding a proton line width of 20-30 Hz. In each experiment a fully relaxed phosphorus spectrum was ac- quired by summing 40 free induction decays using a radio- frequency pulse width of 40 ps and a pulse interval of 20 s (block size 4,096, sweep width 6 kHz). Subsequently, 47 partially saturated spectra were acquired every 88 s by summing 32 free induction decays obtained every 2.7 s using the same pulse width.
TRIPHENYL TETRAZOLIUM CHLORIDE STAINING EXPERIMENTS. Triphenyl tetrazolium chloride (TTC) staining was used in three non-NMR experiments to determine whether severe coronary underperfusion for 45 min caused myocardial infarc- tion. Two hearts were prepared in the usual fashion, except no left ventricular balloon was installed and electrical pacing leads were sutured to the atria, rather than to the ventricle, to avoid local tissue damage. After 45 min of severe underper- fusion, the hearts were reperfused at baseline flow for an additional 90 min, then they were perfused with 50 ml of 1% TTC solution in phosphate-buffered isotonic saline at a perfusion pressure of 80-100 mmHg. Hearts were partially frozen, sliced thinly, incubated for 30 min in 1% TTC solution in phosphate-buffered saline, and photographed. One addi- tional control heart was stained in a similar fashion immedi- ately after removal from the chest of the rabbit without any further perfusion.
The relative areas of the PCr and ATP peaks in the fully relaxed spectra were obtained by integration using Omega software and averaging the y-, CX-, and P-peaks of ATP. The tissue peaks of the subsequent 47 partially saturated spectra were analyzed using an automated fitting routine (21) and expressing the peak areas relative to their average values in the baseline spectra and the area of an internal standard (phenylphosphonic acid) in each spectrum. Absolute concen- trations of PCr and ATP were estimated using biochemical measurements of tissue contents of PCr and ATP in freeze- clamped hearts under baseline conditions.
Intracellular pH was calculated from the frequency of the intracellular Pi and PCr peaks (28, 33). It was assumed that intracellular pH was equal to 7.1 (33) during baseline and reperfusion conditions where the intracellular Pi peak was difficult to quantify because of extracellular Pi in the perfu- sion medium. It was assumed that the baseline intracellular Pi concentration averaged 0.4 mM (18). The concentration of intracellular Pi during underperfusion was estimated by integrating the peak areas of intracellular Pi, ATP, and PCr (Omega software) and cross calibrating Pi with the estimated ATP and PCr concentrations, assuming a value of 1.2 (20) for the ratio of Tl relaxation time constants for PCr to intracellu- lar Pi.
SALINE VEHICLE EXPERIMENTS. Because all the animals that were studied received the hydrophilic adenosine receptor antagonist 8SPT (10 mg/kg iv) 5 min before the surgery to remove the heart, 10 animals were studied under identical severe underperfusion conditions in the NMR magnet, except they received 10 ml of saline vehicle instead of 8-SPT.
knouspurines. VENOUS PURINE EXPERIMENTS. In nine non- NMR experiments, coronary venous purines were determined in hearts that were prepared identically as in the oxygen and lactate experiments and studied using the usual severe underper- fusion protocol. During underperfusion, effluent perfusate samples were collected into vials containing enzymatic stopping solu- tion consisting of erythro-9-( 2-hydroxy-3-nonyl)adenine, iodo- tubercidin, and allopurinol each at 40 PM to inhibit possible activity of adenosine deaminase, adenosine kinase, and xan- thine oxidase, respectively. The samples were analyzed for concentrations of adenosine, inosine, and hypoxanthine using HPLC (Waters) (30) and for lactate concentrations.
Moderate underperfusion. NMR EXPERIMENTS. In nine experi- ments, hearts were studied using the same experimental preparation and protocol used in the severe underperfusion NMR experiments, except, during underperfusion, coronary flow was reduced to 1 instead of 0.26 ml l min-l l g-l to test the effects of moderate underperfusion.
OXYGEN AND LACTATE EXPERIMENTS. Six non-NMR experi- ments were carried out to collect samples of coronary effluent nerfusate during moderate underperfusion for analysis of
The free intracellular Mg2+ concentration ( [Mg2+]i) was estimated on the basis of the frequency difference between the P-peak ofATP and the peak of the phenylphosphonic acid internal standard
where
[Mg2+ Ii = J-qgATp x (@-I - 1) (3)
[ATp]fr,,
’ = [A’Wtotal = %tdp - hdp”gATP
G,,d,ATp - G,,,p”gATP (4)
where KEdm is the dissociation constant for MgATP, [ATP]ce, is the concentration of all unchelated ATP species, [ATPltot,l is the total concentration of chelated and unchelated ATP species, &-@ is the chemical shift difference (in ppm) between the phenylphosphonic acid internal standard and the P-peak of ATP in the heart, and S stdpATP and G,tdpMgATP are the chemical shift differences between phenylphosphonic acid and the P-peak of fully chelated and unchelated ATP in solution, respectively. This variation of the usual approach (17) takes advantage of the higher signal-to-noise ratio for the
HZ566 OPEN-SYSTEM MYOCARDIAL PHOSPHOENERGETICS
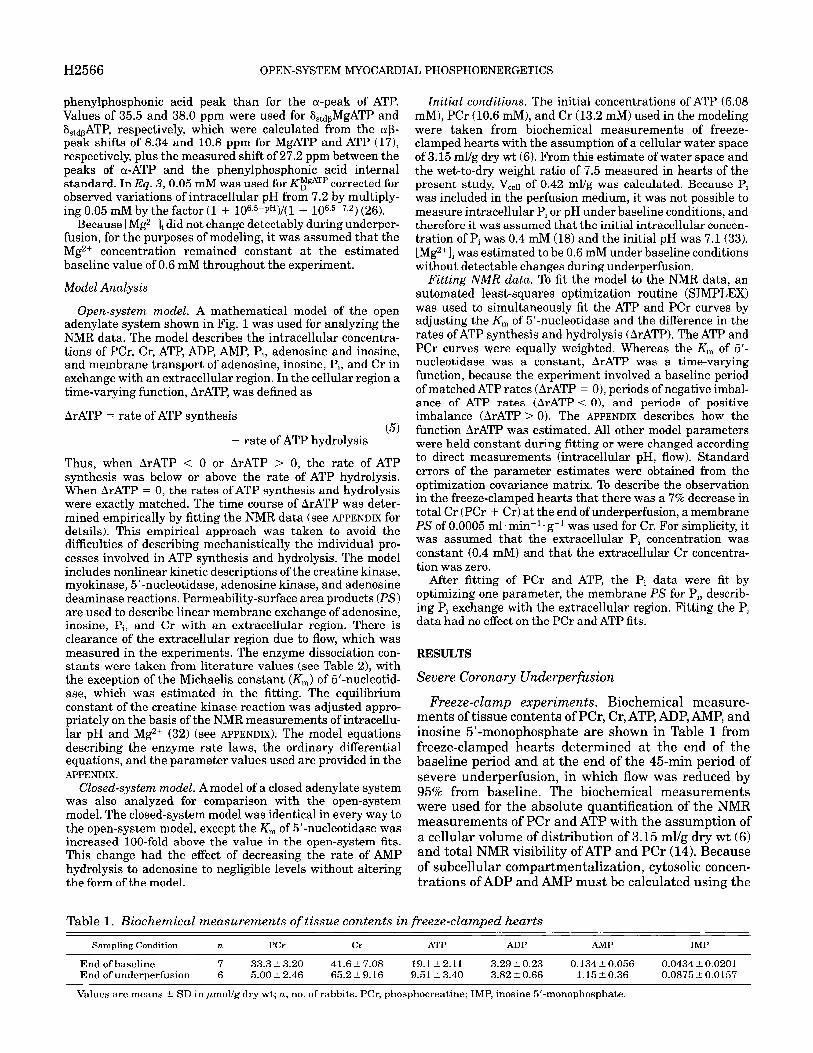
phenylphosphonic acid peak than for the a-peak of ATP. Values of 35.5 and 38.0 ppm were used for &MgATP and S,,dpATP, respectively, which were calculated from the cxp- peak shifts of 8.34 and 10.8 ppm for MgATP and ATP (17), respectively, plus the measured shift of 27.2 ppm between the peaks of (x-ATP and the phenylphosphonic acid internal standard. In Eq. 3,0.05 mM was used for KFgATP corrected for observed variations of intracellular pH from 7.2 by multiply- ing 0.05 mM by the factor (1 + 106.5-pH)/(1 + 106.5-7.2) (26).
Because [Mg2+]i did not change detectably during underper- fusion, for the purposes of modeling, it was assumed that the Mg2+ concentration remained constant at the estimated baseline value of 0.6 mM throughout the experiment.
Model Analysis
Open-system model. A mathematical model of the open adenylate system shown in Fig. 1 was used for analyzing the NMR data. The model describes the intracellular concentra- tions of PCr, Cr, ATP, ADP, AMP, Pi, adenosine and inosine, and membrane transport of adenosine, inosine, Pi, and Cr in exchange with an extracellular region. In the cellular region a time-varying function, ArATP, was defined as
ArATP = rate of ATP synthesis (5) - rate of ATP hydrolysis
Thus, when ArATP < 0 or ArATP > 0, the rate of ATP synthesis was below or above the rate of ATP hydrolysis. When ArATP = 0, the rates of ATP synthesis and hydrolysis were exactly matched. The time course of ArATP was deter- mined empirically by fitting the NMR data (see APPENDIX for details). This empirical approach was taken to avoid the difficulties of describing mechanistically the individual pro- cesses involved in ATP synthesis and hydrolysis. The model includes nonlinear kinetic descriptions of the creatine kinase, myokinase, 5’-nucleotidase, adenosine kinase, and adenosine deaminase reactions. Permeability-surface area products (PS) are used to describe linear membrane exchange of adenosine, inosine, Pi, and Cr with an extracellular region. There is clearance of the extracellular region due to flow, which was measured in the experiments. The enzyme dissociation con- stants were taken from literature values (see Table 2), with the exception of the Michaelis constant (K,> of 5’-nucleotid- ase, which was estimated in the fitting. The equilibrium constant of the creatine kinase reaction was adjusted appro- priately on the basis of the NMR measurements of intracellu- lar pH and Mg 2+ (32) (see APPENDIX). The model equations describing the enzyme rate laws, the ordinary differential equations, and the parameter values used are provided in the APPENDIX.
Closed-system model. A model of a closed adenylate system was also analyzed for comparison with the open-system model. The closed-system model was identical in every way to the open-system model, except the Km of 5’-nucleotidase was increased loo-fold above the value in the open-system fits. This change had the effect of decreasing the rate of AMP hydrolysis to adenosine to negligible levels without altering the form of the model.
InitiaZ conditions. The initial concentrations of ATP (6.08 mM), PCr (10.6 mM), and Cr (13.2 mM) used in the modeling were taken from biochemical measurements of freeze- clamped hearts with the assumption of a cellular water space of 3.15 ml/g dry wt (6). From this estimate of water space and the wet-to-dry weight ratio of 7.5 measured in hearts of the present study, Vcell of 0.42 ml/g was calculated. Because Pi was included in the perfusion medium, it was not possible to measure intracellular Pi or pH under baseline conditions, and therefore it was assumed that the initial intracellular concen- tration of Pi was 0.4 mM (18) and the initial pH was 7.1(33). [Mg2+]i was estimated to be 0.6 mM under baseline conditions without detectable changes during underperfusion.
Fitting NMR data. To fit the model to the NMR data, an automated least-squares optimization routine (SIMPLEX) was used to simultaneously fit the ATP and PCr curves by adjusting the K, of 5’-nucleotidase and the difference in the rates of ATP synthesis and hydrolysis (ArATP). The ATP and PCr curves were equally weighted. Whereas the K, of 5’- nucleotidase was a constant, ArATP was a time-varying function, because the experiment involved a baseline period of matched ATP rates (ArATP = O), periods of negative imbal- ance of ATP rates (ArATP < O), and periods of positive imbalance (ArATP > 0). The APPENDIX describes how the function ArATP was estimated. All other model parameters were held constant during fitting or were changed according to direct measurements (intracellular pH, flow). Standard errors of the parameter estimates were obtained from the optimization covariance matrix. To describe the observation in the freeze-clamped hearts that there was a 7% decrease in total Cr (PCr + Cr) at the end of underperfusion, a membrane PS of 0.0005 ml l min-l l g-l was used for Cr. For simplicity, it was assumed that the extracellular Pi concentration was constant (0.4 mM) and that the extracellular Cr concentra- tion was zero.
After fitting of PCr and ATP, the Pi data were fit by optimizing one parameter, the membrane PS for Pi, describ- ing Pi exchange with the extracellular region. Fitting the Pi data had no effect on the PCr and ATP fits.
RESULTS
Severe Coronary Underperfusion
Freeze-clamp experiments. Biochemical measure- ments of tissue contents of PCr, Cr, ATP, ADP, AMP, and inosine 5’-monophosphate are shown in Table 1 from freeze-clamped hearts determined at the end of the baseline period and at the end of the 45min period of severe underperfusion, in which flow was reduced by 95% from baseline. The biochemical measurements were used for the absolute quantification of the NMR measurements of PCr and ATP with the assumption of a cellular volume of distribution of 3.15 ml/g dry wt (6) and total NMR visibility of ATP and PCr (14). Because of subcellular compartmentalization, cytosolic concen- trations of ADP and AMP must be calculated using the
End of baseline 7 33.323.20 41.627.08 19.1t2.11 3.29t0.23 0.134t0.056 0.0434+0.0201 End of underperfusion 6 5.00+2.46 65.2 5 9.16 9.51 t 3.40 3.8250.66 1.15t0.36 0.0875+0.0157
Values are means + SD in pmol/g dry wt; n, no. of rabbits. PCr, phosphocreatine; IMP, inosine 5’-monophosphate.

OPEN-SYSTEM MYOCARDIAL PHOSPHOENERGETICS H2567
equilibrium expressions for the creatine kinase and myokinase reactions (Eq. 2) rather than measurements of tissue contents ofADP and AMP (7).
NMR experiments. The ratio of the area of the PCr peak to the mean area of the three ATP peaks averaged 2.1 t 0.41 (mean ? SD, n = 10) in the fully relaxed NMR spectra acquired under control conditions (Fig. 2). The ratio of 2.1 is in agreement with the biochemical measurement of a PCr-to-ATP concentration ratio of 1.75 t 0.13 in hearts that were freeze-clamped during baseline (Table 1) and is similar to a PCr-to-ATP ratio of 2.2 determined in the in situ rabbit heart (19).
Coronary flow was decreased by 95% from a baseline value of 5.76 2 2.09 ml*min-l.g-l for 45 min, causing an abrupt decrease in PCr to 25% of baseline levels, then a more gradual partial recovery to 42% of baseline, whereas ATP showed a continual decrease to 65% of baseline (Fig. 3, top). PCr increased rapidly toward baseline during the 15 min of reperfusion, but there was no detectable recovery ofATP.
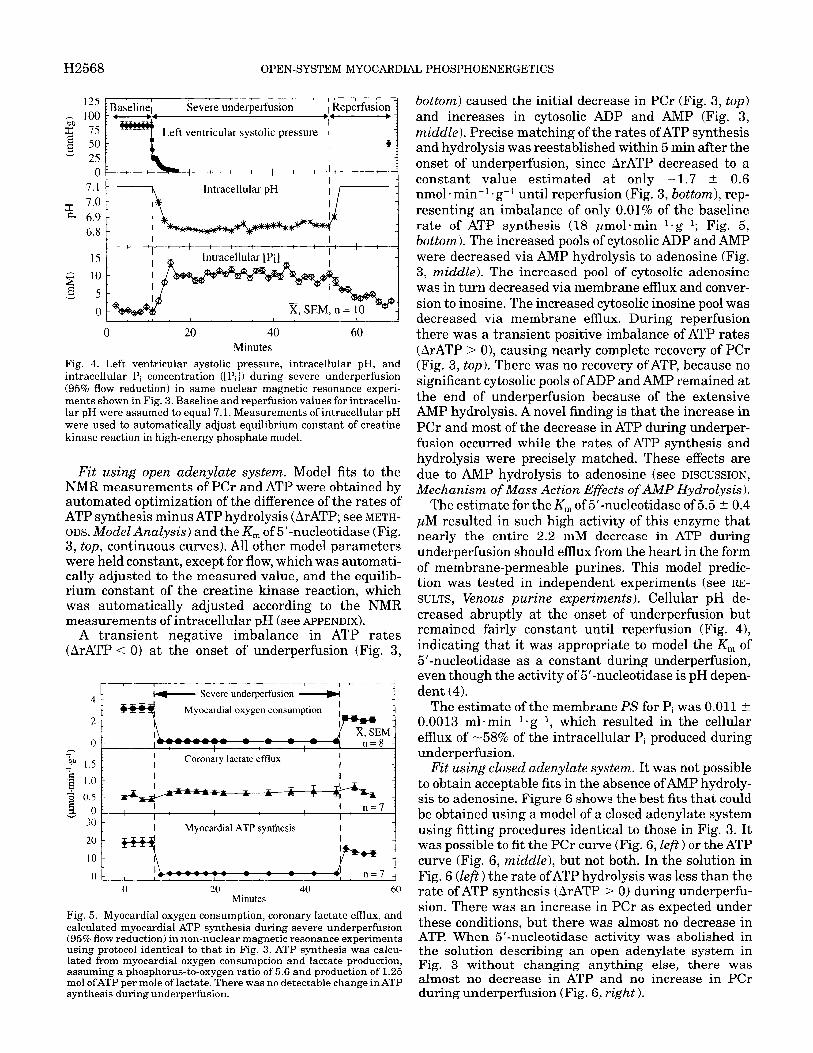
Left ventricular systolic pressure decreased from a baseline value of 83 mmHg to undetectable levels after -4 min during severe underperfusion (Fig. 4, top). Ventricular pressure remained undetectable until hearts were reperfused and recovered to 49 mmHg after 15 min of reperfusion. Electrical stimulation was continued at a rate of 200 min-l throughout the experi- ment. Intracellular pH, calculated from the frequency shift of the Pi peak, decreased to 6.82 within 10 min of underperfusion and increased to -6.88 toward the end of underperfusion (Fig. 4, middle). It was assumed that intracellular pH was equal to 7.1 during baseline and reperfusion conditions. The intracellular Pi concentra- tion (see METHODS, NMR Spectroscopy) increased to -10 mM within 5 min of underperfusion and remained relatively constant until reperfusion when it decreased toward baseline (Fig. 4, bottom). [Mg2+]i was calculated to be 0.61 t 0.06 mM during baseline conditions and remained unchanged at 0.64 ? 0.11 mM during under- perfusion.
Oxygen and lactate experiments. Myocardial oxygen consumption decreased by 95% from a baseline value of
I”’ ” ” ” ” ’ ” m ” ’ “‘I
Internal PCr
y-ATP
PPM
Fig. 2. Fully relaxed phosphorus nuclear magnetic resonance spec- trum from 1 heart under control conditions acquired by summing 40 free induction decays. Internal standard was a phenylphosphonic acid solution contained in capillary tubes within probe. Abscissa, spectral frequency in Hz, expressed as parts per million (ppm)
- - Baseline
I I
Severe underperfusion I
Reperfusion - w-
c g lo PCr
2 ‘S r-7
x,SEM,n= 10 - 0 I I I I
2 300 1 k ADP
ATP synthesis - ATP hydrolysis 1
dd I
0 20 40 60 Minutes
Fig. 3. Effect of severe coronary underperfusion (constant 95% flow reduction) in isolated rabbit heart. Top: nuclear magnetic resonance data for PCr ( l ) and ATP (0) calibrated using biochemical measure- ments (Table 1); curves, model fits using open adenylate system (Fig. 1). Fits were obtained by automatically optimizing time-varying function ArATP (bottom) and the Michaelis constant of 5’-nucleotid- ase (AMP - adenosine). All other model parameters were held constant or were varied according to measurements (intracellular pH, flow). 2MiddZe: estimates of cytosolic concentrations of ADP, AMP, adenosine, and inosine from model fit in top. Bottom: estimated time course for ArATP (= rate of ATP synthesis - rate of ATP hydrolysis, see APPENDIX) used in model fit. Open-system model predicted that increase in PCr and decrease in ATP during underperfusion occurred despite nearly identical rates of ATP synthesis and hydrolysis (ArATP - 0, bottom) due to mass action effects of AMP hydrolysis to membrane-permeable adenosine. Because 5’-nucleotidase re- action functioned as an efficient sink for cytosolic AMP, adenosine and inosine concentrations increased to much higher levels than did AMP.
3.2 t 0.4 pmol l min-l l g-l (n = 8) in parallel non-NMR experiments that followed the identical severe underper- fusion protocol and showed partial recovery during reperfusion (Fig. 5). Myocardial lactate production increased an average of 39% from baseline to a nearly constant value of 0.7 pmol l min-l = g-l throughout under- perfusion in the same experiments (Fig. 5). Calculated myocardial ATP synthesis decreased by 90% to a con- stant value of 1.7 pmol*min-l*g-l during underperfu- sion (Fig. 5), assuming a phosphorus-to-oxygen ratio of 5.6 (5) and the production of 1.25 mol ofATP per mole of lactate via glycolysis. Production of ATP via glycolysis increased from 3 IT 0.4% of total ATP synthesis during baseline conditions to 50 t 4% during underperfusion. If it is assumed that the phosphorus-to-oxygen ratio decreased by 50% below normal during underperfu- sion, then the calculated rate of ATP synthesis was decreased to 1.3 ~mol*minl*gB1. relative to PCr.
H2568 OPEN-SYSTEM MYOCARDIAL PHOSPHOENERGETICS
1 B*aselinej 4
Severe underperfusion 1 Reperfusion l .- 1
Left ventricular systolic pressure 1 I
Intracellular pH
0 20 40 Minutes
60
Fig. 4. Left ventricular systolic pressure, intracellular pH, and intracellular Pi concentration ([Pi]) during severe underperfusion (95% flow r d t’ ) e uc ion in same nuclear magnetic resonance experi- ments shown in Fig. 3. Baseline and reperfusion values for intracellu- lar pH were assumed to equal 7.1. Measurements of intracellular pH were used to automatically adjust equilibrium constant of creatine kinase reaction in high-energy phosphate model.
Fit using open adenylate system. Model fits to the NMR measurements of PCr and ATP were obtained by automated optimization of the difference of the rates of ATP synthesis minus ATP hydrolysis (ArATP; see METH- ODS. Model AnaZysis) and the K, of 5’-nucleotidase (Fig. 3, top, continuous curves). All other model parameters were held constant, except for flow, which was automati- cally adjusted to the measured value, and the equilib- rium constant of the creatine kinase reaction, which was automatically adjusted according to the NMR measurements of intracellular pH (see APPENDIX).
A transient negative imbalance in ATP rates (ArATP <= 0) at the onset of underperfusion (Fig. 3,
I I - I 1 I ’
I+- Severe underperfusion -m Myocardial oxygen consumption I
k--m- l
1 I Coronary lactate efflux I
2 1.5 I I -1
Myocardial ATP synthesis
0 I ! ! ! n=7 . 4 0 20 40 60
Minutes Fig. 5. Myocardial oxygen consumption, coronary lactate efIlux, and calculated myocardial ATP synthesis during severe underperfusion (95%flow r d t’ e uc ion) in non-nuclear magnetic resonance experiments using protocol identical to that in Fig. 3. ATP synthesis was calcu- lated from myocardial oxygen consumption and lactate production, assuming a phosphorus-to-oxygen ratio of 5.6 and production of 1.25 mol ofATP per mole of lactate. There was no detectable change in ATP svnthesis during: underr>erfusion.
bottom) caused the initial decrease in PCr (Fig. 3, top) and increases in cytosolic ADP and AMP (Fig. 3, middle). Precise matching of the rates ofATP synthesis and hydrolysis was reestablished within 5 min after the onset of underperfusion, since ArATP decreased to a constant value estimated at only -1.7 t 0.6 nmol l min-l l g-l until reperfusion (Fig. 3, bottom), rep- resenting an imbalance of only 0.01% of the baseline rate of ATP synthesis (18 pmolmin-l l g-l; Fig. 5, bottom). The increased pools of cytosolic ADP and AMP were decreased via AMP hydrolysis to adenosine (Fig. 3, middle). The increased pool of cytosolic adenosine was in turn decreased via membrane efflux and conver- sion to inosine. The increased cytosolic inosine pool was decreased via membrane efflux. During reperfusion there was a transient positive imbalance of ATP rates (ArATP > 0), causing nearly complete recovery of PCr (Fig. 3, top). Th ere was no recovery of ATP, because no significant cytosolic pools of ADP and AMP remained at the end of underperfusion because of the extensive AMP hydrolysis. A novel finding is that the increase in PCr and most of the decrease in ATP during underper- fusion occurred while the rates of ATP synthesis and hydrolysis were precisely matched. These effects are due to AMP hydrolysis to adenosine (see DISCUSSION, Mechanism of Mass Action Effects of AhIP Hydrolysis).
The estimate for the K, of 5’nucleotidase of 5.5 t 0.4 JLM resulted in such high activity of this enzyme that nearly the entire 2.2 mM decrease in ATP during underperfusion should efflux from the heart in the form of membrane-permeable purines. This model predic- tion was tested in independent experiments (see RE- SULTS, Venous purine experiments). Cellular pH de- creased abruptly at the onset of underperfusion but remained fairly constant until reperfusion (Fig. 4), indicating that it was appropriate to model the K, of 5’-nucleotidase as a constant during underperfusion, even though the activity of 5’-nucleotidase is pH depen- dent (4).
The estimate of the membrane PS for Pi was 0.011 t 0.0013 ml*min-l*g-l, which resulted in the cellular efflux of -58% of the intracellular Pi produced during underperfusion.
Fit using closed adenylate system. It was not possible to obtain acceptable fits in the absence ofAMP hydroly- sis to adenosine. Figure 6 shows the best fits that could be obtained using a model of a closed adenylate system using fitting procedures identical to those in Fig. 3. It was possible to fit the PCr curve (Fig. 6, Left) or the ATP curve (Fig. 6, middZe), but not both. In the solution in Fig. 6 (left ) the rate of ATP hydrolysis was less than the rate of ATP synthesis (ArATP > 0) during underperfu- sion. There was an increase in PCr as expected under these conditions, but there was almost no decrease in ATP. When 5’-nucleotidase activity was abolished in the solution describing an open adenylate system in Fig. 3 without changing anything else, there was almost no decrease in ATP and no increase in PCr during underperfusion (Fig. 6, right ).

OPEN-SYSTEM MYOCARDIAL PHOSPHOENERGETICS H2569
0 20 40 60 0 20 40 60 0 20 40 60 Minutes Minutes Minutes
Fig. 6. Model of closed adenylate system (negligible AMP hydrolysis to adenosine) cannot fit severe underperfusion nuclear magnetic resonance data shown in Fig. 3. Symbols, nuclear magnetic reso- nance data for PCr (e) and ATP (0); curves, model fits for ATP (dashed) and PCr (continuous). Closed adenylate system can fit PCr data (left) or ATP data (mid&e) but not both. Right: results obtained by abolishing AMP hydrolysis in fit shown in Fig. 3, converting solution to a closed-system model.
TTC staining experiments. TTC staining in two hearts after severe underperfusion and reperfusion for 90 min resulted in an even, deep brick red color throughout the heart that was indistinguishable from a control heart stained immediately after surgical removal from the chest. The results indicate that underperfusion did not cause detectable cellular necrosis.
SaZine vehicle experiments. Separate NMR experi- ments (n = 10) were performed in which the saline vehicle (10 ml) was administered before surgery in place of the hydrophilic adenosine receptor antagonist 8-SPT (10 mg/kg iv) that was given to all the other animals to reversibly block adenosine receptors during
’ I ’ ’ ’ I Under-perfusion
I.&
x,SEM,n= 10 - 0 I. I I I I I I I I
0 20 40 60 Minutes
Fig. 7. Nuclear magnetic resonance data from saline vehicle experi- ments during severe underperfusion (95% flow reduction). Animals received saline (10 ml iv) before surgery. Animals in all other experiments received 8sulfophenyltheophylline (8SPT, 10 mg/kg in 10 ml of saline iv) before surgery to inhibit possible adenosine receptor stimulation during surgery. It was assumed that 8SPT washed out of heart during early stages of perfusion. Results demonstrate little if any effect of administration of 8SPT before surgery.
wet wt (n = 9) during underperfusion (Fig. 8). This is equivalent to a loss of tissue adenine nucleotides of 2.1 mM (on the basis of a cellular volume of distribution of 0.42 ml/g), which is similar to the decrease of 2.2 mM in ATP concentration observed in the NMR experiments. These results confirm the hypothesis prediction of open-system kinetics.
Adenosine showed the most pronounced phasic time course, rising to a maximal venous concentration of 23 t 5 JLM and decreasing to 1.7 5 0.18 JLM at the end of
the brief period of ischemia due to the surgery. Other- wise, the experimental protocol was identical to the SO
severe underperfusion NMR study. Because 8SPT is ,^ hydrophilic, it was assumed that 8-SPT washed out of Jo the heart during the initial phase of perfusion, leaving $ 4o adenosine receptors unblocked during the experimen- % tal protocols. There were no differences in the ATP g 30 results between the saline vehicle experiments and the T severe underperfusion experiments and only minor differences in the PCr results during underperfusion
5 9 20
(Fig. 7). The results indicate that transiently blocking adenosine receptors before the surgery for heart isola-
5 T
were performed to test the model prediction of the open-system hypothesis that the entire 2.2 mM de- crease in ATP concentration during underperfusion observed in the NMR experiments (Fig. 3) should efflux from the heart in the form of membrane-permeable purines. In these non-NMR experiments, performed using the same severe underperfusion protocol (95% flow reduction) used in the NMR experiments in Fig. 3, total coronary venous purine efflux (adenosine + ino- sine + hypoxanthine) averaged 890 t 200 (SE) nmol/g
tion had little if any effect on ATP and PCr during underperfusion.
Independent Tests of the Open-System Hypothesis
Venous purine experiments. Non-NMR experiments Fig. 8. Coronary venous purine efflux in nonnuclear magnetic resonance experiments using severe underperfusion protocol (95% flow reduction) identical to that used in experiments in Fig. 3. Experiments were performed to independently test prediction of open-system kinetics hypothesis that total venous purine efflux should equal decrease in ATP during underperfusion. Total venous purine efflux of 890 nmol/g was equivalent to a 2.1 mM decrease in adenine nucleotides, assuming a cellular volume of distribution of 0.42 ml/g (see METHODS, 1nitiaZ conditions). Venous purine loss was similar to 2.2 mM decrease in ATP determined in nuclear magnetic resonance experiments (Fig. 3), confirming prediction of open-system kinetics hypothesis.
*z 1.
2 - 0
0 10 20 30 40
Minutes underperfusion

H2570 OPEN-SYSTEM MYOCARDIAL PHOSPHOENERGETICS
underperfusion. Inosine increased to an even higher venous concentration of 90 t 22 PM, whereas the maximal concentration of hypoxanthine was 31 t 6 PM. Neither xanthine nor uric acid was detectable (detection limit -100 nM). The importance of the 5’-nucleotidase reaction as a sink for AMP is under- scored by the finding that the maximal concentration of cytosolic AMP during underperfusion was only 11 PM (Fig. 3) on the basis of the NMR data, much lower than the venous purine concentrations.
Moderate coronary underperfusion. Separate NMR experiments (n = 9) were performed to study hearts during moderate coronary underperfusion to indepen- dently test a second model prediction of the hypothesis of open-system kinetics. The prediction was that during moderate underperfusion the initial increase in cyto- solic AMP should be less than during severe underper- fusion, and therefore AMP hydrolysis to adenosine should cause little increase in PCr.
NMR EXPERIMENTS. Coronary flow was decreased by 80% from a baseline value of 5.87 t 1.71 ml*minl.g-l, causing a rapid decrease in PCr to -58% of baseline and a continuous decrease in ATP to 78% of baseline. (Fig. 9, top). As expected, the peak concentration of cytosolic AMP during moderate underperfusion (2 PM, Fig. 9, middle) was lower than the peak AMP concentra- tion during severe underperfusion (11 PM, Fig. 3,
r I 1 I Moderate underperfusion Reperfusion
w
PCr tt-7 t x,SEM,n=9
01 I I I
ATP synthesis - ATP hydrolysis
l. 4
3 -2 - V 0 20 40 60
Minutes Fig. 9. Effect of moderate coronary underperfusion (80% flow reduc- tion). Top: open-system model fit (curves) to moderate underperfusion nuclear magnetic resonance data for PCr (+) and ATP (0). Middle: estimates of cytosolic concentrations of ADP, AMP, adenosine, and inosine from model fit in top. Bottom: model solution for ArATP (rate of ATP synthesis - rate of ATP hydrolysis). Results confirm predic- tion of open-system kinetics hypothesis that there should be negli- gible recovery of PCr during moderate underperfusion. Fit was obtained in exactly the same way as fit for severe underperfusion data in Fig. 3.
Moderate underperfusion
Left ventricular systolic pressure
a 4 o- : :I : i : : : 1 : : f : ,’ : -
7.1 --J& Intracellular pH I I i z 7.0 0, 6.9 I
6.8 t 1 Intracellular [Pi]
s .E 3 0
0 20 40 Minutes
60
Fig. 10. Left ventricular systolic pressure, intracellular pH, and intracellular [Pi] during moderate underperfusion (80% flow reduc- tion) in same nuclear magnetic resonance experiments shown in Fig. 9. Baseline and reperfusion values for intracellular pH were assumed to equal 7.1. Measurements of intracellular pH were used to automati- cally adjust equilibrium constant of creatine kinase reaction in high-energy phosphate model in fit in Fig. 9.
middle). There was no recovery of PCr, in marked contrast to the results during severe underperfusion (95% flow reduction), confirming the model prediction of the open-system hypothesis.
Left ventricular systolic pressure decreased abruptly during moderate underperfusion from a baseline value of 81 mmHg to a constant value of 16 mmHg and recovered to 63 mmHg after 15 min of reperfusion (Fig. 10). Intracellular pH decreased to 6.95 during underper- fusion and remained constant. Intracellular Pi in- creased to a constant value of 5 mM at the onset of moderate underperfusion.
OXYGEN AND LACTATE EXPERIMENTS. Myocardial oxygen consumption decreased by 87% from baseline to 0.67 pm01 l min-l l g-l (n = 6) in non-NMR experiments after the identical moderate underperfusion protocol (Fig. 11).
Myocardial oxygen consumption
o- , I : I 1 1 , n=6 - n I I I c( 2 1.5 :
.$ 1.0 1 * 0.5 :
I I I I I I - Myocardial ATP synthesis
o- 1 0 20 40 60
Minutes
Fig. 11. Myocardial oxygen consumption, coronary lactate efflux, and calculated myocardial ATP synthesis during moderate underperfu- sion (80% flow reduction) in non-nuclear magnetic resonance experi- ments using protocol identical to that shown in Fig. 9. ATP synthesis was calculated from myocardial oxygen consumption and lactate production, assuming a phosphorus-to-oxygen ratio of 5.6 and produc- tion of 1.25 mol ofATP per mole of lactate.

OPEN-SYSTEM MYOCARDIAL PHOSPHOENERGETICS H2571
Myocardial lactate production showed a 2.4-fold in- crease to a constant value of 1.4 pmol l minl l g-l, and calculated myocardial ATP synthesis decreased to a constant value of 5.1 pmol l min-l l g-l, assuming that the phosphorus-to-oxygen ratio remained at a constant value of 5.6 and that there were 1.25 mol of ATP produced per mole of lactate produced. During moder- ate underperfusion, glycolysis provided 32% of total ATP synthesis. If it is assumed that the phosphorus-to- oxygen ratio was decreased by 50% below normal during underperfusion, then the rate of total ATP synthesis would be 3.6 pmol l min-l l g-l.
MODEL FIT. The model accurately described the moder- ate underperfusion NMR data (Fig. 9, top, continuous curves). The transient negative imbalance of ATP rates (ArATP < 0) at the onset of moderate underperfusion (Fig. 9, bottom) was smaller than in severe underperfu- sion (Fig. 3, bottom), resulting in lesser increases in cytosolic ADP and AMP in moderate underperfusion (Fig. 9, middle). Close matching of ATP rates was reestablished within 5 min after the onset of moderate underperfusion, leaving an estimated imbalance (-17 t 3 nmolmin-l* g-l), representing only 0.06% of the baseline rate of ATP synthesis. The increased cytosolic pools of ADP and AMP were cleared via AMP hydrolysis to adenosine and subsequent metabolism and membrane efflux of adenosine. The K, of 5’-nucleotidase was estimated to be 3.8 5 0.2 PM.
DISCUSSION
The present findings demonstrate that ATP and PCr kinetics during severe coronary underperfusion can only be described using an open adenylate system that includes novel mass action effects ofAMP hydrolysis to adenosine. The open-system kinetics caused a decrease in ATP and an increase in PCr during underperfusion, despite exact matching of the rates of ATP synthesis and hydrolysis. Restoration of the matching of the rates of ATP synthesis and hydrolysis was unexpectedly rapid and precise, even during severe underperfusion (95% flow decrease). The hypothesis of open-system kinetics was confirmed experimentally by testing two independent predictions of the hypothesis. First, the decrease in ATP concentration due to severe underper- fusion was equal to the total coronary venous efflux of membrane-permeable purines (adenosine + inosine + hypoxanthine). Second, there was no PCr recovery during moderate coronary underperfusion.
Mechanism of Mass Action Effects of AMP Hydrolysis
The transient imbalance ofATP rates (Fig. 3, bottom) during underperfusion caused increased pools of cyto- solic AMP and ADP, which were cleared via the 5’-nucleotidase and myokinase reactions. The decrease in AMP and ADP caused an increase in PCr and a decrease in ATP via mass action effects of the creatine kinase reaction, as predicted in an approximate fashion by Eq. 2. The gradual time course for the recovery of PCr was mainly determined by the relatively low activity of the cytosolic 5’-nucleotidase reaction, which
has a much lower enzymatic capacity than creatine kinase or myokinase (10,35).
The mass action effects of AMP hydrolysis were particularly clear in the present study, because they took place while the rates ofATP synthesis and hydroly- sis were nearly identical. However, the same mass action processes would also take place ifATP synthesis and hydrolysis were not matched, although the effects would take a different form, as discussed below (see Open vs. Closed Adenylate System).
Moderate Underperfusion
The results during moderate underperfusion con- firmed the model prediction that there should be no recovery of PCr. This outcome is somewhat counterintui- tive, since it might be expected that with less severe ischemia it would be more likely that hearts could generate a positive imbalance in ATP rates (ArATP > 0) and, therefore, a greater recovery of PCr than during severe underperfusion (41). Instead, there was no recovery of PCr during moderate underperfusion and no evidence for a positive imbalance in ATP rates. There was negligible PCr recovery, because there was less increase in the pools of ADP and AMP at the onset of moderate underperfusion than during severe under- perfusion (cf. Fig. 3, middle, and Fig. 9, middZe) and, consequently, less effect of AMP hydrolysis.
Open vs. Closed Adenylate System
The closed-system model of the adenylate system (no AMP hydrolysis) failed to accurately describe the kinet- ics of ATP and PCr (Fig. 6), because it incorrectly predicted increases of cytosolic ADP into the millimolar range during net ATP hydrolysis. This unrealistic behavior is illustrated by simulating a hypothetical constant negative imbalance of ATP rates (ArATP < 0) in a closed adenylate system (Fig. 12, left ). Millimolar increases in cytosolic ADP cause the PCr buffer to maintain nearly constant levels of ATP until PCr is nearly exhausted, as predicted in previous theoretical analyses of the high-energy phosphate system in which there was no AMP hydrolysis (1, 9). In contrast, there are numerous experimental observations of decreases in ATP during coronary underperfusion without the depletion of PCr (2, 4, 33, 37, 41, 48). Simulating reperfusion with a positive imbalance of ATP rates (ArATP > 0) in the closed adenylate system incorrectly predicted a rapid and complete recovery ofATP (Fig. 12, Left), because ADP and AMP remained in the system during ATP depletion.
Unexpected, but more realistic, effects of the PCr buffer were predicted when the identical negative imbalance of ATP rates (ArATP < 0) was simulated in an open adenylate system that included AMP hydroly- sis to adenosine but was otherwise identical to the closed system (Fig. 12, right). The open system pre- dicted that ATP and PCr should decrease together during underperfusion, which is consistent with experi- mental observations (3, 4, 33, 37, 41, 48). Here, cyto- solic ADP increased only into the micromolar range,

H2572 OPEN-SYSTEM MYOCARDIAL PHOSPHOENERGETICS
Closed adenvlate system
Free energy of ATP hydrolysis (AG)
10 20 Minutes
30 0 10 20 30 Minutes
Fig. 12. Simulation of a negative balance of myocardial ATP rates (ArATP < O), as in underperfusion, and a positive balance (ArATP > O), as in reperfusion, in a closed and an open adenylate system. ArATP = rate of ATP synthesis - rate of ATP hydrolysis. More realistic behavior of PCr buffer in open system was entirely due to mass action effects of AMP hydrolysis to adenosine, causing decreased accumulation ofADP and AMP. There was less decrease of free energy of ATP hydrolysis (AG, bottom) caused by ATP depletion in open system. Because AG of -45 kJ/mol (horizontal dashed line) is minimal energy requirement for maintaining calcium homeostasis, AMP hydrolysis to adenosine may improve myocardial survival during ischemia by preventing calcium overload. [Left panel adapted from Allen and Orchard (1 ).I
because the 5’-nucleotidase and myokinase reactions functioned as an effective sink for ADP and AMP. The open adenylate system realistically predicted negli- gible recovery of ATP but complete recovery of PCr during simulated reperfusion (Fig. 12, right). These results indicate that observed in vivo behavior of the PCr buffer is predicted by accounting for the mass action effects of AMP hydrolysis to adenosine without any need for compartmentalization.
Myocardial Hibernation and PCr Recovery
Although underperfusion lasted for only 45 min, the present results shed light on the process of myocardial hibernation, the long-term maintenance of myocardial viability in the presence of sustained reductions in coronary flow below normal (38). Myocardial hiberna- tion is probably brought about via decreased energy utilization due to decreased contraction, perhaps medi- ated by increased cellular Pi concentration during underperfusion (24, 47). Reestablishment of precise matching of the rates of ATP synthesis and hydrolysis may be the first step required for prolonged tissue survival during underperfusion.
There is no evidence that PCr recovery during under- perfusion is necessary for long-term tissue survival. However, it has been hypothesized that PCr recovery is an indicator of hibernating myocardium (3, 48). In- creases in PCr during underperfusion have been inter- preted as evidence of a decrease in the rate of ATP hydrolysis below the rate ofATP synthesis (ArATP > 0) (3). Complete PCr recovery to control levels during l-2 h of sustained underperfusion has been observed in in vivo blood-perfused hearts (3, 37, 43, 48) and in buffer- perfused isolated hearts (13, 39, 40). PCr recovery has also been absent in blood-perfused hearts (41) and incomplete in isolated hearts (present study). The
present finding that there was no PCr recovery during moderate underperfusion demonstrates that precise matching of ATP synthesis and hydrolysis can occur without PCr recovery.
The present open-system model can simulate the observations of complete PCr recovery during sus- tained underperfusion as a result of mass action effects of AMP hydrolysis alone without a positive imbalance in ATP rates. A transient negative imbalance in ATP rates (ArATP < 0) was used to produce an initial 30% decrease in PCr followed by a 120-min period of exact matching of ATP rates (ArATP = 0). The model de- scribed complete PCr recovery using parameter values identical to those used in the fits of the severe underper- fusion data in Fig. 3, except it was assumed that the adenosine kinase reaction (adenosine - AMP) is inhib- ited during underperfusion. Adenosine kinase was in- hibited by -90% due to hypoxia in the guinea pig heart (ll), and the mechanism for adenosine kinase inhibi- tion may be allosteric effects due to increased Pi (16). Inhibition of adenosine kinase would cause increased net flux from AMP to adenosine and result in greater mass action effects than’were present in Fig. 3. If there was no assumption of inhibition of adenosine kinase in the modeling, then it would be necessary to assume increased activity of Vnucleotidase to describe com- plete PCr recovery. There is evidence for increased activity of 5’-nucleotidase during myocardial ischemia (27). These results suggest that complete recovery of PCr could be due to mass action effects ofAMP hydroly- sis or, as previously assumed, to a positive imbalance in ATP rates (ArATP > 0).
The isolated heart preparation has advantages for investigating fundamental processes governing myocar- dial energetics in the intact heart, because the major determinants of energy supply and demand (coronary flow, preload, afterload, heart rate) can be controlled more precisely than in vivo. In addition, possible in vivo effects of neural activity and cell-mediated inflamma- tory responses are of minor importance in the buffer- perfused heart. The isolated heart preparation, there- fore, has limitations, because the results do not reflect the complexity encountered in vivo.
Free Energy of ATP Hydrolysis
The clearance of increased pools ofADP and AMP during ischemia via purine efflux may prolong tissue survival by improving the free energy of ATP hydrolysis (AG). The free energy change (Gibb’s free energy) is the chemical potential energy released by the hydrolysis ofATP that -- is available to the cell for performing work. Thus
AG=AGO+RTln [ADpI [PiI
[ATPI (6)
where AGO is the standard free energy change, R is the gas constant, and T is temperature. By convention, AG is negative. The variable term in AG is closely related to the ATP phosphorylation potential ([ATP]/[ADP][Pi]). If AG decreases from normal levels near -65 to -45 kJ/mol (Fig. 12, bottom, dashed line) during ischemia, then there is insufficient potential energy for the cell to
OPEN-SYSTEM MYOCARDIAL PHOSPHOENERGETICS H2573
maintain calcium homeostasis (1, 23) and calcium overload will occur, causing cell death. Increases in ADP concentrations caused impaired calcium uptake by the sarcoplasmic reticulum due to decreased AG in skinned rat heart muscle (47) and in the perfused rabbit heart (8). AG is maintained at higher levels during ATP depletion in the open adenylate system than in the closed system, because there is less accumu- lation of ADP in the open system. Because the removal of AMP via the production of adenosine causes de- creased ADP, the kinetics of the open adenylate system improve the free energy of ATP hydrolysis during myocardial ischemia and may benefit cellular survival by delaying or preventing calcium overload. This previ- ously unrecognized mechanism for maintaining the free energy of ATP hydrolysis during myocardial isch- emia may represent one of the most important func- tions of the production of adenosine.
Conclusion
The kinetics of myocardial ATP and PCr during severe coronary underperfusion can only be described by an open adenylate system that includes novel mass action effects of AMP hydrolysis to adenosine. AMP hydrolysis to adenosine caused a decrease in ATP and a simultaneous increase in PCr during underperfusion, despite exact matching of the rates of ATP synthesis and hydrolysis. Even during severe coronary underper- fusion (95% flow reduction), the rates of ATP synthesis and hydrolysis were just as precisely matched as during normal flow. There was no evidence that ATP synthesis exceeded ATP hydrolysis during underperfu- sion. Decreases in cellular adenine nucleotides via AMP hydrolysis to adenosine may benefit tissue survival during ischemia by improving the free energy of ATP hydrolysis, thereby preventing or delaying calcium overload.
APPENDIX
Model Equations
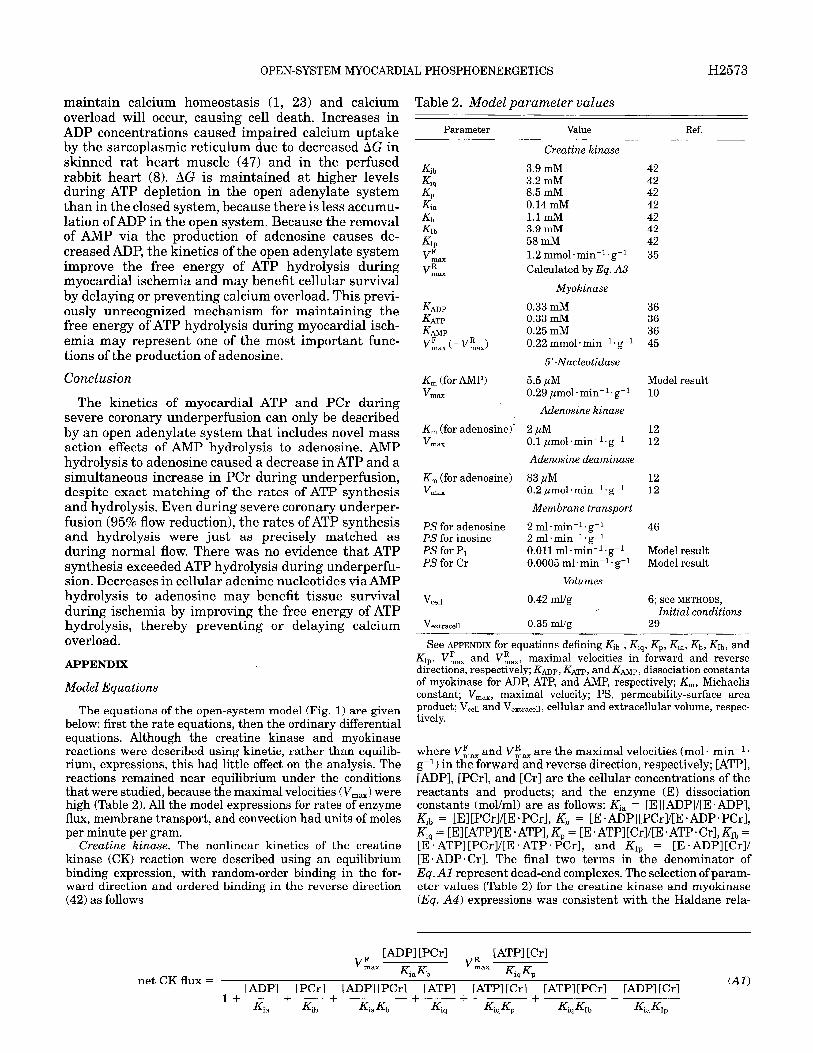
The equations of the open-system model (Fig. I) are given below: first the rate equations, then the ordinary differential equations. Although the creatine kinase and myokinase reactions were described using kinetic, rather than equilib- rium, expressions, this had little effect on the analysis. The reactions remained near equilibrium under the conditions that were studied, because the maximal velocities (V,,) were high (Table 2). All the model expressions for rates of enzyme flux, membrane transport, and convection had units of moles per minute per gram.
Creatine kinase. The nonlinear kinetics of the creatine kinase (CK) reaction were described using an equilibrium binding expression, with random-order binding in the for- ward direction and ordered binding in the reverse direction (42) as follows
Table 2. Model parameter values
Parameter Value
Creatine kinase
Ref.
&b Kq KP Ka Kb fib KIP VF max VR max
GDP KATP KAMP VLax (=Vza,>
3.9 mM 42 3.2 mM 42 8.5 mM 42 0.14 mM 42 1.1 mM 42 3.9 mM 42 58 mM 42 1.2 mmol*min-l*g-l 35 Calculated by Eq. A3
Myokinase
0.33 mM 36 0.33 mM 36 0.25 mM 36 0.22 mmol*min-l*g-l 45
5’-Nucleotidase
Km (for AMP) V max
5.5 PM Model result 0.29 ~mol*min-l*g-l 10
Adenosine kinase
Km (for adenosiney 2 PM 12 V max 0.1 ~mol.min-lgl 12
Adenosine deaminase
Km (for adenosine) 83 ,uM 12 V max 0.2 pmolmin-lag-l 12
Membrane transport
PS for adenosine 2 ml*min-l*g-l 46 PS for inosine 2 ml*min-l*g-l PS for Pi 0.011 ml-mir+gl Model result PS for Cr 0.0005 mlmin+ -8-l Model result
Volumes
V cell 0.42 ml/g 6; ~~~METHODS, , Initial conditions
V extracell 0.35 ml/g 29
See APPENDIX for equations defining Kib , Kig, Kp, Kia, Kb, KIb, and KIPe viax and Vi,, maximal velocities in forward and reverse directions, respectively; Kmp, KATP, and Kmp, dissociation constants of myokinase for ADP, ATP, and AMP, respectively; Km, Michaelis constant; Vmax, maximal velocity; PS, permeability-surface area product; Vcell and V extracell, cellular and extracellular volume, respec- tively.
where VL,, and Vf,, are the maximal velocities (mol l min-l l
g-l) in the forward and reverse direction, respectively; [ATP], [ADPI, [PCrl, and [C r are the cellular concentrations of the I reactants and products; and the enzyme (E) dissociation constants (mol/ml) are as follows: Ki, = [E][ADP]/[EMIP], Kb = [E][PCr]/[E l PCr], Kb = [EADP][PCr]/[E*ADP*PCr], Kiq = [E][ATP]/[E*ATP], Kp = [E*ATP][Cr]/[E*ATPCr], KIb = [E=ATP][PCr]/[E*ATP*PCr], and KIp = [E*ADP][Cr]/ [E ADP l Cr]. The final two terms in the denominator of Eq. Al represent dead-end complexes. The selection of param- eter values (Table 2) for the creatine kinase and myokinase (Eq. A4) expressions was consistent with the Haldane rela-
VF [DPl Wrl [ATPI [Cd max
net CK flux = Kia Kb
- ‘:a, K K
~ + [ADPI + [PCrl + [ADPl[PCrl [ATP] [ATP][C(rl ’ [ATP][PCr] [ADP][Cr] (Al)
Kia Kib KiaKb + Kiq + KiqKp + KiqKIb + KiaKIp
HZ574 OPEN-SYSTEM MYOCARDIAL PHOSPHOENERGETICS
tion to ensure proper equilibrium behavior from the kinetic expressions.
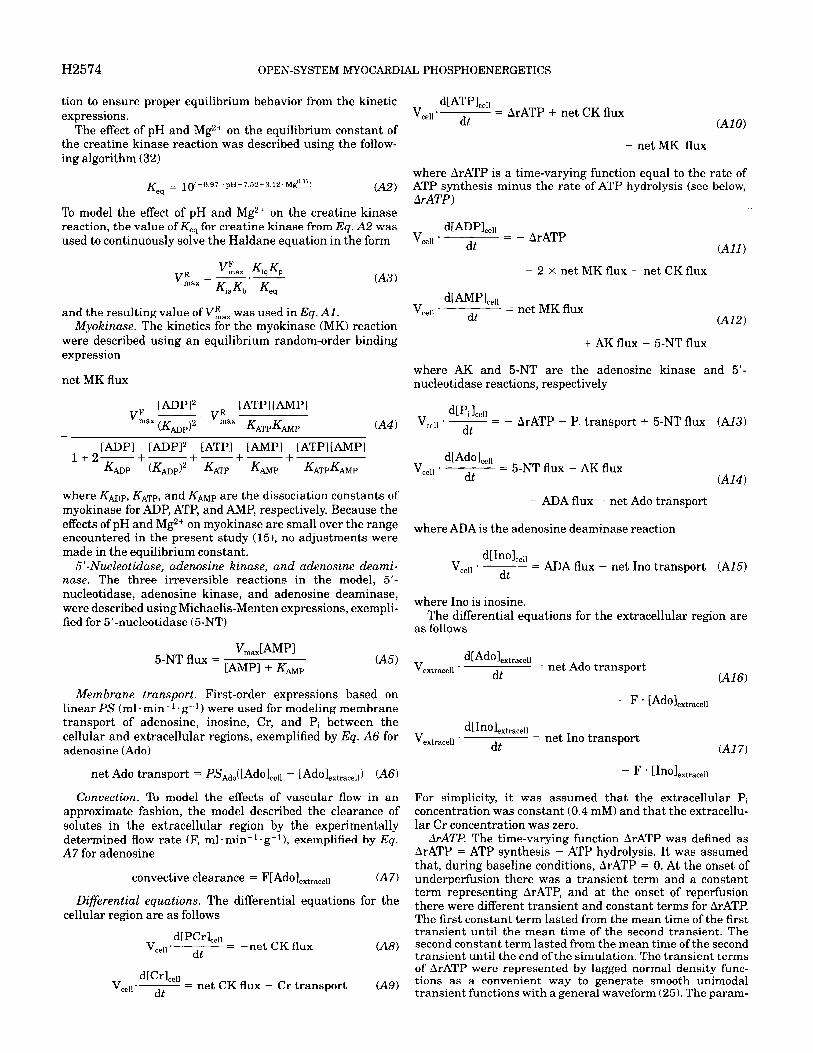
The effect of pH and Mg2+ on the equilibrium constant of the creatine kinase reaction was described using the follow- ing algorithm (32)
V dA~Plcell
cell l dt = ArATP + net CK flux
(Al 0)
+ net MK flux
where ArATP is a time-varying function equal to the rate of ATP synthesis minus the rate of ATP hydrolysis (see below, ArATP)
Keg = loFO.97 .pH~7.52+3.12.Mg”.“J (Aa
To model the effect of pH and Mg2+ on the creatine kinase reaction, the value of Kq for creatine kinase from Eq. AZ was used to continuously solve the Haldane equation in the form V
d[ADPLell cell l dt =
- ArATP
VF max P.
Kia Kb
Kiq Kp -2XnetMKflux--netCKflux VR = max (A31 Keel
V d[AMplcell
cell ’ dt = net MK flux
(A12)
+ AK flux - 5NT flux
and the resulting value of Vz, was used in Eq. Al. Myokinase. The kinetics for the myokinase (MK) reaction
were described using an equilibrium random-order binding expression
where AK and 5NT are the adenosine kinase and 5’- nucleotidase reactions, respectively net MK flux
vF CADPI2 -- max (Kmp>2
VR IATPI CAMP1 max KATPKAMP (A4) V
d[Pi Lcll cell l - = - ArATP - Pi transport + 5NT flux
dt (A13)
- [ADP] [ADPI [ATP] [AMP] [ATP][AMP] I+&-- - - - KADP + (&DP)~ + KATP + KAMP + KATPKAMP V
dl Ado Icell cell l dt
= 5-NT flux - AK flux (A141
where Kmp, KATp, and KAMP are the dissociation constants of myokinase for ADP, ATP, and AMP, respectively. Because the effects of pH and Mg2+ on myokinase are small over the range encountered in the present study (15), no adjustments were made in the equilibrium constant.
&Nucleotidase, adenosine kinase, and adenosine deami- nase. The three irreversible reactions in the model, 5’. nucleotidase, adenosine kinase, and adenosine deaminase, were described using Michaelis-Menten expressions, exempli- fied for 5’-nucleotidase (5-NT)
- ADA flux - net Ado transport
where ADA is the adenosine deaminase reaction
V d[Inolcell
cell l p = ADA flux - net Ino transport dt
(A15)
where Ino is inosine. The differential equations for the extracellular region are
as follows
vmax[AMpl 5-NT flux = [AMP] + KAMp V
d[Adolextracell extracell l
- net Ado transport dt -
(A5) (Ala
Membrane transport . First-order expressions based on linear PS (ml l min - l l g-l > were used for modeling membrane transport of adenosine, inosine, Cr, and Pi between the
V d[lnOlextracell
extracell ’ dt = net In0 transport cellular and extracellular regions, exemplified by Eq. A6 for
adenosine (Ado) (Al 7)
net Ado transport = PSA,,(1Ado]ce,, - IAdolextrace,,) (A61 For simplicity, it was assumed that the extracellular Pi concentration was constant (0.4 mM) and that the extracellu- lar Cr concentration was zero.
ArATP The time-varying function ArATP was defined as ArATP = ATP synthesis - ATP hydrolysis. It was assumed that, during baseline conditions, ArATP = 0. At the onset of underperfusion there was a transient term and a constant term representing ArATP, and at the onset of reperfusion there were different transient and constant terms for ArATP. The first constant term lasted from the mean time of the first transient until the mean time of the second transient. The second constant term lasted from the mean time of the second transient until the end of the simulation. The transient terms of ArATP were represented by lagged normal density func- tions as a convenient way to generate smooth unimodal transient functions with a general waveform (25). The param-
Convection. To model the effects of vascular flow in an approximate fashion, the model described the clearance of solutes in the extracellular region by the experimentally determined flow rate (F, ml* min-l *g-l ), exemplified by Eq. A7 for adenosine
convective clearance = F[Ado~],,,,,,,~~ (A7)
Differential equations. The differential equations for the cellular region are as follows
V d[PW,,~~
cell l dt = -net CK flux (Ato
V d[Cr3,ell
cell •~ = net CK flux - Cr transport dt
(AS

OPEN-SYSTEM MYOCARDIAL PHOSPHOENERGETICS H2575
eters of lagged normal functions are the mean time, area, relative dispersion, and skewness. To fit the model to the NMR data, the eight parameters of two lagged normal functions and the two constant terms of ArATP and the K, of the 5’-nucleotidase reaction were simultaneously optimized using an automated least-squares routine (SIMPLEX).
Model Parameter Values
The parameter values used in the model analysis are listed in Table 2.
The authors are grateful to Martin Kushmerick for critical guid- ance in the analysis of the NMR data and for helpful suggestions for dealing with the problems of phosphoenergetics. The authors thank Rodney Gronka for invaluable expertise in designing and construct- ing the experimental setup and assistance in conducting the NMR experiments. The authors appreciate the skill of Paul Johnson in performing the biochemical measurements of high-energy phosphate compounds.
Address for reprint requests: K. Kroll, Center for Bioengineering, Box 357962, University of Washington, Seattle, WA 981957962.
Received 9 September 1996; accepted in final form 31 December 1996.
REFERENCES
1.
2.
3.
4.
5.
6.
7.
8.
9.
10.
11.
12.
13.
14.
Allen, D. G., and C. H. Orchard. Myocardial contractile function during ischemia and hypoxia. Circ. Res. 60: 153-168, 1987. Arai, A. E., S. E. Grauer, C. G. Anselone, G. A. Pantely, and J. D. Bristow. Metabolic adaptation to a gradual reduction in myocardial blood flow. CircuZation 92: 244-252,1995. Arai, A. E., G. A. Pantely, C. G. Anselone, J. Bristow, and J. D. Bristow. Active downregulation of myocardial energy requirements during prolonged moderate ischemia in swine. Circ. Res. 69: 1458-1469, 1991. Bak, M. I., and J. S. Ingwall. Acidosis during ischemia pro- motes adenosine triphosphate resynthesis in postischemic rat heart: in vivo regulation of 5’-nucleotidase. J. CZin. Inuest. 93: 40-49,1994. Brand, M. D., M. E. Harper, and H. C. Taylor. Control of the effective P/O ratio of oxidative phosphorylation in liver mitochon- dria and hepatocytes. Biochem. J. 291: 739-748,1993. Btinger, R. Compartmented pyruvate in perfused working heart. Am. J. Physiol. 249 (Heart Circ. Physiol. 18): H439-H449, 1985. Btinger, R., and S. Soboll. Cytosolic adenylates and adenosine release in perfused working heart: comparison of whole tissue with cytosolic non-aqueous fractionation analyses. Eur. J. Bio- them. 159: 203-213,1986. Chen, W., C. Steenbergen, L. A. Levy, J. Vance, R. E. London, and E. Murphy. Measurement of free Ca2+ in sarco- plasmic reticulum in perfused rabbit heart loaded with 1,2-bis(2- amino-5,6-difluorophenoxy) ethane-N,N,N’,N-tetraacetic acid by lgF NMR. J. BioZ. Chem. 271: 7398-7403,1996. Connett, R. J. Analysis of metabolic control: new insights using scaled creatine kinase model. Am. J. Physiol. 254 (ReguZatory Integrative Comp. Physiol. 23): R949-R959,1988. Darvish, A., and P. J. Metting. Purification and regulation of an AMP-specific cytosolic 5’-nucleotidase from dog heart. Am. J. Physiol. 264 (Heart Circ. Physiol. 33): H1528-H1534, 1993. Decking, U. K. M., G. Schlieper, K. Kroll, and J. Schrader. Inhibition of myocardial adenosine kinase due to hypoxia potenti- ates adenosine release (Abstract). FASEB J. 10: A327,1996. Deussen, A., H. G. E. Lloyd, and J. Schrader. Contribution of S-adenosylhomocysteine to cardiac adenosine formation. J. MOL. Cell. Cardiol. 21: 773-782, 1989. Gao, 2. P., H. F. Downey, W. L. Fan, and R. T. Mallet. Does interstitial adenosine mediate acute hibernation of guinea pig myocardium? Cardiovasc. Res. 29: 796-804,1995. Garlick, P. B., and R. M. Townsend. NMR visibility of Pi in perfused rat hearts is affected by changes in substrate and contractility. Am. J. Physiol. 263 (Heart Circ. PhysioZ. 32): H497-H502,1992.
15.
16.
17.
18.
19.
20.
21.
22.
23.
24.
25.
26.
27.
28.
29.
30.
31.
32.
33.
Golding, E. M., W. E. Teague, Jr., and G. P. Dobson. Adjustment ofK’ to varying pH and pMg for the creatine kinase, adenylate kinase and ATP hydrolysis equilibria permitting quan- titative bioenergetic assessment. J. Exp. BioZ. 198: 1775-1782, 1995. Gorman, M. W., M. X. He, C. S. Hall, and H. V Sparks. Inorganic phosphate as a regulator of adenosine formation in the isolated guinea pig heart. Am. J. PhysioZ. 272 (Heart Circ. Physiol. 41): H913-H920,1997. Gupta, R. K., and R. D. Moore. 31P NMR studies of intracellu- lar free Mg2+ in intact frog skeletal muscle. J. BioZ. Chem. 255: 3987-3993,198O. He, M. X., M. W. Gorman, G. D. Romig, R.A. Meyer, and H. V Sparks, Jr. Adenosine formation and energy status during hypoperfusion and 2-deoxyglucose infusion. Am. J. PhysioZ. 260 (Heart Circ. PhysioZ. 29): H917-H926,1991. Headrick, J. P., C. S. Emerson, S. S. Berr, R. M. Berne, and G. P. Matherne. Interstitial adenosine and cellular metabolism during beta-adrenergic stimulation of the in situ rabbit heart. Cardiovasc. Res. 31: 699-710, 1996. Headrick, J. P., G. P. Matherne, S. S. Berr, D. C. Han, and R. M. Berne. Metabolic correlates of adenosine formation in stimulated guinea pig heart. Am. J. Physiol. 260 (Heart Circ. Physiol. 29): Hl65-H172,1991. Heineman, F. W., J. Eng, B. A. Berkowitz, and R. S. Bala- ban. NMR spectral analysis of kinetic data using natural lineshapes. Magn. Reson. Med. 13: 490-497,199O. Jennings, R. B., H. K. Hawkins, J. E. Lowe, M. L. Hill, S. Klotman, and K. A. Reimer. Relation between high energy phosphate and lethal injury in myocardial ischemia in the dog. Am. J. Pathol. 92: 187-214,1978. Kammermeier, H. High energy phosphate of the myocardium: concentration versus free energy change. Basic Res. CardioZ. 82, Suppl. 2: 31-36,1987. Kentish, J. C., H. E. ter-Keurs, L. Ricciardi, J. J. BUCX, and M. I. Noble. Comparison between the sarcomere length-force relations of intact and skinned trabeculae from rat right ven- tricle. Influence of calcium concentrations on these relations. Circ. Res. 58: 755-768,1986. King, R. B.,A. Deussen, G. R. Raymond, and J. B. Bassingth- waighte. A vascular transport operator. Am. J. Physiol. 265 (Heart Circ. Physiol. 34): H2196-H2208,1993. Kirkels, J. H., C. J. A. Van Echteld, and T. J. C. Ruigrok. Intracellular magnesium during myocardial ischemia and reper- fusion: possible consequences for postischemic recovery. J. MOL. CeZZ. CardioZ. 21: 1209-1218,1989. Kitakaze, M., M. Hori, S. Takashima, H. Sato, M. Inoue, and T. Kamada. Ischemic preconditioning increases adenosine re- lease and 5’-nucleotidase activity during myocardial ischemia and reperfusion in dogs. Implications for myocardial salvage. CircuZation 87: 208-215,1993. Kost, G. J. pH standardization for phosphorus-31 magnetic resonance heart spectroscopy at different temperatures. Magn. Reson. Med. 14: 496-506,199O. Kroll, K., T. R. Bukowski, L. M. Schwartz, D. Knoepfler, and J. B. Bassingthwaighte. Capillary endothelial transport of uric acid in the guinea pig heart. Am. J. PhysioZ. 262 (Heart Circ. PhysioZ. 31): H420-H431,1992. Kroll, K., U. Decking, K. Dreikorn, and J. Schrader. Rapid turnover of the AMP-adenosine metabolic cycle in the guinea pig heart. Circ. Res. 73: 846-856,1993. Kroll, K., and G. V Martin. Steady state catecholamine stimulation does not increase cytosolic adenosine in canine heart. Am. J. Physiol. 266 (Heart Circ. PhysioZ. 35): H503-H510, 1994. Mallet, R. T., Y. H. Kang, N. Mukohara, and R. Btinger. Use of cytosolic metabolite patterns to estimate free magnesium in normoxic myocardium. Biochim. Biophys. Acta 1139: 239-247, 1992. Matherne, G. P., J. P. Headrick, S. Berr, and R. M. Berne. Metabolic and functional responses of immature and mature rabbit hearts to hypoperfusion, ischemia, and reperfusion. Am. J. Physiol. 264 (Heart Circ. PhysioZ. 33): H2141-H2153, 1993.

H2576 OPEN-SYSTEM MYOCARDIAL PHOSPHOENERGETICS
34.
35.
36.
37.
38.
39.
40.
41.
Neill, W. A., and J. S. Ingwall. Stabilization of a derangement 42. in adenosine triphosphate metabolism during sustained, partial ischemia in the dog heart. J. Am. Coil. Cardiol. 8: 894-900,1986. Neubauer, S., B. L. Hamman, S. B. Perry, J. A. Bittl, and 43. J. S. Ingwall. Velocity of the creatine kinase reaction decreases in postischemic myocardium: a 31P-NMR magnetization transfer study of the isolated ferret heart. Circ. Res. 63: l-151988. Noda, L. Adenosine triphosphate-adenosine monophosphate 44 transphosphorylase. III. Kinetic studies. J. BioZ. Chem. 232: * 237-250,1958. Pantely, G. A., S. A. Malone, W. S. Rhen, C. G. Anselone, A. Arai, J. Bristow, and J. D. Bristow. Regeneration of myocar- 45. dial phosphocreatine in pigs despite continued moderate isch- emia. Circ. Res. 67: 1481-1493,199O. Rahimtoola, S. H. A perspective on the three large multicenter 46. randomized clinical trials of coronary bypass surgery for chronic stable angina. Circulation 72: V123-V135,1985. Schaefer, S., L. J. Carr, J. Kreutzer, and T. Jue. Myocardial adaptation during acute hibernation: mechanisms of phosphocre- atine recovery. Cardiouasc. Res. 27: 2044-2051,1993. Schaefer, S., E. Prussel, and L. J. Carr. Requirement of 47.
glycolytic substrate for metabolic recovery during moderate low flow ischemia. J. Mol. Cell. Cardiol. 27: 2167-2176, 1995. Schaefer, S., G. G. Schwartz, J. A. Wisneski, S. D. TTocha, I. 4% Christoph, S. K. Steinman, J. Garcia, B. M. Massie, and M. W. Weiner. Response of high-energy phosphates and lactate release during prolonged regional ischemia in vivo. CircuZation 85: 342-349,1992.
Schimerlik, M. L., and W. W. Cleland. Inhibition of creatine kinase by chromium nucleotides. J. BioZ. Chem. 248: 8418-8423, 1973. Schulz, R., J. Rose, C. Martin, 0. E. Brodde, and G. Heusch. Development of short-term myocardial hibernation: its limita- tion by the severity of ischemia and inotropic stimulation. Circulation 88: 684-695, 1993. Veech, R. L., J. W. R. Lawson, N. W. Cornell, and H. A. Krebs. Cytosolic phosphorylation potential. J. BioZ. Chem. 254: 6538-6547,1979. Wang, T., 2. T. Tan, and W. R. Webb. Postnatal changes in enzyme activities of rat myocardial adenine nucleotide catabolic pathway. Life Sci. 40: 239-244,1987. Wangler, R D., M. W. Gorman, C. Y. Wang, D. F. Dewitt, I. S. Chan, J. B. Bassingthwaighte, and H. V. Sparks. Transcapil- lary adenosine transport and interstitial adenosine concentra- tion in guinea pig hearts. Am. J. Physiol. 257 (Heart Circ. Physiol. 26): H89-H106, 1989. Xiang, J. Z., and J. C. Kentish. Effects of inorganic phosphate and ADP on calcium handling by the sarcoplasmic reticulum in rat skinned cardiac muscles. Cardiouasc. Res. 29: 391-400,1995. Zhang, J., G. Path, V. Chepuri, Y. Xu, M. Yoshiyama, R. J. Bathe, A. H. From, and K. Ugurbil. Responses of myocardial high energy phosphates and wall thickening to prolonged re- gional hypoperfusion induced by subtotal coronary stenosis. Magn. Reson. Med. 30: 28-37,1993.


![CHEM344 HW#4 · [23.1] The following results were obtained for the action of an ATPase on ATP at 20°C, when the concentration of the ATPase was 20 nmol dm−3: [ATP]/(μmol dm−3)](https://static.fdocuments.net/doc/165x107/60b31e1cc1661e6b9e4b61ec/chem344-hw4-231-the-following-results-were-obtained-for-the-action-of-an-atpase.jpg)