Open questions in the magnetic behaviour of high-temperature ...
92
Rep. Prog. Phys. 60 (1997) 1581–1672. Printed in the UK PII: S0034-4885(97)41466-5 Open questions in the magnetic behaviour of high-temperature superconductors L F Cohen† and Henrik Jeldtoft Jensen‡ † Blackett Laboratory, Imperial College, Prince Consort Road, London SW7 2BZ, UK ‡ Department of Mathematics, Imperial College, 180 Queen’s Gate, London SW7 2BZ, UK Received 10 March 1997 Abstract A principally experimental review of vortex behaviour in high-temperature superconductors is presented. The reader is first introduced to the basic concepts needed to understand the magnetic properties of type II superconductors. The concepts of vortex melting, the vortex glass, vortex creep, etc are also discussed briefly. The bulk part of the review relates the theoretical predictions proposed for the vortex system in high temperature superconductors to experimental findings. The review ends with an attempt to direct the reader to those areas which still require further clarification. 0034-4885/97/121581+92$59.50 c 1997 IOP Publishing Ltd 1581
Transcript of Open questions in the magnetic behaviour of high-temperature ...

Rep. Prog. Phys.60 (1997) 1581–1672. Printed in the UK PII: S0034-4885(97)41466-5
Open questions in the magnetic behaviour ofhigh-temperature superconductors
L F Cohen† and Henrik Jeldtoft Jensen‡† Blackett Laboratory, Imperial College, Prince Consort Road, London SW7 2BZ, UK‡ Department of Mathematics, Imperial College, 180 Queen’s Gate, London SW7 2BZ, UK
Received 10 March 1997
Abstract
A principally experimental review of vortex behaviour in high-temperature superconductorsis presented. The reader is first introduced to the basic concepts needed to understand themagnetic properties of type II superconductors. The concepts of vortex melting, the vortexglass, vortex creep, etc are also discussed briefly. The bulk part of the review relates thetheoretical predictions proposed for the vortex system in high temperature superconductorsto experimental findings. The review ends with an attempt to direct the reader to thoseareas which still require further clarification.
0034-4885/97/121581+92$59.50c© 1997 IOP Publishing Ltd 1581

1582 L F Cohen and H J Jensen
Contents
Page1. Introduction 15832. The vortex system and its behaviour 1584
2.1. Type I and type II superconductors 15842.2. Isotropic ideal type II superconductors 15842.3. Hc1 andHc2 15852.4. Disturbances of the ideal hexagonal flux-line lattice 15862.5. Fluctuations in the order parameter 15932.6. Anisotropy 15942.7. Thermal equilibrium and non-equilibrium properties 15942.8. Symmetry of the order parameter 1596
3. Interpreting vortex behaviour 15963.1. Transport and magnetization measurements 15963.2. TransportE–J curves 15983.3. Flux creep 15993.4. Magnetic measurement analysis 16023.5. Critical scaling applied toE–J curves 1603
4. Experimental observation of vortex behaviour 16044.1. Reversible properties 16044.2. The irreversibility line 16084.3. In the vicinity ofH irr 16184.4. The order of the melting transition 16304.5. Below the irreversibility line—the vortex solid 1649
5. Summary of the questions at the brink of resolution 1663Acknowledgments 1665References 1665

Magnetic behaviour of superconductors 1583
1. Introduction
The justification for a predominantly experimental review of the magnetic behaviour in high-temperature superconductor (HTS) materials is simply the recognition that an introductorytext, as this sets out to be, may yet help shed light on the behaviour of vortices in the presenceof disorder. Furthermore, if we are to utilize HTS materials in the form of magnets, powercables or high-frequency filters, summarizing our understanding of the pinning properties ofvortices and the form of the HT diagram in equilibrium or otherwise—is still of paramountimportance.
Several excellent reviews have recently appeared (Farrell 1994, 1995, Fischer 1993,1994, Blatter et al 1994b, Brandt 1995) and inevitably there will be some overlap.Interpretation of the experimental evidence will probably not stand the test of time inthe same way as a theoretical review because as new data appears it sheds light on all thathas gone before. Nevertheless, we feel it is important to brave the unknown, take a snapshot in time, examine the current position critically and ask whether various types of novelbehaviour which have been predicted have indeed been observed.
Our task is made more difficult because observed vortex behaviour is linked tounderlying static disorder and the general classification of material purity and quality isstill incomplete. In an attempt to simplify matters we have restricted the discussion tosingle crystals and, where necessary, to thin films. We limit the discussion further toYBCO 123 and BSCCO 2212 to illustrate the range of properties in systems with verydifferent anisotropy.
In reality the magnetic properties of HTS is a labyrinth. One can easily get lostand confused. The sirens’ song sounds seductively in the form of wonderful sparklingtheoretical inventions: Bose glass, vortex glass, quantum creep, melting, entanglement,disentanglement, pancakes, dimensional crossovers, plastic flow. The list goes on and on.Only a strong and clearly directed guide will enable one to make it through the maze. Evenmore so if one not only wants to survive the expedition, but in fact has the ambition torefresh one’s mind and gain overview and understanding from the quest.
In section 2 we develop the basic notions used to describe magnetic properties ofsuperconductors. We then introduce various concepts used to describe HTS behaviourwhich are novel at least to superconductivity, and highlight those ideas which are simply anextension of concepts discussed previously. We discuss similarities and differences betweenconventional and HTS. The main difference between the new and old superconductors is therelevance of thermal fluctuations and strong anisotropy.We have tried to address in generalterms the connection between the new theoretical developments and quantities measuredin experiments. We pay special attention to the importance of distinguishing betweenthermodynamic equilibrium quantities and non-equilibrium experiments.
In section 3 we review some concepts related to the interpretation of experimental datawhich we feel would otherwise weigh down the discussion in the next section. We placesignificant emphasis on the understanding of transport and magnetization measurements asthese provide the bulk of experimental evidence.
In section 4 we really start our expedition into the wilderness. For consistency sake wehave tried to divide the enormous body of experimental information into broad headingswhich reflect the novel phase diagrams which have been proposed for HTS materials. We
1584 L F Cohen and H J Jensen
review evidence for the behaviour of Hc1, Hc2, the form and meaning of the irreversibilityline, the melting line and glassy behaviour. We discuss the different regions of behaviourin the field (H ) and temperature (T ) plane emerging from transport and magnetization data,in order to explore whether different experimental angles of approach lead to a consistentpicture. The phenomenology derived from this exploration is brought into contact withvarious the theoretical pictures introduced in section 2.
In section 5 we summarize the open questions which remain.
2. The vortex system and its behaviour
In this section we will run through the basic concepts of how a magnetic field behavesinside a superconductor. Details are elaborated in many books on superconductivity. Twoexcellent classics are Tinkham (1995) and de Gennes (1966). We will also expand on theseideas in very general terms to include the novel aspects of HTS in magnetic fields. A furtherreference which gives a good idea of the complexity of the problem is the extensive reviewby Blatteret al (1994b).
2.1. Type I and type II superconductors
Superconductors exist in one of two types. In the first kind an external magnetic field cannotpenetrate into the bulk of the sample without destroying the superconducting condensate.We are not going to deal more with this kind. The second kind of superconductors, ofwhich HTS are prominent members, are able to remain superconducting over a range offieldsH in the intervalHc1 < H < Hc2. At the lower critical fieldHc1 the first magneticflux starts to enter the bulk of the superconductor. The field does not penetrate the bulk in ahomogenous way. Had this been the case, the magnetic properties of type II superconductorswould have been much simpler. The mixed state which exists for fields betweenHc1 andHc2 is spatially inhomogeneous. Both the local magnetic induction and the local density ofsuperconducting electrons are position dependent. The magnetic field penetrates the bulkof the superconductor in the form of quantized flux tubes or magnetic vortices.
2.2. Isotropic ideal type II superconductors
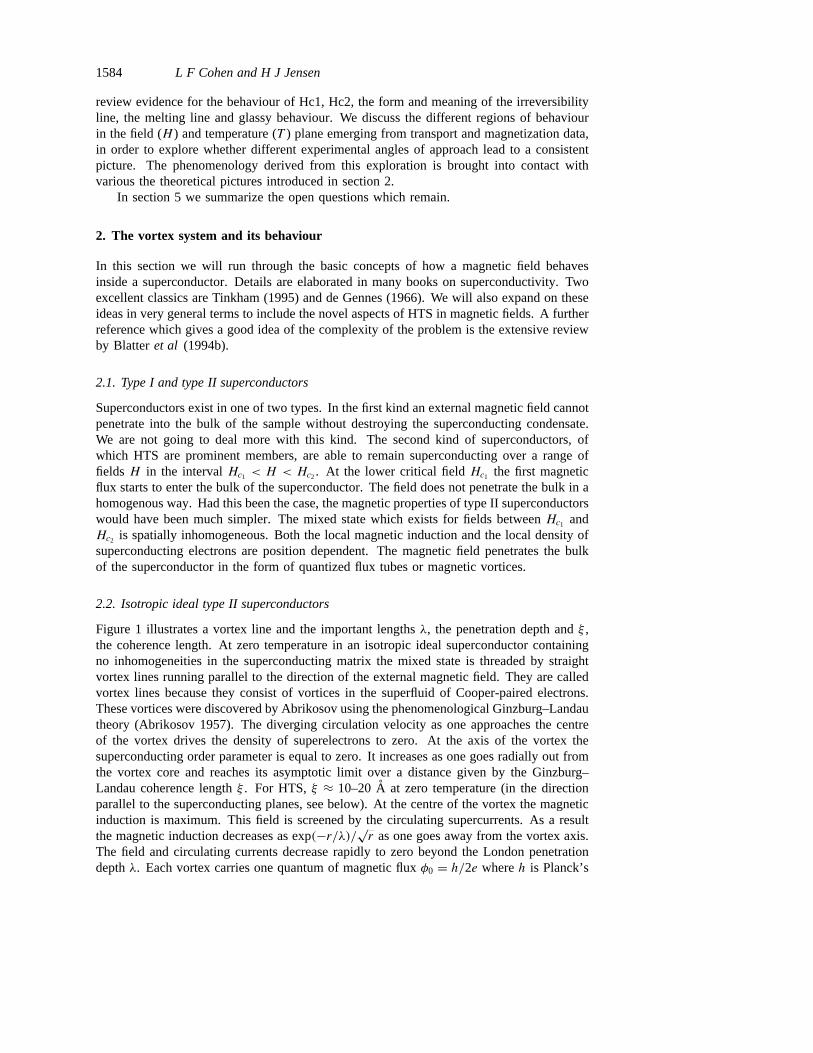
Figure 1 illustrates a vortex line and the important lengthsλ, the penetration depth andξ ,the coherence length. At zero temperature in an isotropic ideal superconductor containingno inhomogeneities in the superconducting matrix the mixed state is threaded by straightvortex lines running parallel to the direction of the external magnetic field. They are calledvortex lines because they consist of vortices in the superfluid of Cooper-paired electrons.These vortices were discovered by Abrikosov using the phenomenological Ginzburg–Landautheory (Abrikosov 1957). The diverging circulation velocity as one approaches the centreof the vortex drives the density of superelectrons to zero. At the axis of the vortex thesuperconducting order parameter is equal to zero. It increases as one goes radially out fromthe vortex core and reaches its asymptotic limit over a distance given by the Ginzburg–Landau coherence lengthξ . For HTS,ξ ≈ 10–20A at zero temperature (in the directionparallel to the superconducting planes, see below). At the centre of the vortex the magneticinduction is maximum. This field is screened by the circulating supercurrents. As a resultthe magnetic induction decreases as exp(−r/λ)/√r as one goes away from the vortex axis.The field and circulating currents decrease rapidly to zero beyond the London penetrationdepthλ. Each vortex carries one quantum of magnetic fluxφ0 = h/2e whereh is Planck’s

Magnetic behaviour of superconductors 1585
Figure 1. An illustration of a vortex line and the important lengths,λ the penetration depth andξ the coherence length.
constant ande is the elementary charge. Therefore the number of flux lines inside thesample is approximately proportional to the external field. For HTS,λ ≈ 1500 A at zerotemperature. The circulating supercurrents (or equivalently the magnetic induction) giverise to an interaction between the flux lines, extending out to a distance of orderλ. Thedepletion of the order parameter at the vortex axis also leads to a short-range attractionbetween vortices. The long-range magnetic interaction is repulsive for straight parallelvortex lines and attractive for antiparallel lines. Due to this interaction the minimum energyconfiguration for a flux-line system in an ideal isotropic superconductor consists of parallelvortex lines arranged in an hexagonal lattice in the plane perpendicular to the field direction.
2.3.Hc1 andHc2
The transitions atHc1 andHc2 can be thought of as follows. At the lower critical field the(Gibb’s) free energy of the state without a flux line is equal to the state with one flux line(or many non-interacting flux lines). It uses energy to keep the field out of the bulk ofthe superconductor. As soon as the field becomes a tiny bit larger thanHc1 flux lines willflow into the bulk. As long as they do not interact, the free energy is independent of thenumber of flux lines within the bulk. Hence, the flux lines will rush in unhindered untilthey start to have an average separation of orderλ. Accordingly the magnetic field atHc1
will approximately be one flux quantum within the area of a circle of radiusλ. The preciseexpression ofHc1 is Hc1 = φ0 ln(λ/ξ)/(4πλ2). As the external field is gradually increased,the flux lines are squashed together. Eventually their cores, in which the superconductingorder parameter is equal to zero, will begin to overlap and the whole bulk becomes normal.This is what happens atHc2, at least at the simplest mean-field Ginzburg–Landau level ofdescription. We expect the value ofHc2 to be given by one flux quantum through an area ofthe size of the core. This simple picture becomes more complicated as the effect of thermalfluctuations is included. Fluctuations always become important close to the temperaturewhere the system undergoes a (continuous) phase transition. The width of the fluctuationregime depends on the ‘stiffness’ of the order parameter close toTc(H). Mean-field theoryis applicable as long as the length scale of spatial variations is longer than or equal to thecoherence lengthξ of the mean-field theory. When the thermal energykBT becomes ofthe order of the free energy within a correlated volumeξ3f , wheref is the free-energydensity, fluctuations make the mean-field theory inappropriate. Sinceξ ∼ (Tc − T )−1/2 and

1586 L F Cohen and H J Jensen
f ∼ (Tc−T )2 close toTc, in mean-field theoryξ3f/kBT ≈ 1 asTc is approached (Landauand Lifshitz 1969). Precisely how close toTc fluctuations become important depends onthe size ofξ andTc.
For conventional low-temperature superconductorsξ is large andTc is small. Thetransition in these superconductors is therefore described well by mean-field Ginzburg–Landau theory except for an unresolvably narrow region of width about 10−4 K aroundTc. In the HTS the situation is reversed. The coherence length is short and the transitiontemperature is high. Thermal fluctuations are accordingly much more important over abroad regime around theHc2(T ) line. In conventional superconductors the experimentallyobserved transition from a resistive phase forT > Tc(H) to a phase with zero resistivitybelow Tc(H) occurs very sharply as the temperature is lowered through the mean-field transition temperatureTc(H). In HTS the resistivity only vanishes slowly while asuperconducting state gradually builds up. The true superconducting phase transition takesplace at a temperature significantly lower than the mean-field value forTc(H). Below weshall return to the question: What replaces the mean-fieldHc2(T ) line?
The very nature of theHc2(T ) line is unclear when one goes beyond mean-fieldconsiderations. It is not even known if fluctuations change the nature of the transition from acontinuous transition (as in mean field) to a first-order transition. Some calculations suggestthat the transition in the pure system is first order and that disorder replaces the transitionby a gradual crossover from the vortex liquid to a vortex solid (Moore and Newman 1995).Also the nature of the mixed state in the neighbourhood of theHc2(T ) is much more subtlethan hitherto anticipated. This is also true for conventional superconductors. However,for the low-temperature superconductors these questions are mainly of non-observationalacademic interest. In HTS this subtle neighbourhood is much broader and of greater practicalimportance.
2.4. Disturbances of the ideal hexagonal flux-line lattice
Let us again return to the simple mean-field Ginzburg–Landau description ofsuperconductivity. We need to consider the extent to which the ideal hexagonal line latticecan be disturbed by defects and thermal fluctuations.
2.4.1. Defects. Inhomogeneities in the superconducting material can lead to a localsuppression of the superconducting order parameter. An example is a void or a hole inthe superconductor. This will lead to an interaction between the vortex core and void. Inorder to minimize the suppression of the order parameter it will be beneficial to locatethe vortex core on top of the void, thereby only depleting the order parameter once. Thismechanism leads to core pinning. The void attracts the vortex line, hence it tends to trapor pin the line. The spatial variation in the flow pattern of the supercurrents can also leadto pinning, especially to surface pinning. Core pinning is in general the most importantbulk pinning mechanism. A random arrangement of material inhomogeneities will lead toa random potential and random forces acting on the vortex lines. This will disturb thepositional order of the flux lattice.
The interaction between the inhomogeneities in the superconducting matrix and the fluxlines is of crucial importance for the ability of the superconductor to support a dissipationfree electric current when penetrated by vortices. The reason is as follows. As an electriccurrent is passed through the superconductor the Lorentz force will act between electronsand the (localized) magnetic field carried by the flux lines. In this absence of pinningthis force will move the flux lines with the result that a time-dependent local magnetic

Magnetic behaviour of superconductors 1587
Figure 2. An illustration of the defect structure and the soft and stiff vortex lattice ‘trying’ totake advantage of the defects.
induction is established. As a result, an electric field is induced which then acts on theelectrons thereby leading to a voltage and corresponding dissipation. The details of thisscenario are controlled by the Josephson relation (Josephson 1965, Tinkham 1995). Theonly way dissipation can be avoided when a magnetic field threads the superconductor is bypreventing the flux lines from moving. Since inhomogeneities attract the flux lines they areable to prevent this motion up to a certain pinning forceFp. The degree to which the fluxlines are pinned determines the maximum Lorentz force one can apply without dissipation.The Lorentz force (per volume) is given byBj , whereB is the magnetic induction locallyaveraged over the flux lines andj is the current density. The maximum dissipation freecurrent—called the critical current—is given byjc = Fp/B. It is important to keep in mindthat even if one could make the pinning centres infinitely strong there would still be anupper bound for the dissipation free current. Dissipation will then occur when the Cooperpairs start to break up due to the induced current. This happens at the depairing currentwhere the kinetic energy of the Cooper pairs equals to the superconducting condensationenergy which binds the electrons together in Cooper pairs (see Tinkham 1995). However,in a magnetic field the depinning critical current is always found to be smaller than thedepairing current.
The efficiency of the pinning centres depends indirectly on the strength of the vortex-vortex interaction. A very stiff vortex system will not be able to adjust to the random pinningpotential and can therefore not relax deeply into the pinning potential. A soft vortex systemon the other hand will be able to adjust itself to the random pinning forces and thereby sinkdeep down into the pinning potential. This leads to a more strongly pinned configurationthan in the case of a stiff vortex system. Figure 2 illustrates point defect structure and softand stiff vortex lattices attempting to fit to it.
The interaction between flux lines can, as a good approximation, be described by atwo-body potential between flux-line elements. For an isotropic interaction, the interactionenergy between two flux-line segments dl1 and dl2 separated by the distancer12 is givenby the sum of two exponentially screened Coulomb-like contributions
Um + Uc = dl1 · dl2e−r12/λ′ − |dl1||dl2|e−r12/ξ
′. (2.1)
The first term has its origin in the magnetic field carried by the flux lines. This interaction
1588 L F Cohen and H J Jensen
is screened beyond an effective field-dependent magnetic penetration depthλ′ = λ/√1− b.Where b = B/Bc2 is the ratio between the actual inductionB and the inductionBc2
corresponding at the upper cirtical fieldHc2. The second term describes an attraction betweenthe core of the flux lines and is very short rangedξ ′ = ξ/
√2(1− b). The interaction
between flux-line elements in anisotropic superconductors is of the same nature althoughin more complicated detail due to the dependence of the interaction on the orientation ofr12 with respect to the symmetry axis of the material. An excellent discussion of theseimportant details is given by Brandt (1995) in his recent review.
The interaction between the flux lines is responsible for the elastic rigidity of the fluxlattice. The elastic properties are described by a shear C66 modulus, a tilt modulus C44, and acompression modulus C11. These moduli have been calculated for isotropic superconductorsas well as for anisotropic superconductors, see again Brandt (1995). Here we list theexpressions of elastic moduli. An essential point to bear in mind is that these moduli arefield dependent such that C11 ∼ C44 ∼ b2 and C66 ∼ b(1− b)2, whereb = B/Bc2. Theshear modulus vanishes at the upper critical field giving rise to a softening of the flux latticeand thereby a more effective pinning close toHc2. The increase in the pinning force close toHc2 is known as the peak effect (Pippard 1969). Another important point is that the tilt andcompression moduli depends strongly on the wavelength of the imposed elastic deformation.A short wavelength tilt deformation uses significantly less energy than homogeneous tilt.This has to be taken into account when making quantitative estimates of the deformationsof the ideal flux lattice.
The interaction between a single pinning centre and a segment of a vortex line is difficultto calculate and depends on the nature of the pinning interaction. However, it is useful tobear in mind an estimate of the pinning energy obtained from the excluded volume effect.If the defect depresses the superconducting order parameter in a volume of sizeV (smallerthan the core volume) the energy gained by positioning the core of the vortex line on topof the defect will be of orderVH 2
c , since the superconducting condensation energy densityis given by the square ofHc = φ/2
√2πλξ . Close toHc2 the condensation energy vanishes
as (1 − b) (Thuneberg 1984). Since C66 vanishes as(1 − b)2 the pinning energy maydominate over the elastic energy in this field regime. This is the explanation of the peakeffect mentioned above and discussed in sections 4.3.2 and 4.5.1.
Pinning of the flux lines is not only induced by random disorder in the bulk. Any spatialinhomogeneity in the superconducting properties may make the free energy of a vortex linedepend on position. The energy of the supercurrents circulating the vortex line will varyclose to the sample surface. This effect leads to the Bean–Livingston surface barrier whicha flux line parallel to a plane surface has to surmount in order to enter into the bulk of thesample (see e.g. de Gennes 1966). Another barrier to flux entry relates to the shape of thesample and is denoted by a geometric barrier (see e.g. Zeldovet al 1994). The barrier isagain an energy barrier that the flux line will have to overcome in order to move betweenthe interior and exterior of the sample. The barrier is estimated from two contributions.One is the energy needed to create a flux line of the length of the sample thickness. Theother contibution is the energy extracted when the Lorentz force induced by the circulatingsupercurrents, perform work on the flux line while these currents attempt to move the fluxline towards the centre of the sample. If one chose an appropriate shape of the samplethis barrier can by made to vanish. See figure 16. For further discussion see sections 4.2.2and 4.5.1.
Finally we must mention that the layered structure of the cuperate HTS leads to asignificantintrinsic pinning. When the flux lines are arranged parallel to the superconductingcopper-oxide planes energy is gained when the normal core of the flux line is positioned
Magnetic behaviour of superconductors 1589
in the less strongly superconducting region in between the superconducting planes. Theflux lines have to overcome an essential energy barrier in order to move across thesuperconducting planes. This effect leads to dramatic peaks in the critical currents whenfield alignment is nearly parallel to the copper-oxide planes. See figure 17.
2.4.2. Thermal fluctuations. Melting of the flux lattice.As discussed in section 2.3, thermalfluctuations are much more important in HTS than in low-temperature superconductors.Thermal fluctuations can also perturb the flux-line configuration. Like in an ordinarycrystal lattice kept at a constant temperature, elastic forces in the vortex lattice will result indisplacements,u, of the vortex lines away from the ideal configuration to reach an averagedistance given by〈u2〉 ∝ T . The proportionality constant is determined by the elastic moduliof the flux lattice. If there is sufficient thermal energy available so thatu becomes of order10–30% of the average flux-line separation, one can expect that the flux-line lattice mightmelt (Nelson 1988). This is called the Lindemann melting criterionU = cLa0, herecL issomewhere around 0.1–0.3 anda0 denotes the average flux-line separation. The criterion isa phenomenological principle that is known to work for ordinary crystals. The limitationof this principle is that it does not explain what type of fluctuations in the lattice structure(dislocations, disclinations etc) actually causes the melting. One should of course find away to calculate the temperature at which the shear modulus describing homogeneous sheargoes to zero (the short wavelength shear modulus remains non-zero in the liqiud). This hasnot yet been done (for any three-dimensional system in fact). Nevertheless, the melting ofthe flux-line lattice is thought of as a melting in the traditional sense, namely as a softeningof the flux lattice leading to a phase unable to support any shear.
The curveTm(H) in the T –H phase diagram at which the flux lattice melts is calledthe melting line. In principle for fields very close toHc1 the flux system should always bea ‘liquid’ since the flux lines are separated more thanλ leading to a vanishing interactionbetween the vortices. In practice, flux lines enter the sample atHc1 very rapidly andthe region where the separation is larger than the interaction length is hardly accessible.However, very recently this ‘re-entrant’ melting effect has been observed experimentally(Ravikumar 1997) in the low-temperature superconductor Nb2Se.
The fact that the melted flux-line lattice has lost its rigidity (shear modulus equal to zero)has been used more or less intuitively to suggest that dissipation, i.e. flux flow, is more easyin the melted phase than in the solid phase. It does not need to be so. One should keep inmind the fact that the solid Abrikosov lattice will flow subject to the slightest applied drivingforce if no pinning potential is present to hinder the motion. Furthermore, the efficiency ofthe pinning potential is reduced by the stiffness of the flux system. In order to follow thepinning centres, the flux lattice has to distort. This uses elastic energy. Non-interacting fluxlines of infinite flexibility would be able to take full advantage of the pinning potential. Adecrease in the elastic moduli is a move towards this optimum situation. The peak in thepinning force observed close toHc2 in conventional superconductors was once connectedwith the softening of the elastic coefficients of the flux-line lattice with field (Pippard 1969,Larkin and Ovchinninkov 1979).
If the shear modulus of the flux lattice vanishes upon thermal melting the pinning centrescould act more efficiently leading to a reduced mobility of the flux lines and therefore areduceddissipation. This scenario assumes a density of pinning centres much higher thanthe flux-line density. If there are only a few very strong pinning centres the situation wouldbe reversed. The melted flux liquid will be able to flow in between the pinning centresleading to anincreaseddissipation above the melting temperature. In any case, one assumes

1590 L F Cohen and H J Jensen
that the energy scale of the pinning potential is larger than the available thermal energykBTmat the melting transition. Otherwise the pinning centres would already have become unableto trap the flux system at a lower temperature. In this case one would observe a depinningline (see section 2.4.3) rather than a melting line.
2.4.3. Irreversibility line. Real systems always contain pinning centres. This leads to yetanother energy scale. The properties of the flux system are determined by the relationshipbetween the thermal energyEth, the vortex–vortex energyEvv, and the pinning energyEpin.The competition between these three energy scales is complicated because the effectivepinning energy depends on the vortex–vortex interaction energy. Pinning centres becomemore effective if the interaction between vortices is small.
The competition betweenEth andEpin leads to the existence of theirreversibility linein the H–T plane. This line is determined as follows. For temperatures below this linethe pinning is strong enough to be able to trap flux lines as they are pushed in and out ofthe sample. If one sweeps the external field from zero up to a valueH > Hc1 and downagain to zero some flux lines will remain pinned inside the sample even after the externalfield has returned to zero. The magnetization of the sample behaves in an irreversibleway. Above the line the only contribution to the magnetization comes from the reversibleMeissner effect. The thermal energy now dominates the pinning energies so that the fluxis no longer trapped in metastable configurations. The irreversibility line is identified incurrent–voltage experiments as the line in theH–T plane that separates the region of fieldsand temperatures above the line where the voltage depends linearly on the applied currentfrom a region below the line of a nonlinear current–voltage characteristics. Figure 3 showsthe rough effective pinning potential acting on a flux bundle.Eth = kBT is the scale of thethermal fluctuation. Flux bundle at position A is easily thermally activated out of the localpotential well. The flux bundle at B is trapped.
In theory, there is no reason for a specific relationship to exist between the irreversibilityline and the melting line. The melting occurs whenEth ≈ Evv. Reversible behaviour isseparated from irreversible behaviour whenEth ≈ Epin. Depending on the accidental relationbetweenEpin andEvv (accidental sinceEpin depends on the properties of the defects of the
Figure 3. The rough effective pinning potential acting on a flux bundle.Eth = kBT is the scaleof the thermal fluctuation. The flux bundle at position A is easily thermally activated out of thelocal potential well. The flux bundle at B is trapped.
Magnetic behaviour of superconductors 1591
material, whereasEvv is an intrinsic flux lattice property) the melting line and irreversibilityline can be very close together, or melting can occur at a lower or higher temperaturethan where reversibility sets in. All three possibilities have been identified in experimentsalthough the different lines were originally assumed to be the same.
2.4.4. Vortex glass. The effect of the pinning potential (which results from the underlyingstatic disorder) is at the heart of the approach to the phases of the flux system that hasbecome known as the vortex glass scenario (Fisher 1989). The vortex glass approach triesto incorporate the pinning potential from the beginning. This is in contrast to the meltingtheory described above (see section 2.4.2). The melting theory focuses on the properties ofthe pure system. The effect of the pinning potential is then treated as a perturbation of thepure system.
The high-temperature phase of the vortex glass model is considered to be a liquid ofmobile flux lines moving unhindered over the pinning potential. The low-temperature phaseis an immobile amorphous phase. Because the pinning potential is supposed to disorder theflux system. The essence of the vortex glass picture is that collective effects are predicted tobe able to produce infinite energy barriers leading to a strictly zero linear flux-flow resistanceasJ approaches zero. Different workers have emphasized different aspects of the physicsof the vortex glass. Fisher (1989) introduced the term vortex glass. Fisher was especiallyconcerned with the transition between the high-and low-temperature phase. Fisher arguedthat the transition is atrue phase transition. Furthermore, Fisher assumed the transitionto be continuous and worked out a scaling theory for the voltage–current characteristics inthe vicinity of the transition (see section 3.5 below). Feigel’manet al (1989) formulated atheory of the voltage–current characteristics inside the low-temperature ‘glass’ phase. Theygeneralized the collective pinning approach developed by Larkin and Ovchinnikov (1979) todiscuss the collective behaviour of the flux system. Their model is known as the ‘collectivecreep’ theory. Fiegel’manet al (1989) calculated from elasticity theory the effective energybarriers set up by the competition between the elastic vortex–vortex interaction and thepinning potential. They considered how the flux bundles creep over these barriers and theyderived power laws for the logarithmic time dependence of the electric current inside thevortex glass regime. Experimental observation of the vortex system deep in the vortex solidis discussed in section 4.5.
Various viewpoints are advocated concerning the thermal stability of the vortex glass.One school (Nelson and Vinokur 1992, 1993) claimed that a thermodynamically stable glassis only possible if strong disorder is present in the form of columnar defects or twin planes.Randomly positioned point defects might induce distortions of the flux lattice but pointdefects will not be strong enough to establish a stable glass in the thermodynamic sense.The vortex glass idea was originally suggested in connection with point defects. It wassuggested (Fisheret al 1991) that point defects are able to produce the diverging barriersassociated with the vortex glass. Experimentally this question is delicate since the responseof a system with large but finite barriers might easily look like the response from a systemwith infinite barriers. The situation is similar to the one encountered in connection withordinary glasses. As one goes through the glass temperature the viscosity changes by 15orders of magnitude. However, so far no one has been able to show that this change isrelated to a genuine phase transition (see e.g. Nagel 1993).
The vortex glass is supposed to be a consequence of diverging energy barriers (Fisheret al 1991, Feigel’manet al 1989). That such a divergence may in principle exist is mostsimply seen from the following argument. The relaxation of the flux-line structure is always

1592 L F Cohen and H J Jensen
caused by a driving (Lorentz) force which is proportional to the local current densityj . Thiscurrent arises due to the existence of a gradient in the density of the flux lines. Accordingto the Maxwell relation∇ ×B = j , i.e. j goes to zero as the flux structure relaxes to ahomogeneous arrangement. Assume that the Lorentz force is able to move a flux bundle ofvolumeV . The total driving force on this volume,Fd, is proportional toVj . The drivingforce has to be able overcome the pinning force acting on this volume. The pinning force,Fp, is a sum ofV np (herenp is the density of pinning centres) individual pinning forcesacting in random directions. We estimate the sum of the pinning forces by measuring thevariance of the sum ofV np independent random numbers, i.e.Fp ∼
√V np (Larkin and
Ovchinnikov 1979). Precisely when the driving force is able to make the flux bundle insidethe volumeV move we haveFd = Fp and thereforeV ∼ 1/j2. Hence, asj → 0 the volumethat will have to move coherently increases. This makes the energy barrier produced by thepinning centres and the compressibility of the flux system (Feigel’manet al 1989) diverge.
It is always difficult to establish equilibrium in systems with large energy barriers. Thisis a well known theme in the field of spin glasses. This must be kept in mind when analysingexperiments. The properties observed below the irreversibility line, where the vortex glassis supposed to exist, are hysteretic (by definition) and their relation to genuine equilibriumproperties is complicated.
Another point to keep in mind is that the diverging energy barrier arises because it isassumed that the coherent motion of a larger and larger volume is necessary in order toinduce relaxation. This may not be so. Plastic deformations of the flux structure may beable to break the flux bundle volume up into smaller pieces which can be moved by afinite-energy input. The scenario is easy to visualize in two dimensions. Here the energyof a dislocation moving through the flux lattice is some finite energy given by the shearstrength of the system and expected to be proportional to the shear constant C66. (Fora three-dimensional flux system this energy will be proportional to the thickness of thesample.) When the barrier needed to move the increasing coherent volumeV becomeslarger than the dislocation barrier the volume will break up into sub-volumes separated byboundaries of sliding dislocations. The scenario is more subtle in three dimensions whereit is more difficult to visualize the nature of the plastic deformation that may cut up thecoherent volume. One possibility is that the flux lines cut through each other. In this casethe diverging energy barrier will be replaced by the energy scale of flux cutting.
At this point it is important to note that vortex glass scaling behaviour can only beobserved in a restricted regime. Namely, in the current regime where the volumeV (j) isincreasing with decreasing current densityj . However, when the energy barrier associatedwith this volume becomes larger than the plastic barrier the increase in the energy barrierwith decreasingj is cut off for currents below some current scalejplas. Lack of resolutionin experiments may make it difficult to probe the current scales belowjplas. One can thenbe misled into the false conclusion that the system exhibits a vortex glass transition. Asimilar difficulty is encountered in numerical simulations of weak pinning centres where itmay be difficult to reach system sizes larger than the volumeV (jplas) associated with theonset of plastic deformations.
2.4.5. Plastic flow. Plastic deformations are also of crucial importance at the depinningtransition. The effect is most clearly seen at zero temperature. Consider a pinned fluxsystem under application of a transport current, or driving forceFd = Bj . When thedriving force equals the volume pinning force, the flux structures start to break away fromthe pinning centres. The onset of motion can either take place as a coherent displacement

Magnetic behaviour of superconductors 1593
of the entire flux strucure or in the form of incoherent motion of parts of the flux arrayin between islands of pinned vortices. In the latter case plastic shearing of the flux latticeobviously occur. This scenario has long been observed in experiments (Wordenweberetal 1986, Wordenweber and Kes 1986, Bhattacharya and Higgins 1993, and Yaronet al1995), and was for instance considered theoretically by Kramer (1973). In principle plasticshearing willalwaysoccur if the flux system is large enough. This is clearly seen in finite-size scaling studies of computer simulations (Jensenet al 1988a) where rather picturesquechannel-flow patterns were observed.
The size dependence of the onset of plastic flow is most easily understood by a clearmean-field argument due to Coppersmith and Millis (1991). Consider the balance betweenthe forces acting on a volumeV = Ld . HereL is the linear dimension of thed-dimensionalvolume. There are three different types of forces acting on the volume. Namely, the appliedforce Fa induced by the applied current. Secondly, the pinning forceFp produced by thepinning centres within the volumeV . And finally, the vortex–vortex interaction forceFb
acting across the boundary of the volume between the vortex structure inside the volumeV and the rest of the vortex structure outside this volume. When the applied force is tunedprecisely to the threshold for depinning (i.e. the applied current equals the critical current)these three forces are exactly at balance with each otherFa = Fb+Fp. The boundary forceFb = Fd−Fp is needed to compensate the mismatch between the globally averaged pinningforce, which is the threshold forceFthr and the local pinning forceFp, which fluctuatesfrom one sub-volume to another. The deviation between the actual sum of the randompinning forces inside the volumeV and the global average will scale as the square root ofthe number of pinning centres contained in the volumeV , see section 2.4.4. Accordinglywe haveFb ∼ Ld/2. There areLd−1 bonds across the boundary of the volume. Thereforethe forcefb that each individual bond has to support will scale asfb ∼ L1−d/2, i.e. theload on the individual bonds increases with the size of the volume which is assumed toact coherently. Since a bond will only be able to support a stress up to a certain value,the coherent volume will break up into smaller pieces. Thus, the threshold for the onsetof plastic deformations is expected to scale like 1/
√L in one dimension. A logarithmic
size dependence is expected in two dimensions. This size scaling agrees qualitatively withsimulations in one and two dimensions (Jensenet al 1988a, Jensen 1995). In three andhigher dimensions the plastic onset of deformations will also occur. However, one has to gobeyond the simple average arguments presented here and consider rare events (Coppersmithand Millis 1991).
2.5. Fluctuations in the order parameter
In section 2.3 we mentioned that HTS are much more susceptible to thermal fluctuationsthan low-temperature superconductors. The specific nature of the fluctuations in the orderparameter is not yet completely clear.
One type of fluctuation is similar to the fluctuations known to occur in two dimensions.For very thin films (which can be modelled as two-dimensional systems) of conventionalsuperconductors it has been know for many years that the superconducting transition iscompletely controlled by thermal fluctuations (Minnhagen 1987). Since the sample is verythin, the thermal energy close toTc is able to create vortex excitations. So instead of inducingvortices by an external magnetic field vortex pairs can be thermally excited. Somewhat likethe appearance of bubbles in water just below the boiling temperature.
In three-dimensional samples vortex-loop excitations play the role of the two-dimensional vortex–antivortex excitations. In fact the temperature dependence of the

1594 L F Cohen and H J Jensen
resistivity nearTc led Minnhagen (Persicoet al 1996) to conclude that the transition (inzero-magnetic field) in bulk HTS may be controlled by unbinding vortex loops by cuttingthrough single superconducting planes.
The role of vortex-loop excitations in a non-zero magnetic field have been intensivelystudied by computer simulations (Chen and Tietel 1995, Caneiro 1995, Nguyenet al 1996)as well as analytically (Tesanovic 1995).
Even without identifying the nature of the fluctuations one can derive a relation forthe temperature dependence of the magnetic field at the phase transition. In zero field thesymmetry of the Ginzburg–Landau free energy is the same as the symmetry of the three-dimensionalXY model. The critical exponents of theXY model are well known. Thecorrelation length, for instance, diverges likeξ ∼ 1/|T − Tc|ν , whereν ≈ 0.66, whenTc isapproached. We can now attempt to deduce the shift in the transition temperature producedby an applied magnetic fieldB. The fieldB, the flux quantumφ0 and the correlation lengthξ , can be combined in adimensionlesscombination likeBξ2/φ0. From this we concludethat the field at which the transition occurs, must scale likeB ∼ ξ−2 ∼ |T − Tc|2ν . WhereTc is the transition temperature in the zero-magnetic field. It is not clear how large magneticfields can be applied before this scaling relation forB(T ) may break down. However, weshall see below (section 4.2.2) that a relationshipB(T ) ∼ |T − Tc|4/3 is in fact consistentwith several experiments.
2.6. Anisotropy
Most conventional superconductors are isotropic or only weakly anisotropic. The cupratesuperconductors are layered structures (perovskites) and therefore inherently anisotropic.The degree of anisotropy varies enormously for the different types of HTS. We willconcentrate on YBCO 123 as an example of the superconductors with the smallest anisotropyand we choose BSSCO 2212 as an example of the strongly anisotropic samples. Theanisotropy gives rise to new effects. First it makes the flux system more susceptible tofinite wavelengths tilt. More dramatically the anisotropy, which has its origin in the layerednature of the HTS materials, may lead to a dimensional crossover. This crossover can beviewed as a change from a situation where the flux system can be treated as consisting ofcontinuous flux lines to a situation where the layered structure of the materials manifestsitself more explicitly. Quantitatively, the crossover takes place when the superconductingcoherence length perpendicular to the layers,ξ⊥, becomes of the order of the distancebetween the layers (Klemmet al 1975).
The energy of the continuous flux lines depends on their orientation relative to thecrystal axis. This situation is described by a Ginzburg–Landau free energy in which thegradient term is anisotropic. As the effective anisotropy becomes stronger this descriptionis replaced by a free-energy functional describing a set of superconducting layers coupledtogether via Josephson coupling (Lawrence and Doniach 1971). The continuous flux linesare replaced by stacks of two-dimensional vortices confined to the superconducting layersbut coupled across the layers by to the Josephson effect (for a review see Fischer 1993,1994).
2.7. Thermal equilibrium and non-equilibrium properties
The properties of the magnetic flux system inside the superconductor must be divided intotwo categories: equilibrium and non-equilibrium properties. Furthermore, it is important todistinguish between static and dynamic properties.
Magnetic behaviour of superconductors 1595
Among the equilibrium properties one would first like to establish the phase diagramof the flux system as a function of field and temperature. The melting line in the idealsystem without any pinning potential, has attracted much attention (Nelson 1988). Thestructural character of the flux system, i.e. the order transverse to the field direction, and theorder along the field direction, in the different phases should be determined. The dynamicproperties of systems without pinning are simple. As soon as a current is passed through thematerial, the Lorentz force will make the flux system flow with a velocity proportional tothe current. This results in a current-independent flux-flow resistance (Bardeen and Stephen1965, Tinkham 1995). In the absence of pinning the melted flux system flows in the sameway as a flux lattice when a constant uniform Lorenz force is applied. Only if one appliesa Lorentz force that varies in space will the difference between the finite shear rigidity ofthe flux solid and the zero shear modulus of the liquid flux system show up in transportexperiments.
The presence of a pinning potential may dramatically change the situation. The pinningpotential disturbs the translational order of the flux-line lattice. Even weak pinning canmake it difficult to experimentally access the thermal equilibrium states. One signatureof this is the observed history dependence of the established flux structure. Recent high-precision neutron scattering experiment on the flux-line lattice in a clean niobium sampleby Gammelet al (1994) found that the best orientationally ordered flux-line lattice wasestablished by entering the superconducting state by slowly decreasing the magnetic fieldthroughHc2 rather than field cooling or zero-field cooling followed by an increase of themagnetic field (Mason 1991).
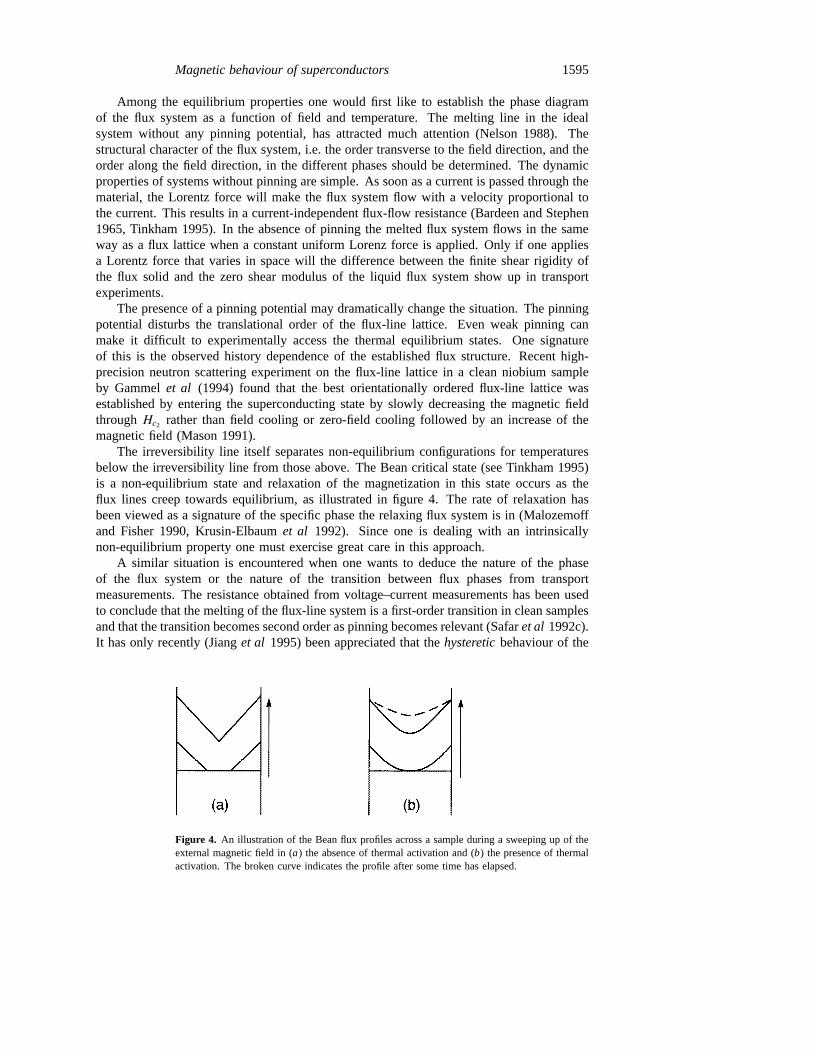
The irreversibility line itself separates non-equilibrium configurations for temperaturesbelow the irreversibility line from those above. The Bean critical state (see Tinkham 1995)is a non-equilibrium state and relaxation of the magnetization in this state occurs as theflux lines creep towards equilibrium, as illustrated in figure 4. The rate of relaxation hasbeen viewed as a signature of the specific phase the relaxing flux system is in (Malozemoffand Fisher 1990, Krusin-Elbaumet al 1992). Since one is dealing with an intrinsicallynon-equilibrium property one must exercise great care in this approach.
A similar situation is encountered when one wants to deduce the nature of the phaseof the flux system or the nature of the transition between flux phases from transportmeasurements. The resistance obtained from voltage–current measurements has been usedto conclude that the melting of the flux-line system is a first-order transition in clean samplesand that the transition becomes second order as pinning becomes relevant (Safaret al 1992c).It has only recently (Jianget al 1995) been appreciated that thehystereticbehaviour of the
Figure 4. An illustration of the Bean flux profiles across a sample during a sweeping up of theexternal magnetic field in (a) the absence of thermal activation and (b) the presence of thermalactivation. The broken curve indicates the profile after some time has elapsed.

1596 L F Cohen and H J Jensen
resitivity might be due to non-equilibrium effects rather than the assumed first-order natureof flux-line lattice melting.
The out-of-equilibrium driven flux-line lattice has properties of its own that cannotbe directly related to the phase of the non-driven equilibrium system. One example isthe tendency to ordering of the flux lattice subject to a driving force. As mentioned insection 2.4.5, the spatial fluctuations in the random pinning force can tear the flux latticeinto pieces when the applied current is close to the depinning current. As the current isincreased the flux lattice is ‘lifted out’ of the pinning potential. This reduces the effect ofthe pinning forces. The forces acting between the flux lines may then be able to inducemore order into the lattice structure than would be observed in the pinned non-driven systemin equilibrium. The ordering due to an applied current was observed long ago in neutronscattering experiments (Thorel 1973). Recently, Koshelev and Vinokur (1994) suggestedthat the applied current might induce a phase transition from a disordered moving system,for currents close to the depinning current, to a moving flux system with crystalline orderat larger currents. Although it is clear that some ordering occurs as the drive is increasedmuch current work attempts to clarify the precise details of the nature of the ordering ofthe moving system (Giamarchi and Le Doussal 1996, Moonet al 1996, Faleskiet al 1996,Spencer and Jensen 1997).
2.8. Symmetry of the order parameter
The symmetry of the Ginzburg–Landau wavefunction, which describes the motion of thesuperconducting charges, may be different to that of conventional superconductors. Thestandard symmetry is the spherically symmetric s-wave, with the notation of atomic orbitaltheory. Experimental and theoretical studies suggest that in HTS this spherical symmetryis replaced by a ‘four-leaf clover’ symmetry characteristic of d-orbital. Since the symmetryof the superconducting wavefunction is reflected in the symmetry of the vortex core themicroscopic symmetry of the Ginzburg–Landau wavefunction may influence the propertiesof the vortex system (see, e.g. Berlinskyet al 1995). In these circumstances one finds that theideal hexatic Abricosov lattice is modified. The structure of the vortex lattice depends on themagnetic field and the degree of assumed mixing between the s-wave and d-wave componentof the Ginzburg–Landau wavefunction. The larger the magnetic field (or the stronger thed-wave component) the more the vortex lattice changes structure from a triangular latticetowards a square lattice. Note that this will influence the elastic moduli of the flux lattice.
Another important difference between the s-wave superconductor and d-wavesuperconductor is the difference in the quasiparticle spectrum around the vortex line. Thedensity of states around the vortex in the d-wave has four-fold symmetry (Schophol andMaki 1995). The energy gap for creating quasiparticle excitations in the d-wave vanishesalong certain directions of the quasiparticle momentum. As a consequence, the temperaturedependence of, say, the magnetic penetration depth and specific heat will be different in thed-wave superconductor compared with the s-wave case.
3. Interpreting vortex behaviour
3.1. Transport and magnetization measurements
The two main experimental approaches to studying vortex behaviour are direct transportmeasurements and magnetic studies. The electric fieldE within the superconductor isexplicitly measured in the former approach, but plays a less obvious though no less important
Magnetic behaviour of superconductors 1597
role in the latter. This makes a comparison of the data from each technique difficult.Vibrating reed, AC susceptibility, mechanical oscillator and torque magnetometry all belongin the second category but will not be discussed specifically.
In a four-terminal transport measurement it is usual to apply current and to measurea voltage. Electric field (E) versus current density (J ) curves can then be plotted as afunction of temperatureT or magnetic fieldB. The local slopeρ = dE/dJ of the E–Jcurve at a fixed voltage (threshold voltage) can be extracted and plotted as a function ofthe current density. The limitations of transport measurements are related to the practicalconstraints of attaching contacts, passing large currents through those contacts and measuringsmall voltages (10−8 V). Consequently transport measurements are usually made at hightemperatures or large magnetic fields, where the loss (voltage) is significant.
The magnetic measurement has the advantage of being contactless. The magneticmoment can be translated into a current density, but care is needed to take into accountsample geometry effects. The electric field is set by the experimental conditions, mostusually the sweep rate of the external magnetic field, or more generally by the rate ofchange of flux through the sample. The local slope of theE–J curve can be obtained froma magnetization measurement in a number of ways. For example, small changes in themagnetic field sweep rate (or electric field) alter the induced current through the sample andvariation of current as a function of sweep rate is a measure of the local slope of theE–Jcurve. (This is also later referred to as the dynamic creep rate.)
In theory, magnetic and transport techniques yield identical information. However, atthe same fixed magnetic field the transport measurements are restricted to high temperaturesand the magnetization to intermediate and low temperatures. As described by Caplinet al(1994), anE–J–B surface can be constructed which schematically illustrates the regimeswhich each kind of measurement is capable of accessing. It is extremely rare to findtransport and magnetization measurements made in overlapping regions of theE–J–T –Bparameter space.
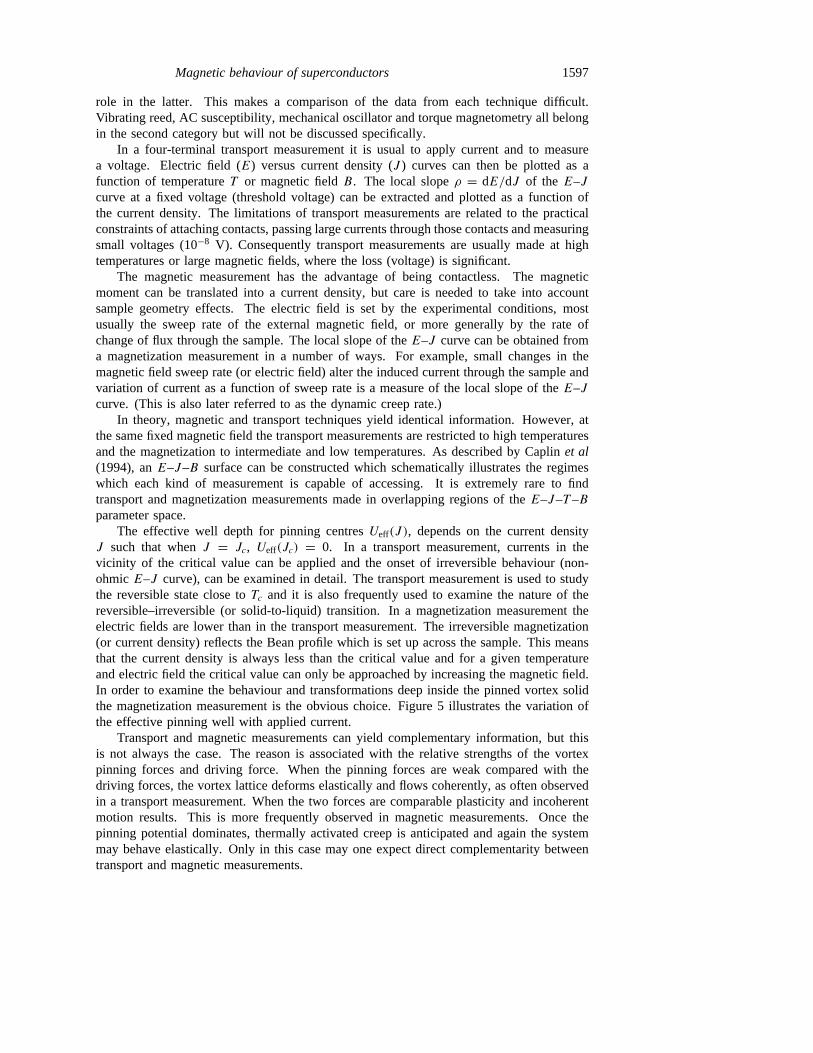
The effective well depth for pinning centresUeff(J ), depends on the current densityJ such that whenJ = Jc, Ueff(Jc) = 0. In a transport measurement, currents in thevicinity of the critical value can be applied and the onset of irreversible behaviour (non-ohmicE–J curve), can be examined in detail. The transport measurement is used to studythe reversible state close toTc and it is also frequently used to examine the nature of thereversible–irreversible (or solid-to-liquid) transition. In a magnetization measurement theelectric fields are lower than in the transport measurement. The irreversible magnetization(or current density) reflects the Bean profile which is set up across the sample. This meansthat the current density is always less than the critical value and for a given temperatureand electric field the critical value can only be approached by increasing the magnetic field.In order to examine the behaviour and transformations deep inside the pinned vortex solidthe magnetization measurement is the obvious choice. Figure 5 illustrates the variation ofthe effective pinning well with applied current.
Transport and magnetic measurements can yield complementary information, but thisis not always the case. The reason is associated with the relative strengths of the vortexpinning forces and driving force. When the pinning forces are weak compared with thedriving forces, the vortex lattice deforms elastically and flows coherently, as often observedin a transport measurement. When the two forces are comparable plasticity and incoherentmotion results. This is more frequently observed in magnetic measurements. Once thepinning potential dominates, thermally activated creep is anticipated and again the systemmay behave elastically. Only in this case may one expect direct complementarity betweentransport and magnetic measurements.
1598 L F Cohen and H J Jensen
Figure 5. A variation of the effective pinning wellUp(r) with applied currentI . The well istilted by the current and forI = Ic, the local minima inUp(r) vanishes.
3.2. TransportE–J curves
In this section we discuss the essential mechanisms responsible for the different typesof current–voltage (I–V ) curves one can observe in superconductors. According to theJosephson relation (Tinkham 1995) motion of the vortices inside a superconductor givesrise to an electric field between two points A and B proportional to the number of vorticescrossing the line connecting A and B per unit of time.
Let us first consider the zero-temperature case. The disorder in the superconductingmatrix can prevent the motion of the vortices as long as the applied Lorentz force producedby the applied current is smaller than a depinning currentjc corresponding to the pinningforce. TheE–J characteristics are therefore of the following form:
E ={
0 if J < Jc
f (J ) if J > Jc.
Since eventually all vortices must depin and flow with a velocity proportional toJ wemust always havef (J ) ∝ J for J � Jc. The shape of the functionf (J ) for currentsin the vicinity aboveJc depends on the dimension of the system (Larkin and Ovchinnikov1986) and on the topology of the induced flux motion (Jensenet al 1988b). The fluxsystem can either depin as a coherent structure moving homogeneously through the pinningpotential. The pinning force will deform the elastic flux structure but only elastically.Alternatively, motion can occur inhomogeneously when the flux system depins. In this caseplastic deformations will take place when the more mobile parts of the flux array passesby the stronger pinned, and therefore less mobile, regions of flux lines. The latter scenarioappears to be the most common (Wordenweberet al 1986, Bhattacharya and Higgins 1993,Yaron et al 1995).
In two dimensionsf (J ) ∝ J if all vortices depin at the same value ofJ . A nonlinearityin f (J ) arises due to partial depinning asJ is increased leading to successively morevortices being pulled into the flow (Jensenet al 1988b) our two-dimensional simulation. Thesituation is less simple in three dimensions. The nonlinearity can here contain contributionsboth from elastic distortions of the flux lattice as it flows and from inhomogeneous plasticflow of the flux lines (Larkin and Ovchinnikov 1986, Bhattacharya and Higgins 1993).
The above picture is changed at non-zero temperature due to thermal activation of the
Magnetic behaviour of superconductors 1599
vortices over the pinning barriers. This can lead to a non-zero electric field even forJ < Jc.The actual shape of theI–V curve for currentsJ 6 Jc is conveniently discussed in termsof the following ansatz
E = Bv (3.1)
wherev is the flux velocity with the following exponential activation form
v = ωd exp[−Ueff(J, B, T )/kBT ]. (3.2)
The prefactorω denotes the ‘attempt frequency’, i.e. the number of times the effective fluxbundle tries to overcome the barrier per unit time. The factord denotes the distance movedby the flux bundle as it jumps over the barrier. The productωd can be measured, but it isdifficult to determine each factor separately.
Equation (3.1) follows from the Josephson relation which can be expressed in the formE = φ0nv whereφ0 is the flux quantum andn is the density of the vortices which movewith velocity v.
The detailed dependence ofUeff on J will determine the shape of theI–V curve. Thebehaviour ofUeff in the limit of J approaching zero is of special importance. If the barrierremains finiteUeff(J )→ U0 asJ → 0 equation (3.1) leads to a linearI–V at small current.To obtain this result one must remember to include the contribution in equation (3.1) of fluxbundles jumping in the direction opposite to the applied force as well as those jumping withit. Since the applied current lowers the barrier for jumps in the direction of the force andincreases the barrier for jumps in the opposite direction we can write the effective barrierfor small currents asUeff = U0 ± J∂Ueff(0)∂J . Subtracting the contribution of the jumpsup against the applied force from the contribution produced by the jumps in the directionof the applied force leads to the famous result (Tinkham 1995, Blatteret al 1994b)
E ≈ v exp[−U0/T ]2J∂Ueff(0)∂J. (3.3)
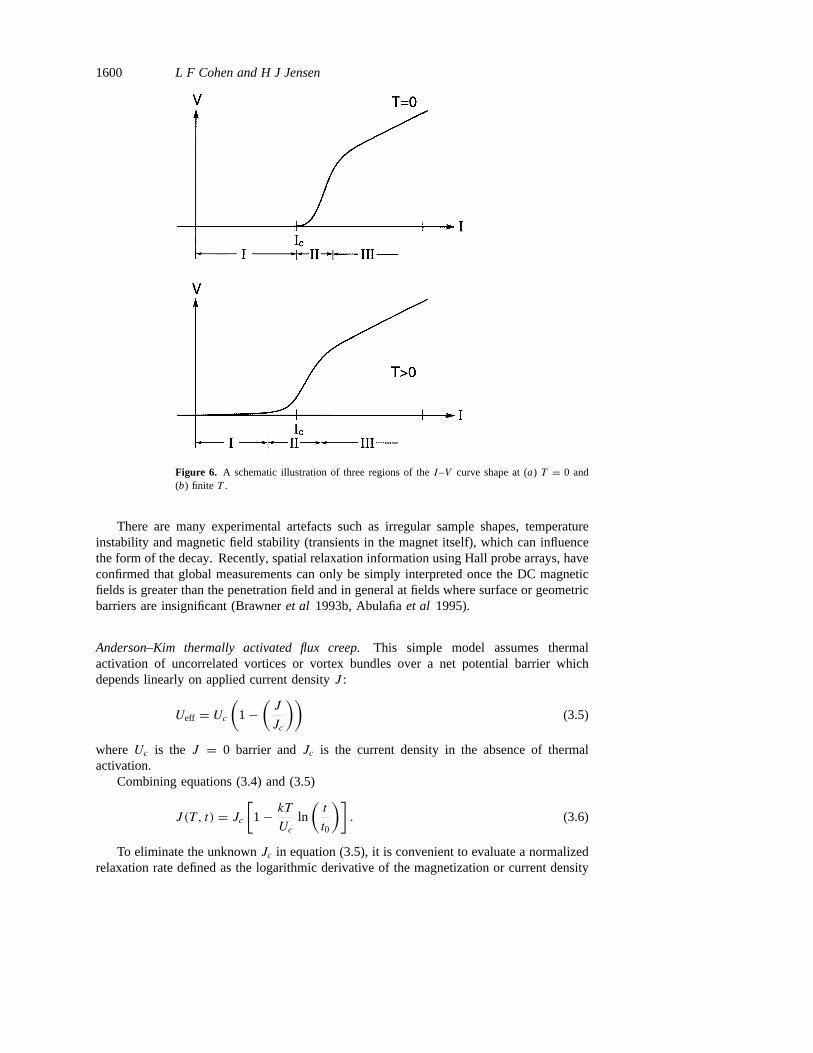
We conclude that theI–V curve has three regions of different behaviour depending onthe sizes of the current compared with thezero-temperaturecritical currentJc (see figure 6).WhenJ < Jc the electric field is either linear inJ (finite barriers) orE vanishes faster thanlinear whenJ → 0 (infinite barriers). In the region of currentsJ ≈ Jc a rapid increasein E is bound to take place as the barriers vanish. Finally, forJ > Jc one enters the freeflux-flow regime where the current is able to completely overcome the pinning potential.In this regimeE ∝ J .
3.3. Flux creep
The specific purpose of studying the vortex solid deep inside the irreversible regime, is todetermine the functional dependence ofUeff(B, J, T ), the effective pinning well depth, andcompare it with theoretical predictions to understand which barriers are involved in differentregions of theH–T plane and for different kinds of static disorder.
An electric field is associated with a time-varying supercurrent and all thermallyactivated forward vortex motion can be described by the simple rate equation.
dJ
dt∝ E = Bd
t0exp
(−Ueff(J )
kT
)= Bωd exp
(−Ueff(J )
kT
)(3.4)
wheret0 is the hopping attempt time for a vortex or vortex bundle,ω is the effective attemptfrequency andd is the hop distance. The rate equation can be solved approximately oncethe form ofUeff(J ) is known.
1600 L F Cohen and H J Jensen
Figure 6. A schematic illustration of three regions of theI–V curve shape at (a) T = 0 and(b) finite T .
There are many experimental artefacts such as irregular sample shapes, temperatureinstability and magnetic field stability (transients in the magnet itself), which can influencethe form of the decay. Recently, spatial relaxation information using Hall probe arrays, haveconfirmed that global measurements can only be simply interpreted once the DC magneticfields is greater than the penetration field and in general at fields where surface or geometricbarriers are insignificant (Brawneret al 1993b, Abulafiaet al 1995).
Anderson–Kim thermally activated flux creep.This simple model assumes thermalactivation of uncorrelated vortices or vortex bundles over a net potential barrier whichdepends linearly on applied current densityJ :
Ueff = Uc(
1−(J
Jc
))(3.5)
whereUc is the J = 0 barrier andJc is the current density in the absence of thermalactivation.
Combining equations (3.4) and (3.5)
J (T , t) = Jc[
1− kTUc
ln
(t
t0
)]. (3.6)
To eliminate the unknownJc in equation (3.5), it is convenient to evaluate a normalizedrelaxation rate defined as the logarithmic derivative of the magnetization or current density

Magnetic behaviour of superconductors 1601
(in the Bean critical state the magnetization is proportional to the current densityJ )
S = − 1
J
d(J )
d ln(t)≈ −d ln(J )
d ln(t)= −d ln(M)
d ln t. (3.7)
Long-time relaxation. The most common way to examine flux creep by magneticmeasurement is to study the long-time decay of a magnetization signal. The magneticfield is applied to the sample at a certain rate(dH/dt), setting a certain electric fieldthrough the sample. The field sweep is stopped at a desired value of magnetic field. Asdiscussed by Gurevichet al (1991, 1993), an initial ‘settle time’ has to be allowed for whilethe electric field spatially redistributes through the sample as a consequence of the changeof driving conditions from the initial voltage driven to the final current driven situation.The decay of magnetization dM/dt , now sets the electric field across the sample and canin principle be translated as a journey down theE–J curve. If the decay is approximatelylogarithmic in time, the slope of dlnM/dlnt is approximately equivalent to the inverse slopeof the lnE–lnJ curves over the range of electric fields associated with the experiment. Forfurther details see Zhukov (1992).
From equation (3.6), we can write
S = kT
Uc
[1− kT
Ucln(t/t0)
]−1
. (3.8)
Abulafia et al (1995, 1997) developed an analysis based on the rate equation whichallows a direct model-independent determination of the local activation energy andlogarithmic timescalet0 for flux creep.
Dynamic relaxation. Dynamic relaxation is a technique developed by Pust (1990) andPozeket al (1991). It monitors the change in the magnetization signal as a function of thesweep rate of the magnetic field. The normalized dynamic sweep rateQ is defined as
Q = d lnM
d ln(dH/dt). (3.9)
The equivalence ofQ andS has been discussed by Jirsaet al (1993) and Schnacket al(1992). The general case forI–V curves of different shapes has been analysed by Zhukov(1992).
Deviations from Anderson–Kim behaviour.HTS materials show giant flux creep effects.Deviations from the straightforward logarithmic decay rate predicted by Anderson–Kim havebeen reported extensively using a variety of standard and novel techniques. Initial reportsof non-Anderson–Kim behaviour came from long-time relaxation measurements. See forexample Yeshurun and Malozemoff 1988, Malozemoff (1991), Thompsonet al (1991a) andSenguptaet al (1993). Other types of measurement confirmed these observations usingfor example flux creep annealing (Thompsonet al 1991b, Sunet al 1990, Maleyet al1990), short-time relaxation (Gaoet al 1992), and dynamic relaxation (Pustet al 1990,Zhukov et al 1995, Perkinset al 1996) to name but a few. Zeldovet al (1990) proposed alogarithmic form for the current dependence of the activation energy which has frequentlybeen observed. In order to explain deviations from Anderson–Kim behaviour, Hagen andGriessen (1989), suggested that a distribution of activation energies should be taken intoaccount. In quite general terms, both the vortex glass (Feigel’man 1989) and collectivepinning theories describe a form forUeff(J ) which diverges asJ → 0. Feigel’man suggested

1602 L F Cohen and H J Jensen
an interpolation formula between the high-current Anderson–Kim limit and the low-currentregime which is frequently used, such that
U(J ) = Uc
µ
[(Jc
J
)µ− 1
](3.10)
whereµ = (d + 2ς − 2)/(2 − ς) > 0, d is the dimensionality of the relevant vortexbundle volume andς is the wandering exponent determined by equating the energy of anelastic deformation to the fluctuation in pinning energy. Depending on the dimension etc,µ
can take various values for glassy behaviour, see Feigel’man (1989) and for the collectivepinning behaviour of an elastic vortex medium, see Blatteret al (1994b).
3.4. Magnetic measurement analysis
The description of irreversible phenomena in the mixed state of HTS has to be based upona self-consistent relation between the current densityJ and the flux densityB, taking intoaccount the nonlinear current dependence of the creep activation barrier. Several relatedmethods have been developed to treat this problem. Hagen and Griessen (1989) developeda model making it possible to calculate a distribution of activation energies for flux motionfrom magnetic relaxation data using an exact inversion scheme. See also further work byGriessen (1990, 1991).
3.4.1. The Maley method.The Maley method was introduced in 1990 (Maleyet al 1990).The basic idea was that one could extractUeff(J ) directly from the time dependence ofM.Based on the general nonlinear form forUeff(J ) from Beasleyet al (1969), Maleyet al(1990) wrote down an expression forUeff(J ) such that
Ueff(J ) = −kBT ln |dM/dt | + kBT ln
(Bdω
τπ
)(3.11)
wherekB is the Boltzmann’s constant,τ is the thickness of the sample,d is the flux bundlehopping distance andω is the attempt frequency (see Senguptaet al 1993). In this approachone first calculatesT ln |dM/dt | at a given field. Then the data can be directly plottedasUeff versus(M − Mequ), at different temperatures. Finally, by adjusting the constantC = ln(Bωd/τπ) all of the data can be made to fall on the same smooth curve and theUeff− J relationship is obtained. The Maley method assumes that the characteristic currentand energy scales are temperature independent. A very useful example of the applicationof the method is given in Senguptaet al (1993). Maley observed a logarithmic functionalform for Ueff(J ) in YBCO agreeing with the earlier Zeldovet al (1990) observation.
3.4.2. The generalized inversion scheme.Schnacket al (1993) introduced the generalizedinversion scheme which separates the effective activation energy into an energy term and acurrent density term so that the rate equation can be written
Ueff(J, B, T ) = U0(B, T )F [J/J0(B, T )] = kT ln(Bdω/E) (3.12)
where U0 is an energy scale,J0(B, T ) a current density scale andF is a functionwhich describes theJ dependence ofUeff(J, B, T ). Within this definitionU0 and J0 areclosely associated with the pinning mechanism. The Schnack method is model dependentbecause it requires thatUeff(T ) = [J0(T )]p. Using this assumption, bothUeff(J, T , B)
and the parameterC = (ln(Bdω/E) can be directly extracted from relaxation and currentmeasurements.
Magnetic behaviour of superconductors 1603
3.4.3. The magnetic scaling analysis.The concept of magnetic scaling originates from theobservation thatM–H loops at different temperatures can be brought to lie on top of eachother, producing a unique curve, if both theM- andH - axis are normalized appropriately.This reflects one dominant physical process determining the behaviour in the temperatureregime of interest. Magnetic scaling has been reported frequently. See for example Zhukovet al (1993), Kobayashiet al (1993), Oussenaet al (1993) or Kleinet al (1994). Scalingrelationships are also observed for the creep rate (Zhukov 1994) and the pinning forcedensity,JB (Civale et al 1991a).
The magnetic scaling analysis, introduced by Perkins (1995), builds on the Schnacketal (1993) formalism and further considers the geometrical restrictions of moving throughthe four-dimensional parameterE–J–T –B space. No assumptions are made about the formof Ueff(J ) but the existence of magnetic scaling has certain implications.
Incorporating equation (3.12) into the rate equation and under the condition thatM(H)
exhibits scaling, it can be shown thatU0(B, T ) andJ0(B, T ) must take the following forms:
U0(B, T ) = 9(T )Bn (3.13)
J0(B, T ) = λ(T )Bm. (3.14)
Differentiation of the rate equation with respect to lnB and lnE leads to therelationship betweenχln = d lnJ/d lnB, and the dynamic normalized creep rateS(B) =[(ln J )/(lnE)]B,T at constantT :
χln = m+ (nC − 1)Q (3.15)
whereC = ln(Bωd/E), andQ is the dynamic creep rate. Bothχln andQ can be takendirectly from magnetization data.
3.5. Critical scaling applied toE–J curves
It is believed that in very pure crystals the transition between vortex solid and liquid willbe sharp and first order. In the presence of static disorder, it is further believed that thistransition broadens and become second order or continuous. If the transition is continuousthen the general rules which apply to all critical behaviour can be applied. Fisheret al(1985) gave a general formulation of the scaling at and near a continuous transition. Thebasic idea is that physical quantities near the transition can be expressed in terms of theappropriate powers of a diverging coherence lengthξ and coherence timeτ , such that asthe transition temperatureTg is approached from above
ξ ≈ (T − Tg)−ν and τ ∝ ξz. (3.16)
A current scaleJsc for linear ohmic response is then defined as
Jsc= ckBT /φ0ξ2 (3.17)
herec denotes the speed of light,φ0 is the flux quantum, andkB is Boltzmann’s constant.A non-ohmic response at all current scales is a signature of a critical transition. TheE–Jcharacteristic for ad-dimensional sample is predicted to be a power law of the form
lnE ∝ [(z + 1)/(d − 1)] ln J. (3.18)
For T greater thanTg the characteristic changes from ohmic behaviour for small currentdensities where
ρ(T ) ∝ (T − Tg)ν(z+2−d)
= (T − Tg)s (3.19)

1604 L F Cohen and H J Jensen
to power law at large current densities.For T less thanTg the E–J characteristic is always nonlinear and for small current
predicts a resistivity given by
ρ = E/J = ρ0 exp[−(Jc/J )µ] (3.20)
this implies a negative curvature on a lnE–lnJ plot. At large current densities it is predictedto again have critical power law behaviour. The crossover current vanishes as(T−Tg)ν(d−1).
These scaling ideas can be applied to any continuous transition. An example is theKosterlitz–Thouless transition appropriate to two-dimensional thin films whered = z = 2andE = J 3 (Hebard and Fiory 1982). These scaling laws have been applied to theE–Jcurves in HTS and the values of the exponentν, the dimensiond and the dynamic exponentz, have been used extensively as evidence for the existence of melting and a transition to avortex glass phase. The validity of these claims are reviewed in more detail in section 4.Alternative scenarios exist, see for example Kiss and Yamafuji (1996).
ForT less thanTg critical scaling is not observable at high driving forces. The influenceof disorder on the vortex system as it freezes is strongly tuned by the magnitude of the drivecurrent in a manner not addressed by scaling theory. Koshelev and Vinokur (1994) andKoshelev (1996b) investigated this theoretically. They predicted that in the presence of staticdisorder, freezing will take place into a perfect lattice if the lattice is moving sufficiently fastand that plastic or glassy behaviour will be observed otherwise, depending on the magnitudeof the drive current with respect toJc. In this scenario, a current-driven transition into aperfect lattice can be visualized as occurring well below the freezing transition.
4. Experimental observation of vortex behaviour
4.1. Reversible properties
4.1.1.Hc1. Measurement ofHc1 is usually made by examining the point of departure fromlinearity on the initial slope of the magnetization curve. Without pinning there is of coursea sharp cusp atHc1. In HTS this measurement is difficult because pinning causes onlya subtle departure from linearity and deviation from theM = −H is small atHc1. ForH//c, the sample geometry (which is usually plate-like) and self-field effects contribute tothe shape of the initial slope. Surface barriers to flux penetration result in enhanced valuesof Hc1 and measurements yield an upper bound only (Umezawaet al 1988). Microwavemeasurements of the change in the penetration depth as a function of DC magnetic field,yield clean data of the first effective field at which vortices penetrate single crystals (Wuand Sridhar 1990). For YBCO,Hc
c1(0) = 800 Oe,Hab
c1(0) = 200 Oe.
Not surprisingly perhaps, given these complications,Hc1 has sometimes been reportednot to follow the expected GL form for either theH//c(Hc
c1) or H//ab(Hab
c1) geometry,
particularly for (T /Tc) 6 0.5 (Krasnovet al 1991). It has been reported that within afew Kelvin of Tc, Hc
c1disappears. In YBCO crystals this is interpreted as a thermally
induced excitation over the surface barrier (Safaret al 1990, Pastorizaet al 1994b). Thesituation for BSCCO 2212 from Brawneret al (1993b), is illustrated in figure 7. Brawneret al interpreted the disappearance the penetration fieldHp (which can be considered as anupper bound forHc1) as evidence for thermally induced vortex–antivortex pairs (Kosterlitz–Thouless-type transition) or alternatively as being related to order parameter fluctuationswithin vortices. (Blatteret al 1993).
When the field is aligned within 6◦ from the ab planes, a sharp change in the initialmagnetization in BSCCO has been observed by Nakamuraet al (1993). They interpret this

Magnetic behaviour of superconductors 1605
Figure 7. (a) The temperature dependence of the critical current densityJc with an insetshowing the field-cooled (5 Oe) magnetization of the crystal. Also the penetration fieldHp
versusT with the inset showing a suggested phase diagram, both for a BSCCO 2212 crystalwith H//c. Below 83.5 K,Hp extrapolates linearly toTc = 86 K. Hp is absent above 83.5 K.(b) ShowsJc andHp for a YBCO 123 crystal. Both persist toTc in this case. From Brawneret al (1993b).
as an effective three-dimensional to two-dimensional transition in theshielding current pathbecause thec-axis coherence is lost across the thickness of the crystal. They attribute thisto the fact that the Josephson current is suppressed by the entrance of flux between theab
planes. Similar observations have been reported forHabc1
in TlBaCuO-2201 (Husseyet al1994, 1996). Changes in the reversible screening current path forH//ab andT close toTc have not been reported for YBCO crystals.
The values ofHc1 in the two field orientations can be used to determine the GLsuperconducting mass anisotropy ratioγ . The problem ofinternal sample flatnessandexternal sample alignmentwhen the field is aligned parallel to the sample surface, throwsdoubt on the precision of many measurements. Nevertheless some consensus has beenreached. Hc
c1/ Hab
c1lies between 4 and 7 for well oxygenated YBCO and between 30
and 300 for BSCCO 2212 (Martinezet al 1992). λab and λc are determined from themeasurement ofHc1, from AC susceptibility and from microwave measurement. Typicalvalues areλab = 140 nm,λc = 600 nm for YBCO andλab = 185 nm,λc = 7.5 µm forBSCCO 2212.
4.1.2. Hc2. The mean-field approximation forHc2 is not valid in the presence of largethermal fluctuations. Only specific heat measurements will determine unequivocally whetherthere is a first- or second-order transition atHc2. For LTS materials,Hc2(T ) acts as a fieldscale for all elastic properties of the vortex system. WhetherHc2(T ) or some other fieldline such as the melting line plays this role in HTS vortex behaviour is still unclarified.
Two non-calorimetric methods are used to determineHc2. A line in theH–T planehas been extracted from resistivity measurements (Mackenzieet al 1994, Smithet al 1994,

1606 L F Cohen and H J Jensen
Osofskyet al 1993, 1994) which place a lower bound onHc2 by identification of the field atwhich the resistivity reaches 90% of its extrapolated normal state value at that temperature.These measurements either require huge magnetic fields to be applied of the order of 140 T,or HTS samples which have been doped in such a way that theirTc andHc2 values aregreatly depressed. (Note that such manipulation of the charge carrier state in the materialeither by ‘overdoping or underdoping’ can change normal state properties, by opening up apseudogap in the normal density of states. The pseudogap has been studied by specific heatcapacity, NMR, inelastic neutron scattering and thermo-electric power. The anisotropy ofthe superconducting properties are also modified by doping.) The form of the line extractedfrom the resistivity curves is similar to the irreversibility line and indeed probably reflectsthe irreversibility line rather than theHc2. These resistive measurements are also hamperedby the large broadening of the transition in a magnetic field due to flux flow. Even as avery approximate lower bound it is nevertheless clear thatHc2(T = 0) must indeed be verylarge.
Another procedure used to estimateHc2 is to find the temperature at which the reversiblemagnetization approaches zero for a given field. This can be a problem for HTS materialsbecause many samples have rare earth ions which are paramagnetic.Hc2(T = 0) can beenestimated from the reversible magnetization close toTc (Welp et al 1989), using either alinear analysis (see figure 8) or a more complex procedure (Hao and Clem 1991). Accordingto the theory of Werthameret al (1966),
Hc2(0) = 0.71Tc
(δHc2
δT
)Tc
. (4.1)
This givesHc2(T = 0) = 140 T for well oxygenated YBCO 123. There are problemsin using this method for BSCCO, because of broadening of the transition in magnetic field.The ratioHc
c2/Hab
c2is used to estimateγ of the order of 5 in YBCO 123 and 30 in BSCCO
2212. MeasuringHc2 = φ0/2πξ2 yields ξ . In YBa2Cu3O7, for H//c, ξab = 15.4 A.As oxygen is removedξab remains at this value initially and then it increases significantly(Ossandonet al 1992, Zhukovet al 1994). M(T,H) is at least an order of magnitudesmaller whenH//ab and thereforeTc(H) is rather ill-defined. This means that even inthe least anisotropic material, measurements ofHab
c2(0) are not particularly accurate. For
well oxygenated YBCO,ξc = 3–5 A. This value is to be compared with the distancebetween the superconducting layers which in YBCO 123 is 8A or the total unit cell lengthof 11.7 A. It is thought that because the Cu–O chains of fully oxygenated crystals are alsosuperconducting (Kresin and Wolf 1992), and it is the chain–plane separation 4A whichshould be compared withξc = 3–5 A.
In BSCCO 2212ξab = 10 A implying from the measurement ofγ that the value ofξc ismuch smaller than the interplanar spacing. In this case the GL anisotropic three-dimensionalmodel breaks down and must be replaced by a quasi-two-dimensional model (Lawrence andDoniach 1971).
4.1.3. Influence of columnar defects.Thermal fluctuation effects are particularlypronounced in the most anisotropic materials. Keset al (1991) measured a weak fluctuationcontribution to the reversible magnetization up to 20 K above the field-dependent transitiontemperatureTc(B). The reversible magnetization at different magnetic fields applied alongthe c-axis, becomes field independent at some temperatureT ∗ < T ∗, whereT ∗ is knownas the ‘crossing point’ (Keset al 1991, Tesanovic and Xiang 1991). BelowT ∗, vortexpositional fluctuations (phase fluctuations) modify the field dependence of the magnetizationand suppress the pinning critical current density (Feigel’man and Vinokur 1990). AtT ∗ the
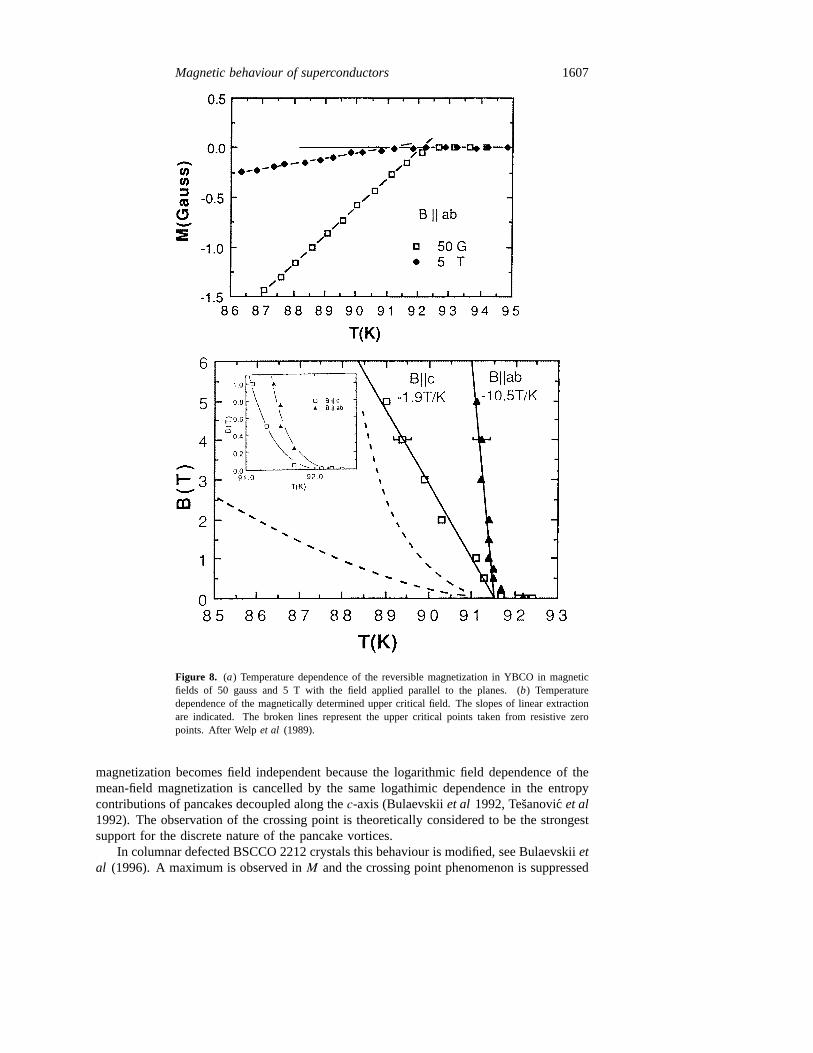
Magnetic behaviour of superconductors 1607
Figure 8. (a) Temperature dependence of the reversible magnetization in YBCO in magneticfields of 50 gauss and 5 T with the field applied parallel to the planes. (b) Temperaturedependence of the magnetically determined upper critical field. The slopes of linear extractionare indicated. The broken lines represent the upper critical points taken from resistive zeropoints. After Welpet al (1989).
magnetization becomes field independent because the logarithmic field dependence of themean-field magnetization is cancelled by the same logathimic dependence in the entropycontributions of pancakes decoupled along thec-axis (Bulaevskiiet al 1992, Tesanovic et al1992). The observation of the crossing point is theoretically considered to be the strongestsupport for the discrete nature of the pancake vortices.
In columnar defected BSCCO 2212 crystals this behaviour is modified, see Bulaevskiietal (1996). A maximum is observed inM and the crossing point phenomenon is suppressed

1608 L F Cohen and H J Jensen
for fields 0.2Bφ 6 µ0H 6 Bφ . Bφ = nφφ0 is known as the matching field associatedwith a certain density of columnar tracks,nφ . See van der Beeket al (1996), Qiang Lietal (1996) and Pradhanet al (1996). It is still unclear exactly what role columnar defectsplay and whether they effectively enhance coupling between layers and correlations alongthe c-direction (Bulaevskiiet al 1996). The absence of the crossing point phenomenonsuggests that the random distribution of columnar defects suppresses the interaction betweenfluctuations in the critical regime (van der Beek 1996). The crucial message at this point isthat it is clear that vortex pinning not only affects irreversible magnetic properties but canalso affect its thermodynamic properties.
4.2. The irreversibility line
In 1988, Yeshurun and Malozemoff had already recognized the existence of giant flux creepin HTS. It was quickly established that a line existed well belowHc2 that separated reversiblefrom irreversible magnetic behaviour. Below it, because irreversible magnetization wasobserved, vortices were thought to be pinned and this pinning was associated with a vortexsolid. Above the line, the vortices were considered to be unpinned and under the influenceof a driving force—flux flow or a liquid state existed. As we discussed in section 2,these initial conclusions have since been re-examined because pinned liquids might existbelow the irreversibility line and an unpinned perfect Abrikosov lattice might exist aboveit. Over the past eight years there has been an active discussion as to whether theHirr linerepresents simple depinning or whether it is coincident with melting or decoupling. Cooperet al (1997) presented experimental evidence which appears to show that thermodynamicfluctuations play an important role in determining the irreversibility line and reversiblemagnetizatisation in YBCO 123 crystals. Cooperet al (1997) found that the form ofHirr(T ) is consistent with the three-dimensionalXY model which is based on fluctuationsof the order parameter.
As vortices depin (or become pinned), dissipation associated with their movementgenerates an increase (decrease) in voltage. The change in the vortex properties atHirr
may reflect the existence of a phase transition. However, the disappearance (or appearance)of an irreversible signal is intrinsically non-equilibrium and depends on experimental methodand criteria. For clarity, we discuss the evidence for melting and decoupling in separatesections.
4.2.1. The position of theHirr line in theH–T plane. Optimally doped rare earth (Re)BCO123 and BSCCO 2212 crystals have similarTc values and yet the position of theirHirr linesin theH–T plane are strikingly different, as shown in figure 9. Assuming thatTc reflectsthe strength of the in-plane superconductivity, then theHirr line is clearly affected by otherfactors such as the superconducting anisotropy ratioγ , and thec-axis coupling strength.
At T/Tc = 0.75, Tallon (1994) found that the position of theHirr line is exponentiallydependent on the inter-plane or plane–chain separation for many families of optimally dopedmaterials as indicated in figure 10. The exponential relationship strongly suggests a weaklink plane–plane or plane–chain coupling mechanism. (Implying that the chain is alsosuperconducting). The Tallon group have also shown that by careful cation substitution andoxygen doping,Tc can be kept constant while thec-axis coupling strength is weakened. Inthese samplesTc is constant butHirr(T /Tc = 0.75) falls, strongly supporting the premisethat this is the main difference between the YBCO and BSCCOHirr lines.
The position of theHirr line in theH–T plane, also depends on the vortex and defectdimensionality and the defect density. Columnar defects produced by heavy ion irradiation,
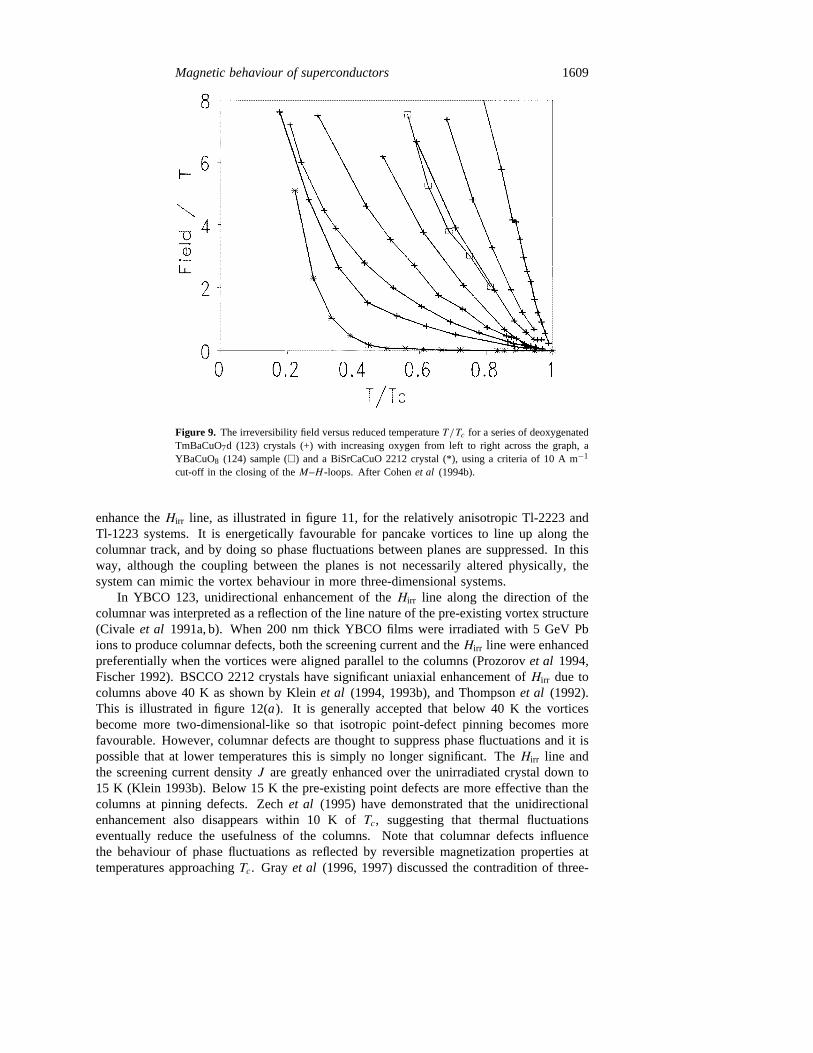
Magnetic behaviour of superconductors 1609
Figure 9. The irreversibility field versus reduced temperatureT/Tc for a series of deoxygenatedTmBaCuO7d (123) crystals (+) with increasing oxygen from left to right across the graph, aYBaCuO8 (124) sample (�) and a BiSrCaCuO 2212 crystal (*), using a criteria of 10 A m−1
cut-off in the closing of theM–H -loops. After Cohenet al (1994b).
enhance theHirr line, as illustrated in figure 11, for the relatively anisotropic Tl-2223 andTl-1223 systems. It is energetically favourable for pancake vortices to line up along thecolumnar track, and by doing so phase fluctuations between planes are suppressed. In thisway, although the coupling between the planes is not necessarily altered physically, thesystem can mimic the vortex behaviour in more three-dimensional systems.
In YBCO 123, unidirectional enhancement of theHirr line along the direction of thecolumnar was interpreted as a reflection of the line nature of the pre-existing vortex structure(Civale et al 1991a, b). When 200 nm thick YBCO films were irradiated with 5 GeV Pbions to produce columnar defects, both the screening current and theHirr line were enhancedpreferentially when the vortices were aligned parallel to the columns (Prozorovet al 1994,Fischer 1992). BSCCO 2212 crystals have significant uniaxial enhancement ofHirr due tocolumns above 40 K as shown by Kleinet al (1994, 1993b), and Thompsonet al (1992).This is illustrated in figure 12(a). It is generally accepted that below 40 K the vorticesbecome more two-dimensional-like so that isotropic point-defect pinning becomes morefavourable. However, columnar defects are thought to suppress phase fluctuations and it ispossible that at lower temperatures this is simply no longer significant. TheHirr line andthe screening current densityJ are greatly enhanced over the unirradiated crystal down to15 K (Klein 1993b). Below 15 K the pre-existing point defects are more effective than thecolumns at pinning defects. Zechet al (1995) have demonstrated that the unidirectionalenhancement also disappears within 10 K ofTc, suggesting that thermal fluctuationseventually reduce the usefulness of the columns. Note that columnar defects influencethe behaviour of phase fluctuations as reflected by reversible magnetization properties attemperatures approachingTc. Gray et al (1996, 1997) discussed the contradition of three-
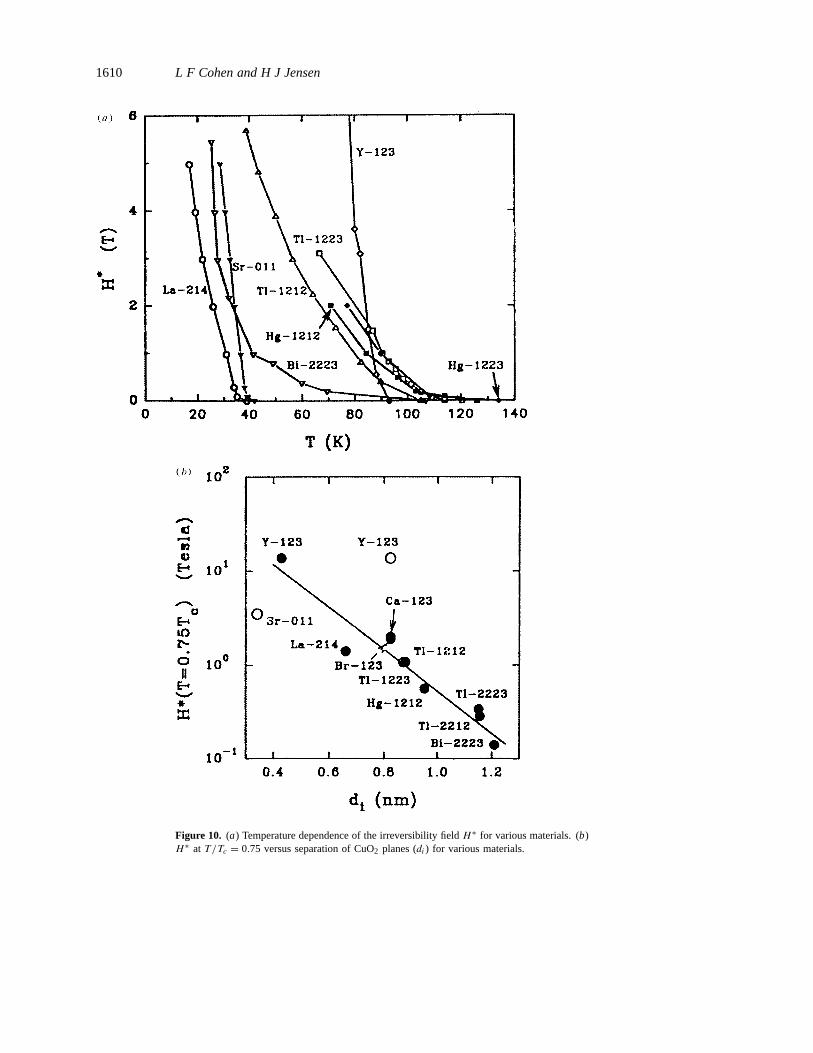
1610 L F Cohen and H J Jensen
Figure 10. (a) Temperature dependence of the irreversibility fieldH ∗ for various materials. (b)H ∗ at T/Tc = 0.75 versus separation of CuO2 planes (di ) for various materials.

Magnetic behaviour of superconductors 1611
Figure 11. TheHirr line enhancement resulting from columnar defects of different densities, inTl-2223 and Tl-1223 systems. After Brandstatteret al (1995).
dimensional-like uniaxial enhancement due to columns at temperatures within the two-dimensional thermally activated limit (see sections 4.1.3, 4.3.1 and 4.4.2).
The interplay between different types of defects which may be present in a crystalsuch as point defects (e.g. oxygen vacancies) and planar defects (twinning planes) makesit impossible to summarize all possible behaviours. Twin boundaries are reported to act asstrong pinning sites in some situations. However, Oussenaet al (1995, 1996) reported thatin unidirectional microtwinned crystals at low magnetic fields the twin boundaries act asvortex channels. Figure 13 illustrates the case highlighted by Jahnet al (1995) who foundthat in YBCO 123, point-like defects can depress theHirr line without significantly loweringTc, whereas correlated disorder such as intrinsic pinning of the planes or twin boundariesenhance theHirr but lower the screening current density. Recently, Flippenet al (1995)showed that even surface damage can significantly alter the pinning properties of YBCOsingle crystals which have very low twin boundary densities.
4.2.2. The temperature dependence of theHirr line (H//c geometry). Almasanet al (1992)suggested that theHirr(T
∗) line obeyed a scaling relationship universal for all HTS, wherebyat temperatures aboveT ∗/Tc > 0.6 theHirr(T
∗) exhibited a power law dependence of theform
Hirr(T∗) = (1− T ∗/Tc)m (4.2)
wherem = 32 andT ∗(H) is the temperature at which the resistanceR(H, T ) drops to 50%
of its normal state value, at a fixed field, as shown in figure 14. At lower temperatures acrossover to a more rapid dependence occurs as shown in figure 14 (see the break awayon the right-hand side of the figure). Although such scaling exists, it is not as generalas first implied by Almasanet al (1992). For example theHirr line of optimally dopedYBCO 123 shows no upturn down to the lowest temperatures measured. TheHirr(T ) ofBSCCO 2212 is illustrated in figure 15, after Schillinget al (1993). It follows a powerlaw form with an exponentm = 2 at high temperatures and a much stronger upturn at low

1612 L F Cohen and H J Jensen
Figure 12. (a) Magnetization curves at 40 K and 60 K for a BSCCO 2212 crystal which hasbeen irradiated with Pb ions at 45◦ to thec-axis. The field is applied at+45◦ and−45◦ to thec-axis. After Klein (1993b). (b) The effective enhancement of theHirr line in BSCCO 2212crystals for continuous columnar defects produced from Pb ions which are effective below about60 K and Xe ions which create cluster defects.
temperatures than found in the intermediately anisotropic materials. The significance of thelow temperature upturn inHirr , has been interpreted as a softening of the elastic parametersof the vortex system making the existing pinning sites more effective and enhancing theHirr line. Schilling related this softening to a dimensional crossover in the vortices fromthree-dimensional at higher temperatures to two-dimensional at lower temperatures.
TheHirr line as measured by torque magnetometry (refer to Farrell 1994) coincides withsharp features in the resistive transition as measured by Safaret al (1992c), in untwinnedYBCO crystals with very low point-defect density. It appears that in this caseHirr coincideswith the melting line, i.e. that pinning disappears at the solid-to-liquid transition. Once staticdisorder is introduced by irradiation or the underlying static disorder becomes effectivebecause the system is cooled, the melting line and the bulk-depinning line separate.
This is also consistent with the predictions of the three-dimensionalXY model asdiscussed in a brief review by Cooperet al (1997). The three-dimensionalXY model
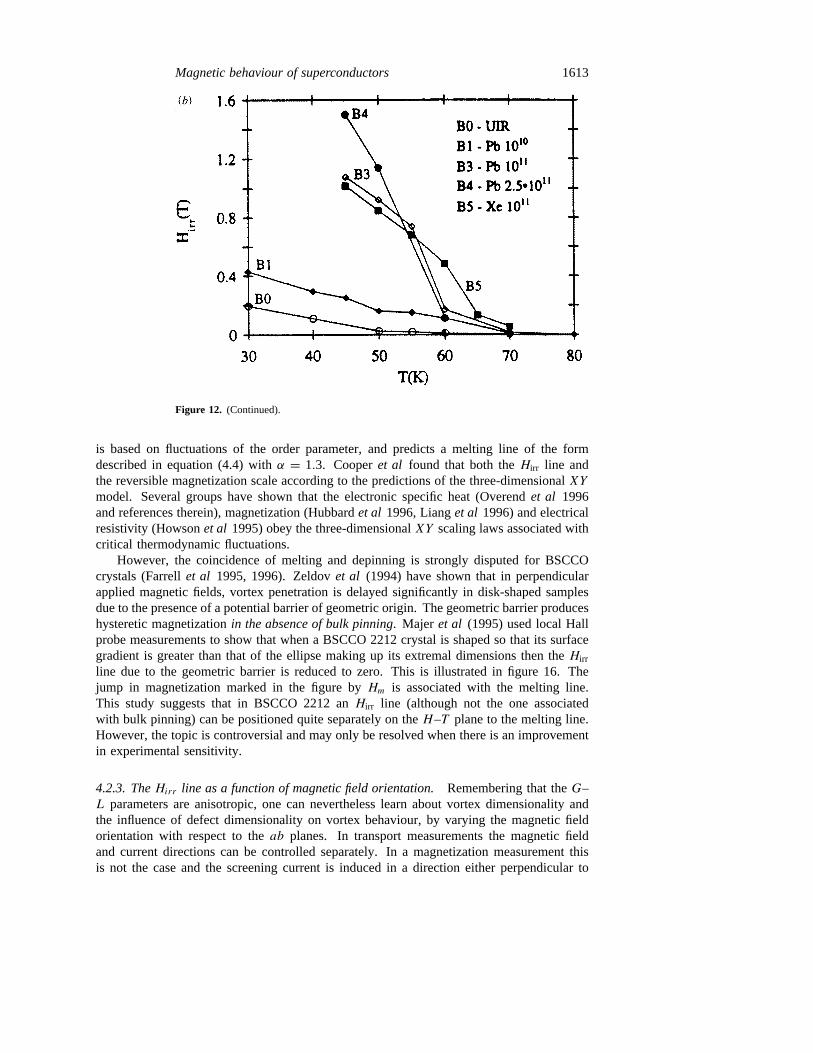
Magnetic behaviour of superconductors 1613
Figure 12. (Continued).
is based on fluctuations of the order parameter, and predicts a melting line of the formdescribed in equation (4.4) withα = 1.3. Cooperet al found that both theHirr line andthe reversible magnetization scale according to the predictions of the three-dimensionalXY
model. Several groups have shown that the electronic specific heat (Overendet al 1996and references therein), magnetization (Hubbardet al 1996, Lianget al 1996) and electricalresistivity (Howsonet al 1995) obey the three-dimensionalXY scaling laws associated withcritical thermodynamic fluctuations.
However, the coincidence of melting and depinning is strongly disputed for BSCCOcrystals (Farrellet al 1995, 1996). Zeldovet al (1994) have shown that in perpendicularapplied magnetic fields, vortex penetration is delayed significantly in disk-shaped samplesdue to the presence of a potential barrier of geometric origin. The geometric barrier produceshysteretic magnetizationin the absence of bulk pinning. Majer et al (1995) used local Hallprobe measurements to show that when a BSCCO 2212 crystal is shaped so that its surfacegradient is greater than that of the ellipse making up its extremal dimensions then theHirr
line due to the geometric barrier is reduced to zero. This is illustrated in figure 16. Thejump in magnetization marked in the figure byHm is associated with the melting line.This study suggests that in BSCCO 2212 anHirr line (although not the one associatedwith bulk pinning) can be positioned quite separately on theH–T plane to the melting line.However, the topic is controversial and may only be resolved when there is an improvementin experimental sensitivity.
4.2.3. TheHirr line as a function of magnetic field orientation.Remembering that theG–L parameters are anisotropic, one can nevertheless learn about vortex dimensionality andthe influence of defect dimensionality on vortex behaviour, by varying the magnetic fieldorientation with respect to theab planes. In transport measurements the magnetic fieldand current directions can be controlled separately. In a magnetization measurement thisis not the case and the screening current is induced in a direction either perpendicular to

1614 L F Cohen and H J Jensen
Figure 13. Magnetization loops for two YBCO crystals at 77 K. W1 is a twinned crystal withvery low density of point defects and W2 is doped with Sr and has a high density of pointdefects. W2 shows a largeJ but a depressedHirr line compared to W1. After Jahnet al (1995).
the applied field or in a direction controlled by sample or defect geometry. The inducedscreening current should always be perpendicular to the field, a field tilted away from thec-axis will produce two components of current (Gyorgyet al 1989). However, geometryeffects in flat samples (Zhukovet al 1997) and linear or planar defects (Kupfer et al1996), can prevent the magnetic moment from tracking the applied field. Making magneticmeasurements in this case requires more care.
When the field is close to theab planes, quantitative analysis is difficult because thevortex system may take a new structure related to the extreme angle. For example, in YBCOcrystals at low fields and angles close to theab planes, high resolution Bitter patterns revealthat the flux-line lattice which lies in the tilt plane takes the form of vortex chains, as a resultof attraction within the tilt plane (Gammelet al 1992, Grigorievaet al 1993). In BSCCOsimilar attractive forces results in the coexistence of two vortex species, oriented parallel totheab planes and thec-axis (Grigorievaet al 1995). When the field is aligned accurately inthe planes, a lock-in transition occurs and has been observed in untwinned YBCO crystals(Ossandonet al 1992). A crossover in the form ofHab
irr (T ) occurs at around 80 K whichhas been associated with the disappearance of the coherence in thec-axis current (Laceyetal 1994, Ossandonet al 1992). Such a crossover is predicted to occur when the thermalenergy washes out the inter-plane coupling (Fischer)- formulae.
The variation ofHirr(T ) with θ , the angle betweenH and theab plane, can be used todetermine the dimensionality of the vortex structure at different temperatures. For example,Keset al (1990) proposed, that the field component parallel to thec-axis,H sinθ determines

Magnetic behaviour of superconductors 1615
Figure 14. Log(H/H+) versus log(1− T ∗/Tc), whereH+ is a normalizing field andT ∗(H)is the temperature at which the normal state resistance falls to 50% of its normal state value.The full curves in all four figures are power-law behaviour with the exponentm = 3
2 . (e) is acomposite plot of all the data from figures 2(a)–(d). From Almasanet al (1992).
Hirr for quasi-two-dimensional pancake vortices. Various angular scaling relationships havebeen suggested: Tachiki and Takahashi (1989), Klemm and Clem (1980), Tinkham (1963).These scaling models breakdown in a variety of ways when line-like and planar defectsdominate the pinning behaviour or when Josephson kink structures are created at anglesclose to the planes (Zhukovet al 1996). In general, anisotropicG–L theory suggests that
H = HA(sinθ2+ (1/γ 2) cosθ2)−1/2. (4.3)
Onceγ > 15 this expression is, for smallθ indistinguishable from Kes scaling (Iyeetal 1992). In YBCO crystals containing a homogeneous point-defect distribution, theHirr
line moves systematically upwards in theH–T plane as the field is swung away from thec-axis. It is found to be about five times higher when it lies approximately in the plane, inagreement with equation (4.3) and measured values ofγ (see Angadiet al 1991).
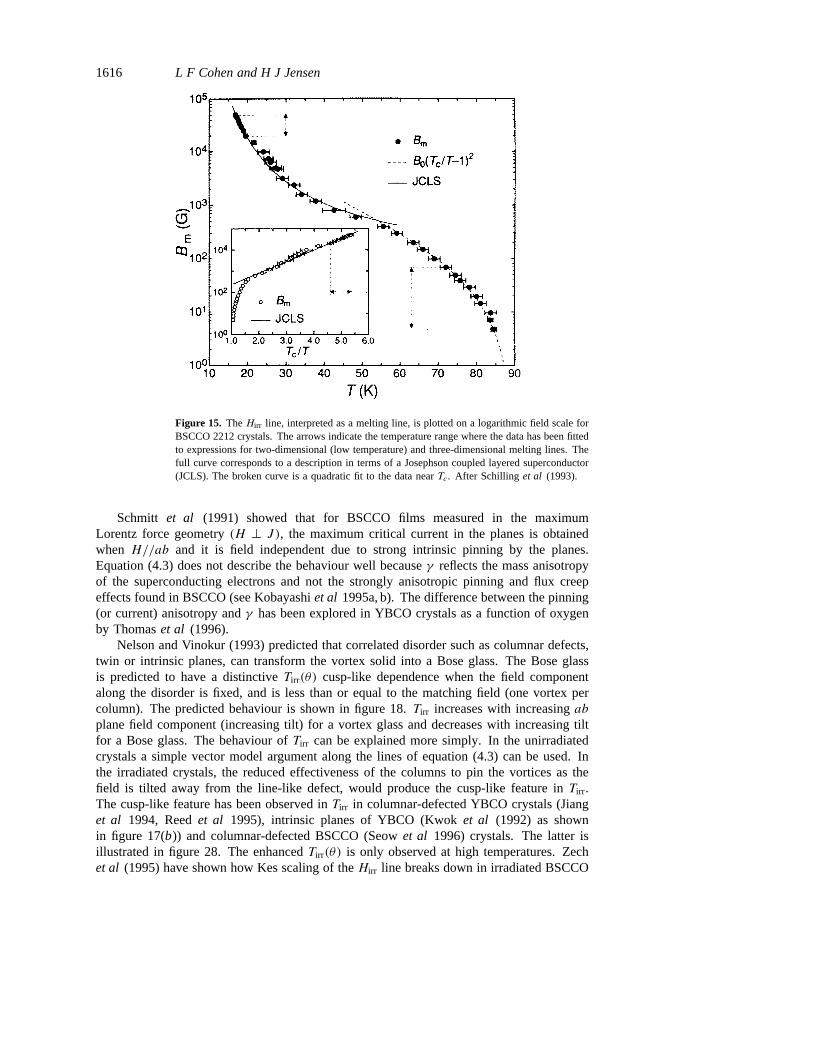
1616 L F Cohen and H J Jensen
Figure 15. TheHirr line, interpreted as a melting line, is plotted on a logarithmic field scale forBSCCO 2212 crystals. The arrows indicate the temperature range where the data has been fittedto expressions for two-dimensional (low temperature) and three-dimensional melting lines. Thefull curve corresponds to a description in terms of a Josephson coupled layered superconductor(JCLS). The broken curve is a quadratic fit to the data nearTc. After Schilling et al (1993).
Schmitt et al (1991) showed that for BSCCO films measured in the maximumLorentz force geometry(H ⊥ J ), the maximum critical current in the planes is obtainedwhen H//ab and it is field independent due to strong intrinsic pinning by the planes.Equation (4.3) does not describe the behaviour well becauseγ reflects the mass anisotropyof the superconducting electrons and not the strongly anisotropic pinning and flux creepeffects found in BSCCO (see Kobayashiet al 1995a, b). The difference between the pinning(or current) anisotropy andγ has been explored in YBCO crystals as a function of oxygenby Thomaset al (1996).
Nelson and Vinokur (1993) predicted that correlated disorder such as columnar defects,twin or intrinsic planes, can transform the vortex solid into a Bose glass. The Bose glassis predicted to have a distinctiveTirr(θ) cusp-like dependence when the field componentalong the disorder is fixed, and is less than or equal to the matching field (one vortex percolumn). The predicted behaviour is shown in figure 18.Tirr increases with increasingabplane field component (increasing tilt) for a vortex glass and decreases with increasing tiltfor a Bose glass. The behaviour ofTirr can be explained more simply. In the unirradiatedcrystals a simple vector model argument along the lines of equation (4.3) can be used. Inthe irradiated crystals, the reduced effectiveness of the columns to pin the vortices as thefield is tilted away from the line-like defect, would produce the cusp-like feature inTirr .The cusp-like feature has been observed inTirr in columnar-defected YBCO crystals (Jianget al 1994, Reedet al 1995), intrinsic planes of YBCO (Kwoket al (1992) as shownin figure 17(b)) and columnar-defected BSCCO (Seowet al 1996) crystals. The latter isillustrated in figure 28. The enhancedTirr(θ) is only observed at high temperatures. Zechet al (1995) have shown how Kes scaling of theHirr line breaks down in irradiated BSCCO
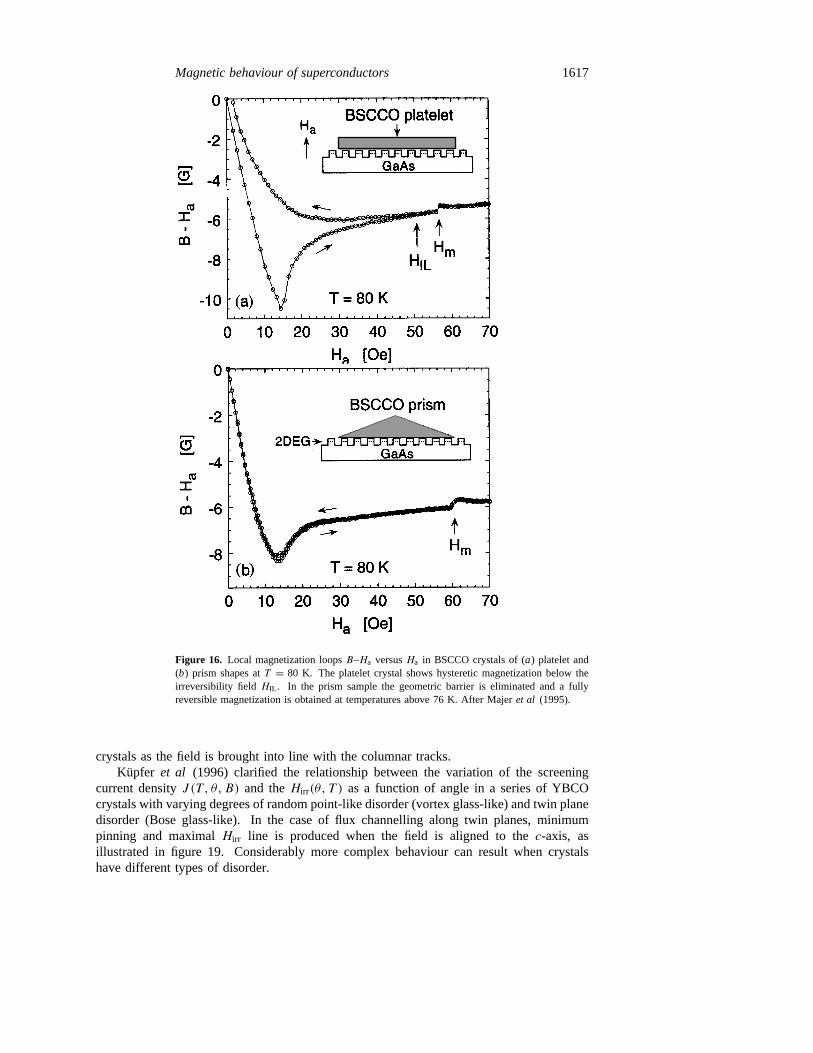
Magnetic behaviour of superconductors 1617
Figure 16. Local magnetization loopsB–Ha versusHa in BSCCO crystals of (a) platelet and(b) prism shapes atT = 80 K. The platelet crystal shows hysteretic magnetization below theirreversibility field HIL . In the prism sample the geometric barrier is eliminated and a fullyreversible magnetization is obtained at temperatures above 76 K. After Majeret al (1995).
crystals as the field is brought into line with the columnar tracks.Kupfer et al (1996) clarified the relationship between the variation of the screening
current densityJ (T , θ, B) and theHirr(θ, T ) as a function of angle in a series of YBCOcrystals with varying degrees of random point-like disorder (vortex glass-like) and twin planedisorder (Bose glass-like). In the case of flux channelling along twin planes, minimumpinning and maximalHirr line is produced when the field is aligned to thec-axis, asillustrated in figure 19. Considerably more complex behaviour can result when crystalshave different types of disorder.
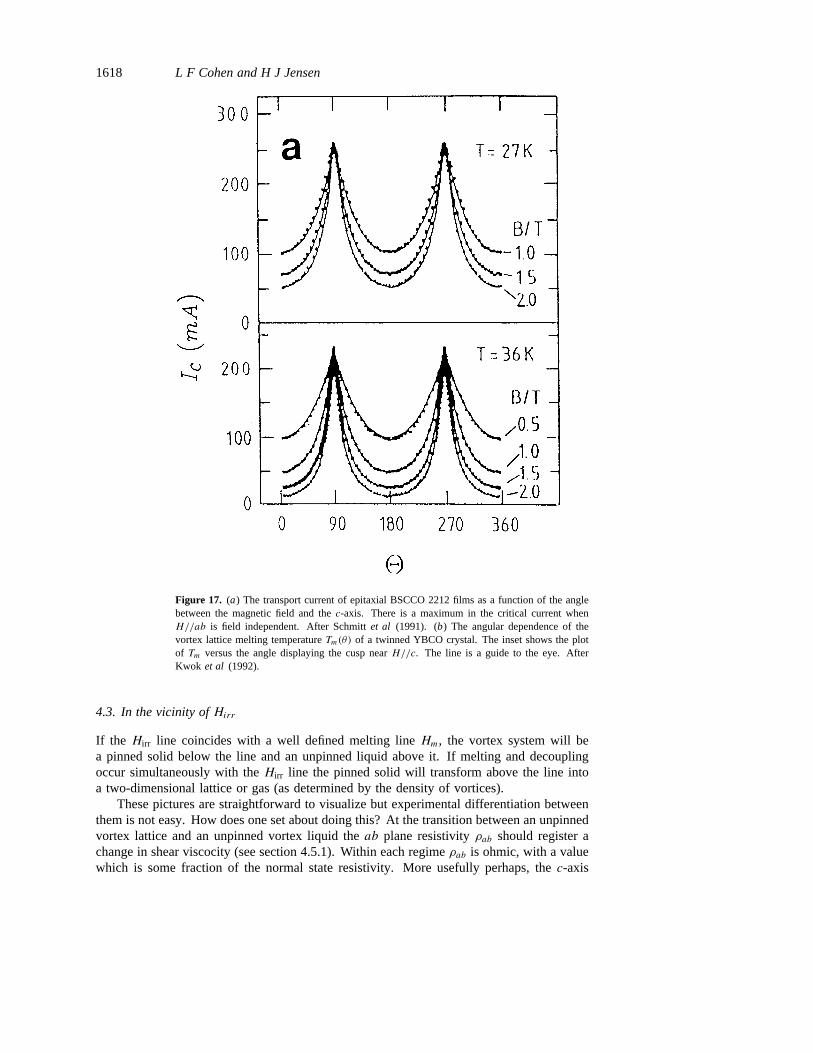
1618 L F Cohen and H J Jensen
Figure 17. (a) The transport current of epitaxial BSCCO 2212 films as a function of the anglebetween the magnetic field and thec-axis. There is a maximum in the critical current whenH//ab is field independent. After Schmittet al (1991). (b) The angular dependence of thevortex lattice melting temperatureTm(θ) of a twinned YBCO crystal. The inset shows the plotof Tm versus the angle displaying the cusp nearH//c. The line is a guide to the eye. AfterKwok et al (1992).
4.3. In the vicinity ofHirr
If the Hirr line coincides with a well defined melting lineHm, the vortex system will bea pinned solid below the line and an unpinned liquid above it. If melting and decouplingoccur simultaneously with theHirr line the pinned solid will transform above the line intoa two-dimensional lattice or gas (as determined by the density of vortices).
These pictures are straightforward to visualize but experimental differentiation betweenthem is not easy. How does one set about doing this? At the transition between an unpinnedvortex lattice and an unpinned vortex liquid theab plane resistivityρab should register achange in shear viscocity (see section 4.5.1). Within each regimeρab is ohmic, with a valuewhich is some fraction of the normal state resistivity. More usefully perhaps, thec-axis

Magnetic behaviour of superconductors 1619
Figure 17. (Continued)
correlation (or line integrity) is lost in the liquid state when the vortices are entangled asa result of thermal disorder (Nelson 1988). Hence, a non-Lorentz geometry withJ andH//c, ρc will be finite in the vortex liquid (where phase slip processes associated withvortex cutting and rejoining will create dissipation). For a three-dimensional vortex latticeρc = 0. A quasi-two-dimensional vortex lattice also has only weakc-axis correlation.Differentiating between a quasi-two-dimensional solid and an entangled three-dimensionalliquid, is yet more subtle.
4.3.1. The disentangled vortex liquid and thec-axis correlation. Fendrichet al (1995)examined the question of pinning in the liquid state by looking at the effect of point-defect electron irradiated on clean untwinned YBCO crystals. In the unirradiated crystalsa linear free flux flow resistivity was found to follow the simple Bardeen Stephen modelρff = (B/φ0Bc2)ρn, whereρn is the normal state resistivity. In the irradiated crystals, thelinear resistivity was depressed relative to the unirradiated at the same reduced temperature,below a certain temperature denotedTp. As the defects in this sytem were uncorrelated,individual vortex pinning was found to be too small to explain the decrease ofρ in the post-irradiated liquid. The authors attributed the depression ofρ to an increase in viscosity asa result of increased liquid entanglement in the irradiated crystals. They took into accountthe viscous shear processes that take place in liquid flow and related this to a plasticenergy proportional to the energy involved in vortex cutting and recombination. They alsofound that the resistive transition was broadened as a function of the point disorder (seesection 4.5.1) and theHirr line was depressed.
Correlated disorder will disentangle, localize (or pin) the vortex liquid as claimed byCivale et al (1991a, b) in the case of columnar defects, and by Flesheret al (1993), in thecase of twin boundaries. The correlation along thec-axis or degree of entanglement can bedetermined by measuringρc directly. A pseudoflux transformer set up along the lines ofGiever (1965), measures vortex line tension which also reflects the strength of thec-axiscorrelation.
In the pseudoflux transformer configuration (figure 21), eight electrical contacts areattached to the crystal. A driving current is made to enter and leave the sample throughleads at the top surface of the sample and external magnetic field is applied perpendicular
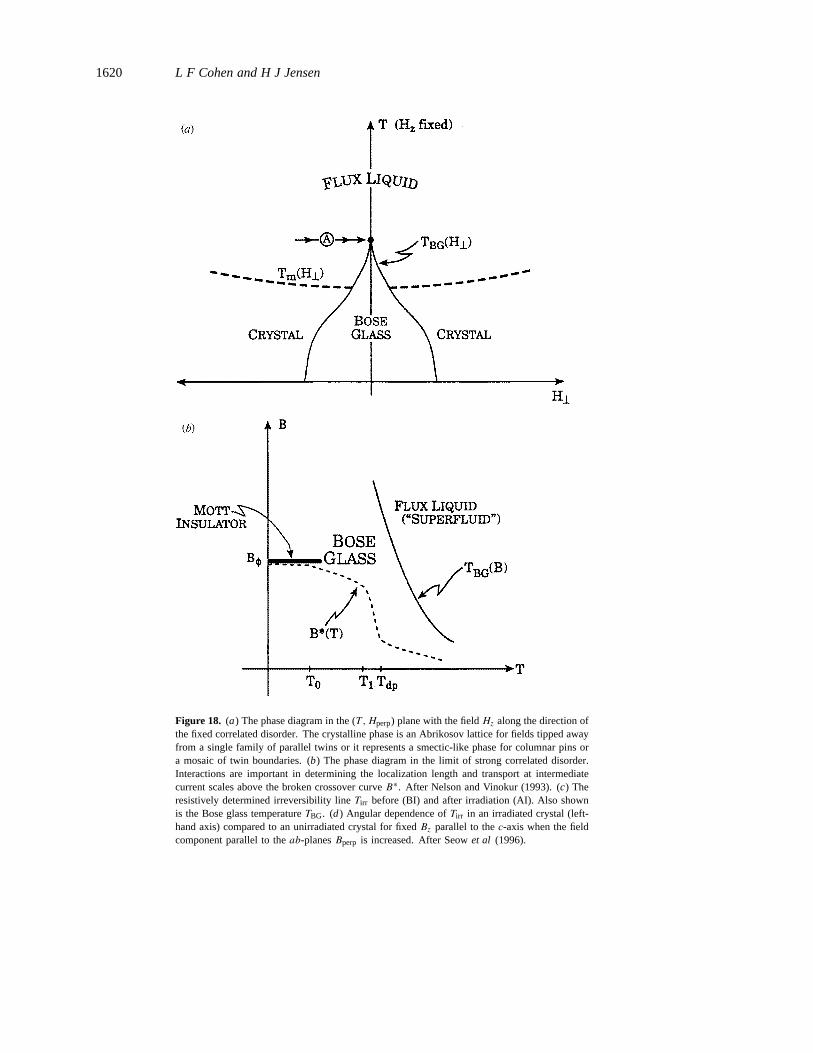
1620 L F Cohen and H J Jensen
Figure 18. (a) The phase diagram in the (T ,Hperp) plane with the fieldHz along the direction ofthe fixed correlated disorder. The crystalline phase is an Abrikosov lattice for fields tipped awayfrom a single family of parallel twins or it represents a smectic-like phase for columnar pins ora mosaic of twin boundaries. (b) The phase diagram in the limit of strong correlated disorder.Interactions are important in determining the localization length and transport at intermediatecurrent scales above the broken crossover curveB∗. After Nelson and Vinokur (1993). (c) Theresistively determined irreversibility lineTirr before (BI) and after irradiation (AI). Also shownis the Bose glass temperatureTBG. (d) Angular dependence ofTirr in an irradiated crystal (left-hand axis) compared to an unirradiated crystal for fixedBz parallel to thec-axis when the fieldcomponent parallel to theab-planesBperp is increased. After Seowet al (1996).

Magnetic behaviour of superconductors 1621
Figure 18. (Continued)
to the superconducting CuO planes. The voltage drop at the surfaceVtop and at the bottomVbot of the sample is measured simultaneously. The system is studied in the linearI–Vregion atT > Tirr as well as in the nonlinearI–V region. (The irreversibility line is definedhere simply as the temperature below which limJ→0 dE/dJ = 0.)
Lopez et al (1994a, b, 1996) used the DC flux-transformer configuration to comparethe behaviour in twinned and untwinned YBCO crystals, and there are quite remarkabledifferences between the two. In the twinned crystals,Vtop 6= Vbot for temperaturesT > Tth
(th for thermal cutting of the vortices). The dependence ofTth is studied as function of theexternal magnetic field. The electric field induced by the motion of vortices are accordingto the Josephson relation (see e.g. Tinkham 1995) given byE ∝ nv wheren denotes thedensity of the moving vortices andv is the velocity with which they move. Since thesame number of vortices are induced in the top of the sample as in the bottom, the authorsconclude that the velocity of the segments of the flux lines in the top of the sample must be
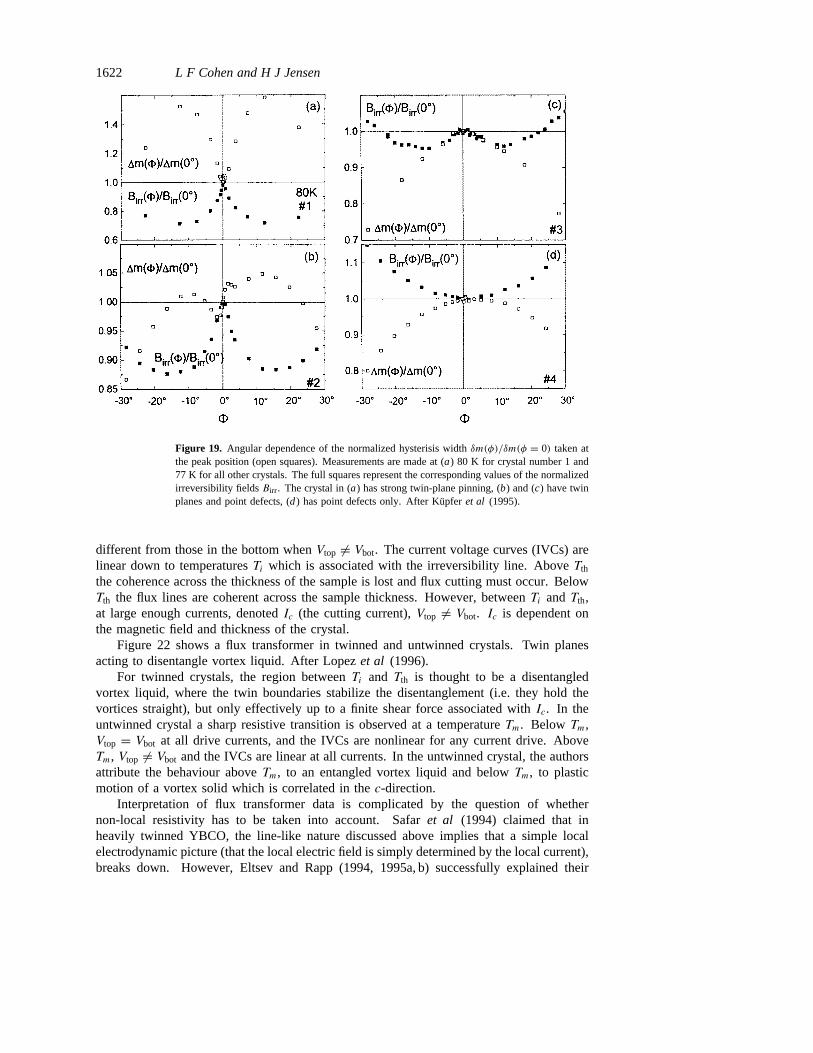
1622 L F Cohen and H J Jensen
Figure 19. Angular dependence of the normalized hysterisis widthδm(φ)/δm(φ = 0) taken atthe peak position (open squares). Measurements are made at (a) 80 K for crystal number 1 and77 K for all other crystals. The full squares represent the corresponding values of the normalizedirreversibility fieldsBirr . The crystal in (a) has strong twin-plane pinning, (b) and (c) have twinplanes and point defects, (d) has point defects only. After Kupfer et al (1995).
different from those in the bottom whenVtop 6= Vbot. The current voltage curves (IVCs) arelinear down to temperaturesTi which is associated with the irreversibility line. AboveTth
the coherence across the thickness of the sample is lost and flux cutting must occur. BelowTth the flux lines are coherent across the sample thickness. However, betweenTi andTth,at large enough currents, denotedIc (the cutting current),Vtop 6= Vbot. Ic is dependent onthe magnetic field and thickness of the crystal.
Figure 22 shows a flux transformer in twinned and untwinned crystals. Twin planesacting to disentangle vortex liquid. After Lopezet al (1996).
For twinned crystals, the region betweenTi and Tth is thought to be a disentangledvortex liquid, where the twin boundaries stabilize the disentanglement (i.e. they hold thevortices straight), but only effectively up to a finite shear force associated withIc. In theuntwinned crystal a sharp resistive transition is observed at a temperatureTm. Below Tm,Vtop = Vbot at all drive currents, and the IVCs are nonlinear for any current drive. AboveTm, Vtop 6= Vbot and the IVCs are linear at all currents. In the untwinned crystal, the authorsattribute the behaviour aboveTm, to an entangled vortex liquid and belowTm, to plasticmotion of a vortex solid which is correlated in thec-direction.
Interpretation of flux transformer data is complicated by the question of whethernon-local resistivity has to be taken into account. Safaret al (1994) claimed that inheavily twinned YBCO, the line-like nature discussed above implies that a simple localelectrodynamic picture (that the local electric field is simply determined by the local current),breaks down. However, Eltsev and Rapp (1994, 1995a, b) successfully explained their

Magnetic behaviour of superconductors 1623
Figure 20. (a) Shows the resistivity of an untwinned YBCO single crystal versus normalizedtemperature, at 4 T for H//c. The sharp resistive transition atTm occurs in the virgin crystal.The transition broadens when the crystal was irradiated with 1 MeV electrons. (b) Showsvoltage–current characteristics before and after electron irradiation at several different reducedtemperaturesT/Tc for H//c. After Kwok et al (1993).

1624 L F Cohen and H J Jensen
Figure 21. Sketch of the Giaever DC flux transformer and pseudo DC flux transformer contactconfiguration. In the latter, due to the anisotropy in the resistivities, injecting current in the topface produces an inhomogeneous current distribution. After de la Cruzet al (1994b).
Figure 22. Normalized resistance versis reduced temperature of twinned and untwinned singlecrystals measured in a flux transformer geometry. After Lopezet al (1996) who argue that twinplanes act to disentangle vortex liquid.
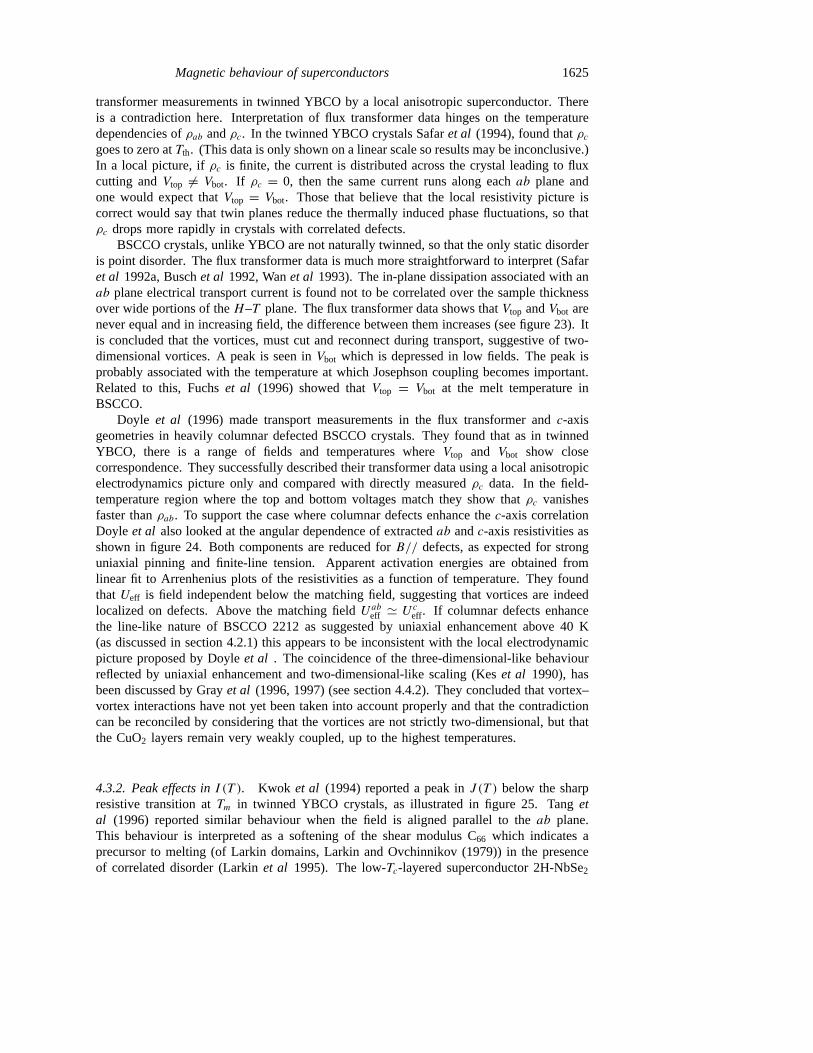
Magnetic behaviour of superconductors 1625
transformer measurements in twinned YBCO by a local anisotropic superconductor. Thereis a contradiction here. Interpretation of flux transformer data hinges on the temperaturedependencies ofρab andρc. In the twinned YBCO crystals Safaret al (1994), found thatρcgoes to zero atTth. (This data is only shown on a linear scale so results may be inconclusive.)In a local picture, ifρc is finite, the current is distributed across the crystal leading to fluxcutting andVtop 6= Vbot. If ρc = 0, then the same current runs along eachab plane andone would expect thatVtop = Vbot. Those that believe that the local resistivity picture iscorrect would say that twin planes reduce the thermally induced phase fluctuations, so thatρc drops more rapidly in crystals with correlated defects.
BSCCO crystals, unlike YBCO are not naturally twinned, so that the only static disorderis point disorder. The flux transformer data is much more straightforward to interpret (Safaret al 1992a, Buschet al 1992, Wanet al 1993). The in-plane dissipation associated with anab plane electrical transport current is found not to be correlated over the sample thicknessover wide portions of theH–T plane. The flux transformer data shows thatVtop andVbot arenever equal and in increasing field, the difference between them increases (see figure 23). Itis concluded that the vortices, must cut and reconnect during transport, suggestive of two-dimensional vortices. A peak is seen inVbot which is depressed in low fields. The peak isprobably associated with the temperature at which Josephson coupling becomes important.Related to this, Fuchset al (1996) showed thatVtop = Vbot at the melt temperature inBSCCO.
Doyle et al (1996) made transport measurements in the flux transformer andc-axisgeometries in heavily columnar defected BSCCO crystals. They found that as in twinnedYBCO, there is a range of fields and temperatures whereVtop and Vbot show closecorrespondence. They successfully described their transformer data using a local anisotropicelectrodynamics picture only and compared with directly measuredρc data. In the field-temperature region where the top and bottom voltages match they show thatρc vanishesfaster thanρab. To support the case where columnar defects enhance thec-axis correlationDoyle et al also looked at the angular dependence of extractedab andc-axis resistivities asshown in figure 24. Both components are reduced forB// defects, as expected for stronguniaxial pinning and finite-line tension. Apparent activation energies are obtained fromlinear fit to Arrenhenius plots of the resistivities as a function of temperature. They foundthatUeff is field independent below the matching field, suggesting that vortices are indeedlocalized on defects. Above the matching fieldUab
eff ' Uceff. If columnar defects enhance
the line-like nature of BSCCO 2212 as suggested by uniaxial enhancement above 40 K(as discussed in section 4.2.1) this appears to be inconsistent with the local electrodynamicpicture proposed by Doyleet al . The coincidence of the three-dimensional-like behaviourreflected by uniaxial enhancement and two-dimensional-like scaling (Keset al 1990), hasbeen discussed by Grayet al (1996, 1997) (see section 4.4.2). They concluded that vortex–vortex interactions have not yet been taken into account properly and that the contradictioncan be reconciled by considering that the vortices are not strictly two-dimensional, but thatthe CuO2 layers remain very weakly coupled, up to the highest temperatures.
4.3.2. Peak effects inI (T ). Kwok et al (1994) reported a peak inJ (T ) below the sharpresistive transition atTm in twinned YBCO crystals, as illustrated in figure 25. Tangetal (1996) reported similar behaviour when the field is aligned parallel to theab plane.This behaviour is interpreted as a softening of the shear modulus C66 which indicates aprecursor to melting (of Larkin domains, Larkin and Ovchinnikov (1979)) in the presenceof correlated disorder (Larkinet al 1995). The low-Tc-layered superconductor 2H-NbSe2

1626 L F Cohen and H J Jensen
Figure 23. The flux transformer data from two high-quality BSCCO 2212 single crystals. Thetemperature dependence of the top and bottom voltagesVt andVb respectively. After Safaretal (1992a).
shows possibly related results for free flux-flow Hall effects, see Bhattacharyaet al (1994).Recently, Yaronet al (1996) reported that small-angle neutron scattering (SANS) from
the flux-line lattice in high-quality niobium crystals reveals drastic structural disorderingnear the peak effect seen in the transport critical current. The flux-line lattice appears todisorder as a function of applied field in a two-step process characterized first, by a completeloss of long-range translational (hexatic glass) followed by a subsequent loss of orientationalorder (vortex glass).
4.3.3. Vortex slush—melting as a function of drive current.The observation of multipleregimes of behaviour caused by the interplay of pinning and current drive may relate to themost recent discussions concerning plastic flow deep in the solid state. Worthingtonet al(1992) first introduced the term vortex slush while investigating the effect of disorder. ThreeYBCO crystals were examined. A ‘clean’ crystal with low screening current density whichwas irradiated with 3 MeV protons with fluence of 1016 cm2, a crystal which was heavilytwinned and point defected, with much higher current density, and finally a crystal which

Magnetic behaviour of superconductors 1627
Figure 24. Flux transformer data from a columnar-defected BSCCO crystal with a 0.5 Tmatching field. The topV23/I and bottomV67/I resistances (see figure 21) are marked as pointson the graph. The calculated secondary apparent resistance from the top andc-axis voltages at1 T, are marked as curves on the graph. The inset shows the temperature dependence of theratio of V67/V23 andV37/V23 at 0.5 T for the same crystal. Note that in this experiment thenumeration for the bottom voltage probes is reversed compared with that indicated in figure 21.After Doyle et al (1996).
was irradiated with 1 GeV Au ions creating columnar defects. For these ‘intermediatelydisordered’ YBCO crystals, two transformations (or a double shoulder) were observed inthe resistivity as a function of current, for small magnetic fields 0.1 T, as illustrated infigure 26. The first being associated with the remnants of the first-order melting transitionTm and the second, at lower temperatures associated with the transition to zero linearρabat Tg. At higher magnetic fields this double transition was washed out.
At temperatures betweenTg andTm, Worthingtonet al (1992) suggested an intermediatevortex ‘slush’, which had finite-linear resistivity greatly reduced from the flux-flow liquidstate aboveTm. The authors demonstrated that the upper transitionTm is dependent onthe current value or is a non-equilibrium ‘current-induced’ melting transformation. Thepossibility of additional heating due to collision of vortices with pinning centres wasconsidered by Worthingtonet al (1992). They assumed that the disorder-induced heatingeffect grows with increasing current drive. Note that this is in contrast to the Koshelevetal (1996b) model which assumes that the effect of the fluctuating component of the pinningforce which produces ‘shaking’ of vortices and an associated ‘shaking’ temperatureTsh isinversely proportional to the drive current and is only a well defined effect for drive currentsless than the critical current.
Later publications by Safaret al also referred to the vortex slush in YBCO as a regionwhere finite transverse correlation has set in as indicated by a sharp resistive jump, but long-range order has not been established throughout the system. Many crystals show a sharpresistivity jump butρab remains finite at lower temperatures. This is more likely to occurin irradiated or twinned crystals and is probably not significant in very clean crystals wherethe onset of long-range order coincides with the resistive jump as discussed in section 4.5.
The term vortex slush may describe the same type of inhomogeneous onset of flux flowas studied by Bhattacharay and Higgins (1993) and Yaronet al (1995).
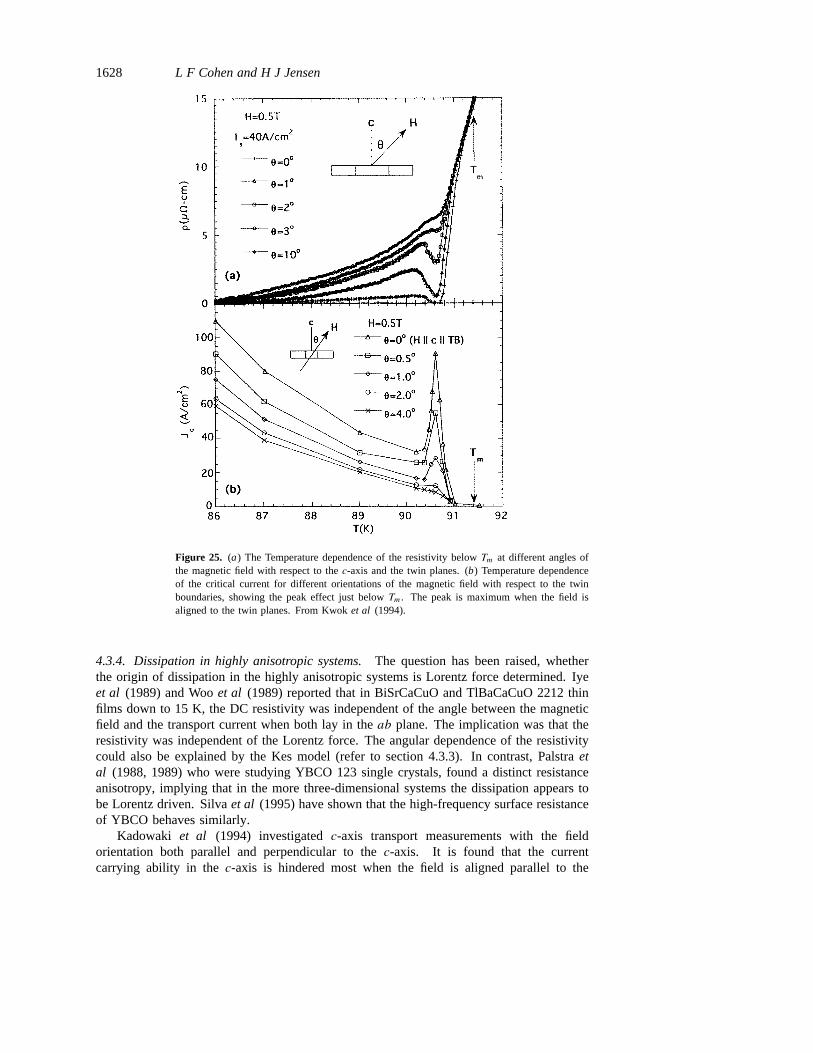
1628 L F Cohen and H J Jensen
Figure 25. (a) The Temperature dependence of the resistivity belowTm at different angles ofthe magnetic field with respect to thec-axis and the twin planes. (b) Temperature dependenceof the critical current for different orientations of the magnetic field with respect to the twinboundaries, showing the peak effect just belowTm. The peak is maximum when the field isaligned to the twin planes. From Kwoket al (1994).
4.3.4. Dissipation in highly anisotropic systems.The question has been raised, whetherthe origin of dissipation in the highly anisotropic systems is Lorentz force determined. Iyeet al (1989) and Wooet al (1989) reported that in BiSrCaCuO and TlBaCaCuO 2212 thinfilms down to 15 K, the DC resistivity was independent of the angle between the magneticfield and the transport current when both lay in theab plane. The implication was that theresistivity was independent of the Lorentz force. The angular dependence of the resistivitycould also be explained by the Kes model (refer to section 4.3.3). In contrast, Palstraetal (1988, 1989) who were studying YBCO 123 single crystals, found a distinct resistanceanisotropy, implying that in the more three-dimensional systems the dissipation appears tobe Lorentz driven. Silvaet al (1995) have shown that the high-frequency surface resistanceof YBCO behaves similarly.
Kadowaki et al (1994) investigatedc-axis transport measurements with the fieldorientation both parallel and perpendicular to thec-axis. It is found that the currentcarrying ability in thec-axis is hindered most when the field is aligned parallel to the

Magnetic behaviour of superconductors 1629
Figure 26. (a) Typical resistivity versus current-density isotherms for a YBCO crystal after3 MeV proton irradiation at a dose of 1016 cm−2. (b) The linear resistivity extracted from theρversusJ isotherms in (a) at low current. (c) The melting current in MA m−2 versus temperaturedefined as the current whereδ ln ρ/δ ln(J ) is maximal. After Worthingtonet al (1992).

1630 L F Cohen and H J Jensen
Figure 26. (Continued)
c-axis and least, when it is aligned along theab planes. Figure 27 illustrates the hugec-axis resistivity broadening in BSCCO in finite field for the Lorentz force-free geometry. Itmight be supposed that the magnetic field between the planes would decouple the planes andultimately destroy the Josephson coupling and that the force-free geometry would supportthe larger current. This is the opposite of what is observed. The experimental observationsare understood to result from the fact that when the field is aligned along thec-axis thephase fluctuations are more deleterious to the current. However, it is not completely clearto what extend theG–L anisotropy masks the Lorentz force dependence.
The pronounced broadening of the resistive transition is a unique phenomenon. Althoughthere are several explanations based on the traditional idea of vortex motion (Gray and Kim1993), several novel approaches have been introduced such as vortex–antivortex excitations,thermal fluctuations of flux lines (Fastampaet al 1993) and superconducting fluctuations(Tsuneto 1988, Ikedaet al 1991, Kadowakiet al 1994). See also Koshelev (1996a) for aphase slip model forc-axis resistivity. On a cautionary note, the validity of the Lorentzforce–free resistive broadening for theH//c//I geometry will depend on the purity of thecurrent path. Any current deviating alongab planes will generate a force geometry.
4.4. The order of the melting transition
It is suggested that the order of the melting transition is a function of the static disorder inthe crystal. In clean samples with negligible pinning the vortex solid–melting transition isexpected to be a first-order transition between a vortex liquid and a well defined Abrikosovlattice. It is thought that disorder drives the transition second order as assumed in thevortex glass scenario (section 2.4.3). The influence of defects and their dimensionality onthe order of the transition and the nature of the glassy or solid phase are key questions stillundergoing clarification. If the disorder is correlated in one or more dimensions then it ispredicted that different kinds of glasses may occur such as a Bose or smectic glass (seeBlatter et al 1994b).
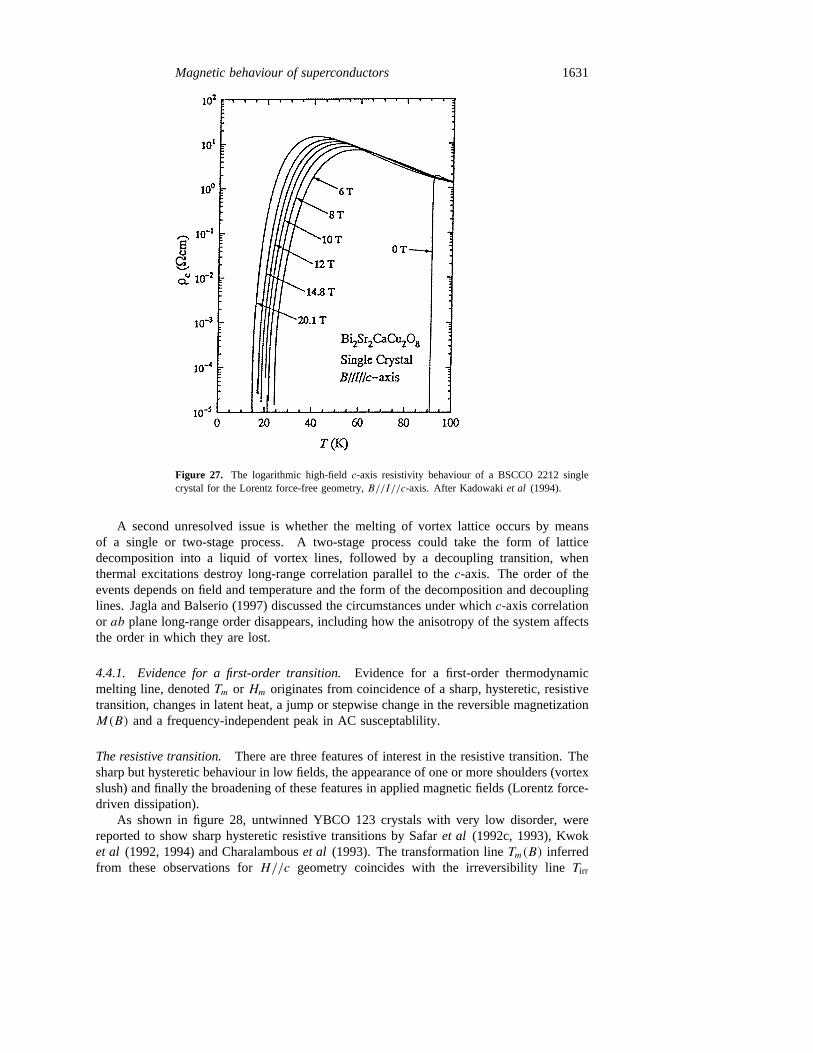
Magnetic behaviour of superconductors 1631
Figure 27. The logarithmic high-fieldc-axis resistivity behaviour of a BSCCO 2212 singlecrystal for the Lorentz force-free geometry,B//I//c-axis. After Kadowakiet al (1994).
A second unresolved issue is whether the melting of vortex lattice occurs by meansof a single or two-stage process. A two-stage process could take the form of latticedecomposition into a liquid of vortex lines, followed by a decoupling transition, whenthermal excitations destroy long-range correlation parallel to thec-axis. The order of theevents depends on field and temperature and the form of the decomposition and decouplinglines. Jagla and Balserio (1997) discussed the circumstances under whichc-axis correlationor ab plane long-range order disappears, including how the anisotropy of the system affectsthe order in which they are lost.
4.4.1. Evidence for a first-order transition.Evidence for a first-order thermodynamicmelting line, denotedTm or Hm originates from coincidence of a sharp, hysteretic, resistivetransition, changes in latent heat, a jump or stepwise change in the reversible magnetizationM(B) and a frequency-independent peak in AC susceptablility.
The resistive transition. There are three features of interest in the resistive transition. Thesharp but hysteretic behaviour in low fields, the appearance of one or more shoulders (vortexslush) and finally the broadening of these features in applied magnetic fields (Lorentz force-driven dissipation).
As shown in figure 28, untwinned YBCO 123 crystals with very low disorder, werereported to show sharp hysteretic resistive transitions by Safaret al (1992c, 1993), Kwoket al (1992, 1994) and Charalambouset al (1993). The transformation lineTm(B) inferredfrom these observations forH//c geometry coincides with the irreversibility lineTirr

1632 L F Cohen and H J Jensen
Figure 28. (a) Normalized linear resistance versus temperature for an untwinned YBCO crystal,using a SQUID picovoltmeter. Note the hysteresis. (b) As in (a) but over a wide temperaturerange. (c) Hysteresis width as a function of the field. After Safaret al (1992c, 1993).
extracted from oscillator experiments in similarly clean crystals.Tm(B) fits rather well tosome of the melting criteria models (Farrell 1994). There are various theoretical derivationsof the vortex-lattice melting line based on the Lindemann criterion, see for example Blatterand Ivlev (1994) and Brandt (1989). Houghtonet al (1989) predict a power law form(which is the form followed byHirr in fully oxygenated YBCO) that is best approximatedby
Bm(T ) = B0(1− T/Tc)α (4.4)
whereα 6 2.
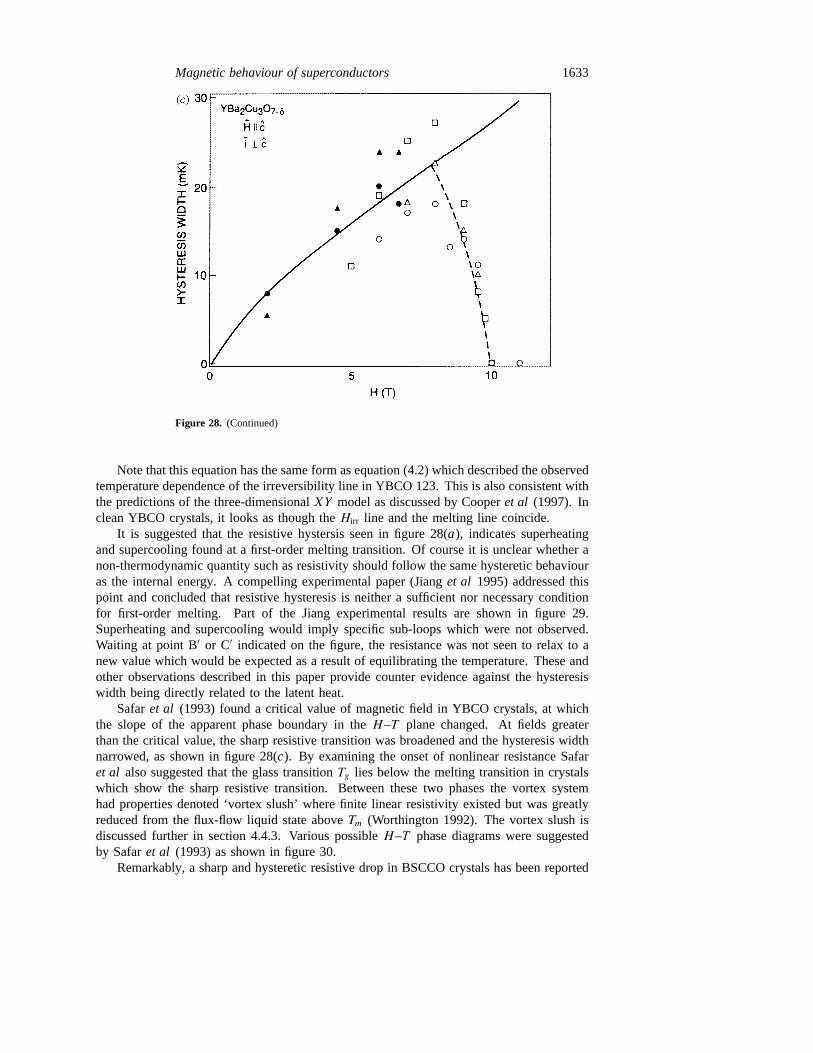
Magnetic behaviour of superconductors 1633
Figure 28. (Continued)
Note that this equation has the same form as equation (4.2) which described the observedtemperature dependence of the irreversibility line in YBCO 123. This is also consistent withthe predictions of the three-dimensionalXY model as discussed by Cooperet al (1997). Inclean YBCO crystals, it looks as though theHirr line and the melting line coincide.
It is suggested that the resistive hystersis seen in figure 28(a), indicates superheatingand supercooling found at a first-order melting transition. Of course it is unclear whether anon-thermodynamic quantity such as resistivity should follow the same hysteretic behaviouras the internal energy. A compelling experimental paper (Jianget al 1995) addressed thispoint and concluded that resistive hysteresis is neither a sufficient nor necessary conditionfor first-order melting. Part of the Jiang experimental results are shown in figure 29.Superheating and supercooling would imply specific sub-loops which were not observed.Waiting at point B′ or C′ indicated on the figure, the resistance was not seen to relax to anew value which would be expected as a result of equilibrating the temperature. These andother observations described in this paper provide counter evidence against the hysteresiswidth being directly related to the latent heat.
Safaret al (1993) found a critical value of magnetic field in YBCO crystals, at whichthe slope of the apparent phase boundary in theH–T plane changed. At fields greaterthan the critical value, the sharp resistive transition was broadened and the hysteresis widthnarrowed, as shown in figure 28(c). By examining the onset of nonlinear resistance Safaret al also suggested that the glass transitionTg lies below the melting transition in crystalswhich show the sharp resistive transition. Between these two phases the vortex systemhad properties denoted ‘vortex slush’ where finite linear resistivity existed but was greatlyreduced from the flux-flow liquid state aboveTm (Worthington 1992). The vortex slush isdiscussed further in section 4.4.3. Various possibleH–T phase diagrams were suggestedby Safaret al (1993) as shown in figure 30.
Remarkably, a sharp and hysteretic resistive drop in BSCCO crystals has been reported

1634 L F Cohen and H J Jensen
Figure 29. The history and time dependence of the resistivity hysteresis. The data points arefor partial heating and cooling cycles, the full curves are full heating and cooling data curves.The inset is a schematic hysteresis and the corresponding subloops based on the assumption ofa first-order phase transition. After Jianget al (1995).
Figure 30. A composite phase diagram for untwinned YBCO 123. The full circles are thehysteretic melting temperaturesTm. Open squares are the vortex glass melting temperaturesTg .Also shown areHc2 and contours of constant resistance. The insets show three posssible phasediagrams. After Safaret al (1993).
by Keeneret al (1997) as shown in figure 31. Sharp features inρ(T ) have also beenreported by Watauchiet al (1996) and Kadowaki (1996). The drop in BSCCO occursat a much lower resistance than in YBCO (0.02% of the normal state resistance versusabout 20% in YBCO) and is much harder to observe. Keeneret al (1997) further claimed

Magnetic behaviour of superconductors 1635
Figure 31. The temperature dependence ofVab with I = 0.1 mA in magnetic fields of 0, 10,20, 30, 40, 50, 70, 100, 120 Oe and higher labelled in the figure. The inset shows the electrodeconfiguration. After Keeneret al (1996).
to observe a two-stage melting transition interpreting a second sharp feature in the liquidphase as suggestive of thermal inter-layer decoupling of vortex lines. In the limit of lowcurrent only, the decoupling and melting lines merge. Evidence of a sharp resistive drop inBSCCO 2212 has also been discussed by Fuchset al (1996), who found that the onset to theresistive drop occurs concurrently with the equilibrium magnetization step/jump discussedin the next section.
In the BSCCO 2212 system similar to YBCO 123, there is strong evidence suggestiveof a critical point, although it is unclear whether in fact data merely reflect a crossover inpinning properties. The field at which it occurs in BSCCO varies from 30–2000 mT andis sensitive to oxygen content (Andoet al 1995, Khaykovichet al 1996) which may betuning the intrinsic anisotropy (Kishioet al 1994) or the disorder. Pastorizaet al (1994a),reported a frequency-independentHirr line extracted from AC suceptability measurements,which became frequency dependent above 36 mT. The reversible magnetization jump alsodisappears at the same field (as discussed below). In agreement with this, Keeneret al(1997), found that the sharp hysteretic resistive drop broadens in fields greater than 70 mT.The crossover field is independent of current, possibly reflecting thermodynamic behaviour.However, the temperatureTm at which the sharp drop in resistance occurs, increases as thecurrent is decreased. This suggests that the resistance drop is associated with a current-dependent shearing mechanism rather than a sudden disappearance of C66 expected at amelting transition.
More direct evidence for a loss of shear viscosity has been measured atTm in a rathernovel experiment by Pastoriza and Kes (1995) where parallel tracks of columnar defectswere introduced in BSCCO crystals. In this configuration, the restoring shear force ofvortices situated in the weak-pinned channels between tracks, were measured by a simpleresistance measurement with the applied current perpendicular to the tracks. Within acontinuum approximation, the current densityJs , which initiates the flow of vortices inthese channels can be expressed asJs = 2AC66/WB whereW is the width of the channel,
1636 L F Cohen and H J Jensen
A is a constant andB is the field. Below a certain field of the order of 30 mT, a finite shearcurrent density is identified in the weakly pinned material. The shear current for fields lessthan 10 mT is indicated by an arrow in figure 32(b). No shear current is supposed to existfor higher fields because it is assumed that the system is in the liquid state at higher fields.Js is interpreted as the force needed to overcome the interaction of the vortex lattice withthe channel boundaries. ForJ greater thanJs , the vortex system will comprise of pinnedvortices and flowing vortex channels. In fact this describes certain kinds of plastic motionvery well. In a sense, this is an observation of current-induced melting (see section 4.43).
Measurements of entropy change.For a sample exhibiting a first-order melting, thereshould be a jump in the latent heat and in the magnetization1M associated with a changeof entropy, such that
1M = [dTm/dH ]1S (4.5)
where1S is the entropy jump per unit volume. The latent heatL per unit volume and themagnetization jump1Mm are related to the entropy change by
L = H/sφ0Tm1Sm (4.6)
1Mm = H/sφ0(dTm/dH)1Sm (4.7)
where s is the spacing of the CuO planes,Tm is the melting temperature andH is theapplied field in Oe andδSm is the entropy change per unit volume. For more extensivediscussions of this topic see Farrellet al (1995, 1996) and Rae (1996).
Magnetization. Experimental detection of the jump in magnetization is difficult becausethe background magnetization change over the same temperature interval of the jump, isabout eight times greater than the magnetization jump itself. Nevertheless, a reversiblemagnetization jump associated with an entropy change of 0.06kb, was first reported inBSCCO crystals in 1994a by Pastorizaet al using DC SQUID magnetometry. Majeret al(1995) repeated these experiments using local Hall sensor arrays. The data is extremelyclean, the discontinuous jump in magnetization is shown in figure 33. Also shown are theestimated entropy change per vortex as a function of temperature. Close toTc, δs appearsto increase rapidly, which the authors suggest could be attributed to critical fluctuations.
Farrell et al (1996) raised concern regarding the estimate of the entropy change inthe Zeldov paper, once the demagnetization factors have been taken into account. This hasbeen considered further by Rae (1996). If associated with a first-order transition, the Zeldovexperiments indicate that the density of vortices increases in the liquid state, resembling thewater–ice transition.
Pastorizaet al (1994a) carried out AC susceptibility using a SQUID as an amplifier.The resulting low-field phase diagram showing a frequency-independent irreversibility line,is shown in figure 34. As first discussed by Pastorizaet al (1994a) and confirmed by Zeldovet al (1990) the transition line terminates at a critical point in low applied fields of the orderof 40 mT at 40 K. The phase diagrams for BSCCO 2212 that emerge are shown in figure 34.This resembles the YBCO phase diagram (see for example figure 30) but shifted down tolower temperature and field scales, as one might anticipate in the more anisotropic system(Koshelevet al 1996).
Farrellet al (1995) repeated the Zeldov experiment using global SQUID magnetometry.The magnitude of theδM change was found to correlate with the strength of the irreversiblesignal as determined by varying the field orientation. This suggests that the change of
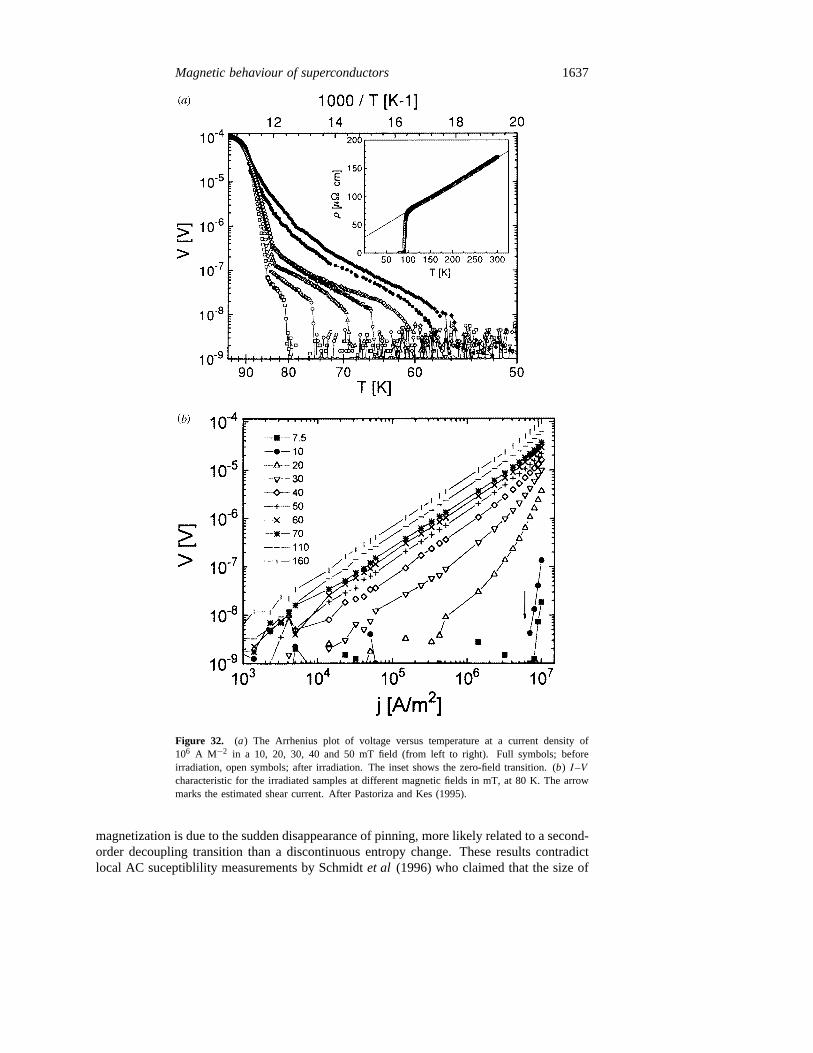
Magnetic behaviour of superconductors 1637
Figure 32. (a) The Arrhenius plot of voltage versus temperature at a current density of106 A M−2 in a 10, 20, 30, 40 and 50 mT field (from left to right). Full symbols; beforeirradiation, open symbols; after irradiation. The inset shows the zero-field transition. (b) I–Vcharacteristic for the irradiated samples at different magnetic fields in mT, at 80 K. The arrowmarks the estimated shear current. After Pastoriza and Kes (1995).
magnetization is due to the sudden disappearance of pinning, more likely related to a second-order decoupling transition than a discontinuous entropy change. These results contradictlocal AC suceptiblility measurements by Schmidtet al (1996) who claimed that the size of

1638 L F Cohen and H J Jensen
Figure 33. (a) A step in local B on crossing the melting line by decreasing the temperature ata constant applied field of 50 Oe. The full curve is a guide to the eye. (b) Entropy change pervortex pre-layer at the melting transition as a function ofTm. The inset gives an expanded viewnear the critical point. The full curves show linear fit to the data. After Zeldovet al (1995a).
the jump inδM is independent of the angle of the magnetic field with respect to thec-axisand also independent of frequency. This issue has yet to be resolved.
Zeldov et al (1995a) reported expressions (see references therein), forδs assuming thetransition atTm to be either vortex lattice melting or decoupling. For melting,δs can becalculated from the internal energy difference between a vortex solid and a vortex liquidper unit volume,δU ' c2
Lc66 wherecL is the Lindemann number. Using an expression forthe melt temperatureTm ' 10.8c2
Lc66εa30 wherea0 is the intervortex spacing andε = 1/γ
reflects the anisotropy, the entropy change per vortex per layer
δs ' (0.1d/ε)(Bm/φ0)−1/2. (4.8)

Magnetic behaviour of superconductors 1639
Figure 34. The low-field phase diagram of BSCCO. From DC magnetization (full circles),from the peak in the in-phase part of the differential susceptibility at selected frequencies. AfterPastorizaet al (1994a). (b) The first-order phase-transition line in BSCCO as measured by field(circles) and temperature (squares) scans. The full curve is a fit to(1− T/Tc)α vortex latticemelting behaviour. The broken curve is a fit to(Tc − T )/T decoupling transition. The insetshows the phase transition lineBm in the vicinity of theTc. After Zeldov (1995a).
Hanaguri et al (1996) and Khaykovichet al (1996) explored the melting line as afunction of oxygen doping which reduces the anisotropy. Both found that the melting linebecomes steeper as the anisotropyγ is reduced, as illustrated in figure 35. Hanagurietal estimatedδs from the size of theδM step. They found that by increasing the oxygencontent, the temperatureδs increases but with increasing magnetic field,δs decreases. Allof these are contradictory to the simple vortex lattice melting picture and these results needfurther explanation.
Welp et al (1996) reported clean results for theδM jump in untwinned YBCO crystalsusing a global SQUID magnetometer. The change ofM in fixed field (temperature) sweepingthe temperature (field) are consistent with the local slope of the melting line, in agreement

1640 L F Cohen and H J Jensen
Figure 35. (a) Magnetic phase diagrams of over-doped and optimally doped BSCCO 2212single crystals. Open diamonds indicate the position of the second peak. The inset shows thetemperature dependence ofδM. (b) The magnetic field dependence ofδs. The curves are guidesto the eye. The inset shows the temperature dependence ofδs. After Hanaguriet al (1996).
with equation (4.7). Figure 36 showsδM andδs versus temperature. Note that the rise inδs close toTc, reported in the BSCCO crystals is apparently absent in YBCO crystals.
As yet no existing theory can fully describe the temperature dependences or amplitudesof Bm or sm in the YBCO and BSCCO system.

Magnetic behaviour of superconductors 1641
Figure 36. (a) The temperature dependence of the magnetization in 4.2 T. The dottedcurve represents a linear extrapolation of the low-temperature variation. The inset shows themagnetization jump in 4.2 T and 2.9 T fields. (b) Top panel: the temperature dependence ofmagnetization and entropy jump. Bottom panel: the phase diagram of the melting transitionfrom resistivity and magnetization measurements. After Welpet al (1996).
Specific heat. Specific heat directly measures a change in latent heat. Energy must besupplied to the crystal as a whole, in order to drive the vortex assembly through the transition.In YBCO this is more than two orders of magnitude greater than the expected latent heat.
Schilling (1996) looked at untwinned YBCO crystals using a differential thermal analysis
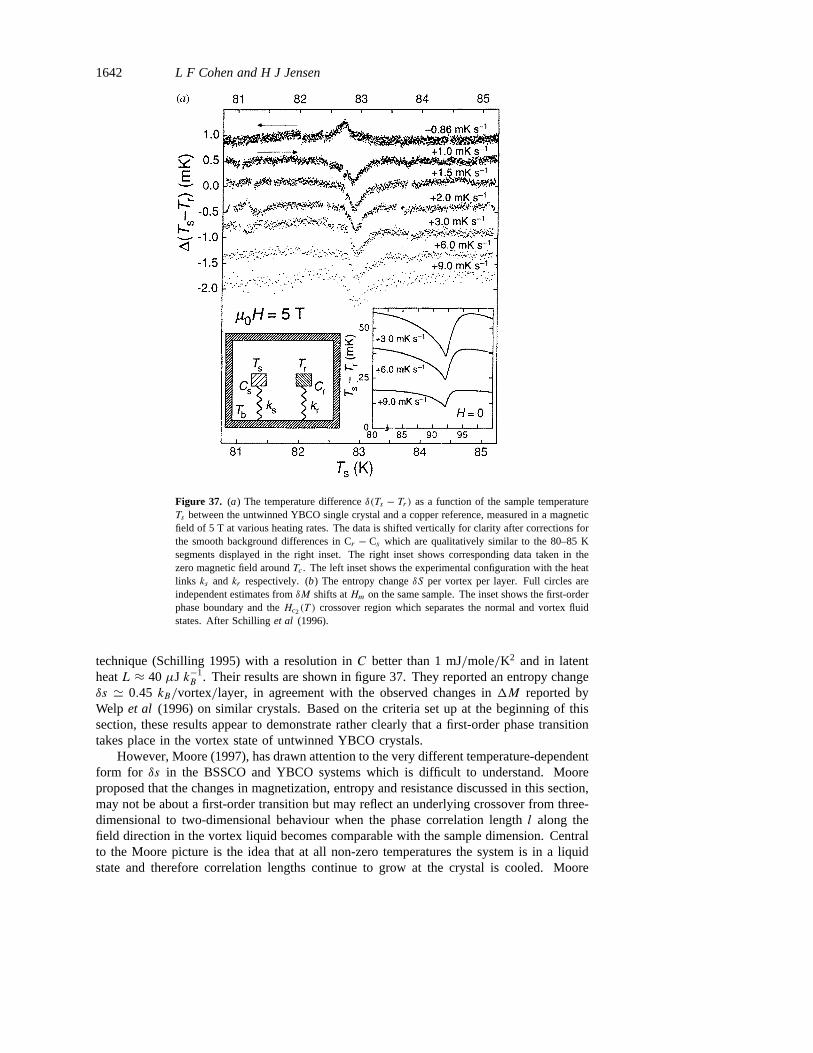
1642 L F Cohen and H J Jensen
Figure 37. (a) The temperature differenceδ(Ts − Tr ) as a function of the sample temperatureTs between the untwinned YBCO single crystal and a copper reference, measured in a magneticfield of 5 T at various heating rates. The data is shifted vertically for clarity after corrections forthe smooth background differences in Cr − Cs which are qualitatively similar to the 80–85 Ksegments displayed in the right inset. The right inset shows corresponding data taken in thezero magnetic field aroundTc. The left inset shows the experimental configuration with the heatlinks ks and kr respectively. (b) The entropy changeδS per vortex per layer. Full circles areindependent estimates fromδM shifts atHm on the same sample. The inset shows the first-orderphase boundary and theHc2(T ) crossover region which separates the normal and vortex fluidstates. After Schillinget al (1996).
technique (Schilling 1995) with a resolution inC better than 1 mJ/mole/K2 and in latentheatL ≈ 40µJ k−1
B . Their results are shown in figure 37. They reported an entropy changeδs ' 0.45 kB/vortex/layer, in agreement with the observed changes in1M reported byWelp et al (1996) on similar crystals. Based on the criteria set up at the beginning of thissection, these results appear to demonstrate rather clearly that a first-order phase transitiontakes place in the vortex state of untwinned YBCO crystals.
However, Moore (1997), has drawn attention to the very different temperature-dependentform for δs in the BSSCO and YBCO systems which is difficult to understand. Mooreproposed that the changes in magnetization, entropy and resistance discussed in this section,may not be about a first-order transition but may reflect an underlying crossover from three-dimensional to two-dimensional behaviour when the phase correlation lengthl along thefield direction in the vortex liquid becomes comparable with the sample dimension. Centralto the Moore picture is the idea that at all non-zero temperatures the system is in a liquidstate and therefore correlation lengths continue to grow at the crystal is cooled. Moore
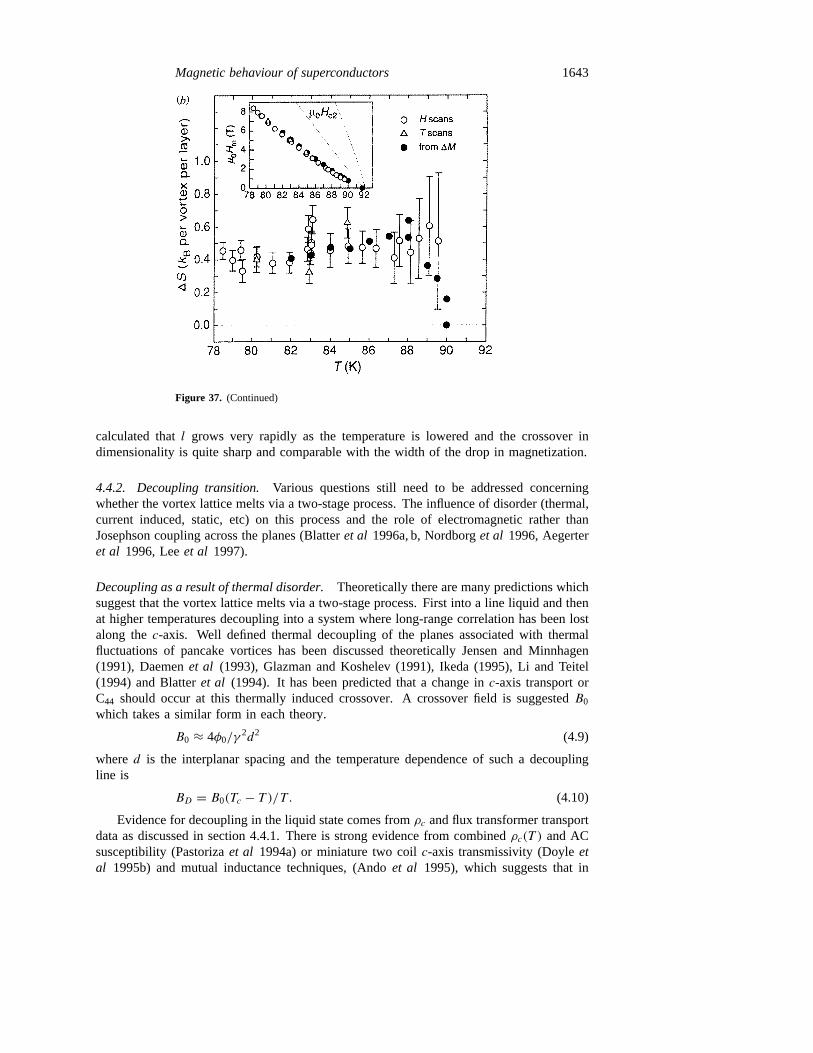
Magnetic behaviour of superconductors 1643
Figure 37. (Continued)
calculated thatl grows very rapidly as the temperature is lowered and the crossover indimensionality is quite sharp and comparable with the width of the drop in magnetization.
4.4.2. Decoupling transition. Various questions still need to be addressed concerningwhether the vortex lattice melts via a two-stage process. The influence of disorder (thermal,current induced, static, etc) on this process and the role of electromagnetic rather thanJosephson coupling across the planes (Blatteret al 1996a, b, Nordborget al 1996, Aegerteret al 1996, Leeet al 1997).
Decoupling as a result of thermal disorder.Theoretically there are many predictions whichsuggest that the vortex lattice melts via a two-stage process. First into a line liquid and thenat higher temperatures decoupling into a system where long-range correlation has been lostalong thec-axis. Well defined thermal decoupling of the planes associated with thermalfluctuations of pancake vortices has been discussed theoretically Jensen and Minnhagen(1991), Daemenet al (1993), Glazman and Koshelev (1991), Ikeda (1995), Li and Teitel(1994) and Blatteret al (1994). It has been predicted that a change inc-axis transport orC44 should occur at this thermally induced crossover. A crossover field is suggestedB0
which takes a similar form in each theory.
B0 ≈ 4φ0/γ2d2 (4.9)
whered is the interplanar spacing and the temperature dependence of such a decouplingline is
BD = B0(Tc − T )/T . (4.10)
Evidence for decoupling in the liquid state comes fromρc and flux transformer transportdata as discussed in section 4.4.1. There is strong evidence from combinedρc(T ) and ACsusceptibility (Pastorizaet al 1994a) or miniature two coilc-axis transmissivity (Doyleetal 1995b) and mutual inductance techniques, (Andoet al 1995), which suggests that in
1644 L F Cohen and H J Jensen
pure unirradiated BSCCO crystals melting and decoupling occur simultaneously. At highfields and low temperatures, Pastoriza’s AC susceptibility data show two dissipation peaks(which are frequency dependent) in the transition to the reversible state. This was originallyinterpreted as a two-step transition to an incoherent liquid phase, attributed to first a loss ofc-axis long-range correlation and then a depinning of pancakes at a field associated with theDC irreversibility line, i.e. inter-plane and intra-plane dissipation occurring consecutively(see Arribereet al 1993 and references therein). More recently these peaks have beenassociated with the resistivity being different in thec-axis and theab plane and the matchingof the skin depths (associated with the resistivity and measuring frequency) to some sampledimension (Suppleet al 1995, Steel and Greybeal 1992). Pastorizaet al (1994a) claimedthat the peak in the AC susceptibility measurement which occurs when the skin depthδ
matches a sample dimensionD for a given frequencyω allowed the author to estimate thec-axis resistivity at this transition, by using the following relationship
D = δ = ρ(T )c2/2φ0ω. (4.11)
Pastorizaet al (1994a) proposed that the frequency-independentHirr line below 36 mT isa true first-order phase transition ending in a critical point at 36 mT (as shown in figure 34).From the high electrical resistance along thec-axis they also claimed that this transitioncoincides with a three-dimensional to two-dimensional crossover. Doyleet al (1995b),explored this further by making miniature two-coilc-axis transmissivity measurements.Figure 38 shows the imaginary part of the transmitted voltage. The real part measuresρcand shows a sharp drop as a function of temperature or magnetic field. (Such sharp dropsin ρab are interpreted as melting, refer to figure 28(a).) Two loss peaks are also observedin the imaginary transmitted voltage as a function of temperature and are attributed toab
(the higher temperature peak) andc-axis currents, as before. As the magnetic field is variedevidence of a sharp transition appears and moves through thec-axis current peak. This isstrongly suggestive of a transition which is associated with a sudden change in the localc-axis resistivity, i.e. a decoupling transition.
In contrast to the above experiments, Wanet al (1994) flux transformer data takenwithin a few Kelvin ofTc was suggestive of a two-step transition surviving up toTc. It wasinterpreted as in-plane dissociation by a Kosterlitz–Thouless-type process first and then aJosephson decoupling transition. However, validity of these conclusions is doubtful becausedata which was taken at very different effective electric field was compared directly. Choetal (1994), showed thatc-axis transport measurements may also indicate a two-step transitionwhere the decoupling line lies above the melting line, in agreement with the Wanet al result.Kadowaki et al (1994) investigatedc-axis transport measurements with the field paralleland perpendicular. From the very nonlinear and hystereticI–C curves in applied magneticfield, a field scale(B∗T ) is identified and represents a measure of the Josephson couplingstrength between adjacent pancake vortices. The authors claimed that at high temperaturesa short-range Josephson coupled–vortex liquid exists above the melting line. However,a note of caution is required here because large transport currents were used in many ofthe experiments which claim to observe a two-step transition and these currents may haveinduced heating and other complications.
Gray et al (1996, 1997) addressed the influence of correlated disorder on the thermaldecoupling transition. In columnar-defected thallium 2212 thin films the films appear tobehave quasi-two-dimensional-like when the field is not closely aligned to the tracks. Whenthe field is aligned along or close to the tracks, directional suppression of theab planeresistivity is observed, implying vortex-line-like behaviour. The authors suggested thatthere is always weak coupling between the plane even at temperatures above the thermal
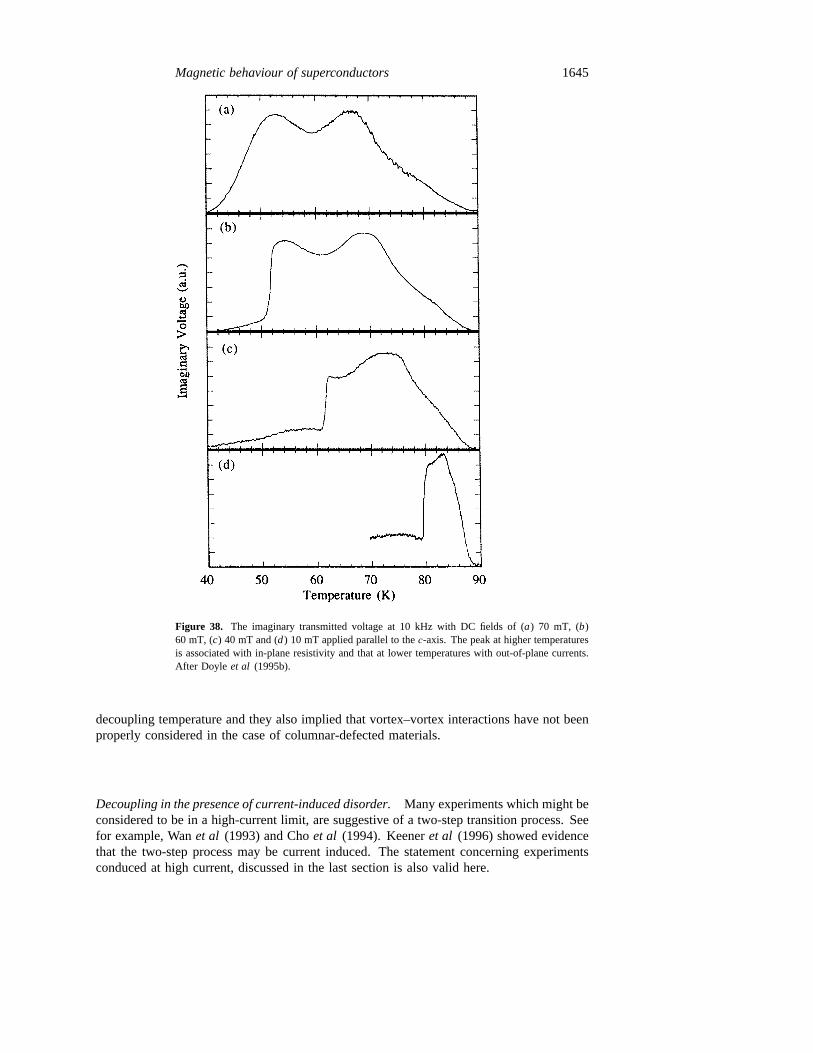
Magnetic behaviour of superconductors 1645
Figure 38. The imaginary transmitted voltage at 10 kHz with DC fields of (a) 70 mT, (b)60 mT, (c) 40 mT and (d) 10 mT applied parallel to thec-axis. The peak at higher temperaturesis associated with in-plane resistivity and that at lower temperatures with out-of-plane currents.After Doyle et al (1995b).
decoupling temperature and they also implied that vortex–vortex interactions have not beenproperly considered in the case of columnar-defected materials.
Decoupling in the presence of current-induced disorder.Many experiments which might beconsidered to be in a high-current limit, are suggestive of a two-step transition process. Seefor example, Wanet al (1993) and Choet al (1994). Keeneret al (1996) showed evidencethat the two-step process may be current induced. The statement concerning experimentsconduced at high current, discussed in the last section is also valid here.

1646 L F Cohen and H J Jensen
Decoupling in the presence of static disorder.There have been many experiments discussedthroughout the text which could be described in this section. Here we focus on thedebate concerning the fate of the melting/decoupling line as the crystal is cooled suchthat underlying static disorder pin vortices and destroy the perfect Abrikosov lattice. Notethat magnetically induced decoupling is not a dimensional crossover as such but will occurin anisotropic systems if the pinning in each layer is sufficiently strong. In this case, thecorrelation between the pancake vortices in thec-direction is destroyed above a crossoverfield B2D, because the magnetic repulsion between pancakes in the same layer becomesstronger than the attraction in adjacent layers.
From various experiments described in sections 4.6.3 and 4.7 it is established that inunirradiated BSCCO, bulk pinning becomes effective at around 40 K and at a crossoverfield H ∗ (see for example Zeldovet al 1995b, Cohenet al 1997). Khaykovichet al (1996)found that below about 40 K the transition to bulk pinning occurs very sharply at the localfield B∗ which is approximately temperature independent and terminates at the critical point(discussed in section 4.5.1). Neutron diffraction data from Cubittet al (1993) suggests thatan ordered vortex lattice (recently denoted Bragg glass), exists in the entire low-field phasebelowH ∗. This has led Khaykovichet al to suggest that althoughBm is a simultaneousfirst-order melting and decoupling transition, in the presence of pinning, this becomes asharp second-order decoupling transition atB∗. This area has to be explored further.
Josephson weak-link behaviour.Passing a transport current along thec-axis would appearto be the most straightforward method to examine the dimensionality issue. Fromc-axis transport measurements Kleineret al (1994a, b) have shown that Josephson weak-link characteristics and Shapiro steps can be obtained in every system at 4.2 K exceptwell oxygenated YBCO 123 crystals. Measurements have not been made at low magneticfields because of severe heating effects. It is quite probable that Josephson behaviourcan only occur once the vortices are pinned, because depinned vortices are susceptible toflux flow which must introduce large phase fluctuations between planes. It is difficult todraw firm conclusions when Josephson behaviour is not observed because of the number ofpossible explanations. An absence of characteristic Josephson behaviour as a function oftemperature could imply a complete loss ofc-axis correlation, an onset of very strongc-axis correlation, depinning or melting into a highly entangled flux liquid (where flux cuttingand reforming must also introduce large plane–plane phase fluctuations). The temperature atwhich Josephson behaviour disappears depends on the family of crystals and the angle of theexternal magnetic field relative to the crystal planes. However, the absence of Josephson-likefeatures in well oxygenated YBCO crystals implies that quasi-two-dimensional behaviour,or decoupling, does not occur in the irreversible regime. No exploration of the effect oftwinning on the observation of weak link behaviour in YBCO crystals, has been reported.
The c-axis conductivity in BSCCO 2212 crystals shows that there is a well definedJosephson current at the field of the order of 2T forH//c for a temperature range between 20and 10 K but that this current shows an anomalous re-entrant behaviour at lower temperaturesand a gradual smoothing out of the Josephson characteristic (Rodriguezet al 1993, Doyleetal 1995a). The re-entrant behaviour has a dependence on magnetic prehistory and might beattributed to an interference between shielding and transport currents (Gordeevet al 1994).
4.4.3. Critical scaling. The general description of critical lengths and timescales ata continuous phase transition were set out in section 3.5, as were the current–voltagecharacteristic (IVC) predictions. Evidence for glassy behaviour can perhaps be better

Magnetic behaviour of superconductors 1647
Table 1. Critical exponents.
z from I–V v from v(z + 2− d) v(z + 2− d) ξvg =Sample Comments FieldT curve J+0 (T ) from z, v from ρL(T ) (ckT /ϕ0J )
1/2
YBCOFilm (1989) T ↓ T g 2//c 4.9 1.7 6.6 6.2 0.3 µmKoch 3//c 5.0 1.6 6.4 6.5
4//c 4.7 1.8 6.4 6.5Film Dekker (1992) T ↑ T g 1//c 1.8± 0.2 6± 2 µ depends
on fieldsmoothly
Film Hui Wu (1993) 1–600 MHz 1–3//c 3.7± 0.46Twinned T ↓ T g 6//c 3.4± 1.5 2± 1 6.5 15µmcrystalGammel (1991) 4.3± 1.5Untwinned T ↓ T g > 10//c ρ = (T − T ∗)Scrystal s = 6± 1Safaret al (1993)Untwinned T ↓ T g 6//ab s = 1.35± 0.15YBCO crystalKwok et al (1994)Untwinned YBCO e-irradiated 1–8//c s = 1.2–3.0crystal T ↓ T g depends on fieldFendrich (1995) and is not
glassy-like
BSCCO Below 20 K s = v(z − 1)BSCCO crystal T ↓ T g c-axis transport s = 8.5Doyle et al (1996) columnar defectedBSCCO crystal T ↓ T g ab-plane transport 8.5Zechet al (1995) columnar defectedBSCCO films T ↓ T g ab-plane transport 9Miu et al (1995)BSCCO crystal T ↓ T g 2–6//c 6.7Safaret al (1992b)
examined well below this transition line. We discuss the evidence for glassy behaviour deepinside the solid, in section 4.6. It is appropriate here to mention that there are problemsassociated with the scaling experiments which have been long understood from computersimulations of continuous transitions. If the experimental window is too small conclusionsmight well be misleading.
If critical exponents can be extracted reliably then this suggests that there is athermodynamic transition and it is second order. The critical exponents must be independentof magnetic field. Critical exponents which appear to vary smoothly with magnetic field aremore suggestive of plastic behaviour. From exponents determined from below the transition,such as Dekkeret al (1992), or in electron-irradiated crystals, there is definitely evidenceof plastic behaviour. In table 1 we examine the consistency of extracted exponents betweendifferent samples. There is some agreement between YBCO films, twinned and untwinnedYBCO crystals (at low temperatures and high fields in the latter case). The exponents changesystematically for different kinds of static disorder, such as columnar defects or intrinsicplanes. Note that in the case of intrinsic planes theoretical studies of inter-layer vortexmelting in two-dimensional layered systems predict that an intrinsically pinned vortex latticecannot melt via a second-order transition (Mikheev and Komomeisky 1991, Korshunov andLarkin 1992). Usually IVCs can only be scaled in a range of temperatures about 2 K widearound the transition for YBCO and about 5 K wide for BSCCO. Occasionally scaling of
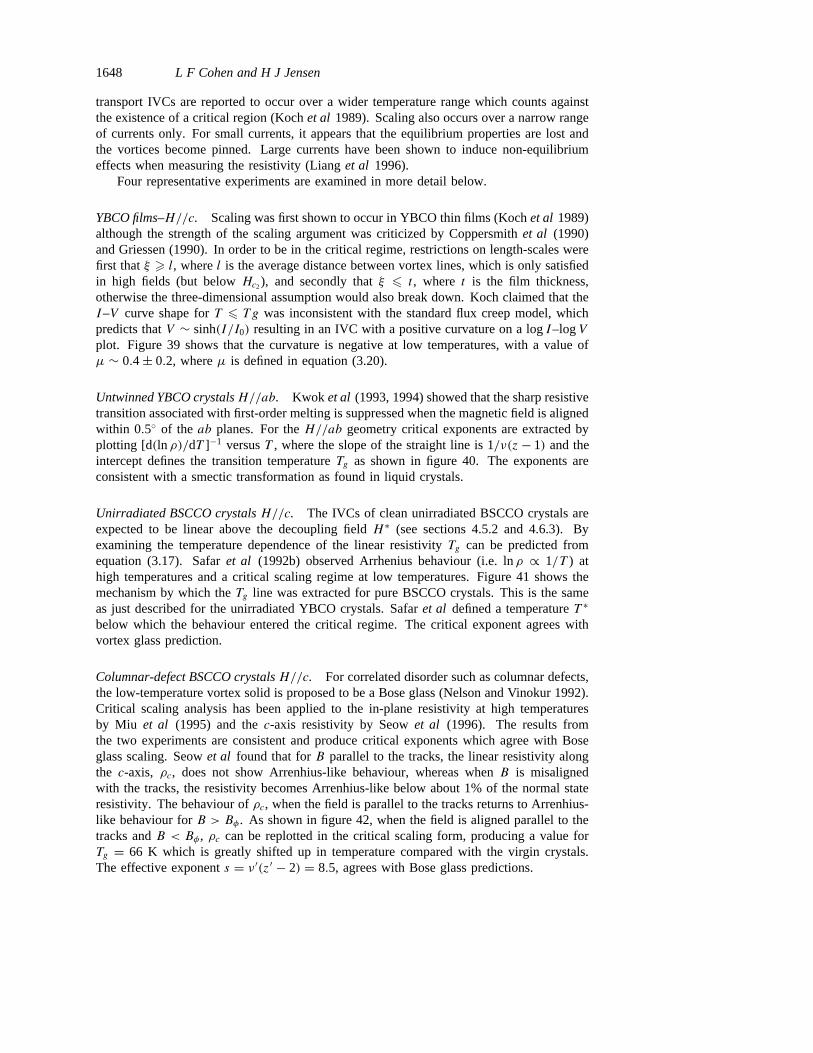
1648 L F Cohen and H J Jensen
transport IVCs are reported to occur over a wider temperature range which counts againstthe existence of a critical region (Kochet al 1989). Scaling also occurs over a narrow rangeof currents only. For small currents, it appears that the equilibrium properties are lost andthe vortices become pinned. Large currents have been shown to induce non-equilibriumeffects when measuring the resistivity (Lianget al 1996).
Four representative experiments are examined in more detail below.
YBCO films–H//c. Scaling was first shown to occur in YBCO thin films (Kochet al 1989)although the strength of the scaling argument was criticized by Coppersmithet al (1990)and Griessen (1990). In order to be in the critical regime, restrictions on length-scales werefirst thatξ > l, wherel is the average distance between vortex lines, which is only satisfiedin high fields (but belowHc2), and secondly thatξ 6 t , where t is the film thickness,otherwise the three-dimensional assumption would also break down. Koch claimed that theI–V curve shape forT 6 T g was inconsistent with the standard flux creep model, whichpredicts thatV ∼ sinh(I/I0) resulting in an IVC with a positive curvature on a logI–logVplot. Figure 39 shows that the curvature is negative at low temperatures, with a value ofµ ∼ 0.4± 0.2, whereµ is defined in equation (3.20).
Untwinned YBCO crystalsH//ab. Kwok et al (1993, 1994) showed that the sharp resistivetransition associated with first-order melting is suppressed when the magnetic field is alignedwithin 0.5◦ of the ab planes. For theH//ab geometry critical exponents are extracted byplotting [d(ln ρ)/dT ]−1 versusT , where the slope of the straight line is 1/ν(z − 1) and theintercept defines the transition temperatureTg as shown in figure 40. The exponents areconsistent with a smectic transformation as found in liquid crystals.
Unirradiated BSCCO crystalsH//c. The IVCs of clean unirradiated BSCCO crystals areexpected to be linear above the decoupling fieldH ∗ (see sections 4.5.2 and 4.6.3). Byexamining the temperature dependence of the linear resistivityTg can be predicted fromequation (3.17). Safaret al (1992b) observed Arrhenius behaviour (i.e. lnρ ∝ 1/T ) athigh temperatures and a critical scaling regime at low temperatures. Figure 41 shows themechanism by which theTg line was extracted for pure BSCCO crystals. This is the sameas just described for the unirradiated YBCO crystals. Safaret al defined a temperatureT ∗
below which the behaviour entered the critical regime. The critical exponent agrees withvortex glass prediction.
Columnar-defect BSCCO crystalsH//c. For correlated disorder such as columnar defects,the low-temperature vortex solid is proposed to be a Bose glass (Nelson and Vinokur 1992).Critical scaling analysis has been applied to the in-plane resistivity at high temperaturesby Miu et al (1995) and thec-axis resistivity by Seowet al (1996). The results fromthe two experiments are consistent and produce critical exponents which agree with Boseglass scaling. Seowet al found that forB parallel to the tracks, the linear resistivity alongthe c-axis, ρc, does not show Arrenhius-like behaviour, whereas whenB is misalignedwith the tracks, the resistivity becomes Arrenhius-like below about 1% of the normal stateresistivity. The behaviour ofρc, when the field is parallel to the tracks returns to Arrenhius-like behaviour forB > Bφ . As shown in figure 42, when the field is aligned parallel to thetracks andB < Bφ , ρc can be replotted in the critical scaling form, producing a value forTg = 66 K which is greatly shifted up in temperature compared with the virgin crystals.The effective exponents = ν ′(z′ − 2) = 8.5, agrees with Bose glass predictions.

Magnetic behaviour of superconductors 1649
Figure 39. The I–V curves at constantT for (a) H = 0.5 T and (b) H = 4 T. The curvesdiffer by intervals of 0.1 and 0.3 K, respectively. After Kochet al (1989).
4.5. Below the irreversibility line—the vortex solid
The conclusion drawn from the transport measurements (reviewed in section 4.4.3) are thatin the presence of disorder IVCs become nonlinear in a way that suggests transitions intoglassy-like solids. This is true for both YBCO and BSCCO. Exotic solids such as smecticglasses, Bose glasses and Bragg glasses reflecting the dominant source of static disorderwere identified. The focus of this section is to examine evidence for the continuity ofbehaviour below the irreversibility line. Vortex behaviour deep inside the vortex solid canonly be explored with magnetic measurements, where low electric fields can be accessed
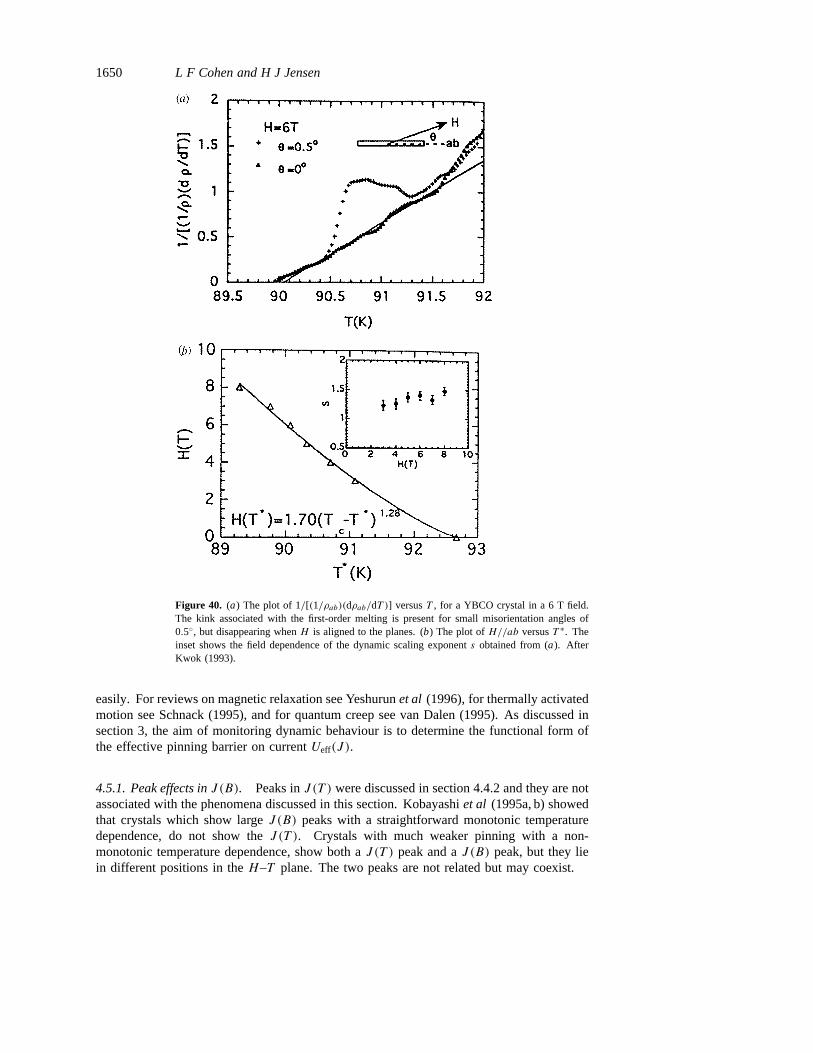
1650 L F Cohen and H J Jensen
Figure 40. (a) The plot of 1/[(1/ρab)(dρab/dT )] versusT , for a YBCO crystal in a 6 Tfield.The kink associated with the first-order melting is present for small misorientation angles of0.5◦, but disappearing whenH is aligned to the planes. (b) The plot ofH//ab versusT ∗. Theinset shows the field dependence of the dynamic scaling exponents obtained from (a). AfterKwok (1993).
easily. For reviews on magnetic relaxation see Yeshurunet al (1996), for thermally activatedmotion see Schnack (1995), and for quantum creep see van Dalen (1995). As discussed insection 3, the aim of monitoring dynamic behaviour is to determine the functional form ofthe effective pinning barrier on currentUeff(J ).
4.5.1. Peak effects inJ (B). Peaks inJ (T ) were discussed in section 4.4.2 and they are notassociated with the phenomena discussed in this section. Kobayashiet al (1995a, b) showedthat crystals which show largeJ (B) peaks with a straightforward monotonic temperaturedependence, do not show theJ (T ). Crystals with much weaker pinning with a non-monotonic temperature dependence, show both aJ (T ) peak and aJ (B) peak, but they liein different positions in theH–T plane. The two peaks are not related but may coexist.

Magnetic behaviour of superconductors 1651
Figure 41. (a) The plot of the inverse logarithmic derivative of the resistance. The full curverepresents a fit to the vortex glass theory withTg = 20.2 K. Deviations from the vortex glasstheory are observed above 28 K. The inset shows the critical exponents for different fields.(b) TheH–T -plane showing the positions ofTg andT ∗ lines. After Safaret al (1992b).
Peak effects were first discussed by Le Blanc and Little (1960) who observed ananomalous peak inJ (T , B) in LTS. Pippard (1969) and Larkin and Ochinnikov proposedthat this peak effect was related to softening the vortex lattice. (A soft lattice can pin morestrongly that a more rigid one and hence can produce current enhancement.) In fact thereare many mechanisms which can generate a peak inJ , see Cambell and Evetts (1972) fora summary.
Most YBCO crystals show an anomalous second peak in the magnetization loop, knownas the fishtail peak, illustrated in figure 43. The peak position has a strong temperaturedependence and in deoxygenated YBCO 123 and in YBCO 124 crystals it exists down

1652 L F Cohen and H J Jensen
Figure 42. The plot ofρc(dρc/dT )−1 and normalizedρc against temperature in a 0.7 T appliedfield. The linear regime is clearly seen below 75 K. The inset shows the exponentn of the Boseglass phase extracted from the resistivity data. After Seowet al (1996).
Figure 43. TheM–H -loop in an untwinned YBCO crystal at 77 K, showing the second peakfeature denoted the fishtail peak. The field at which the peak maximum occurs has a strongtemperature dependence(1− T/Tc)3/2.
to the lowest measured temperatures. The origin of this feature has been much discussedand there is still a lack of consensus in the literature. Explanations include the effectsof macroscopic granularity and underlying defect structure thought to be associated withoxygen vacancies (Daumling et al 1990, Yeshurunet al 1994b, Osofskyet al 1992, Erbet al 1996); simple dynamic effects associated with creep (Cohenet al 1993, Delinet al1992, van Dalen 1995); Krusin-Elbaumet al (1992) discussed theJ (B) peak in terms of aa crossover from single vortex pinning to a pinning of vortex bundles; Perkinset al (1995)suggested that it is related to the interplay between the field dependence of the characteristic

Magnetic behaviour of superconductors 1653
Figure 44. The M–H -loop in a BSCCO crystal at 30 K, showing the second peak featuredenoted the arrowhead peak. The peak only occurs over a limited range of temperatures and isapproximately independent of the field, as indicated by the line labelledBsp in figure 51.
energy and current scales; Zhukovet al (1995) speculated that it is associated with plasticityor with softening C66; and Abulafiaet al (1996) implied that it is related to a crossover fromelastic to plastic vortex behaviour. Very pure untwinned YBCO crystals do not show thisfeature and also highly disordered thin films do not show it. A rough measure of the localstatic disorder in YBCO crystals is the value of the screening current densityJ , at 77 K and1 T. Typical values for untwinned, twinned and proton irradiated YBCO areJ = 102, 103
and 104 A cm−2, respectively. Werneret al (1994) reviewed the effect in many differentsamples and concluded that it is caused by an interaction between the flux-line lattice andthe defect structure and may not be related to a specific defect structure itself. Erbet al(1996) showed how the peak could be reversibly induced by introducing oxygen vacanciesin untwinned YBCO crystals. The effect of point defects and twin planes on the shape ofthe fishtail feature was elucidated by Kupfer et al (1996).
In BSCCO 2212 crystals, an anomalous second peak is observed inJ (B), and becauseof its shape it is known as the arrowhead feature, as shown in figure 44. Unlike the fishtailpeak found in YBCO crystals, the arrowhead feature occurs between approximately 20 Kand 50 K only and the field at which it occurs is almost temperature independent. It canbe altered in size and position by increasing the number of point defects through electronirradiation (Chikumotoet al 1992), by high pressure (Yanget al 1994) or low-temperatureoxygen annealing (Kishioet al 1994), by partial doping of lead onto the barium sites (Caiet al 1994), and by introducing structural defects (Yanget al 1993b). As discussed insections 4.5.2 and 4.6.3, the field at which the arrowhead peak occurs, is associated withmagnetic decoupling of the vortex lattice. Zeldovet al (1994) showed that there is a stronginterplay between surface and bulk pinning effects at the peak field. It was first suggested byChikumotoet al (1992), and later by Yeshurunet al (1994a), Caiet al (1994) and Cohenetal (1997), that the arrowhead feature results from an interplay between static and dynamiceffects. Kishio suggested that crystals which do not show the arrowhead feature (and thereare many which do not), may be so anisotropic that the peak field is unmeasurably low.
1654 L F Cohen and H J Jensen
Alternatively they may have an inhomogeneous distribution of properties resulting in a verygradual change rather than a sharp crossover in behaviour as a function of field.
4.5.2. Unirradiated YBCO 123.From transport measurements we learn that above theHirr line, critical scaling suggests that second-order transitions take place in various elasticvortex solids. The vortex glass exponentµ (defined in equation (3.20)) has been measuredin YBCO thin films by Dekkeret al (1992) and Berghuiset al (1996), from below theHirr
line. In both papers it was reported that theµ value, rather than change abruptly it slowlyvaried between 0.19 and 0.94 as a function of temperature, magnetic field or current. TheDekker results are shown in figure 45. Both the Dekker and the Berghuis observations areimportant because they imply that the pinned vortex system does not necessarily appearglassy, close to theHirr line when determined from below it. That the so-called glassexponent varies continuously with field implies some kind of plastic behaviour.
Turning to magnetic measurements, the first general discussion of evidence of glassybehaviour in YBCO, came from Malozemoff and Fisher (1990). They drew attention to atemperature-independent plateau in the normalized creep rateS(T ). As shown in figure 46,the plateau appeared to have a universal value of 0.03 at fixed fields of the order of 1 T.Expressing the normalized creep rateS = 1/[µ ln(t/t0)] and substitutingµ = 1, at anattempt time of the order of 10−10 s the authors obtained a value ofS = 0.033. The valuefor µ and the attempt time are consistent with vortex glass and collective pinning theories.Malozemoff (1991) also attributed the linear behaviour ofS(T ) at temperatures below theplateau to Anderson–Kim-type thermal activation and above it, to a softening of the glass,possibly suggestive of plastic behaviour in agreement with the transport measurementsdescribed above. Note that Caplinet al (1995), gave a useful explanation of whyS = 0.03could be so frequently observed simply as a result of the similarity in experimental conditionsin which the measurements are made (such as sample size electric and magnetic field rangesetc). In the collective pinning model, many regimes of behaviour are possible in the vortexsolid (refer to Blatteret al (1994b)). Krusin-Elbaumet al (1992) presented evidence formany of these regions from flux creep data in twinned YBCO crystals.
The same regimes of behaviour set out by Malozemoff have been further explored as afunction of magnetic field and temperature in twinned and untwinned 123 and 124 crystals(see Cohenet al 1994b, Perkinset al 1995, Zhukovet al 1995). The Malozemoff ‘plateau’in S(T ) observed at fixed field actually occurs over a wide range of temperatures and fieldsas shown in figure 47, as region 1. Region 1 indicates where a glassy-like solid existsin the H–T plane of well oxygenated YBCO. This region ‘shrinks’ as the crystals aredeoxygenated and made more anisotropic as discussed by Cohenet al (1994c). Perkinset al (1996) discussed that by using equation (3.12), the dynamic normalized creep rateQ = (d lnJ/d lnE)B,T can be expressed as
S = 1/C
(d lnUeff
d lnJ
)B,T
(4.12)
whereC = ln(Bωd/E). A power law Ueff(J ) ∼ J−µ with µ independent ofB andT automatically results in constantS(B, T ). This implies a convex lnE–lnJ curve, asobserved in transport measurement. The form of the lnE–lnJ curve in this regime hasbeen confirmed over a large electric field window by a mixture of relaxation and transportmeasurements, by Gordeevet al (1994), as illustrated in figure 48. Interestingly the authorsconfirmed that the fishtail feature survives in transport measurements at high electric fields.
The region below the Malozemoff plateau inS(T ), is often analysed unreliably becauseit only occurs at low applied field and self-field effects dominate. The region above the

Magnetic behaviour of superconductors 1655
Figure 45. (a) The temperature and (b) the field dependence of the critical exponentµ, on avariety of thin-film YBCO samples. The temperature scale is normalized to the glass temperaturein each case. After Dekkeret al (1992).
plateau inS(T ) was identified by Malozemoff as a softening of the glass. This region ismarked on theH–T plane in figure 47 as region 2. It has also been shown by Cohenet al(1994b) thatS(B) is linear in this region. Using the magnetic scaling analysis Perkinsetal (1995) showed that the linearS(B) is related to a logarithmic lawUeff(J ) dependence.LogarithmicUeff(J ) implies a power law IVC of the formE = J n, where in this casenis inversely dependent onB andT . The behaviour of this regime has been compared withvarious theoretical predictions from collective pinning as shown in figure 49. It is foundthat the field dependence ofU0 andJ0 are not in agreement with that theory in its presentform. Abulafia et al (1996) interpreted the behaviour, in terms of plastic creep resultingfrom dislocation flow. This is consistent with the Dekkeret al (1992) and Berghuiset al(1996) transport results discussed at the beginning of this section.
To summarize, except for regime 1, which survives up to high temperatures at low
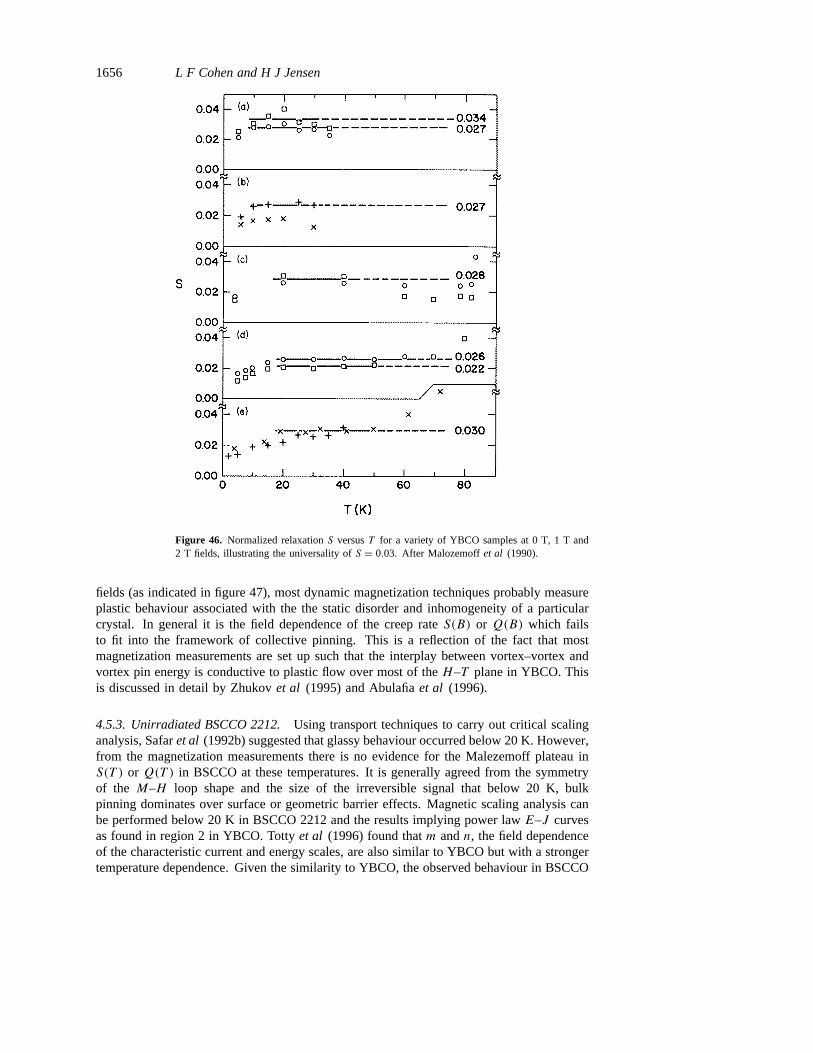
1656 L F Cohen and H J Jensen
Figure 46. Normalized relaxationS versusT for a variety of YBCO samples at 0 T, 1 T and2 T fields, illustrating the universality ofS = 0.03. After Malozemoffet al (1990).
fields (as indicated in figure 47), most dynamic magnetization techniques probably measureplastic behaviour associated with the the static disorder and inhomogeneity of a particularcrystal. In general it is the field dependence of the creep rateS(B) or Q(B) which failsto fit into the framework of collective pinning. This is a reflection of the fact that mostmagnetization measurements are set up such that the interplay between vortex–vortex andvortex pin energy is conductive to plastic flow over most of theH–T plane in YBCO. Thisis discussed in detail by Zhukovet al (1995) and Abulafiaet al (1996).
4.5.3. Unirradiated BSCCO 2212.Using transport techniques to carry out critical scalinganalysis, Safaret al (1992b) suggested that glassy behaviour occurred below 20 K. However,from the magnetization measurements there is no evidence for the Malezemoff plateau inS(T ) or Q(T ) in BSCCO at these temperatures. It is generally agreed from the symmetryof the M–H loop shape and the size of the irreversible signal that below 20 K, bulkpinning dominates over surface or geometric barrier effects. Magnetic scaling analysis canbe performed below 20 K in BSCCO 2212 and the results implying power lawE–J curvesas found in region 2 in YBCO. Tottyet al (1996) found thatm andn, the field dependenceof the characteristic current and energy scales, are also similar to YBCO but with a strongertemperature dependence. Given the similarity to YBCO, the observed behaviour in BSCCO

Magnetic behaviour of superconductors 1657
Figure 47. An experimentally derivedH–T diagram showing regimes of flux creep behaviour.Hp is the critical state penetration field, below which the sample is not fully penetrated,Hd isthe field at which S begins to rise linearly off the 0.03 plateau,Hs is the field at which muchfaster creep occurs andHirr is the irreversibility line. After Cohenet al (1994b).
Figure 48. Current and voltage characterisitics of a YBCO crystal at 87 K at several magneticfields. The higher electric field data is compiled from direct electric transport and the lowerelectric field data is from magnetization measurements. After Gordeevet al (1994).
2212 over most of theH–T plane is also probably some kind of plastic response.van Dalenet al (1996) explored the dynamic creep rateQ variation as a function of an
angle in unirradiated BSCCO crystals at 20 K and found that the measured current density,Q andUc, the characteristic pinning energy, scale with thec-axis component of the externalfield. Niderost et al (1996), observed three regimes of flux creep behaviour measured bylong-time relaxation over seven decades of time, as a function of temperature. Using the
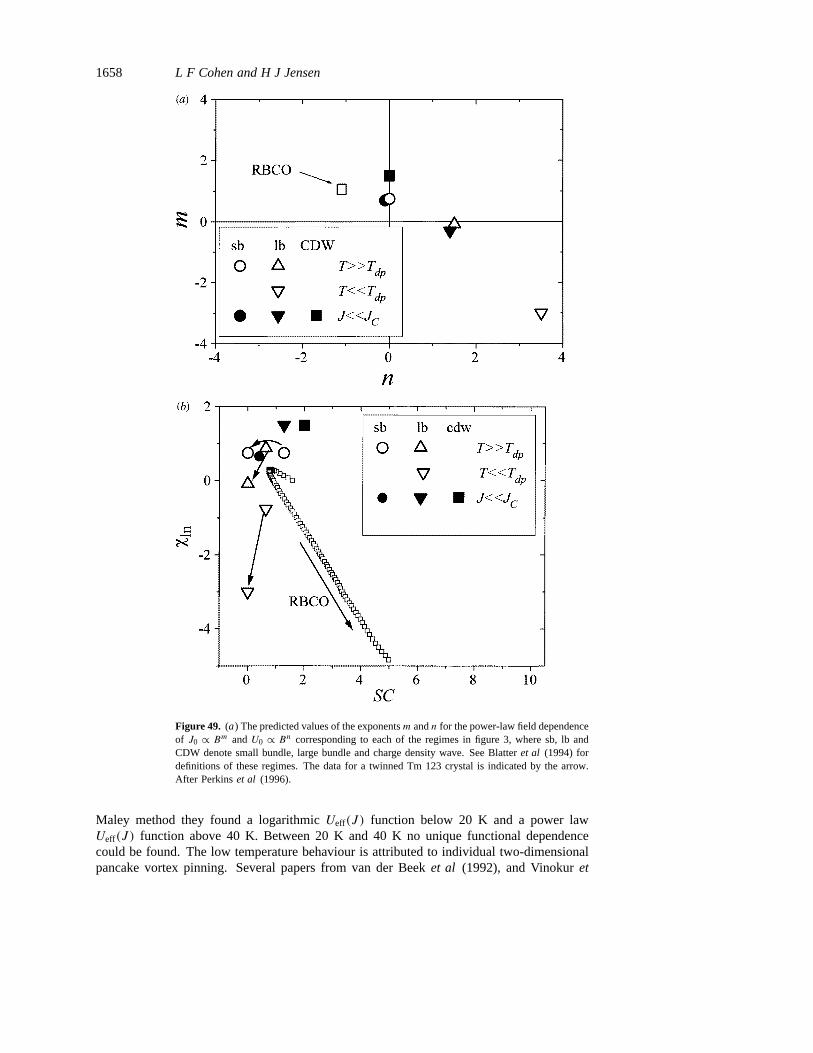
1658 L F Cohen and H J Jensen
Figure 49. (a) The predicted values of the exponentsm andn for the power-law field dependenceof J0 ∝ Bm andU0 ∝ Bn corresponding to each of the regimes in figure 3, where sb, lb andCDW denote small bundle, large bundle and charge density wave. See Blatteret al (1994) fordefinitions of these regimes. The data for a twinned Tm 123 crystal is indicated by the arrow.After Perkinset al (1996).
Maley method they found a logarithmicUeff(J ) function below 20 K and a power lawUeff(J ) function above 40 K. Between 20 K and 40 K no unique functional dependencecould be found. The low temperature behaviour is attributed to individual two-dimensionalpancake vortex pinning. Several papers from van der Beeket al (1992), and Vinokuret
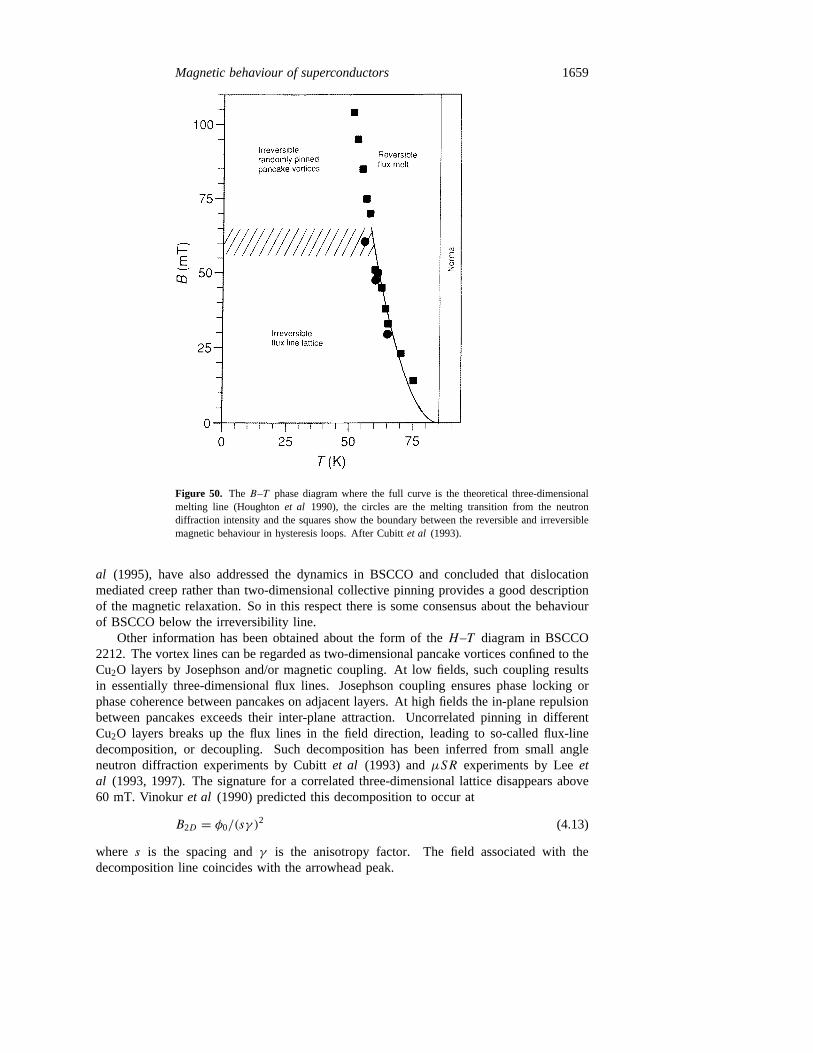
Magnetic behaviour of superconductors 1659
Figure 50. The B–T phase diagram where the full curve is the theoretical three-dimensionalmelting line (Houghtonet al 1990), the circles are the melting transition from the neutrondiffraction intensity and the squares show the boundary between the reversible and irreversiblemagnetic behaviour in hysteresis loops. After Cubittet al (1993).
al (1995), have also addressed the dynamics in BSCCO and concluded that dislocationmediated creep rather than two-dimensional collective pinning provides a good descriptionof the magnetic relaxation. So in this respect there is some consensus about the behaviourof BSCCO below the irreversibility line.
Other information has been obtained about the form of theH–T diagram in BSCCO2212. The vortex lines can be regarded as two-dimensional pancake vortices confined to theCu2O layers by Josephson and/or magnetic coupling. At low fields, such coupling resultsin essentially three-dimensional flux lines. Josephson coupling ensures phase locking orphase coherence between pancakes on adjacent layers. At high fields the in-plane repulsionbetween pancakes exceeds their inter-plane attraction. Uncorrelated pinning in differentCu2O layers breaks up the flux lines in the field direction, leading to so-called flux-linedecomposition, or decoupling. Such decomposition has been inferred from small angleneutron diffraction experiments by Cubittet al (1993) andµSR experiments by Leeetal (1993, 1997). The signature for a correlated three-dimensional lattice disappears above60 mT. Vinokuret al (1990) predicted this decomposition to occur at
B2D = φ0/(sγ )2 (4.13)
where s is the spacing andγ is the anisotropy factor. The field associated with thedecomposition line coincides with the arrowhead peak.

1660 L F Cohen and H J Jensen
Figure 51. The phase diagram of BSCCO showing the penetration fieldHp, the onset ofirreversible shieldingHIS, the bulk irreversibility lineBIR and the low-field phase transition atthe onset of the second peak (arrowhead peak)Bsp. TheHIS line is associated with surface andgeometric barriers and the fits to theoretical forms for these lines are shown. Refer to Zeldovet al (1995b).
Rodriguezet al (1993) reported a gradual smoothing out of the Josephson characteristicbelow 10 K. From these experiments as well as AC susceptibility and DC magnetometry, dela Cruzet al (1994a), suggested that the three-dimensional solid exists up to high magneticfields at the lowest temperatures, modifying the original Cubittet al picture. In fact morerecent neutron and muon data also support this claim Aegerter (1996), Bernhardet al (1995).
Zeldov et al (1995b) produced a detailed phase diagram based on local magnetizationmeasurements using Hall bar arrays. The high-temperature melting line was discussed insection 4.4.1. At temperatures below the suggested critical point, bulk pinning starts to beimportant and the non-equilibrium phase diagram is extremely sensitive to the dimensionalityof the pinning and the superconducting anisotropy.
4.5.4. Irradiated YBCO 123 and BSCCO 2212 crystals.Irradiation enhances the screeningcurrent density, alters the position of the fishtail or arrowhead peak and has been seento enhance or suppress the position ofHirr line in theH–T plane. YBCO crystals showunique lock in signatures to twin planes (Oussenaet al 1996, Zhukovet al 1996), to CuO2
(intrinsic) planes and to columnar defects. As a function of field orientation theHirr line inboth YBCO crystals (Krusin-Elbaumet al 1994a) and BSCCO crystals (Zechet al 1995)display characteristics which resemble the predicted Bose glass cusp at high temperatures.Klein et al (1993a) discussed ‘flux flop’ effects associated with locking onto columns atlow fields and small angles away from thec-axis, have been also been reported. Hardyet al(1996), studied the accommodation of vortices to tilted line defects with various electronicanisotropies from crystals of 2212, 2223, 1223 and 123 composition and also present abrief review of the subject. For both YBCO and BSCCO at low temperatures isotropicpinning enhancement is observed. Directional effect are observed at higher temperatures.The isotropic regime is ascribed to vortices zig-zagging between theab planes and the

Magnetic behaviour of superconductors 1661
Figure 52. The persistent current densityJ and normalized relaxationS as a function oftemperature, for two different irradiated YBCO crystals whereα is the angle of the columnswith respect to thec-axis andBφ is the matching field. After Civaleet al (1996).
columns, keeping their mean-field direction along the applied field. The model invoked byHardy can explain the data but assumes that the vortices are line-like and have line tensionat all temperatures for all crystals studied. This is then in conflict with the concept thatBSCCO is two-dimensional-like at low temperatures. There are few published systematicstudies of the dynamics of vortices in columnar-defected YBCO or BSCCO crystals.
Irradiated YBCO 123. There are many papers on the effect of irradiation on flux dynamics.Initially the influence of point-defect irradiation was studied in YBCO for example by Civaleet al (1990) using 3 MeV protons, and it was found that although the critical current wasenhanced, the irreversibility line and creep rates (and therefore pinning potential) werealmost unaffected. Thompsonet al (1991a, 1993) took the proton irradiation YBCO studiesfurther, using the Maley analysis to extract a functional form for theUeff(J ) function which

1662 L F Cohen and H J Jensen
agreed with collective pinning theory. These experiments were only carried out at onefixed field of 1 T. They concluded that the quasi-exponential temperature dependence ofthe current density results from flux creep and is not inconsistent with collective pinningtheory. Sunet al (1992), examined both the temperature and field dependence of theactivation energy in proton irradiated YBCO.Ueff(H) was found to vary asH−α and αdepended on both temperature and current.
Schindler (1991) found that fast neutrons with energy greater than 0.1 MeV increasedthe critical current anddecreasedthe creep rate, implying a change of the pinning potentialin YBCO crystals. Konczykowskiet al (1991) found that irradiating with 5.3 GeV lead ionsincreased theHirr line dramatically and the critical current and also decreased the creep rate.Civale et al (1991a, b) found similar current andHirr line enhancement from discontinuoustracks of amorphous material produced by 580 MeV Sn ions at 30◦ to the c-axis. Theycalled these tracks columnar defects. The effectiveness of the tracks were explored as afunction of angle of applied field, irradiation dosage and temperature. It was found that thetracks were most effective when the field was aligned parallel to the tracks. Above 88 K,Hirr was independent of dose and similar to the unirradiated crystal.
Flux dynamics of columnar-defected twinned YBCO crystals was first studied byKonczykowskiet al (1991, 1993). Long-time relaxation was found to be non-logarithmicexhibiting an increase in effective barrier for flux creep with decreasing current in agreementwith vortex loop nucleation as proposed by Nelson and Vinokur (1992). The experimentswere only made at very low applied fields of the order of 50 mT. Long-time relaxationmeasurements have since been made by Civaleet al (1996) at fields less than the matchingfield and by Thompsonet al (1997) at fields both less than and greater than the matchingfield. Both groups report that for fields less than the matching field the normalized creep rateS(T ), shows an anomolous rise at intermediate temperatures associated with a drop in currentdensityJ as shown in figure 52. The peak in the creep rate occurs at the same temperaturesthat the Malozemoff plateau inS(T ) was observed (see unirradiated YBCO section) and thevalue ofS at the peak is of the order of six times that of the plateau (Thompsonet al 1997).Civaleet al considered that at low temperatures and low fields, the vortices are individuallypinned by the columns, and vortex–vortex interactions are negligible. As the vortex densityincreases the elastic interactions increase and when the elastic energy is comparable withthe pinning energy of individual tracks, collective effects take over.Bcr is the field at whichthis occurs and it is temperature dependent. At low temperaturesBcr ' Bφ . According toBose glass theory, initial stages of relaxation should take place, via half-loop excitations.As relaxation progresses, the size of the vortex loops become of the order of the columnartrack spacing, so that segments of the same vortex can sit on neighbouring columns. Furtherrelaxation should be dominated by double-kink excitation. At the intermediate temperatureswhere the peak inS(T ) is observed the relaxation is anomalous in the sense that it varies non-monotonically with time suggestive of two competing processes. Civaleet al suggested thatthese processes are associated with double kink excitations of individually pinned vorticesat short times and collective behaviour at longer times. Thompsonet al offer a very similarinterpretation, also consistent with the Nelson and Vinokur (1992, 1993) Bose glass theory.At B > Bφ , the peak inS(T ) is not observed.
Beauchampet al (1995) explored Bose glass/quantum creep behaviour at millikelvintemperatures in YBCO crystals irradiated with 605 MeV Xe ions. They found that therelaxation rate can be divided into three regimes of behaviour depending on ratio of vortexdensity to columnar defect density. Quantum creep occurs in the dilute limit, vanishingmagnetic relaxation is observed atB = Bφ in the so-called Mott insulator phase, and forB > Bφ they observe a temperature-dependent vortex motion. Larkin and Vinokur (1995)

Magnetic behaviour of superconductors 1663
extended the original Bose glass theory to consider the dilute and dense vortex limits. Grayet al (1996, 1997) showed that because of vortex–vortex interactions, the columns can effectpinning at fields many times more than the matching field at low temperatures.
In the Bose glass theory for parallel columns, once a segment of vortex reaches anadjacent column, (by thermal activation or quantum-mechanical process), the remainingpart of the vortex can follow at no additional cost. Hwaet al (1993) proposed that pinningwould be improved even further if the columnar tracks were splayed or tilted with respectto each other. In the splayed glass phase, during the vortex hop, an ever increasing segmentof line is forced into an energetically unfavourable region. Krusin-Elbaumet al (1994a,1996) and Schusteret al (1995a, b) (who also imaged the flux penetration into crystals usingmagneto-optics), confirmed that there is a dramatic enhancement ofJ when the vorticesare splayed. Devereauxet al (1995) raised the issue that the misalignment of the magneticfield and the columns may weaken the localization of the vortices and reduce theHirr line.
4.5.5. Irradiated BSCCO 2212 crystals.Thompsonet al (1992) first pointed out that theangular selectivity seen in YBCO at high temperatures is absent in BSCCO 2212 crystalsirradiated with 580 MeV Sn ions at 20 K, although the current density and the irreversibilityline are enhanced over the unirradiated crystals. Kleinet al (1993b, 1994) later showedthat in fact uniaxial enhancement is observed in irradiated BSCCO crystals, but only above40 K. The loss of angular selectivity is either related to the fact that the system is moretwo-dimensional-like at low temperatures or that random point defect rather than columnarpinning dominates or a combination of both. Leghissaet al (1993) demonstrated loss oftranslational order in columnar-defected BSCCO using high-resolution Bitter patterns.
TheHirr line was studied by Krusin-Elbaumet al (1994b) for BSCCO crystals irradiatedwith 1 GeV Au ions along thec-axis. A well defined crossover fieldBcr ∼ 1/2Bφ wasestablished. BelowBcr the Hirr ∝ (1− T/Tc)α whereα is dose dependent. AboveBcrthe Hirr(T ) line is linear. The paper also discusses the influence of columnar defects onthe melting scenario. Moshchalkovet al (1994) found close agreement with the Bose glasstheory predictions and the temperature dependence of the critical current density extractedfrom the magnetization measurements. Unfortunately because these measurements weremade at remanence, the influence of self-field effects is unclear. Konczykowskiet al(1995) found giant, strongly non-logarithmic magnetic relaxation in irradiated BSCCO 2212.The authors converted their flux creep data intoI–V curves and extracted values for theexponentµ in the interpolation formulae. (The interpolation formulae can be used becausethe functional form of dependences characterizing the Bose glass phase are identical to thatfor the vortex glass phase and predict power lawUeff(J ) form.) The values ofµ were foundto agree with the Nelson and Vinokur predictions at 60 K and at fields much less than thematching field. Although there is quite a bit of scatter in the data, the predictedµ = 1
3 forvariable range hopping was observed.
Steelet al (1996) pointed out the fact that columnar defects influence electrical propertiesof Tl 2212 thin films up to fields at least 40 times that of the matching field, demonstratingthe importance of vortex–vortex interactions and also suggesting that the matching field hasno sharp significance. This is not inconsistent with Bose glass theory.
5. Summary of the questions at the brink of resolution
The complexity of the theoretical description of the vortex state has increased significantlywith the contributions from statistical mechanics produced after the discovery of the HTS

1664 L F Cohen and H J Jensen
(Blatter et al 1994). The balance of the competition between the three energy scales: thevortex–vortex interaction, the vortex–pinning interaction, and the thermal energy can leadto many very different types of behaviour.
Many of these theoretical developments are concerned with the equilibrium phases andthe nature of the transition between these phases in various model systems. As such thesetheoretical developments might not be of direct relevance to experiments. One of theproblems encountered when dealing with the flux system in real superconductors is theirreversibility, i.e. non-equilibrium features, encountered whenever pinning is relevant.
A result of the massive investigation into the properties of the flux system in HTS isthat today we have a fairly precise idea about the cardinal questions still to be completelyresolved. It is useful to distinguish between situations where the pinning energies arenegligible compared with the vortex–vortex interaction energy and the thermal energy andthe situation where the pinning energy is competing with these two energy scales.
In the case where pinning can be neglected we believe that the following list of issuesare among the most important yet to be settled and in fact are sufficiently well posed toallow a resolution in the near future.
(1) From sharp drops in magnetization, entropy and resistance, clean untwinned YBCOand BSCCO crystals appear to show evidence of a line of first-order transition in theH–T phase diagram. However, theoretical concerns have raised the issue whether finite-size effects associated with a crossover from two- to three-dimensional behaviour could beproducing the semblance of a transition.
(2) In clean crystals is there always coincidence of decoupling and melting? How doespinning influence this coincidence?
(3) Are the regions of theH–T plane fundamentally similar for YBCO and BSCCObut occurring at different fields and temperatures refelcting the different anisotropy. Basedon the entropy changeδS(T ) extracted from the magnetization jump in YBCO and BSCCOare there fundamental differences?
(4) Is there any evidence for a line liquid?If the temperature is low enough, the pinning originating from static disorder in the
superconducting material always becomes relevant. One of the lessons of recent researchis that the specific nature of the defects that cause the pinning is important. Point pins,columnar pins, pinning by planes all induce very different behaviour. The following listof questions are what we believe is the most well defined and important issues to clear upwhen pinning cannot be neglected.
(5) In isotropic point disordered crystals transport critical scaling analysis appears toshow evidence for a vortex glass transition at the irreversibility line. In magnetizationmeasurements, the field dependences ofUc andJc cannot easily be reconsiled with glassyor collective pinning behaviour close to the irreversibility line measured at much lowerelectric fields. This inconsistency may be related to the fact that over most of theH–Tplane, the magnetization measurement whereJ � Jc, sets up plastic rather than elasticbehaviour. Alternatively, is it plausible that the transport measurements whereJ is muchcloser toJc is simply not sampling the transition effectively and cannot determine the natureof the solid?
(6) In what way do columnar defects change the nature of the coupling betweenthe planes in the more anisotropic materials? How does the influence they have on thereversible properties impact their influence on irreversible pinning behaviour? There is aninconsistency in the way that columnar defects influence reversible properties within 1–2 Kof Tc, but do not act as effective pinning sites within 25–20 K ofTc.
(7) In the presence of correlated disorder is there sufficient evidence to prove the
Magnetic behaviour of superconductors 1665
existence of Bose glass behaviour?(8) What is the thermodynamic equilibrium phase of the vortex system at low
temperatures in the presence of point disorder? (This question has not been addressedby the experiments discussed in this review.)
The strive to understand the magnetic properties of the HTS has inspired an amazinglyvigourous theoretical as well as experimental line of research. Although many questionsare still open this research has been particularly fruitful in causing many new developmentsin the statistical mechanics and lead to a number of beautiful experiments. Not only hasthe research influenced basic science, in this way it has also laid the needed foundationfor the phenomenological understanding needed to turn the HTS into technologically usefulmaterials. This is a field of reseach with the potential of many new important developmentsin future years.
Acknowledgments
The authors would like to thank Yuri Bugislavsky, Richard Doyle, Gary Perkins and SashaZhukov for their critical reading of the text and insightful discussions. Support from theEPSRC (LC grant no GR/K60916, and HJJ grant no GR/J36952) and from the Royal Societyare gratefully acknowledged.
References
Abrikosov A A 1957 Sov. Phys.–JETP5 1174Abulafia Y et al 1996Phys. Rev. Lett.77 1596Abulafia Y, Shaulov A, Wolfus Y, Prozorov R, Burlachkov L, Majer D, Zeldov E, Vinokur V M and Yeshurun Y
1997J. Low-Temp. Phys.(MOS96)107 455–65Abulafia Y, Shaulov A, Wolfus Y, Prozorov R, Burlachkov L, Yeshurun Y, Majer D, Zeldov E and Vinokur V M
1995Phys. Rev. Lett.75 2404Aegerter C M, Lee S L, Keller H, Forgan E M and Lloyd S H 1996Phys. Rev.B 54 15 661–4Almasan C C, de Andrade M C, Dalichaouch Y, Neumeier J J, Seaman C L, Maple M B, Guertin R G, Kurie M V
and Garland J C 1992Phys. Rev. Lett.69 3812Ando Y, Komiya S, Kotaka Y and Kishio K 1995Phys. Rev.B 52 3765–8Angadi M A, Shen Z X and Caplin A D 1991Physica185–9C2195–6Arribere A, Pastoriza H, Goffman M F, de la Cruz F, Mitzi D B and Kapitulnik A 1993Phys. Rev.B 48 7248Bardeen J and Stephen M J 1965Phys. Rev.A 140 1197Bauhofer W, Biberacher W, Gegenheimer B, Joss W, Kremer R K, Mattausch H, Muller A and Simon A 1989
Phys. Rev. Lett.63 2520Beasley M R, Labusch R and Webb W W 1969Phys. Rev.181 682Beauchamp K M, Rosenbaum T F, Welp U, Crabtree G W and Vinokur V M 1995 Phys. Rev. Lett.21 3942–5Berghuis P, Herzog R, Somekh R E, Evetts J E, Doyle R A, Baudenbacjer F and Campbell A M 1996 Physica
256C 13–32Berlinsky A J, Fetter A L, Franz M, Kallin C and Soinien P I 1995Phys. Rev. Lett.75 2200Bernhard C, Wenger C, Niedermayer C, Pooke D M, Tallon J L and Kotaka Y 1995Phys. Rev.B 52 R7050Bhattacharya S and Higgins M J 1993Phys. Rev. Lett.70 2617Bhattacharya S, Higgins M J and Ramakrishnan T V 1994Phys. Rev. Lett.73 1699Blatter G, Feigle’man M V, Geshkenbein V B, Larkin A L and Vinokur V M 1994 Rev. Mod. Phys.66 1125–388Blatter G and Geshkenbein V 1996bPhys. Rev. Lett.77 4958–61Blatter G, Geshkenbein V, Larkin A and Nordborg H 1996aPhys. Rev.B 54 72–5Blatter G and Ivlev B I 1994 Phys. Rev.B 50 10 272Blatter G, Ivlev B and Nordborg H 1993Phys. Rev.B 48 10 448Brandstatter G, Yang X, Sauerzpf F M and Weber H W 1995Inst. Ohys. Conf Ser. No 148ed D Dew-Hughes
(Bristol: IOP)Brandt E H 1989Phys. Rev. Lett.63 1106——1995Rep. Prog. Phys.58 1465–594
1666 L F Cohen and H J Jensen
Brawner D A, Ong N P and Wang Z Z 1993aPhys. Rev.B 47 1156–9Brawner D A, Schilling A, Ott H R, Huag R J, Ploog K and von Klitzing K 1993bPhys. Rev. Lett.71 785Bulaevskii L N, Ledvij M and Kogan V G 1992Phys. Rev. Lett.68 3773Bulaevskii L N, Vinokur V M and Maley M P 1996Phys. Rev. Lett.77 936Busch Ret al 1992Phys. Rev. Lett.69 522Cai X Y, Gurievich A, Larbalastier D C, Kelley R J and Onellion M, Berger H and Margaritondo G 1994Phys.
Rev.B 50 16 774–7Cambell A M and Evetts J 1972J. Adv. Phys.72 199Caneiro G 1995Phys. Rev. Lett.75 521Caplin A D, Cohen L F, Perkins G P and Zhukov A A 1994aSuper. Sci. Tech.7 412–22Caplin A D, Perkins G P and Cohen L F 1995Super. Sci. Tech.8 366–7Charalambous M 1991Phys. Rev. Lett.71 436Charalambous M, Chaussy J, Lajay P and Vinokur V 1993Phys. Rev. Lett.71 436Chen T and Teitel S 1995Phys. Rev. Lett.74 2792Chikumoto N 1994M2–HTSC III, GrenobleChikomoto N, Konczykowski M, Motohira N and Malozemoff A P 1992Phys. Rev. Lett.69 1260Cho J H, Maley M P, Fleshler S, Lacerda A and Bulaevskii L N 1994 Phys. Rev.B 50 6493Civale L, McElfresh M W, Marwick A D, Holzberg F H, Feild C, Thompson J R and Christen D K 1991aPhys.
Rev.B 43 13 732Civale L, Matwick A D, McElfresh M W, Worthington T K, Malozemoff A P, Holtberg F H, Thompson J R and
Kirk M A 1990 Phys. Rev. Lett.65 1164Civale L, Matwick A D, Worthington T K, Kirk M A, Thompson J R, Krusin-Elbaum L, Sun Y, Clem J R and
Holtzberg F H 1991bPhys. Rev. Lett.67 648Civale L, Pasquini G, Levy P, Nieva G, Casa D and Lanza H 1996Physica 263C 389–95Cohen L F, Lacey D, Perkins G P, Caplin A D, Xu M, Dou S X, Klestov S A and Voronkova V L 1994aProc.
2nd Int. Symp. of HTS Tunneling Phenomena (Donetsk, Ukraine)Cohen L F, Laverty J R, Perkins G P, Caplin A D and Assmus W 1993Cryogenics33 352–6Cohen L F, Perkin G, Caplin A D, Zhukov A A, Klestov S A, Voronkova V L, Kupfer H, Wolf T and Abell
S 1994cProc. 7th Int. Workshop on Critical Currents in Superconductorsed H W Weber (Alpbach: WorldScientific) p 271
Cohen L F, Totty J T, Perkins G K, Doyle R A and Ladowaki K 1997Supercond. Sci. Technol.10 195Cohen L F, Zhukov A A, Perkins G K, Jensen H J, Klestov S A, Voronkova V L, Abell S, Kupfer H, Wolf T and
Caplin A D 1994bPhysica 230C 1–8Cooper J R, Loram J W, Johnson J D, Monod P, Enriquez H, Hodby J and Changkang C 1997 3DXY scaling of
the irreversibility line of YBO crystalsPhys. Rev. Lett.79 1730–3Coppersmith S N, Inui M and Littlewood P B 1990Phys. Rev. Lett.64 2585Coppersmith S N and Millis A J 1991Phys. Rev.B 44 7799Cubitt R et al 1993Nature365 407Daemen L L, Bulaevskii L N, Maley M P and Coulter J Y 1993Phys. Rev. Lett.70 1167——1993Phys. Rev.B 47 11 291Daumling M, Seuntjens J M and Larbalestier D C 1990Nature346 332Deak J, Hou L, Metcalf P and McElfresh M 1995Phys. Rev.B 51 705de Gennes P G 1966Superconductivity of Metals and Alloys(New York: Benjamin)de la Cruz F, Lopez D and Nieva G (1994b)Phil. Mag. B 70 773de la Cruz F, Pastoriza H, Lopez D, Geoffman M F, Aribere A and Nieva G 1994aPhysica235V 83–6Dekker C, Eidelloth W and Koch R H 1992Phys. Rev. Lett.68 3347–50Delin K A, Orlando T P, McNiff E J, Foner S, Vandover R B, Schneemeyer L F and Waszczak J 1992Phys. Rev.
B 46 11 092–101Devereaux T P, Scalettar R T, Zimanyi G T, Moon K and Loh Y 1995Phys. Rev. Lett.75 4768Doyle R A, Johnson J D, Hussey N E, Campbell A M, Balakrishnan G, Paul D McK and Cohen L F 1995aPhys.
Rev.B 52 9368Doyle R A, Liney D, Seow W S, Campbell A M and Kadowaki K 1995bPhys. Rev. Lett.75 4520Doyle R A, Seow W S, Yan Y, Campbell A M, Mochiku T, Kadowaki K and Wirth G 1996Phys. Rev. Lett.
77 1155–8Eltsev Y, Holm W and RappO 1994Phys. Rev.B 49 333Eltsev Y and RappO 1995Phys. Rev.B 51 9419——1995Phys. Rev. Lett.C 75 2446Erb A, Genoud J Y, Marti F, Daumling M, Walker E and Flukiger R 1996J. Low Temp. Phys.105 1023–8
Magnetic behaviour of superconductors 1667
Faleski M C, Marchetti M C and Middleton A A 1996 Phys. Rev.B 54 12 427Farrell D E 1994 Physical Properties of High Temperature Superconductors I–Ved D M Ginsberg (Singapore:
World Scientific)Farrell D Eet al 1996Phys. Rev.B 53 11 807–16Farrell D E, Kwok W K, Welp U, Fendrich J and Crabtree G W 1995Phys. Rev.B 51 9148Fastampa R, Giura M, Marcon R, Sarti S and Silva E 1993Supercond. Sci. Technol.6 53Farrell D E, Rice J P and Ginsberg D M 1991Phys. Rev. Lett.67 1165Feigel’man M V, Geshkenbein V B, Ioffe L B and Larkin A I 1993 Phys. Rev.B 48 16 641Feigel’man M V, Geshkenbein V B, Larkin A I and Vinokur V M 1989 Phys. Rev. Lett.63 2303Feigel’man M V and Vinokur V M 1990 Phys. Rev.B 41 8986Fendrich J A, Kwok W K, Giapintzakis J, van der Beek C J, Vinokur V M, Fleshler S, Welp U, Viswananathan H K
and Crabtree G W 1995Phys. Rev. Lett.74 1210Fischer K H 1993 Physica210C 1–2179–87——1994Physica235C 42691–2Fischer P, Busch R, Neumuller H W, Ries G and Braux H F 1992Supercond. Sci. Technol.5 4403Fisher M P A 1989Phys. Rev. Lett.62 1415Fisher D S, Fisher M P A andHuse D A 1985Phys. Rev. Lett.55 2924——1991Phys. Rev.B 43 130Flesher S, Kwok W K, Welp U, Vinokur V M, Smith M K, Downey J and Crabtree G W 1993Phys. Rev.B
47 14 448Flippen R B, Askew T R, Fendrich J A and van der Beek C J 1995Phys. Rev.B 52 R9882–5Fuchs D T, Zeldov E, Majer D, Doyle R A, Tamegai T, Ooi S and Konczykowski M 1996Phys. Rev.B 54 R796–9Gammel P L, Bishop D J, Rice J P and Ginsberg D M 1992Phys. Rev. Lett.68 3343Gammel P L, Huse D A, Kleinman R N, Batlogg B, Ogelsby C S, Bucher E, Bishop D J, Mason T E and Martensen
K 1994 Phys. Rev. Lett.72 278–81Gammel P L, Schneemeyer L F and Bishop D J 1991Phys. Rev. Lett.66 953Gao L, Xue Y Y, Hor P H and Chu C W 1991Physica177C 438–44——1992Phys. Rev.B 46 14 325Gao Z X, Osquiquil E, Maenhoudt M, Wuyts B, Libbrecht S and Bruynseraede Y 1993Phys. Rev. Lett.71 3210Giamarchi T and Le Doussal P 1996Phys. Rev. Lett.76 3408Giever I 1965Phys. Rev. Lett.15 825Glazman L I and Koshlev A E 1991Phys. Rev.B 43 2835Gordeev S N, Jahn W, Zhukov A A, Kupfer H and Bush A A 1994Proc. of 7th Int. Workshop on Critical Currents
in Superconductorsed H Weber (Singapore: World Scientific) p 165Gray K E 1994Applied Supercond.2 295–304Gray K E, Hettinger J D, Miller D J, Washburn B R, Moreau C, Lee C, Glagola B G and Eddy M M 1996Phys.
Rev.B 54 3622–7Gray K E and Kim D H 1993Phys. Rev. Lett.70 1693Gray K E, Steel D G, Hettinger J D, Miller D J, Washburn B R, Ware M, Parkman J T, Yoder M E, Moreau C
and Eddy M M 1997IEEE Trans. Appl. Supercon.7 1987–92Griessen R 1990Phys. Rev. Lett.64 1674–8——1991Physica175C 315–23Grigorieva I V, Steeds J W, Balakrishnan G and Paul D M 1995 Phys. Rev.B 51 3765Grigorieva I V, Steeds J W and Sasaki K 1993Phys. Rev.B 48 16 865Gurevich A and Kupfer A 1993Phys. Rev.B 48 6477–85Gurevich A, Kupfer H, Runtsch B, Meier-Hirmer R, Lee D and Salama K 1991Phys. Rev.B 44 12 090–3Gyorgy E M, van Dover R B, Jackson K A, Schneemeyer L F and Waszczak J V 1989Appl. Phys. Lett.55 283Hagen C W and Griessen R 1989Phys. Rev. Lett.62 2857–60Hanaguri T, Tsuboi T, Maeda A, Nishizaki T, Kobayashi N, Kotaka Y, Shimoyama J and Kishio K 1996Physica
256C 111–18Hao Z and Clem J R 1991Phys. Rev.B 43 7622Hardy V, Wahl A, Hert S, Ruyter A, Provost J, Groult D and Simon Ch 1996Phys. Rev.B 54 656–64Hebard A F and Fiory A T 1982 Physica109–110B1637Houghton A, Pelcovits R A and Sudbo A 1989Phys. Rev.B 40 6763Howson M, Overend N, Lawrie L D and Salamon M B 1995Phys. Rev.B 51 11 984Hubbard M A, Salamon M B and Veal B W 1996Physica259C 309Hubener R P 1979Magnetic Flux Structures in Superconductors (Springer Series in Solid State Sciences 6)(Berlin:
Springer)
1668 L F Cohen and H J Jensen
Huse D A and Majumdar S N 1993Phys. Rev. Lett.71 2473Hussey N E, Carrington A, Cooper J R and Sinclair D C 1994Phys. Rev.B 50 13 073–6Hussey N E, Cooper J R, Doyle R A, Lin C T, Liang W Y, Sinclair D C, Balakrishnan G, Paul D M and
Revcolevschi A 1996Phys. Rev.B 53 6752–8Hwa T, LeDoussal P, Nelson D R and Vinokur V M 1993 Phys. Rev. Lett.71 3545Ikeda R 1995J. Phys. Soc. Japan64 1683Ikeda R, Ohmi T and Tsuneto T 1991J. Phys. Soc. Japan60 1051Iye Y, Nakamra S and Tamegai T 1989Physica159C 433Iye Y, Oguro I, Tamegai T, Datars W R, Motohira N and Kitazawa K 1992Physica199C 154–60Jagla E A and Balseiro C A 1997Phys. Rev.B 55 3192–9Jahn W, Gordeev S N, Zhukov A A, Kupfer H and Wolf T 1995Inst. Phys. Conf. Series148 267–70Jensen H J 1995J. Phys. A: Math. Gen.28 1861Jensen H J, Brass A and Berlinsky A J 1988aPhys. Rev. Lett.60 1676Jensen H J, Brass A, Brechet Y and Berlinsky A J 1988bPhys. Rev.B 38 9235Jensen H J and Minhagen P 1991Phys. Rev. Lett.66 1630Jiang W, Yeh N-C, Reed D S, Kriplani U Beam D A, Konczykowski M, Tombrello T A and Holtzberg F 1994
Phys. Rev. Lett.72 550Jiang W, Yeh N-C, Reed D S, Kriplani U and Holtzberg F 1995Phys. Rev. Lett.74 1438Jirsa M, Pust L, Schnack H G and Griessen R 1993Physica207C 85–96Jirsa M, van Dalen A J J,Koblischka M R, Ravi Kumar G and Griessen R 1994Critical Currents in Superconductors
ed H W Weber (Singapore: World Scientific) p 221Josephson B D 1965Adv. Phys.14 419Kadowaki K 1996Physica263C 164Kadowaki K, Songliu Y and Kitazawa K 1994Supercond. Sci. Technol.7 519–40Keener C D, Trawick M L, Ammirata S M, Hebboul S E and Garland J C 1997Phys. Rev.B 55 R708–11Kes P H, Aarts J, Vinokur V M and van der Beek C J 1990Phys. Rev. Lett.64 1063Kes P H, Vanderbeek C J, Maley M P, McHenry M E, Huse D A, Menken M J V andMenovsky A A 1991 Phys.
Rev. Lett.67 2383–6Khaykovich B, Zeldov E, Majer D, Li W, Kes P H and Konczykowski M 1996Phys. Rev. Lett.76 2555Kishio K, Shimoyama J, Kotaka Y and Yamafuji K 1994Proc. 7th Int. Workshop on Critical Currents in
Superconductorsed H W Weber (Singapore: World Scientific) p 339Kiss T and Yamafuji K 1996Physica258C 197–212Klein L, Yacoby E R, Tsameret A, Yesurun Y and Kishio K 1994J. Appl. Phys.75 6322–7Klein L, Yacoby E R, Wolfus Y, Yeshurun Y, Burlachkov L, Shapiro B Y, Konczykowski M and Holtzberg F
1993bJ. Appl. Phys.73 5862–4Klein L, Yacoby E R, Yesurun Y, Konczykowski M and Kishio K 1993bPhys. Rev.B 48 3523Kleiner R and Muller P 1994aPhys. Rev.B 49 1327–41Kleiner R, Muller P, Kohlstedt H, Pedersen N F and Sakai S 1994bPhys. Rev.B 50 3942–52Klemm R A and Clem J R 1980Phys. Rev.B 21 1968Klemm R A, Luther A and Beasley M R 1975Phys. Rev.B 12 877Kobayashi N, Hirano K, Nishizaki T, Iwasaki H, Sasaki T, Awaji S, Watanabe K, Asaoka H and Takei H 1995a
Physica251C 255–62Kobayashi N, Nishizaki T, Onodera Y, Asaoka H and Takei H 1995Proc. 1995b Taiwan Int. Conf. of
Superconductivity(Chinese Journal of Physics)Kobayashi T, Nakayama Y, Kishio K, Kimura T, Kitazawa K and Yamafuji K 1993Appl. Phys. Lett62 1830Koblischka M R and Wijngaarden R J 1995Supercond. Sci. Technol.8 199–213Koch R H, Foglietti V, Gallagher W J, Koren G, Gupta A and Fisher M P A 1989Phys. Rev. Lett.63 1511Konczykowski M, Chikomoto N, Vinokur V M and Feigelman M V 1995 Phys. Rev.B 51 3957Konczykowski M, Rullier-Albenque F, Yacoby E R, Shaulov A, Yeshurun Y and Lejay P 1991Phys. Rev.B 44
7167–70Konczykowski M, Vinokur V M, Rullier-Albenque F, Yeshurun Y and Holtzberg F 1993Phys. Rev.B 47 5531–5Korshunov S E and Larkin A I 1992 Phys. Rev.B 46 6395Koshelev A E 1996aPhys. Rev. Lett.76 1340–3——1996bProc. 9th Int. Symp. on Superconductivity (ISS’96), Sapporo, Hokkaido, Japanto be publishedKoshelev A E, Glaseman L I and Larkin A I 1996 Phys. Rev.B 53 2786–91Koshelev A E and Vinokur V M 1994 Phys. Rev. Lett.73 3580Kramer E J 1973J. Appl. Phys.44 1360Krasnov V M, Larkin V A and Ryazanov V V 1991 Physica174C 440–6
Magnetic behaviour of superconductors 1669
Kresin V Z and Wolf S A 1992Phys. Rev.B 46 6458Krusin-Elbaum L, Civale L, Blatter G, Marwick A D, Holtzberg F and Feild C 1994aPhys. Rev. Lett.72 1914Krusin-Elbaum L, Civale L, Vinokur V M and Holtzberg F 1992Phys. Rev. Lett.69 2280Krusin-Elbaum L, Marwick A D, Wheeler R, Field C, Vinokur V M, Leaf G K and Palumbo M 1996Phys. Rev.
Lett. 76 2563–6Krusin-Elbaum L, Thompson J R, Wheeler R, Marwick A D, Li C, Patel S and Shaw D T 1994bAppl. Phys. Lett.
64 3331–3Kupfer H, Zhukov A A, Will A, Jahn W, Meier-Hirmer R, Wolf Th, Voronkova V L, Klaser M, Saito K 1996
Phys. Rev.B 54 54 644–55Kwok W K, Fendrich J A, Fleshler S, Welp U, Downey J and Crabtree G W 1994bPhys. Rev. Lett.72 1092–5Kwok W K, Fendrich J A, Fleshler S, Welp U, Downey J, Crabtree G W and Giapintzakis J 1994Physica197B
579–87Kwok W K, Fendrich J A, van der Beek C J and Crabtree G W 1994Phys. Rev. Lett.73 2614Kwok W K, Fendrich J A, Welp U, Fleshler S, Downey J and Crabtree G W 1994aPhys. Rev. Lett.72 1088–91Kwok W K, Fleshler S, Welp U, Vinokur V M, Downey J, Crabtree G W and Miller M M 1992 Phys. Rev. Lett.
69 3370Lacey D, Cohen L F, Perkins G and Caplin A D 1994Physica235–40C2595Landau L D and Lifshitz E M 1969Statistical Physics2nd edn (London: Pergamon)Larkin A I, Marchetti M C and Vinokur V M 1995 Phys. Rev. Lett.75 2992Larkin A I and Ovchinnikov Yu N 1979J. Low Temp. Phys.34 409——1986Nonequilibrium Superconductivityed D N Langenberg and A I Larkin (New York: Elsevier)Larkin A I and Vinokur V M 1995 Phys. Rev. Lett.75 4666Lawrence W E and Doniach S 1971Proc. 12th Int. Conf. Low Temp. Phys. LT12ed E Kanda (Kyoto: Academic
Press of Japan) p 361Le Blanc M A R andLittl e W A 1960Proc. Seventh Int. Conf. Low Temp. Phys.(Toronto: University of Toronto
Press) p 198Lee S Let al 1993Phys. Rev. Lett.71 3862——1997Phys. Rev.B 55 5666–9Leghissa M, Gurevich L A, Kraus M, Saemannischenko G and Vinnikov L Y 1993 Phys. Rev.B 48 1341–4Liang R, Bonn D A and Hardy W N 1996Phys. Rev. Lett.76 835Li Q et al 1993Phys. Rev.B 48 9877Li Q, Fukumoto Y, Zhu Y M, Suenaga M, Kaneko T, Saa K and Simmon Ch 1996Phys. Rev.B 54 1–4Li Y H and Teitel S 1994Phys. Rev.B 49 4136Lopez D, Nieva G and de la Cruz F 1994aPhys. Rev.B 50 7219Lopez D, Nieva G, de la Cruz F, Jensen H J and O’Kane D 1994bPhys. Rev.B 50 9684Lopez D, Righi E F, Nieva G and de la Cruz F 1996Phys. Rev. Lett.76 4034–7Mackenzie A P, Julian S R, Lonzarich G G, Carrington A, Hughes S D, Liu R S and Sinclair D C 1994J. Supercon.
7 271Majer D, Zeldov E and Konczykowski M 1995Phys. Rev. Lett.75 1166Maki K 1964 Physica1 127Malozemoff A P 1991Physica185–9C264–9Malozemoff A P and Fisher M P A 1990Phys. Rev.B 42 6784–6Maley M P, Willis J O, Lessure H and McHenry M E 1990Phys. Rev.B 42 2639Martinez J C, Brongersma S, Koshelev A, Ivlev B, Kes P H, Gressen R, de Groot D G, Tarnavski Z and
Menovky A A 1992 Phys. Rev. Lett.69 2276Mason T 1991 Private communicationMikheev L V and Kolomeisky E B 1991Phys. Rev.B 43 10 431–5Minnhagen P 1987Rev. Mod. Phys.59 1001Miu L, Wagner P, Hadish A, Hillmer F, Adrian H, Wiesner J and Wirth G 1995Phys. Rev.B 51 3953Moon K, Scalettar R T and Zimanyi 1996Phys. Rev. Lett.77 2778Moore M A 1997Phys. Rev.B 55 14 136–9Moore M A and Newman T J 1995Phys. Rev. Lett.75 533Moshchalkov V V, Metlushko V V, Guntherodt G, Goncharov L N, Didyk A Y and Bruynseraede Y 1994Phys.
Rev.B 50 639Nagel S R 1993Phase Transitions and Relaxation in Systems with Competing Energy Scalesed T Riste and
D Sherrington (Dordrecht: Kluwer)Nakamura N, Gu G D and Koshizuka N 1993Phys. Rev. Lett.71 915Nelson D R 1988Phys. Rev. Lett.60 1973

1670 L F Cohen and H J Jensen
Nelson D R and Vinokur V M 1992 Phys. Rev. Lett.68 2398——1993Phys. Rev.B 48 13 060Nguyen A K, SudbøA and Hetzel R E 1996Phys. Rev. Lett.77 1592Niderost, Suter A, Visani P, Mota A C and Blatter G 1996Phys. Rev.B 53 9286Nordborg H and Blatter G 1996Czech. J. Phys.46 1817–8Osofsky M S, Cohn J L, Skelton E F, Miller M M, Soulen Jr R J, Wolf S A and Vanderah T A 1992Phys. Rev.
B 45 4916Osofsky M Set al 1993Phys. Rev. Lett.71 2315–8——1994J. Supercon.7 279Ossandon J G, Thompson J G, Christen D K, Sales B C, Kerchner H R, Thomson J O, Sun Y R, Lay K W and
Tkaczyk J E 1992Phys. Rev.B 45 12 534–47Oussena M, de Groot P A J, Deligiannis K, Volkozub A V, Gagnon R and Taillefer L 1996aPhys. Rev. Lett.76
2259–62——1996bPhys. Rev. Lett.77 792Oussena M, de Groot P A J, Marshall A and Abell J S 1994Phys. Rev.B 49 1484–7Oussena M, de Groot P A J, Porter S J, Gagnon R and Taillefer L 1995Phys. Rev.B 51 1389Overend N, Howson M A, Lawrie I D, Abell S, Hirst P J, Chankang C, Chowdhury S, Hodby J W, Inderhees S E
and Salamon M B 1996Phys. Rev.B 54 9499Palstra T T M, Batlogg B, Schneemeyer L F and Waszczak J V 1988Phys. Rev. Lett.61 1162Palstra T T M, Batlogg B, Vandover R B, Schneemeyer L F and Waszczak J V 1989Appl. Phys. Lett.54 763Pastoriza H, de la Cruz F, Mitzi D B and Kapitulnik A 1992Phys. Rev.B 46 9278Pastoriza H, Goffman M F, Arribere A and de la Cruz F 1994aPhys. Rev. Lett.72 2951Pastoriza H and Kes P 1995Phys. Rev. Lett.75 3525Pastoriza H, Safar H, Righi E F and de la Cruz F 1994bPhysica 194–6B2237Perkins P K and Caplin A D 1996Phys. Rev.B 54 12 551–6Perkins P K, Cohen L F, Zhukov A A, Caplin A D 1995Phys. Rev.B 51 8513Persico V, Cataudella V, Fontana F and Minnhagen P 1996Physica260C 41–51Pippard A B 1969Phil. Mag. 19 217Polak M, Windte V, Schauer W, Reiner J, Gurevich A and Wuhl H 1991Physica174C 14Pozek M, Ukraincyk I, Ratvin B and Dulcic A 1991Europhys. Lett.16 683Pradhan A K, Roy S B, Chaddah P, Kanjilaal D, Chen C and Wanklyn D M 1996Supercond. Sci. Technol.9 1Prozorov R, Tsameret A, Yeshurun Y, Koren G, Konczykowski M and Bouffard S 1994Physica234C 311–7Pust L 1990Supercond. Sci. Technol.3 598Pust L, Jirsa M, Griessen R and Schnack H G 1993Appl. Supercon.1 835Pust L, Kadlecova J, Jirsa M and Durcok S 1990J. Low Temp. Phys78 P179Rae A I M 1996Czech J. Phys.46 1807–8Ravikumar Get al 1997Physica276C 9Reed D S, Yeh N C, Konczykowski M, Samoilov A V, Holtzberg F 1995Phys. Rev.B 51 16 448Rodriguez E, Geoffman M F, Arribere A and de la Cruz F 1993Phys. Rev. Lett.71 3375Roulin M, Junod A and Walker E 1996Science273 1210–12Safar Set al 1990 Progress in High Temperature Superconductivityvol 25, ed R Nicolvsky (Singapore: World
Scientific) p 140Safar H, Gammel P L, Bishop D J, Mitzi D B and Kapitulnik A 1992bPhys. Rev. Lett.68 2672–5Safar H, Gammel P L, Huse D A, Bishop D J, Lee W C, Giapintzakis J and Ginsberg D M 1993Phys. Rev. Lett.
24 3800Safar H, Gammel P L, Huse D A, Bishop D J, Rice J P and Ginsberg M 1992cPhys. Rev. Lett.69 824Safar H, Gammel P L, Huse D A, Majumdar S N, Schneemeyer L F and Bishop D J 1994Phys. Rev. Lett.72
1272Safar H, Rodriguez E, de la Cruz F, Gammel P L, Schneemeyer L F and Bishop D J 1992aPhys. Rev.B 46 14 238Schilling A, Fisher R A, Phillips N E, Welp U, Dasgupta D, Kwok W K and Crabtree G W 1996Nature382791–3Schilling A and Jeandupeux O 1995Phys. Rev.B 52 9714–23Schilling A, Jin J, Guo J D and Ott H R 1993Phys. Rev. Lett.71 1899Schindler W 1991J. Appl. Phys.70 1877–9Schmidt B, Konczykowski M, Morozov N and Zeldov E 1996Int. Workshop on Vortex Dynamics in HTS (Shoresh,
Israel)Schmitt P, Kummeth P, Schults L and Saemann-Ischenko G 1991Phys. Rev. Lett.67 270Schnack H G 1995PhD Thesis1995Schnack H G, Griessen R, Lensink J G and Hai-hu W 1993Phys. Rev.B 48 13 178
Magnetic behaviour of superconductors 1671
Schnack H G, Griessen R, Lensink J G, van der Beek C J and Kes P H 1992Physica197C 337–61Schopohl N and Maki K 1995Phys. Rev.B 52 490Schuster Th, Koblischka M R, Moser N, Ludescher B and Kronmiller H 1991Cryogenics30 811Schuster Th, Kuln H and Brandt E H 1995bPhys. Rev.B 51 697Schuster Th, Kuln K, Indenbom M, Leghissa M, Kraus M and Konczykowski M 1995aPhys. Rev.B 51 16 358Sengupta S, Shi D, Wang Z, Smith M E and McGinn P J 1993Phys. Rev.B 47 5165–9Seow W S, Campbell A M, Doyle R A, Kadowaki K, Wirth G and Koshelev A 1996Phys. Rev.B 53 14 611–20Silva E, Fastampa R, Giura M, Marcon R, Murtas F and Sarti S 1995Appl. Magn. Res.8 11–23Smith J Let al 1994J. Supercond.7 269Spencer S and Jensen H J 1997Phys. Rev.B 55 8473Steel D G and Greybeal J M 1992Phys. Rev.B 45 12 643Steel D G, Hettinger J D, Parkman J T, Yoder M E, Gray K E, Glagola B G and Eddy M M 1996Physica265C
159–62Supple F, Campbell A M and Cooper J R 1995Physica242C 233–45Sun J Z, Lairson B, Ecom C B, Bravman J and Geballe T 1990Science247 307Sun Y R, Thompson J R, Chen Y J, Cristen D K and Goyal A 1993Phys. Rev.B 47 14 481–8Sun Y R, Thompson J R, Cristen D K, Holtzberg F, Marwick A D and Ossandon J G 1992Physica194C 403–10Tachiki M and Takashasi S 1989Solid State Commun.72 1083Tallon J L 1994Proc. 7th International Workshop on Critical Currents in Superconductorsed H Weber (Singapore:
World Scientific) p 52Tang C, Ling X S, Bhattacharya S B and Chaikin P M 1996Europhys. Lett.35 597–602Tesnovic Z 1995Phys. Rev.B 51 16 204Tesanovic Z and Xiang L 1991Phys. Rev. Lett.67 2729Tesanovic Z, Xing L, Bulaevskii L, Li Q and Suenaga M 1992Phys. Rev. Lett.69 3563Thomas J, Perkins G K, Lacey D E, Cohen L F and Caplin A D 1996Proc. 8th Int. Workshop on Critical Currents
(Kitakyushu, Japan)ed T Matsishita and K Yamafuji (Singapore: World Scientific)Thompson J R, Krusin-Elbaum L, Civale L, Blatter G and Feild C 1997Phys. Rev. Lett.78 3181–4Thompson J R, Sun Y R, Civale L, Malozemoff A P, McElfresh M W, Marwick A D and Holtzberg F 1993Phys.
Rev.B 47 14 440–7Thompson J R, Sun Y R and Holtzberg F 1991aPhys. Rev.B 44 458Thompson J R, Sun Y R, Kerchner H R, Chisten D K, Sales B C, Chakoumalos B C, Marwick A D, Civale L
and Thompson J O 1992Appl. Phys. Lett.60 2306Thompson J R, Sun Y R, Malozemoff A P, Christen D K, Kerchner H R, Ossandon J G, Marwick A D and
Holtzberg F 1991bAppl. Phys. Lett.59 2612–14Thorel P, Hahn R, Simon Y and Cribier D 1973J. Physique34 447Thuneberg E V 1984J. Low Temp. Phys.57 415Tinkham M 1963Phys. Rev.129 2413——1995 Introduction to Superconductivity(New York: McGraw-Hill)Totty J T, Cohen L F, Perkins G K, Hossain A K M, Jemsen H J, Doyle R A, Kadowaki K and Wirth G 1996
Proc. 8th IWCC Japan(Singapore: World Scientific) p 389Tsuneto T 1988J. Phys. Soc. Japan57 3499Umezawa A, Crabtree G W, Liu J Z, Moran T J, Malik S K, Nunez L H, Kwok W L and Sowers C Ha 1988
Phys. Rev.B 38 2843–6van Dalen A J J1995PhD ThesisFree University of Amsterdamvan Dalen A J J,Griessen R and Koblischka M R 1996Physica257C 271–83van der Beek C J, Kes P H, Maley M P, Menken M J V andMenovsky A A 1992 Physica195C 307van der Beek C J, Konczykowski M, Vinokur V M, Li T W, Kes P H and Crabtree G W 1995Phys. Rev. Lett.74
1214van der Beek C J, Konczykowski M, Li T W, Kes P H and Benoit W 1996Phys. Rev.B 54 R792Vargas L J and Larbalestier D C 1992Appl. Phys. Lett.60 1741Vinokur V M, Kes P H and Koshelev A E 1990Physica168C 29——1995Physica248C 179Wan Y M, Hebboul S E and Garland J C 1994Phys. Rev.B 72 3867Wan Y M, Hebboul S E, Harris D C and Garland J C 1993Phys. Rev. Lett.71 157Watauchi S, Ikuta H, Shimoyama J, Kishio K 1996Physica259C 373–8Welp U, Fendrich J A, Kwok W K, Crabtree G W and Veal B 1996Phys. Rev. Lett.76 4809–12Welp U, Kwok W K, Crabtree G W, Vandervoort K G and J Z Liu 1989Phys. Rev. Lett.62 1908Werthamer N R, Helfand E and Hohenberg P C 1966Phys. Rev.147 295
1672 L F Cohen and H J Jensen
Werner M, Sauerzopf F M, Webwe H W, Veal B D, Licci F, Winzer K and Koblischka M K 1994 Physica235–40C2833
Woo K C, Gray K E, Kampwirth R T, Kang J H, Stein S J, East R and McKay D M 1989Phys. Rev. Lett.63 1877Worthington T K, Fisher M P A, Huse D A, Toner J, Marwick A D, Zabel T, Feild C A and Holtzberg F 1992
Phys. Rev.B 46 11 854–61Wordenweber R and Kes P 1986Phys. Rev.B 34 494Wordenweber R, Kes P and Tsuei C C 1986Phys. Rev.B 33 3172Wu D H and Sridar S 1990Phys. Rev. Lett.65 2074Wu H, Ong N P and Li Y Q 1993Phys. Rev. Lett.71 2642Yang G, Abell J S and Gough C E 1994Proc. 7th Int. Workshop on Critical Currents in Superconductorsed H Weber
(Singapore: World Scientific) p 264Yang G, Shang P, Sutton S D, Jones I P, Abell J S and Gough C E 1993aPhys. Rev.B 48 4054Yang G, Sutton S, Shang P, Gough C E and J S Abell 1993bIEEE Trans. Appl. Supercond.3 1663Yaron U et al 1996Nature381 p 253Yaron U, Gammel P L, Huse D A, Kleiman R N, Ogleby C S, Bucher E, Batlogg B, Bishop D J, Mortensen K
and Clausen K N 1995Nature376 753–5Yeshurun Y, Bontemps N, Burlachkov L and Kapitulnik A 1994aPhys. Rev.B 49 1548Yeshurun Y and Malozemoff A P 1988Phys. Rev. Lett.60 2202Yeshurun Y, Malozemoff A P and Shaulov A 1996Rev. Mod. Phys.68 911–49Yeshurun Y, Yacoby E R, Klein L, Burlachkov L, Prozorov R, Bontemps N, Wuhl H and Vinokur V 1994bProc.
7th IWCC, Alpbached H W Weber (Singapore: World Scientific) pp 237–9Zech D, Lee S L, Heller H, Blatter G, Janossy B, Kes P H, Li T W and Menovsky A A 1995 Phys. Rev.B 52 6913Zeldov E, Amer N M, Koren G, Gupta A, McElfresh M W, Gambino R J 1990Appl. Phys. Lett.56 680Zeldov E, Larkin A I, Geshkenbein V B, Majer D, Konczykowski M, Vinokur V M and Shtrikman H 1994Phys.
Rev. Lett.73 1428Zeldov E, Majer D, Konczykowski M, Geshkenbein V B, Vinokur V M and Shtrikman H 1995aNature375 373Zeldov E, Majer D, Konczykowski M, Larkin A I, Vinokur V M, Geshkenbein V B, Chikumoto N and Shtrikman H
1995bEurophys. Lett.30 367Zhukov A A 1992 Solid State Commun.82 983–5Zhukov A A, Kupfer H, Klestov S A, Voronkova V L and Yanovsky V K 1993 J. Alloy Compounds195 479–81Zhukov A A, Kupfer H, Perkins G, Cohen L F, Caplin A D, Klestov S A, Claus H, Voronkova V I, Wolf T and
Wul 1995Phys. Rev.B 51 12 704Zhukov A A, Perkins G, Cohen L F, Kuper H, Totty J T, Caplin A D, Klestov S A, Claus H, Voronkova V I and
Wuhl H 1994Physica235–40C2837Zhukov A A, Perkins G K, Thomas J V, Caplin A D, Kupfer H and Wolf T 1996Proc. 8th IWCC Japan(Singapore:
World Scientific) p 317Zhukov A A, Perkins G, Thomas J V, Caplin A D, Kupfer H and Wolf T 1997Phys. Rev.B 56 3481