MassHealth Demonstration to Integrate Care for Dual Eligibles

One Care: MassHealth plus Medicare
Demonstration to Integrate Care for Dual Eligibles
Open Meeting
May 24, 2016 10:00 AM – 12:00 PM
1 Ashburton Place, 21st Floor
Boston, MA

2 INTERNAL DRAFT – POLICY IN DEVELOPMENT
Agenda for Today
• Announcements
• Quality Data Performance Overview
o Quality Withhold Performance
o Consumer Assessment of Healthcare Providers and
Systems Survey (CAHPS)
o Healthcare Effectiveness Data and Information Set
(HEDIS)
o Grievance Reporting
• Financial Data
o Plan Financial Overview
o Per Member Per Month (PMPM) Spending
2

3 INTERNAL DRAFT – POLICY IN DEVELOPMENT
One Care Enrollment Update
• We are very pleased to announce that Commonwealth Care Alliance (CCA) is accepting new One Care enrollments in all covered counties.
• This is a great sign that the package of financial adjustments made by MassHealth and CMS last fall is helping to bring stability to the One Care program.
• Eligible members in Suffolk and Worcester counties can now choose to enroll in One Care through either CCA or Tufts Health Unify.
• Eligible members in the following additional counties can now enroll in One Care through CCA: Essex, Franklin, Hampden, Hampshire, Middlesex, Norfolk, and Plymouth*
• To enroll in One Care, contact MassHealth Customer Service (Monday–Friday, 8:00 a.m. – 5:00 p.m.) at 1-800-841-2900 or TTY: 1-800-497-4648 (for people who are deaf, hard of hearing, or speech disabled). The call is free. For more information about One Care, please visit: www.mass.gov/masshealth/onecare.
• Please share this information with your networks, friends, and colleagues.
*Commonwealth Care Alliance’s service area includes all of Plymouth County except for the towns of
East Wareham, Lakeville, Marion, Mattapoisett, Wareham, and West Wareham.
3

4 INTERNAL DRAFT – POLICY IN DEVELOPMENT
One Care Plan Procurement
• MassHealth expects to share updates about One Care
plan reprocurement in the next 1-2 months.
• Watch for announcements on the Duals website
(www.mass.gov/masshealth/duals), on the COMMBUYS
website (www.commbuys.com), and via stakeholder
emails.
• MassHealth expects that plans participating in 2018 would
be able to bid on any county in Massachusetts, including
for statewide coverage
4
5 INTERNAL DRAFT – POLICY IN DEVELOPMENT
QUALITY DATA PERFORMANCE
OVERVIEW
5

6 INTERNAL DRAFT – POLICY IN DEVELOPMENT
One Care’s Expected Outcomes
Massachusetts’ Demonstration proposal to CMS projected several outcomes resulting from
integrated care. Listed below are some of the high level goals:
1) Improve quality:
• Reduce over-utilization of high-cost hospital and long-term institutional care;
• Reduce under-utilization of community-based services and supports and outpatient
care;
• Improve chronic disease management;
• Reduce health disparities;
• Improve patient satisfaction;
• Increase the use of evidence-based practices; and
• Improve provider ADA accessibility
2) Improve outcomes:
• Gains in health status and functional status
• Reduce the length and number of long-term care facility stays
3) Reduce costs compared to the historical fee for service (FFS) experience for this population
4) Improve provider coordination, reduce preventable and avoidable hospitalizations, and
reduce the incidence of “never” events.
6

7 INTERNAL DRAFT – POLICY IN DEVELOPMENT
Quality Monitoring in One Care is
Extensive
DEMONSTRATION QUALITY MEASURES:
1) CMS measures:
Metrics that CMS requires for all capitated
model demonstrations under the Financial
Alignment Initiative
2) Massachusetts Specific Measures:
State-specific measures that MassHealth and
CMS agreed to include
3) Quality Withholds:
Per the three-way contract, percentage
amount withheld from the capitation rate and
returned to plans subject to their
performance on select core and MA-specific
measures
OTHER NATIONAL REPORTING REQUIRED BY CMS
1) Healthcare Effectiveness Data and Information Set
(HEDIS)
2) Consumer Assessment of Healthcare Providers and
Systems (CAHPS)
3) Health Outcomes Surveys (HOS)
4) Hospital Consumer Assessment of Healthcare Providers
and Systems (HCAHPS)
5) Chronic Care Improvement Projects (CCIP)
6) Quality Improvement Projects (QIP)
ADDITIONAL SURVEYS CAPTURING SELF-REPORTED
MEMBER EXPERIENCE
1) Mental Health Recovery Measure (MHRM)
2) Quality of Life Survey (adapted from the MHRM above)
3) Early Indicators Project (EIP)
4) Grievance Monitoring
7

8 INTERNAL DRAFT – POLICY IN DEVELOPMENT
GOALS OF THE ONE CARE
PROGRAM
CORRESPONDING DATA SOURCES INCLUDED
IN THE PRESENTATION
Improved quality CAHPS
Grievances
Quality Withhold Payments
Improved outcomes HEDIS
The intention of this presentation is to provide early examples of how the
Massachusetts One Care Demonstration is meeting pre-defined goals.
The table below lists a goal, and the corresponding data sources illustrating
performance in this presentation.
Information included in the presentation is not a comprehensive slate of all the
measures captured.
8
Content in this Presentation:

9 INTERNAL DRAFT – POLICY IN DEVELOPMENT 9
Data Sources, Measurement Periods, and
Benchmarks
CAHPS Survey July 2014 – December 2014
DY1 (Q4-Q5)
• National Medicare Advantage Plan Average
• National Medicare-Medicaid Plan (MMP)
Average
• Massachusetts Medicare Advantage Plan
Average (includes SCO plans)
Data Source Measurement Period Benchmarks
HEDIS Survey January 2014 – December 2014
DY1 (Q2-Q5)
• Medicaid Managed Care Plans
• Performance at the 75th percentile
• Performance at the 90th percentile
Quality Withhold
Measures
October 2013 – December 2014
DY1 (Q1-Q5)
• One Care Plans
• Pass/Fail OR
• Highest performing plan minus 10
percentage points
Grievance Reporting April 2015 – December 2015
DY2 (Q2-Q4) • One Care Plans
Financials October 2013 – December 2015
DY1 (Q1-Q5) – DY2 (Q1-Q4) • DY1 vs. DY2
Demonstration Year 1 (DY1): October 2013 – December 2014
Demonstration Year 2 (DY2): January 2015 – December 2015

10 INTERNAL DRAFT – POLICY IN DEVELOPMENT
Quality Withhold Performance
10

11 INTERNAL DRAFT – POLICY IN DEVELOPMENT
Quality Withhold Measures Overview
A percentage amount is withheld from the capitation rate and returned to plans
subject to their performance on certain quality metrics
These metrics are drawn from both the required CMS core metrics as well as the
MA specific measures
Some measures are scored as pass or fail
Some measures are scored by meeting a certain benchmark. Benchmarks are
determined by the highest performing plan’s performance minus 10 percentage
points.
Core and Massachusetts Specific Reporting Requirements, including technical full specifications for the withhold measures can be found at:
https://www.cms.gov/Medicare-Medicaid-Coordination/Medicare-and-Medicaid-Coordination/Medicare-Medicaid-Coordination-
Office/FinancialAlignmentInitiative/InformationandGuidanceforPlans.html
11

12 INTERNAL DRAFT – POLICY IN DEVELOPMENT
Comprehensive List and Description of
Quality Withhold Measures Core 2.1: Assessment Completed within 90 Days of Enrollment
Number of assessments completed by quarter of enrollment, less members that plans are unable to locate
or who refuse. Plans submit via monthly tracking tool to MassHealth.
Core 5.3: Consumer Advisory Board
Plans submit information on each consumer advisory board and/or governance board during the annual
reporting period. One template per meeting should be completed and submitted. Templates include: dates
of quarterly meetings, invitees, attendees, and meeting minutes.
MA 5.1: Centralized Enrollee Record
The percentage of members whose race, ethnicity, primary language, homelessness status, and disability
type are collected and maintained in the One Care plan’s Centralized Enrollee Record.
Encounter Data
Plans must have submitted the following: Prescription Drug and Risk Adjustment files by Medicare-
required timeframes AND both MassHealth and Medicare encounter test files by June 1, 2015.
MA 1.2: Documented Discussion of Care Goals
The percentage of members who had a care plan developed in the reporting period who had at least one
documented discussion of care goals in the care plan.
MA 1.3 Access to LTS Coordinators (LTS-Cs)
Number of members with identified LTSS needs, referrals and refused referrals to LTS-Cs. (Later added
number of members offered a LTS-C referral and how many members were referred or refused.) Plans
submit via monthly tracking tool.
12

13 INTERNAL DRAFT – POLICY IN DEVELOPMENT
2014 WITHHOLD MEASURES
Core 2.1
Completed
Assessments
Core 5.3
Consumer
Advisory Board
MA 5.1
Centralized
Enrollee Record
Encounter
Data
MA 1.2
Documented
Discussion of
care goals
MA 1.3
Access to LTS Coordinators
# Measures
Passed
Benchmark 78.2% 100%
compliance
71.7% Successful
submission
90.0% 90.0%
CCA 64.4% Pass 59.2% Pass 90.0% 69.9% 3 out of 6
FTC 45.3% Pass 81.7% Pass 100.0% 100.0% 5 out of 6
Tufts 88.2% Pass 65.4% Pass 91.9% 81.2% 4 out of 6
2013 WITHHOLD MEASURES
Core 2.1
Completed
Assessments
Core 5.3
Consumer
Advisory
Board
MA 5.1
ICO Centralized
Enrollee Record
# Measures
Passed
Benchmark
67.3% 100%
compliance
Timely reporting
of required
elements
CCA 75.6% Pass Pass 3 out of 3
FTC 77.3% Pass Pass 3 out of 3
Tufts 68.4% Pass Pass 3 out of 3
Quality Withhold Measures:
Individual Plan Performance: DY1
KEY
Cells highlighted in yellow did
not pass
Cells highlighted in green did
pass
13

14 INTERNAL DRAFT – POLICY IN DEVELOPMENT
2014 WITHHOLD MEASURES
# Measures
Passed
MassHealth
Quality
Withhold
Amount ($)
% of Earned
Withhold
Earned
MassHealth
Quality
Payment ($)
CCA 3 out of 6 $863,766 50% $431,883
FTC 5 out of 6 $317,903 100% $317,903
Tufts 4 out of 6 $79,949 75% $59,962
Total One Care Plans $1,261,618 $809,748
2013 WITHHOLD MEASURES
# Measures
Passed
MassHealth
Quality
Withhold
Amount ($)
% of
Earned
Withhold
Earned
MassHealth
Quality
Payment ($)
CCA 3 out of 3 $60,029 100% $60,029
FTC 3 out of 3 $7,359 100% $7,359
Tufts 3 out of 3 $5,908 100% $5,908
Total One Care Plans $73,296 $73,296
Quality Withhold Measures:
Individual Plan Performance and MassHealth
Payment: DY1
KEY
Cells highlighted in yellow did
not pass all measures; eligible
for partial payment
Cells highlighted in green
passed all measures; eligible
for full payment
14

15 INTERNAL DRAFT – POLICY IN DEVELOPMENT
CCA’s Response to Quality Withhold
Performance Measure Successes, Challenges and Interventions
Completed
Assessments
Rapid influx of new enrollees and large numbers of members with incorrect contact information challenged
CCA’s assessment operations in 2014. CCA introduced a new, more centralized management approach
to assessment in mid-2014. Successful interventions included: increasing our internal assessment
capacity; creating “research” staff using claims, pharmacy, EHR, and public information resources to
locate hard to reach members; developing regular follow up protocols to continue outreach; developing
systems of flagging unassessed members and scheduling assessments when contact was established
through new claims, incoming calls to member services or hospitalizations. These methods led to 100%
completion of assessments on reachable and willing members by Q3 2014, and continual reduction in
percentage of unreachable/refused assessment members.
Consumer Advisory
Board
CCA’s Consumer Liaison successfully organized a group of enrollee participants across 4 regions, broadly
representative of rating categories and demographics of the One Care population. The group continues to
meet quarterly and reports on member experiences and satisfaction, and makes recommendations.
Centralized
Enrollee Record
Challenges with CCA’s CER included not initially configuring the capture of detailed and accurate
reporting on required data elements. While CCA’s care management staff and interdisciplinary teams were
conducting comprehensive evaluations and care delivery activities; the system did not always enable high
standards of reporting. A new comprehensive assessment “smart form” that will enable capture of the data
has been developed and will be in use by end of Q2 2016.
Documented Care
Goals
CCA initially wasn’t able to capture care goals that were recorded in the electronic health record. Since
fixing that problem, CCA has been able to show 100% compliance with this measure.
Access to LTS
Coordinators
Reporting deficits were largely responsible for low performance on this measure. Defining new reporting
fields within the CER, replacement of manual processing and work with LTSC agencies on claims
submission corrected the reporting lag by mid-2014, resulting in 100% compliance in offering LTSC
services to ALL members the following year.
15

16 INTERNAL DRAFT – POLICY IN DEVELOPMENT
Tufts’ Response to Quality Withhold
Performance
• Overall, Tufts Health Plan is pleased with our strong performance on DY1 quality withhold measures for
the One Care program.
• Core 2.1 Completed Assessments: Tufts Health Plan’s leading performance on this measure is directly
associated with the managed growth strategy that we have employed since launching Tufts Health Unify in
October 2013.
• Encounter Data: During DY1, Tufts Health Plan successfully submitted RAPS and PDE data to CMS, and
monthly encounter data to EOHHS.
• MA5.1 Centralized Enrollee Record: Tufts Health Plan’s performance on this measure is related to
incomplete documentation of member information. In response to DY1 results, Tufts Health Plan improved
total performance on this measure by over 15% in DY2, driven in large part by more accurately
documenting member’s disability status.
• MA1.2 Documented Discussion of Care Goals: While Tufts Health Plan successfully passed the quality
withhold threshold for this measure, we have continued to improve our internal care management system
to enhance our ability to capture these discussions in the future.
• MA1.3 Access to LTS Coordinators: Tufts Health Plan’s policy is to offer LTS Coordinators to all new
members regardless of LTSS need. Because some members who have LTSS needs (based on claims
data or rating category) are unreachable, referrals may not be completed within 90 days.
16

17 INTERNAL DRAFT – POLICY IN DEVELOPMENT
Consumer Assessment of Healthcare
Providers and Systems Survey (CAHPS)
17

18 INTERNAL DRAFT – POLICY IN DEVELOPMENT
The CAHPS surveys are designed to capture accurate and reliable information from
consumers about their experiences with health care.
The Medicare CAHPS Survey, which has been conducted annually since 1998, is part of a
group of surveys developed by a group of researchers under an agreement between CMS
and the Agency for Healthcare Research and Quality (AHRQ) – researchers include:
American Institutes for Research
Harvard Medical School
the RAND Corporation
RTI International
These research groups are under a cooperative agreement between CMS and the
Agency for Healthcare Research and Quality (AHRQ) a component of the U.S.
Public Health Service
The following data shows results from the 2015 CAHPS Survey of Medicare Advantage
Prescription Drug (MA-PD) plans (which includes demonstration programs)
The surveys include a core set of questions, with some questions grouped to form
composites, or summary results, of key areas of care and service.
Scores in the presentation were converted from the CMS case-mix adjusted mean, to
illustrate a 0-100 score. The Case-Mix adjusted mean is intended to illustrate overall
performance on a 1-4 scale (1 being the worse and 4 being the best).
Survey Specifics
Surveys sent out in the first half of 2015, which measure members’ experiences with their plan over the previous six months.
From each contract, 800 eligible enrollees were drawn by simple random sampling
Plans use CMS certified vendors to field the CAHPS survey
In order to be eligible to participate in the Medicare CAHPS survey – members must be at least 18 years of age and currently
enrolled in an MA or PDP for six months
Benchmarks:
Since this is the first year One
Care plans performed the
CAHPS survey there are some
limitations in evaluating plan
performance. Included in the
graphs are a variety of
benchmarks used to evaluation
how the plans performed:
National Medicare
Advantage Average
Massachusetts Medicare
Advantage Average
National Medicare-
Medicaid Plan Average
(other capitated Duals
Demonstrations)
CAHPS Summary
18

19 INTERNAL DRAFT – POLICY IN DEVELOPMENT
The Getting Needed Care
Composite includes
the questions below:
In the last 6 months, how
often was it easy to get
appointments with
specialists?
In the last 6 months, how
often was it easy to get
the care, tests or
treatment you thought
you needed through your
health plan? 78%
81%
84%
84%
85%
86%
0% 20% 40% 60% 80% 100%
National MMP Average
FTC
National Medicare Advantage Average
Tufts
Massachusetts Medicare Advantage Average
CCA
Getting Needed Care Composite
19

20 INTERNAL DRAFT – POLICY IN DEVELOPMENT
85%
85%
86%
88%
88%
89%
0% 20% 40% 60% 80% 100%
National MMP Average
FTC
National MedicareAdvantage
Tufts
Massachusetts MedicareAdvantage Average
CCA
The Care Coordination Composite Consists
of the following 6 Questions
In the last 6 months, when you visited your
personal doctor for a scheduled appointment,
how often did he or she have your medical
records or other information about your care?
In the last 6 months, when your personal
doctor ordered a blood test, x-ray or other
test for you, how often did someone from
your personal doctor’s office follow up to give
you those results?
In the last 6 months, when your personal
doctor ordered a blood test, x-ray or other
test for you, how often did you get those
results as soon as you needed them?
In the last 6 months, how often did you and
your personal doctor talk about all the
prescription medicines you were taking?
In the last 6 months, did you get the help you
needed from your personal doctor’s office to
manage your care among these different
providers and services?
In the last 6 months, how often did your
personal doctor seem informed and up-to-
date about the care you got from specialists?
Care Coordination Composite
20

21 INTERNAL DRAFT – POLICY IN DEVELOPMENT
83%
83%
85%
88%
88%
89%
0% 20% 40% 60% 80% 100%
Massachusetts Medicare Advantage Average
National MMP Average
FTC
National Medicare Advantage Average
Tufts
CCAThe Customer Service
Composite consists of the
following questions:
In the last 6 months, how
often did your health plan's
customer service give you
the information or help you
needed?
In the last 6 months, how
often did your health plan’s
customer service staff treat
you with courtesy and
respect?
In the last 6 months, how
often were the forms for
your health plan easy to fill
out?
Customer Service Composite
21

22 INTERNAL DRAFT – POLICY IN DEVELOPMENT
71%
74%
76%
77%
79%
81%
0% 20% 40% 60% 80% 100%
National MMP Average
FTC
National Medicare Advantage Average
Tufts
Massachusetts Medicare AdvantageAverage
CCAThe Getting Appointments and
Care Quickly Composite consists
of the following questions:
In the last 6 months, when you
needed care right away, how
often did you get care as soon as
you thought you needed?
In the last 6 months, not counting
the times you needed care right
away, how often did you get an
appointment for your health care
at a doctor’s office or clinic as
soon as you thought you
needed?
Wait time includes time spent in
the waiting room and exam room.
In the last 6 months, how often
did you see the person you came
to see within 15 minutes of your
appointment time?
Getting Appointments and Care Quickly
Composite
22

23 INTERNAL DRAFT – POLICY IN DEVELOPMENT
90%
91%
91%
93%
0% 20% 40% 60% 80% 100%
National MMP Average
National Medicare Advantage Average
Massachusetts Medicare AdvantageAverage
CCA
The Doctors Who Communicate
Well Composite consists of the
following questions:
In the last 6 months, how often did
your personal doctor explain things
in a way that was easy to
understand?
In the last 6 months, how often did
your personal doctor listen carefully
to you?
In the last 6 months, how often did
your personal doctor show respect
for what you had to say?
In the last 6 months, how often did
your personal doctor spend enough
time with you?
*Information for TUFTS and FTC is not
included in this graphic as their response rate
for this question was too small
Doctors Who Communicate Well
Composite*
23
24 INTERNAL DRAFT – POLICY IN DEVELOPMENT
CCA’s Response to CAHPS Performance
• CCA is extremely pleased with and proud of the results of the CAHPS
survey.
• The results are even more remarkable when considered in light of the high
needs of the members that CCA serves.
• CCA remains focused on meeting our members’ needs and is in the
process of implementing improvements to how we deliver our model of
care to ensure that we maintain or improve on the very positive
experience and high level of satisfaction reflected in the CAHPS survey
results.
24

25 INTERNAL DRAFT – POLICY IN DEVELOPMENT
Tufts’ Response to CAHPS Performance
• For all measures noted, Tufts Health Plan performed better than both the
National Medicare Advantage Average and the MMP Average.
• Member experience in general is impacted by differences in care delivery
models across MMPs.
• Given that 2015 was a baseline performance year, Tufts Health Plan will
continue to monitor performance on future CAHPS surveys and will
evaluate key drivers of critical measures in order to inform quality
improvement opportunities.
• Since receiving the 2015 MA-CAHPS data, internal performance data have
suggested that there is opportunity for improvement in member services,
and activities in this area should lead to improvement in member
experience.
25

26 INTERNAL DRAFT – POLICY IN DEVELOPMENT
Summary of CAHPS Survey Performance
• Overall the One Care CAHPS survey results indicate high customer satisfaction
for outpatient care provided
• For the CAHPS composites shown:
CCA and Tufts consistently performed better than the Medicare
Advantage Average
Tufts and CCA consistently performed better than the MMP Average
(capitated model demonstrations)
In each measure, CCA members reported highest satisfaction, followed
closely by Tufts members on 3 of their 4 measures
26

27 INTERNAL DRAFT – POLICY IN DEVELOPMENT
Healthcare Effectiveness Data and
Information Set (HEDIS)
27

28 INTERNAL DRAFT – POLICY IN DEVELOPMENT
HEDIS Summary
HEDIS data shown is from January 1, 2014 -
December 31, 2014 reported in June of 2015
These are the most up-to-date HEDIS data
available
“HEDIS is a tool used by more than 90 percent of
America's health plans (Medicaid, Medicare, and
Commercial) to measure performance on important
dimensions of care and service.”
Because so many plans collect HEDIS data, and
because the measures are so specifically defined,
HEDIS makes it possible to compare the performance
of health plans on an "apples-to-apples" basis.
Employers, consultants, and consumers use HEDIS
data to help them select the best health plan for their
needs.
To ensure the validity of HEDIS results, all data is
rigorously audited by certified auditors using a
process designed by the National Committee of
Quality Assurance (NCQA) .
To ensure the measure slate is up to date, new
specifications are released each year. NCQA has a
Committee on Performance Measurement, consisting
of employers, consumers, health plans and others,
who collectively decide on HEDIS content.
“HEDIS results are included in Quality Compass, an
interactive, web-based comparison tool that allows
users to view plan results and benchmark
information.”
NCQA’s benchmarks include percentiles, which show
the health plan range of performance across the
nation. Percentiles in this presentation are specific to
Medicaid, meaning only Medicaid plans are included
in these calculations.
In this presentation, the NCQA Medicaid 75th and
90th percentiles are included in each graph. These
percentiles are mainly used as a benchmark/
comparative data for plans.
75th Percentile shows top 25% of performance
90th Percentile shows top 10% of performance
FOR MORE INFORMATION on HEDIS visit:
http://www.ncqa.org/HEDISQualityMeasurement/WhatisHEDIS.aspx
28

29 INTERNAL DRAFT – POLICY IN DEVELOPMENT
Adults’ Access to
Preventative/Ambulatory Health Services
87%
89%
93%
96%
97%
0% 20% 40% 60% 80% 100%
Medicaid75th
Percentile
Medicaid90th
Percentile
FTC
TUFTS
CCA
The Adults’ Access to Preventative
Ambulatory Health Services
measure is intended to show
access/ availability of care.
The measure illustrates the
percentage of members 20 years
and older who had an ambulatory or
preventative care visit.
Each plan scored well above the
Medicaid 90th percentile indicating
Massachusetts One Care members
are accessing preventative services
at a much higher rate than the
average Medicaid enrollee.
29 Data from Calendar Year 2014 (DY1)

30 INTERNAL DRAFT – POLICY IN DEVELOPMENT
Identification of Alcohol and Other Drug
Services
6%
11%
28%
29%
32%
0% 20% 40% 60% 80% 100%
Medicaid 75th Percentile
Medicaid 90th Percentile
CCA
FTC
Tufts
This measure summarizes the
number and percentage of
members with an alcohol and
other drug claim who received the
following chemical dependency
services during the measurement
year:
Any service
Inpatient
Intensive outpatient or
partial hospitalization
Outpatient or ED
30 Data from Calendar Year 2014 (DY1)

31 INTERNAL DRAFT – POLICY IN DEVELOPMENT
The measure illustrates the
percentage of membership who
received the following behavioral
health services: inpatient,
intensive outpatient or partial
hospitalization, outpatient or ED
The data informs us that both
Tufts and CCA members utilize
behavioral health services more
frequently than the 90th Medicaid
Percentile
All Massachusetts One Care
plans show their members
accessing BH services at a high
frequency – much greater than
standard Medicaid only Managed
Care Plans
Behavioral Health Service Utilization
15%
21%
47%
76%
76%
0% 10% 20% 30% 40% 50% 60% 70% 80% 90% 100%
75thMedicaidPercentile
90thMedicaidPercentile
CCA
FTC
Tufts
Data from Calendar Year 2014 (DY1) – HEDIS Measure Mental Health Utilization: MPT 31

32 INTERNAL DRAFT – POLICY IN DEVELOPMENT
This measure is intended to illustrate the
percentage of hospital discharges for mental illness
that were followed up by an appropriate mental
health outpatient visit, intensive outpatient
encounter, or partial hospitalization with a mental
health practitioner:
30 day chart shows % of discharges for
which the member received follow-up
within 30 days
7 day chart shows % of discharges for
which the member received follow-up
within 7 days
All plans show an increased follow-up from 7 to 30
days
Follow-Up
Hospitalization
(FUH) for Mental
Illness
31%
54%
57%
59%
64%
0% 20% 40% 60% 80% 100%
CCA
FTC
75th MedicaidPercentile
Tufts
90th MedicaidPercentile
7-DAY
55%
75%
78%
79%
80%
0% 20% 40% 60% 80% 100%
CCA
75th MedicaidPercentile
Tufts
FTC
90th MedicaidPercentile
30-DAY
32 Data from Calendar Year 2014 (DY1)
33 INTERNAL DRAFT – POLICY IN DEVELOPMENT
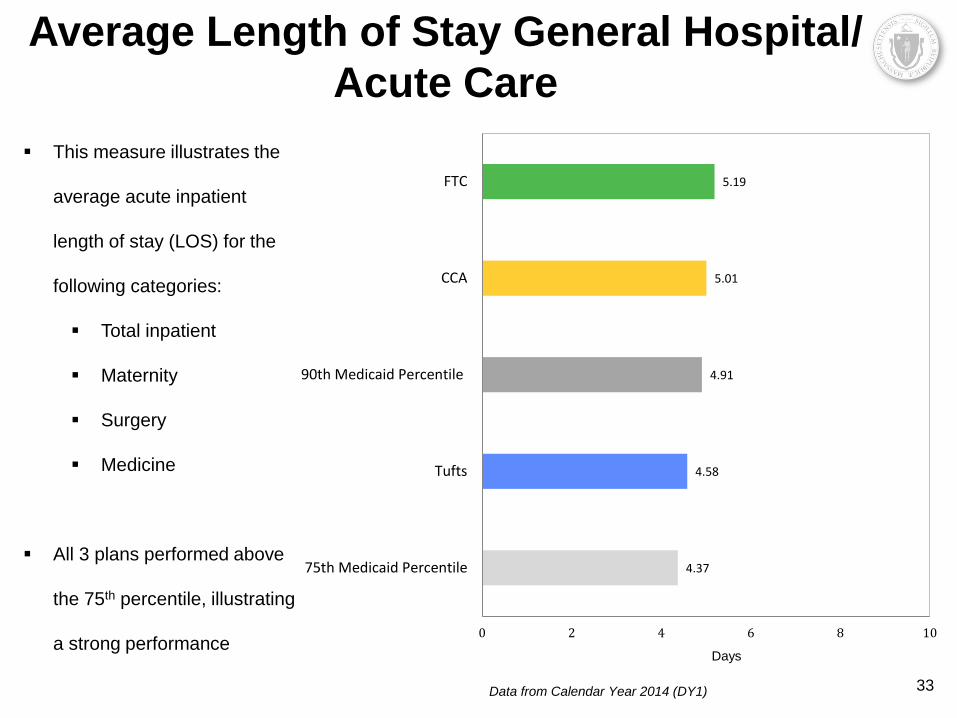
This measure illustrates the
average acute inpatient
length of stay (LOS) for the
following categories:
Total inpatient
Maternity
Surgery
Medicine
All 3 plans performed above
the 75th percentile, illustrating
a strong performance
Average Length of Stay General Hospital/
Acute Care
4.37
4.58
4.91
5.01
5.19
0 2 4 6 8 10
75th Medicaid Percentile
Tufts
90th Medicaid Percentile
CCA
FTC
Data from Calendar Year 2014 (DY1) 33
Days

34 INTERNAL DRAFT – POLICY IN DEVELOPMENT
CCA’s Response to HEDIS Data Measure Successes, Challenges and Interventions
Access to Preventative
/ Ambulatory Services
CCA is pleased with the findings and is working to maintain the high level of access reflected in this
measure.
Identification of Alcohol
and Other Drug
Services
CCA recognizes that identification, referral to treatment and support in recovery for members with
alcohol and/or substance use disorder is an important and often under-resourced component of most
care delivery models. As many of our members have faced stigma and discrimination in the past, they
have been challenged in disclosing alcohol or substance use disorders. In response to this, CCA has
received technical assistance from the MA Department of Public Health to develop a pilot program
around Screening, Brief Intervention and Referral to Treatment for substance use disorders (SBIRT).
We have also worked to strengthen our internal capacity to provide appropriate support, and are
currently in the process of implementing a naloxone co-prescribing program that will further open the
door to more discussions and collaborative engagement of our members struggling with alcohol and/or
substance use.
Behavioral Health
Service Utilization
CCA is encouraged to report that our overall utilization of outpatient and community behavioral health
services appears to be increasing relative to our acute and inpatient utilization. We believe that this
reflects improvements in access amongst our members to appropriate outpatient behavioral health
resources, and anticipate that this will continue as we engage members in ongoing care.
Follow-up
Hospitalization for
Mental Illness
CCA has engaged heavily in building clinical programs to ensure that we provide support to our
members who have been hospitalized for mental illness. Since mid-2015, CCA instituted a new policy
that ensures that all members hospitalized for mental illness are tracked by the internal behavioral
health staff and are seen by a behavioral health clinician within 48 hours of their discharge. This has
resulted in an improvement in our most recent metrics.
Average LOS General
Hospital / Acute Care
Average LOS for inpatient care is dependent on a multitude of factors, including medical complexity of
the member, as well as their post-discharge care needs. CCA continues to partner with hospitals, post-
acute care settings and our members and caregivers to support effective, timely hospitalizations and
appropriate care transitions.
34

35 INTERNAL DRAFT – POLICY IN DEVELOPMENT
Tufts’ Response to HEDIS Data
• Tufts Health Plan’s performance on the Identification of Alcohol and Other Drug
Services measure suggests that its Model of Care, which is designed around an
interdisciplinary approach and encompasses a wide range of behavioral and social
services that address substance use and related issues, is impacting member care.
• Performance on the Behavioral Health Services Utilization measure reflects the
member profile of the Tufts Health Plan’s One Care (Tufts Health Unify) Program,
which includes behavioral health and substance use as a both a primary condition,
as well as related co-morbid conditions.
• Tufts Health Plan’s performance on the FUH measure for the One Care (Tufts
Health Unify) Program is consistent with its performance in other product lines. Tufts
Health Plan has identified this as an area of opportunity and is exploring strategies to
improve performance related to care transitions.
• Tufts Health Plan is performing better than the Medicaid 75th percentile on the
Average Length of Stay measure, which is as expected
35

36 INTERNAL DRAFT – POLICY IN DEVELOPMENT
Grievance Reporting
36
37 INTERNAL DRAFT – POLICY IN DEVELOPMENT
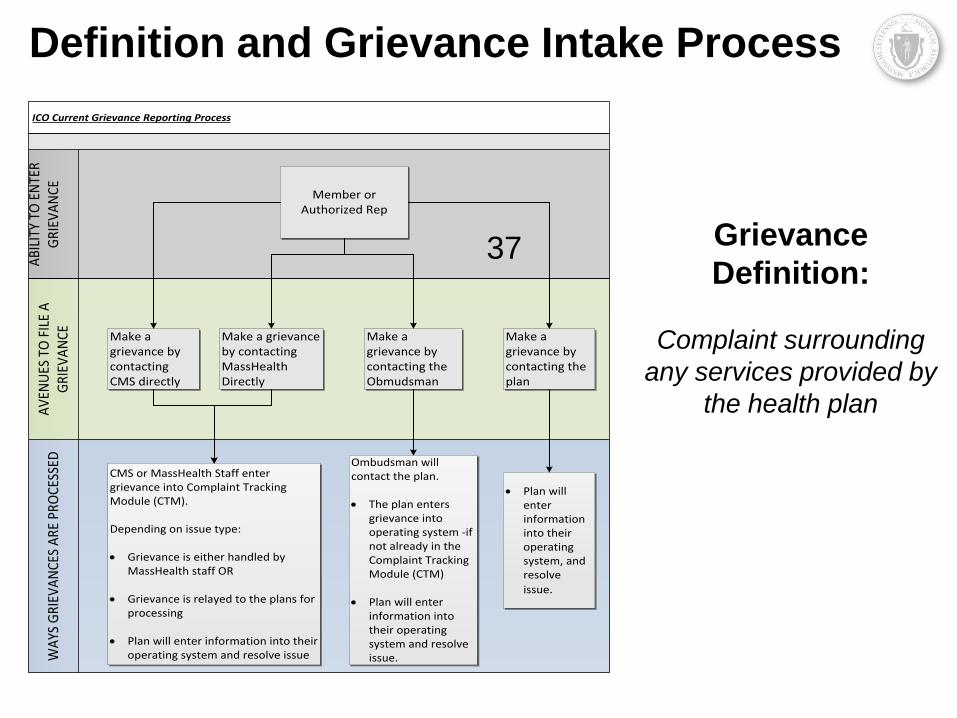
Definition and Grievance Intake Process
Grievance
Definition:
Complaint surrounding
any services provided by
the health plan
ICO Current Grievance Reporting Process
AV
ENU
ES T
O F
ILE
A
GRI
EVA
NCE
WA
YS G
RIEV
AN
CES
ARE
PRO
CESS
EDA
BILI
TY T
O E
NTE
R G
RIEV
AN
CE
Make a grievance by contacting CMS directly
Member or Authorized Rep
Make a grievance by contacting MassHealth Directly
Make a grievance by contacting the Obmudsman
Make a grievance by contacting the plan
CMS or MassHealth Staff enter grievance into Complaint Tracking Module (CTM).
Depending on issue type:
· Grievance is either handled by MassHealth staff OR
· Grievance is relayed to the plans for processing
· Plan will enter information into their operating system and resolve issue
Ombudsman will contact the plan.
· The plan enters grievance into operating system -if not already in the Complaint Tracking Module (CTM)
· Plan will enter
information into their operating system and resolve issue.
· Plan will enter information into their operating system, and resolve
issue.
37

38 INTERNAL DRAFT – POLICY IN DEVELOPMENT
Grievance Categories
CATEGORY DESCRIPTION EXAMPLE
BP: Dental Dissatisfaction with dental services / plan dental restrictions Upset dental implant was not approved
BP: Part C, Medicaid,
Supplemental
Dissatisfaction with plans covered services/ plan restrictions Upset PCA services not approved
BP: Part D Dissatisfaction with the plans covered prescription drugs Upset brand name drugs not approved
Enrollment Dissatisfaction with the enrollment broker Self-selected and placed in wrong plan
MassHealth Dissatisfaction with MassHealth Incorrectly dis-enrolled from One Care
Medicare Dissatisfaction with services provided by Medicare Received incorrect information from
Medicare
Network/Access Dissatisfaction surrounding provider access/ availability Preferred provider not in network
Other Any grievance that does not fit into one of the pre-existing
categories
Plan Management Dissatisfaction with the plan oversight Care Coordinator is unresponsive
Plan Marketing Materials Dissatisfaction with marketing materials received from the
plan
Too many materials sent
Provider Dissatisfaction with a provider Rude office manager at specialist’s office
Quality of Care Dissatisfaction with the quality of care received Provided incorrect medication
Transportation Dissatisfaction with transportation services provided Transportation no-shows/late arrivals
• Members may submit grievances to the One Care Ombudsman, MassHealth, or CMS.
• Grievances are recorded electronically and grouped in the categories below.
38

39 INTERNAL DRAFT – POLICY IN DEVELOPMENT
April_15 May_15June_1
5July_15 Aug_15
Sept_15
Oct_15 Nov_15 Dec_15
CCA - % of membership 2.21% 1.99% 1.63% 2.13% 2.49% 2.64% 3.04% 2.54% 1.77%
CCA - # of Grievances 227 206 170 224 266 281 322 262 181
Tufts - % of membership 0.81% 0.49% 1.61% 1.02% 2.34% 1.42% 1.79% 1.56% 1.21%
Tufts - # of Grievances 15 9 29 18 41 26 37 32 25
0.00%
0.50%
1.00%
1.50%
2.00%
2.50%
3.00%
3.50%
4.00%
4.50%
5.00%
CCA - % ofmembership
Tufts - % ofmembership
April 2015 – December 2015 Percentage of Plan Membership with Grievances
39

40 INTERNAL DRAFT – POLICY IN DEVELOPMENT
Data includes only grievances Q2 2015-Q4 2015. Grievance data collected prior to this period was not assigned to
categories.
16%
50% 81%
0% 15% 30% 45% 60% 75% 90%
BP: Dental: 18
BP: Part C, Medicaid, and Supplemental: 9
BP: Part D: 12
Enrollment: 1
MassHealth: 1
Medicare: 0
Network: 51
Other: 42
Plan Management: 199
Plan Marketing Materials: 1
Provider: 102
Quality of Care: 80
Transportation: 1855
CCA
Tufts
EXAMINE CATEGORIES
EXCEEDING 15% THRESHOLD
April 2015 – December 2015 Grievances Percentage of Total Grievances by Category
COMBINED # OF GRIEVANCES
40

41 INTERNAL DRAFT – POLICY IN DEVELOPMENT
April_15 May_15June_1
5July_15 Aug_15 Sept_15 Oct_15 Nov_15 Dec_15
CCA - % of membership 1.79% 1.54% 1.32% 1.64% 1.96% 2.13% 2.48% 2.16% 1.59%
CCA - # of Grievances 184 159 138 173 209 227 263 223 162
TUFTS - % of membership 0.59% 0.22% 0.67% 0.57% 0.97% 0.82% 0.92% 0.73% 0.68%
TUFTS - # of Grievances 11 4 12 10 17 15 19 15 14
0.00%
0.50%
1.00%
1.50%
2.00%
2.50%
3.00%
3.50%
4.00%
4.50%
5.00%
CCA - % ofmembership
TUFTS - % ofmembership
April 2015 – December 2015 Grievances Percentage of Plan Membership with Transportation
Grievances
41

42 INTERNAL DRAFT – POLICY IN DEVELOPMENT
April_15 May_15 June_15 July_15 Aug_15 Sept_15 Oct_15 Nov_15 Dec_15
CCA - % of membership 0.00% 0.02% 0.02% 0.01% 0.05% 0.00% 0.03% 0.00% 0.01%
CCA - # of Grievances 0 2 2 1 5 0 3 0 1
TUFTS - % of membership 0.00% 0.05% 0.00% 0.00% 0.29% 0.22% 0.53% 0.44% 0.34%
TUFTS - # of Grievances 0 1 0 0 5 4 11 9 7
0.00%
0.50%
1.00%
1.50%
2.00%
2.50%
3.00%
3.50%
4.00%
4.50%
5.00%
CCA - % ofmembership
TUFTS - % ofmembership
April 2015 – December 2015 Grievances Percentage of Plan Membership with Network
Grievances
42

43 INTERNAL DRAFT – POLICY IN DEVELOPMENT
MassHealth Grievance Oversight Process
Currently plans report grievances directly to MassHealth on a monthly basis.
These Grievance Reports are circulated to a variety of One Care staff including:
MassHealth Leadership
MassHealth Contract Management
MassHealth Quality Staff
CMS Counterparts
Staff review reports and identify any areas of concern, or questions they may have to further discuss
with the plans.
Areas of concern/questions are then sent to the plans and discussed during the bi-weekly contract
management meetings.
During bi-weekly contract management meetings, plans provide responses on the previously identified
grievances concerns/ questions.
Additionally grievance data is aggregated by quality staff and shared with the plans, allowing plans to
Proactively identify areas of concerns, and
Implement strategies to improve plan operations and member satisfaction
Plan responses illustrating past, previous, and current strategies are shown on the following slides.
43

44 INTERNAL DRAFT – POLICY IN DEVELOPMENT
Background/Context
81% of CCA’s grievances are
transportation related
Transportation utilization
consistently increasing – April
2016 average is over 20,000
rides per month.
Grievances decreasing each
month despite steady increases
in utilization.
Complaints consistently remain
less than 1% of trip volume.
The decrease in complaints is
attributed to numerous efforts
and interventions (see right).
Top 3 issues are:
• Vendor/driver lateness
• Vendor/driver no-shows
• Customer service,
including clerical errors
INTERVENTIONS
Lateness
Implemented a one hour pick-up window for Boston and Greater Boston
Observed immediate improvement in member satisfaction
Reinforced communications policy for vendors to notify CCA when they are
late so CCA can call the member and provider offices as appropriate
No-shows and Lateness
Reduce volume of rides to no-show and late vendors
Work with vendor to address issues impacting lateness, no-shows, customer
service
Annual vendor meetings and regular communication to vendors via fax and
email blasts
Other
Staff trainings to address data entry errors that result in member complaints
at CCA and transportation broker
Staff is held accountable for errors made
Improvements to Existing Operations
Implementation of skills-based routing prompts within Transportation toll-free
line
Ongoing efforts with member education
CCA and broker leadership met in December 2015 to agree upon ongoing
improvement strategies
Innovations
Implementation of portal for CCA staff: directly schedule in broker’s portal
Improving interactive voice response solutions - Members to confirm rides
44
CCA’s Response to Grievance Data

45 INTERNAL DRAFT – POLICY IN DEVELOPMENT
TRANSPORTATION
Less than 1% of all rides result in a grievance.
In general, members complain that:
• their ride was late for the scheduled pick up;
• did not show; or
• in some cases, members grieved that the transport
showed up too early.
Staff review all transportation grievances with contracted
vendors to resolve the specific grievance, and identify
opportunities for improvement.
In 2015, Tufts Health Plan enhanced the oversight
function for transportation vendors, added multiple
companies to the network, and ended a relationship with
a vendor.
Despite increasing membership enrollment and
utilization, Tufts Health Plan improved performance of its
transportation network according to grievance trends.
Tufts Health Plan continues to monitor transportation-
related grievances and will implement additional changes
as necessary in the future.
NETWORK
Network-related grievances were filed by 0.5% of
members during the reporting period.
Majority of network grievances received following
FTC exit from One Care
Most often, members grieve that their PCP or
specialist is not in network.
Customer service and care management staff work
individually with these members to identify in-network
providers to satisfy their needs.
Tufts Health Plan's provider network meets or
exceeds proximity access requirements for facilities
and providers.
In Fall 2015, Tufts Health Plan passed CMS's new
network adequacy requirements for Medicare-
Medicaid Plans.
Membership and utilization patterns are consistently
monitored against network adequacy requirements; if
gaps are identified, Tufts Health Plan pursues
contracts with relevant providers as expeditiously as
possible.
45
Tufts’ Response to Grievance Data

46 INTERNAL DRAFT – POLICY IN DEVELOPMENT
FINANCIAL DATA
46

47 INTERNAL DRAFT – POLICY IN DEVELOPMENT
Plan Financials • CCA and Tufts saw significant improvements in their financials for DY2 (2015) compared to DY1
(2013/2014)
• In DY2, MassHealth and CMS implemented rate enhancements and program efficiencies in order to
stabilize the One Care program
• DY1 information does not account for additional risk corridor payments to the plans (amounts are still
being finalized)
Notes on DY1: DY1 data is based on financial reports submitted to MassHealth by the plans for October 2013 – December 2014, updated in October 2015.
Revenue was adjusted to include quality incentive payments to all plans and Interim Risk Corridor Payment line reflects payment made to CCA. Revenue
excludes interim risk corridor payment to FTC and Tufts and final risk corridor payments for all qualifying plans (amounts TBD).
Notes on DY2: FTC financials not included due to plan exiting the program on 9/30/15. CCA and Tufts spending includes claims runout through 1/31/16 as
reported to MassHealth. Revenue was adjusted to include rate enhancement payments for 2015 made by MassHealth in February 2016. (CMS's rate
enhancement payments were included in CCA's and Tufts' revenues as reported to MassHealth.) The rate enhancement payments were made available through
execution of contract amendments and are contingent on continued participation in the Demonstration through December 2016. Revenue excludes any future
Medicaid reconciliation payments for RY15 rate enhancements, and potential risk corridor payments or recoupments for qualifying plans.
Demo Year 2 - Q1-Q4 (1/1/15- 12/31/15)
CCA Tufts
Total Spending 386,131,698$ 51,329,878$
Total Revenue 385,715,219$ 54,341,571$
Net Income (416,478)$ 3,011,693$
Net Gain/Loss -0.1% 5.5%
Average Member Months 10,403 1,906
Demo Year 1 Q1-Q5 (10/1/13-12/31/14)
CCA Tufts FTC
Total Spending 291,804,133$ 30,853,089$ 108,103,203$
Total Revenue 256,946,563$ 30,391,126$ 97,102,556$
Interim Risk Corridor Payment 16,467,408$ TBD TBD
Net Income (18,390,162)$ (461,963)$ (11,000,647)$
Net Gain/Loss -6.7% -1.5% -11.3%
Average Member Months 7,239 1,081 4,135
47

48 INTERNAL DRAFT – POLICY IN DEVELOPMENT
PMPM Service Spending by Plan and RC
• In aggregate, average PMPMs for members in C2 and C3 rating categories (RCs) changed less than +/- 3%
between DY1 and DY2, while average PMPMs for C1 and F1 increased by 12% and 14%, respectively
• There were large variations in PMPM changes across plans and rating categories
• CCA’s PMPM spending increased for C1 and C3B, and decreased for the other rating categories
• Tufts’ PMPM spending increased in almost all community rating categories (C1 through C3A); the largest increase was
41% for C1s
• FTC’s PMPM spending increased in the highest risk community categories (C2B and C3B), but decreased in all other
categories
• PMPM spending for F1 decreased for all three plans between -3% and -60%, but increased in the aggregate once
adjusted for plan caseload. Volatile spending in F1 was likely driven by very small caseload (avg. <20 members) in this
rating category.
Notes: PMPMs reflect claims as reported by the plans as of a certain date; incorporating additional claims will change these numbers.
For DY2, FTC reported information through program exit (2015 Q1 – Q3) with claims through 10/31/15; CCA and Tufts information reflects full Demo
Year with claims through 1/31/16
DY1 DY2 Δ DY1 DY2 Δ DY1 DY2 Δ
CCA 1,246$ 1,364$ 9% 1,907$ 1,871$ -2% 3,053$ 2,849$ -7%
Tufts 1,135$ 1,596$ 41% 1,220$ 1,312$ 7% 1,828$ 2,215$ 21%
FTC 937$ 896$ -4% 1,385$ 1,295$ -6% 2,039$ 2,126$ 4%
Avg. All Plans 1,110$ 1,244$ 12% 1,594$ 1,643$ 3% 2,471$ 2,435$ -1%
DY1 DY2 Δ DY1 DY2 Δ DY1 DY2 Δ
CCA 4,067$ 4,012$ -1% 8,220$ 8,384$ 2% 10,558$ 10,219$ -3%
Tufts 3,516$ 3,914$ 11% 5,836$ 4,232$ -27% 6,211$ 5,428$ -13%
FTC 4,299$ 4,190$ -3% 6,205$ 6,828$ 10% 8,234$ 3,260$ -60%
Avg. All Plans 4,066$ 4,042$ -1% 8,007$ 8,143$ 2% 8,218$ 9,370$ 14%
C2A: Community High
Behavioral Health
C2B: Community Very
High Behavioral Health
C3A: High Community
Needs
C3B: Very High
Community NeedsF1: Facility Based Care
C1: Community Other
48

49 INTERNAL DRAFT – POLICY IN DEVELOPMENT
CCA – PMPM Service Spend DY1 Avg. PMPM = $2,205 DY2 Avg. PMPM = $2,641
One Care Plan medical and LTSS PMPM spending from October 1, 2013 – Dec. 31, 2015 as
reported by CCA, subject to verification by MassHealth and CMS.
IBNR: Incurred but not reported spending is an estimate of costs that have been incurred for
services provided during the reporting period, but that have not yet been billed or adjudicated.
Note that data reflect spending on claims as of a certain date (through 9/30/15 for DY1 and
1/31/16 for DY2), as reported by the plan; incorporating additional claims will change these
numbers. Administrative spending is not included.
49
Member
Months
C1 56,898 52% 42,984 34%
C2A 20,976 19% 27,966 22%
C2B 3,432 3% 5,262 4%
C3A 25,670 24% 46,750 37%
C3B 1,406 1% 1,650 1%
F1 203 0% 229 0%
Total 108,585 100% 124,841 100%
DY1 DY2

50 INTERNAL DRAFT – POLICY IN DEVELOPMENT
Tufts – PMPM Service Spend DY1 Avg. PMPM = $1,504 DY2 Avg. PMPM = $1,940
One Care Plan medical and LTSS PMPM spending from October 1, 2013 – Dec. 31, 2015 as
reported by Tufts, subject to verification by MassHealth and CMS.
IBNR: Incurred but not reported spending is an estimate of costs that have been incurred for
services provided during the reporting period, but that have not yet been billed or adjudicated.
Note that data reflect spending on claims as of a certain date (through 9/30/15 for DY1 and
1/31/16 for DY2), as reported by the plan; incorporating additional claims will change these
numbers. Administrative spending is not included.
50
Member
Months
C1 6,689 41% 6,875 30%
C2A 6,342 39% 9,306 41%
C2B 1,346 8% 2,972 13%
C3A 1,791 11% 3,637 16%
C3B 43 0% 50 0%
F1 7 0% 28 0%
Total 16,218 100% 22,868 100%
DY1 DY2

51 INTERNAL DRAFT – POLICY IN DEVELOPMENT
PMPM Service Spend Notes
• Complexity of One Care population increased significantly between DY1 and DY2
• Members with higher rating categories are enrolled in One Care at higher rates compared to their proportion of the eligible population as a whole
Consistent with increasing casemix complexity, average PMPMs increased between DY1 and DY2 for CCA and Tufts
Incurred but not reported (IBNR) spending is notably higher in DY2 than DY1 due to timing of available claims; we do not know if IBNR will distribute proportionately among service categories
IBNR: Incurred but not reported spending is an estimate of costs that have been incurred for services provided during the reporting period, but that have
not yet been billed or adjudicated. Note that data reflect spending on claims as of a certain date (through 9/30/15 for DY1 and 1/31/16 for DY2), as
reported by the plans; incorporating additional claims will change these numbers.
– Proportion of enrolled C1s
decreased significantly for both
plans:
• 52% to 34% for CCA
• 41% to 30% for Tufts
– Percentage of enrolled C2As, C2Bs
(high BH needs) and especially
C3As (high LTSS needs) increased
significantly within plans
• 46% to 63% for CCA
• 58% to 70% for Tufts
% Member
Months
CCA Tufts Eligible
Population CCA Tufts
Eligible
Population
C1 52.4% 41.2% 65.1% 34.4% 30.1% 67.6%
C2A 19.3% 39.1% 16.8% 22.4% 40.7% 14.1%
C2B 3.2% 8.3% 3.1% 4.2% 13.0% 3.5%
C3A 23.6% 11.0% 13.0% 37.4% 15.9% 13.0%
C3B 1.3% 0.3% 0.7% 1.3% 0.2% 0.7%
F1 0.2% 0.0% 1.3% 0.2% 0.1% 1.1%
Total 100.0% 100.0% 100.0% 100.0% 100.0% 100.0%
DY2DY1
>20%HigherthanComparisonGroup
>20%LowerthanComparisonGroup
51
52 INTERNAL DRAFT – POLICY IN DEVELOPMENT
Notable Trends for CCA and Tufts by RC:
DY2 vs. DY1 • On average, Pharmacy Per Member Per Month (PMPM) spending across all rating categories (RCs)
increased
– 10%+ increase across all RCs for members in CCA
– 40%+ increase for C1, C3A, and F1 members in Tufts
• Inpatient Acute Hospital PMPM spending
– Reduction for C2A and C3A members across both plans (ranging from 3-29%)
– 20-30% increase for C1 members across both plans
• Inpatient Mental Health/Substance Abuse PMPM spending
– 34-50% decrease for C2A and C2B members in CCA
– 1% decrease for C2A and 32% increase for C2B members in Tufts
• Community Long-Term Services and Supports (LTSS) PMPM spending
– Reduction across all RCs for CCA members:
▫ May be explained by shift to more complex RCs (e.g., C1 member at high-end of C1 cost range
that moves to C3A could be at the low end of C3A cost range, lowering both average PMPMs)
– 64% increase for C1, and decreases for C2B and C3B members in Tufts
• Proportionate spending and comparisons between years in all service areas could change as IBNR
for DY2 comes down over time
IBNR: Incurred but not reported spending is an estimate of costs that have been incurred for services provided during the reporting period, but that have
not yet been billed or adjudicated. Note that data reflect spending on claims as of a certain date (through 9/30/15 for DY1 and 1/31/16 for DY2), as
reported by the plans; incorporating additional claims will change these numbers. 52

53 INTERNAL DRAFT – POLICY IN DEVELOPMENT
DISCUSSION
53

54 INTERNAL DRAFT – POLICY IN DEVELOPMENT 54
Visit us at www.mass.gov/masshealth/onecare
Email us at [email protected]