
Open Medicine Journal - Bentham Open · Open Medicine Journal, 2016 ... Ancestry of Amerindians and...
17
Send Orders for Reprints to [email protected] Open Medicine Journal, 2016, 3, 269-285 269 1874-2203/16 2016 Bentham Open Open Medicine Journal Content list available at: www.benthamopen.com/MEDJ/ DOI: 10.2174/1874220301603010269 RESEARCH ARTICLE Ancestry of Amerindians and its Impact in Anthropolo Transplantation, HLA Pharmacogenomics and Epidemiology by HLA Study in Wiwa Colombian Population Antonio Arnaiz-Villena 1,* , Ester Muñiz 1,* , Jose del Palacio-Gruber 1 , Cristina Campos 1 , Javier Alonso-Rubio 1 , Eduardo Gomez-Casado 2 , Filogonio Lopez-Pacheco 3 , Manuel Martin-Villa 1 and Carlos Silvera 4 1 Department of Immunology, University Complutense, School of Medicine, Madrid Regional Blood Center, Madrid, Spain 2 Department of Inmunología Animal, Instituto Nacional de Investigación y Tecnología Agraria y Alimentaria (INIA), Autopista A6, Hipódromo, Madrid, Spain 3 Department of Molecular Biology, Instituto Nacional de Cardiología Ignacio Chávez, Mexico City, Mexico 4 Universidad del Norte, Barranquilla, Colombia Received: August 01, 2016 Revised: September 29, 2016 Accepted: November 05, 2016 Abstract: Background: HLA autosomic genes are unique because they conform the most polymorphic human system. Importance of this system is recognized in Medicine for Transplantation, Epidemiology (HLA and disease linkage), Pharmacogenomics (HLA linked to drug side effects) and for defining the origin of populations in both male and female lineages. Objectives: Studying HLA profile of a isolated Amerindian group from North Colombia (Wiwa) in order to draw conclusions about its Preventive Medicine, the genetic relationship with Worldwide populations and America peopling, since this last issue is hotly debated. Methodology: A total of 14,660 HLA chromosomes were included. Peripheral blood was obtained from volunteer blood donors belonging to Wiwa (also named Arsario) ethnic group. HLA-A, -B, -C, -DRB1 and -DQB1 genes were analyzed by standard methods. Wiwa Amerindians relationships with others were calculated by using Arlequin, Dispan and Vista software computer packages. Results: Extended HLA, -A, -B, -C, -DRB1 and -DQB1 haplotypes have been studied for the first time in this population. Classical Amerindian haplotypes have been found and also new Wiwa (Arsario) Amerindian haplotypes. New haplotypes are A*68:01 - B*15:01 - C*03:03 - DRB1*14:02 - DQB1*03:02, A*11:01 - B*07:02 - C*07:02 - DRB1*15:03 - DQB1*06:02 and A*68:01 - B*15:01 - C*03:04 - DRB1*14:02 - DQB1*03:01. Conclusion: They have been reached after exhaustive comparisons of Wiwa with other Amerindians and Worldwide populations by using genetic * Address correspondence to these authors at the Department of Immunology, Faculty of Medicine, Universidad Complutense, Pavilion 5, floor 4. Avda. Complutense s / n, 28040 Madrid, Spain; Tel: +34 91 3017354; E-mail: [email protected]; Web page: http://chopo.pntic.mec. es/biolmol/
Transcript of Open Medicine Journal - Bentham Open · Open Medicine Journal, 2016 ... Ancestry of Amerindians and...

Send Orders for Reprints to [email protected]
Open Medicine Journal, 2016, 3, 269-285 269
1874-2203/16 2016 Bentham Open
Open Medicine Journal
Content list available at: www.benthamopen.com/MEDJ/
DOI: 10.2174/1874220301603010269
RESEARCH ARTICLE
Ancestry of Amerindians and its Impact in Anthropology,Transplantation, HLA Pharmacogenomics and Epidemiology by HLAStudy in Wiwa Colombian Population
Antonio Arnaiz-Villena1,*, Ester Muñiz1,*, Jose del Palacio-Gruber1, Cristina Campos1, JavierAlonso-Rubio1, Eduardo Gomez-Casado2, Filogonio Lopez-Pacheco3, Manuel Martin-Villa1 andCarlos Silvera4
1Department of Immunology, University Complutense, School of Medicine, Madrid Regional Blood Center, Madrid,Spain2Department of Inmunología Animal, Instituto Nacional de Investigación y Tecnología Agraria y Alimentaria (INIA),Autopista A6, Hipódromo, Madrid, Spain3Department of Molecular Biology, Instituto Nacional de Cardiología Ignacio Chávez, Mexico City, Mexico4Universidad del Norte, Barranquilla, Colombia
Received: August 01, 2016 Revised: September 29, 2016 Accepted: November 05, 2016
Abstract:
Background:
HLA autosomic genes are unique because they conform the most polymorphic human system. Importance of this system isrecognized in Medicine for Transplantation, Epidemiology (HLA and disease linkage), Pharmacogenomics (HLA linked to drug sideeffects) and for defining the origin of populations in both male and female lineages.
Objectives:
Studying HLA profile of a isolated Amerindian group from North Colombia (Wiwa) in order to draw conclusions about itsPreventive Medicine, the genetic relationship with Worldwide populations and America peopling, since this last issue is hotlydebated.
Methodology:
A total of 14,660 HLA chromosomes were included. Peripheral blood was obtained from volunteer blood donors belonging to Wiwa(also named Arsario) ethnic group. HLA-A, -B, -C, -DRB1 and -DQB1 genes were analyzed by standard methods. WiwaAmerindians relationships with others were calculated by using Arlequin, Dispan and Vista software computer packages.
Results:
Extended HLA, -A, -B, -C, -DRB1 and -DQB1 haplotypes have been studied for the first time in this population. ClassicalAmerindian haplotypes have been found and also new Wiwa (Arsario) Amerindian haplotypes. New haplotypes are A*68:01 -B*15:01 - C*03:03 - DRB1*14:02 - DQB1*03:02, A*11:01 - B*07:02 - C*07:02 - DRB1*15:03 - DQB1*06:02 and A*68:01 -B*15:01 - C*03:04 - DRB1*14:02 - DQB1*03:01.
Conclusion:
They have been reached after exhaustive comparisons of Wiwa with other Amerindians and Worldwide populations by using genetic
* Address correspondence to these authors at the Department of Immunology, Faculty of Medicine, Universidad Complutense, Pavilion 5, floor 4.Avda. Complutense s / n, 28040 Madrid, Spain; Tel: +34 91 3017354; E-mail: [email protected]; Web page: http://chopo.pntic.mec.es/biolmol/

270 Open Medicine Journal, 2016, Volume 3 Arnaiz-Villena et al.
distances, Neighbor Joining trees, correspondence analysis and specific group of alleles which are common and frequent in bothAmerindians and Pacific Islanders. They are: 1) The Americas First Inhabitants have been probably come through Bering Strait andalso through Pacific (from Austronesia and Asia) and Atlantic (from Europe) routes. A bidirectional gene flow is not discarded. 2)Genetic HLA Amerindian profile is separated from that of other Worldwide populations. 3) Amerindians geographical proximitygroups’ relatedness is not concordant with HLA genetic relatedness, neither with language. This may be explained by a substantialpopulation decrease that occurred after Europeans invaded America in 1492 and carried new pathogens and epidemics. 4) Our resultsare also useful for Wiwa and other Amerindians future preventive medicine (HLA linked diseases), HLA pharmacogenomics andtransplantation regional programs.
Keywords: Amerindians, Americas peopling, Ancestry, Arsario, HLA, Epidemiology, Wiwa, Pharmacogenomics, Transplant.
INTRODUCTION
Wiwa ethnic group is located in the northern part of Colombia, in the departments of Cesar, La Guajira andMagdalena. Some of them inhabit at Sierra Nevada de Santa Marta mountains and some of their more importantsettlements are located between the upper middle basin of the Rancheira river at the Cesar and Badillo rivers (Fig. 1).Their mother language is Damana that belongs to the Chibcha speaking group of languages [1].
First Amerindians are thought to have come from Asia through the Bering land bridge that existed between30,000-12,000 years before present (BP). These conclusions were reached on a cultural, morphological and geneticbackground which is common to American and Asian populations. Both Siberia [2] and Mongolia [3, 4] have been putforward as Asia origin. Greenberg postulated a three wave migration for the peopling of the Americas [5]: Amerindians(most North and South American Indians; 12,000 years BP), Na-Dene (Athabaskans, Navajo, Apache; 8,000 years BP)and Eskimo-Aleuts (6,000 years BP). Research conducted with use of Y Chromosome (Y Chr) and other nuclear DNAmarkers [6 - 8] supported the three-wave model. However, other mtDNA studies have not [9, 10]; others also postulateonly one wave coming from Asia as giving rise to the First Native American ancestors [3, 4].
Fig. (1). Map of the Sierra Nevada de Santa Marta, area where the Wiwa communities are inhabitants.
Also, Amerindians entrance from Asia may have occurred through Coastal Pacific line [11]. A Trans-Pacific routeof people from Asia or Polynesia [12] has been suggested because HTLV-1 virus strains shared identical traits both inJapan and South America [13] and certain HLA alleles may have been introduced by the same route [14, 15]. In thesame way, “quasi-specific” Amerindian HLA alleles, like A*02:12 or B*39:05 [16], have been found in unrelatedindividuals of Easter Island, which implies an early contact between Easter Islanders Polynesians and Amerindians [17].Genetic studies have identified Polynesian mtDNA haplogroups in remains (skulls) of Botocudo Amerindians from
�����������
������������
����
��
����
���
��������
� �����
���������
���������
��
�������������
��������������
������
�
�

Ancestry of Amerindians and its Impact in Anthopology Open Medicine Journal, 2016, Volume 3 271
Brazil (Amerindian group extinct by the end of 19th century) [18]. Other cultural traits indicate a communicationbetween these groups of populations, i.e.: the presence of South American sweet potato in earlier Pacific sites [19] andthe finding of chicken remains of Polynesian type in El Arenal (Chile) dated by radiocarbon back to 1300-1400 AD [20,21]. In addition, skeletal remains of pre-Columbian individuals with Polynesian ancestry and several Mapuche (ChileanAmerindians) artefacts which are similar to Polynesian ones at Mocha island (Chile) have also been reported [19, 22].All these facts provide evidences for this Trans-Pacific route that could have occurred in both ways at different times.
Indeed, we have already concluded from our previous studies on HLA genes that: 1 -Aleuts are a genetic andlinguistic separate group, possibly related to northern European Lapps; both of them came from southern Siberia BaikalLake area. 2- First America Natives, which include all analyzed Amerindians, Na-Dene speakers and Eskimo have hadgenetic flow with Pacific Islanders: the latter share autosomal HLA alleles and haplotypes with them. This fact mayhave been bidirectional. 3- More important, Easter Islanders show a probable cultural and genetic exchange withTitikaka Lake Aymaras; this civilisation also shares specific traits with European-Iberian megalithic builders. 4-Mesoamericans are grouped together because of they bear more ancient Olmec culture traits and present paper HLAresults. 5- Genetics is not able by itself to find out in space and time Americas peopling and First America Inhabitantsrelatedness with Pacific Islanders [12].
Finally, both genetic [23] and archaeological [24] findings indicate that a two-way Trans-Atlantic traffic may haveoccurred before Columbus discovered America; archaeologists in New Mexico and other North America places haverecently found tools used 20,000 years ago in Spanish Solutrean culture [24, 25].
In the present work, we have studied the Wiwa ethnic group HLA allele frequencies and have compared them withthose of Caucasian European, Siberians, Orientals, Na-Dene, Eskimos and Amerindian populations. HLA genes havebeen analyzed for the following Amerindian ethnic groups: Mayans [26], Mixe, Mixtecans, Zapotecans [27], LakotaSioux [28], Mazatecans [29], Lamas [30], Quechuas [31], Aymaras [16], Uros [14], Tarahumaras [32], Mapuches [33],Toba Pilaga, Mataco Wichi, and Eastern Toba [15].
Our aims are: 1) To determine the HLA class I (A, B and C) and HLA class II (DRB1 and DQB1) quasi-specificWiwa Amerindian alleles and specific HLA haplotypes by using indirect DNA sequencing; in other words, the mostfrequent HLA alleles and haplotypes in this ethnic group which are not found or are in very low frequency in otherpopulations, i.e.: genealogy comparisons, 2) To compare the Wiwa Amerindians HLA allele frequencies with those ofother First Americans Native (Na- Dene, Eskimo and Aleuts) and also those of other Asian and Pacific populations(Table 1) in order to find out the HLA relatedness with peoples most likely to be candidates for First Americansancestors, i.e.: groups of genes frequencies comparisons by using class I and/or II HLA alleles and haplotypesfrequencies. 3) To studying specific HLA alleles that are very frequent in Pacific Ocean people and common to bothPacific Ocean people and our Wiwa sample and 4) To establish the Wiwa profile that will be useful for preventive HLAgenetic Epidemiology (HLA linked diseases), HLA Pharmacogenomics and future Transplantation waiting lists.
Table 1. Populations studied in the present work. A total of 14,660 chromosomes were analyzed.
Population N References Population N ReferencesWiwa 55 Present Study Evenks 35 [36]Mazatecans 89 [29] Aleuts 85 [37]Mayans 132 [26] Singapore Chinese 71 [38]Aymara 102 [16] Buyi 70 [38]Lamas 83 [30] Manchu 50 [38]Quechuas 80 [31] Koreans 100 [38]Seri 100 [27] Japanese 493 [38]Mixe 55 [27] Khalk Mongolians 202 [39]Mixtecans 103 [27] Tuvinians 197 [40]Zapotecans 75 [27] Khoton Mongolians 85 [39]Mexican Mestizo 99 Unpublished Results Germans 295 [38]Wayu 58 [41] Danish 124 [38]Arhuaco 123 [42] Sardinians 91 [38]Kogi 67 [42] Italians 184 [38]Mapuches 104 [33] French 179 [38]Cayapa 100 [43] Spaniards 176 [44]

272 Open Medicine Journal, 2016, Volume 3 Arnaiz-Villena et al.
Population N References Population N ReferencesXavantes 74 [15] Spanish Basques 80 [44]Guarani 32 [27] Algerians 102 [45]Toba-Pilaga 19 [15] Berbers (Souss) 98 [46]Mataco-Wichi 49 [15] Macedonians 172 [47]Eastern Toba 135 [15] Cretans 135 [48]Jaiduakama 39 [49] Bushmen 77 [38]Tarahumara 44 [32] South African Blacks 86 [38]Nahuas 85 [50] North American Blacks 132 [38]Mayos 60 [51] Chuvashians 82 [52]Teenek 55 [53] Russians 200 [54]Terena 60 [55] Western Samoa 102 [56]Uros 105 [14] Madang 65 [57]Lakota Sioux 302 [28] Rabaul 60 [57]Eskimos 35 [36] New Caledonia 65 [57]Athabascans 124 [58] Fidji 57 [57]Nivkhs 32 [36] Papua New Guinea 57 [57]Tlinglit 53 [38] Central Desert 152 [59]Udegeys 23 [36] Ainu 50 [60]Koryaks 92 [36] Yuendumu 119 [59]Chukchi 59 [36] Cape York 80 [61]Kets 22 [36] Kimberley 82 [61]
MATERIAL AND METHODS
Population Sample
55 healthy unrelated volunteers from the Wiwa ethnic group were HLA class I and class II typed. The Wiwacommunities are inhabitants of the Sierra Nevada de Santa Marta in the northern part of Colombia (departments ofMagdalena and Cesar). Samples were taken from unrelated individuals from “El Encanto” town at Guanachacariverside (see map Fig. 1). A writing consent to participate in the present study was signed by each individual. Eachindividual was born in this area, had a Wiwa physical appearance and their four grandparents had been born in the samearea and spoke their own language. We compare our data with those of Caucasian Europeans, Siberians, Orientals, Na-Dene Eskimos and Amerindian populations (11th, 12th Workshop), obtaining the genetic distances (comparison was donewith about 14,660 chromosomes) (Table 1), relatedness dendrograms and correspondence analysis. In particular, theAmerindian group includes tribes from the following linguistics families: Arawakan (Wayu and Terena Indians),Chibchan (Kogi, Arhuaco, and Cayapa), Choco-Embera (Jaidukama), Ge Pano Caribe (Xavantes, Mataco and Toba),Mayan (Mayans), Mixe-Zoque (Mixe), Oto-Manguean (Mixtecans, Mazatecans and Zapotecans), Uru-Chipaya (Uros),Uto-Aztecan (Nahuas and Mayos) and Andean groups like Aymara, Quechuas and Lamas [1, 34, 35].
HLA Genotyping
Generic HLA class I (A, B and C) and high resolution HLA class II analysis (DRB1 and DQB1) was performed byPCR-SSOP-Luminex technique [62]. This methodology is fully explained in Ref. [63].
Statistical Analysis
Statistical analysis was performed with Arlequin v3.0 software [64 - 66].
In order to compare phenotype and haplotype HLA frequencies with other populations, the reference tables of the11th and 12th International HLA Workshops were used [38, 67] and allelefrequencies.com web page [68]. Phylogenetictrees (dendrograms) were constructed with the allelic frequencies using the Neighbour-Joining (NJ) method [69] withthe genetic distances between populations (DA) [70], using DISPAN software comprising the programs GNKDST andTREEVIEW [71, 72]. Correspondence analysis in three dimensions and its bidimensional representation was carried outusing the VISTA v5.05 computer program [73], http:/forrest.psych.unc.edu).
(Table 1) contd.....

Ancestry of Amerindians and its Impact in Anthopology Open Medicine Journal, 2016, Volume 3 273
RESULTS
Characteristic HLA Allele Frequencies Found in Wiwa Population; Comparisons with Other World Populations
The expected and observed gene frequency values for HLA-A, -B, -C, -DRB1, and -DQB1 loci do not differsignificantly and the population is found in Hardy-Weinberg equilibrium (data not shown). Table 2 shows the HLAallele frequencies found in the sampled population. Twenty-three different HLA-A, twenty-eight different HLA-B, andseventeen different HLA-C alleles were found in Wiwa sample. However, only five HLA-A alleles, three HLA-Balleles, and six HLA-C alleles, (A*02:01, A*24:02, A*29:02, A*31:01, A*68:01, B*15:01, B*35:43, B*40:02,C*01:02, C*03:04, C*04:01, C*07:02, C*08:02, and C*16:01) had frequencies higher than 4%. With regard to theHLA class II alleles, nineteen different HLA-DRB1 and thirteen different HLA-DQB1 alleles were found. Only fourHLA-DRB1 and four HLA-DQB1 alleles had frequencies higher than 4% (DRB1*04:07, DRB1*07:01, DRB1*08:02,DRB1*14:02, DQB1*02:02, DQB1*03:02, DQB1*04:02, and DQB1*06:02). Most alleles had already been found inAmerindians. DQB1 allele frequencies reflect the DRB1 locus allele distribution due to the strong linkagedisequilibrium between these two loci.
Table 2. HLA-A, -B, -C, -DRB1, and -DQB1 allele frequencies in Wiwa population.
Allele Allelefrequencies (%) Allele Allele
frequencies (%) Allele Allelefrequencies (%)
HLA-A HLA-B HLA-DRB101:01 1.8 35:12 1.8 01:01 0.902:01 10.0 35:14 0.9 01:02 0.902:14 0.9 35:43 37.3 03:01 1.803:01 3.6 35:44 1.8 03:02 0.911:01 1.8 35:68 2.7 04:03 3.624:02 42.7 38:01 1.8 04:05 2.724:14 0.9 39:01 2.7 04:07 53.624:17 0.9 40:02 5.5 07:01 6.424:34 0.9 40:03 2.7 08:02 8.224:57 0.9 40:09 1.8 09:01 0.926:01 1.8 40:11 0.9 11:01 0.929:02 4.5 44:03 3.6 13:01 1.830:01 0.9 44:11 0.9 13:02 1.830:02 1.8 44:45 0.9 14:02 7.331:01 4.5 51:01 0.9 14:07 0.931:12 3.6 53:01 0.9 15:01 3.633:03 1.8 15:03 1.833:18 1.8 HLA-C 15:33 0.936:01 0.9 01:02 50.0 16:01 0.968:01 8.1 01:06 1.868:06 1.8 03:02 0.9 HLA-DQB168:19 0.9 03:03 3.6 02:01 1.874:01 0.9 03:04 8.2 02:02 7.3
03:11 0.9 03:01 3.6HLA-B 03:28 0.9 03:02 62.707:02 3.6 04:01 5.5 03:05 0.907:14 0.9 04:15 1.8 03:09 0.907:96 2.7 05:01 1.8 03:18 2.714:01 1.8 06:14 0.9 04:02 8.214:02 0.9 07:02 8.2 05:01 2.714:11 1.8 07:05 0.9 05:02 0.915:01 12.7 08:02 4.5 06:02 5.518:01 1.8 12:03 2.7 06:03 1.824:02 0.9 15:02 0.9 06:09 0.935:01 0.9 16:01 4.5

274 Open Medicine Journal, 2016, Volume 3 Arnaiz-Villena et al.
Allele Allelefrequencies (%) Allele Allele
frequencies (%) Allele Allelefrequencies (%)
35:04 0.935:05 1.8
Two types of analysis were done in order to compare Wiwa HLA frequencies with other World populationfrequencies: 1) with pooled DRB1 and DQB1 data (data not shown); and 2) with DRB1 only. It was not possible tocarry out a study comparing HLA class I allele frequencies or HLA class I and II conjointly due to the lack of class Istudies in many World wide populations. A single DRB1 study was carried out in order to compare the Wiwa HLApopulation frequencies with those of Caucasoids and Siberians who lacked DQB1 analyses. The Neighbour-Joining(NJ) relatedness dendrogram based on HLA-DRB1 allele frequencies (Fig. 2) separates all the populations in two well-differentiated clusters, one of them shows Amerindian grouped together with North American Na-Dene and Eskimo, aswell as Siberians. The other cluster grouped the rest of World wide populations. Wiwa are integrated in the Amerindiangroup, close to Mexican Mayans. Bootstrap values were 100% in all nodes.
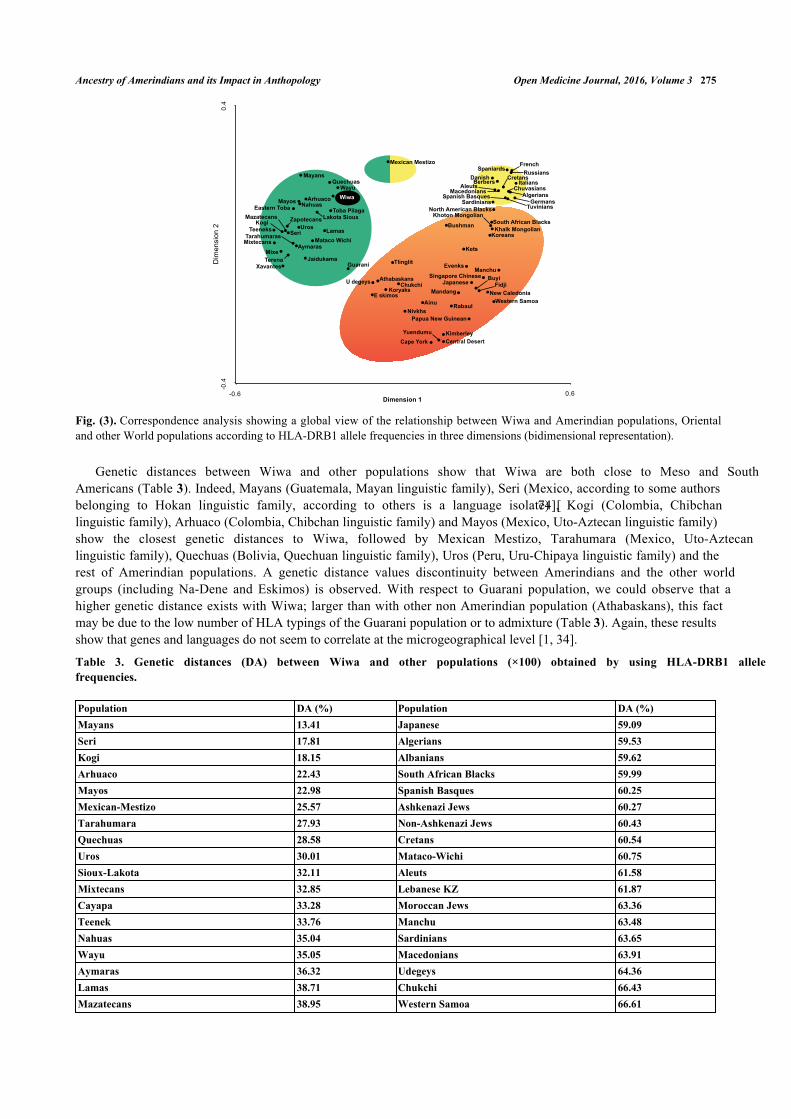
The correspondence analysis based on HLA-DRB1 allele frequencies (Fig. 3) and on HLA-DRB1 and HLA-DQB1frequencies conjointly (data not shown) give similar results: Amerindians (including Wiwa) form a single and compactgroup separated from the rest of World wide populations, which show a continuous genetic variation from Siberia-EastAsia to the Mediterranean (Fig. 3). The North American Na-Dene and Eskimo seem to be closer to Siberian andOrientals than to Amerindians. Lastly, a correspondence analysis based on HLA-DRB1 allele frequencies and on HLA-DRB1 and HLA-DQB1 frequencies conjointly (data not shown) including only Amerindian populations was done tostudy the possible correlation between genes and languages, and it is observed that populations genetically close speaklanguages belonging to different and distant linguistic families [34].
Fig. (2). Neighbour-joining (NJ) dendrogram showing relatedness between Wiwa and other World populations. Genetic distancesbetween populations (DA) were calculated by using HLA-DRB1 (high resolution). Data from World populations were taken fromreferences stated in Table 1. Amerindians cluster together and separated from the rest of the World populations. Bootstrap valueswere 100% in all nodes.
(Table 2) contd.....
����������������� �������
����������������
�������������
��� ���������
��������������
��������������������
������
���������� ������ ��������!�� ������ �
"���������������
"��� ����������#��������
"�������� ��
��$��������� ����
%�����&����������
���'��(��������
)�� �"��
�������
����
�������������
*������(����������+��
+������"�����$
����������,��$�
"��$� ��� ��
)� ����������� ���
#���������� ��
-�����.� �������/�
&�$�0� ����
-� ��������.
��$���
����� �#����������,���
�$�����#����*�����
���� ��&� ��)������#���
������#���
1������%���� ���
�$�����$��
#� ���/�� ���
2���� �����.
��.� ���
"���
���
�������
&�(�
Ancestry of Amerindians and its Impact in Anthopology Open Medicine Journal, 2016, Volume 3 275
Fig. (3). Correspondence analysis showing a global view of the relationship between Wiwa and Amerindian populations, Orientaland other World populations according to HLA-DRB1 allele frequencies in three dimensions (bidimensional representation).
Genetic distances between Wiwa and other populations show that Wiwa are both close to Meso and SouthAmericans (Table 3). Indeed, Mayans (Guatemala, Mayan linguistic family), Seri (Mexico, according to some authorsbelonging to Hokan linguistic family, according to others is a language isolate) [74], Kogi (Colombia, Chibchanlinguistic family), Arhuaco (Colombia, Chibchan linguistic family) and Mayos (Mexico, Uto-Aztecan linguistic family)show the closest genetic distances to Wiwa, followed by Mexican Mestizo, Tarahumara (Mexico, Uto-Aztecanlinguistic family), Quechuas (Bolivia, Quechuan linguistic family), Uros (Peru, Uru-Chipaya linguistic family) and therest of Amerindian populations. A genetic distance values discontinuity between Amerindians and the other worldgroups (including Na-Dene and Eskimos) is observed. With respect to Guarani population, we could observe that ahigher genetic distance exists with Wiwa; larger than with other non Amerindian population (Athabaskans), this factmay be due to the low number of HLA typings of the Guarani population or to admixture (Table 3). Again, these resultsshow that genes and languages do not seem to correlate at the microgeographical level [1, 34].
Table 3. Genetic distances (DA) between Wiwa and other populations (×100) obtained by using HLA-DRB1 allelefrequencies.
Population DA (%) Population DA (%)Mayans 13.41 Japanese 59.09Seri 17.81 Algerians 59.53Kogi 18.15 Albanians 59.62Arhuaco 22.43 South African Blacks 59.99Mayos 22.98 Spanish Basques 60.25Mexican-Mestizo 25.57 Ashkenazi Jews 60.27Tarahumara 27.93 Non-Ashkenazi Jews 60.43Quechuas 28.58 Cretans 60.54Uros 30.01 Mataco-Wichi 60.75Sioux-Lakota 32.11 Aleuts 61.58Mixtecans 32.85 Lebanese KZ 61.87Cayapa 33.28 Moroccan Jews 63.36Teenek 33.76 Manchu 63.48Nahuas 35.04 Sardinians 63.65Wayu 35.05 Macedonians 63.91Aymaras 36.32 Udegeys 64.36Lamas 38.71 Chukchi 66.43Mazatecans 38.95 Western Samoa 66.61
345
���
�����
�6
����������������
���������� �����������������
��������������������
�����
����������
���
������
!��"�����#������$�%����
�������
���
����������������������&���
��'�����
(����������
��)�
�������"�*���+�������
,�����-�������
,��%������ �������#�������%������
������ .�����/����&��������������&�����
&��
(%��������
/���*�"0�
�)�,��"���������������
+�����
�������)�#�������%���
���
���"���
���������,����!�����
��������
�"���
(�������&������
����������,�����
1��"���
,���1��� ,������2���&������
/������
&��������������������� ������/����
���"��������������/��3��
2�����/����
������"������
7345
7348 3482��������4
����������'�

276 Open Medicine Journal, 2016, Volume 3 Arnaiz-Villena et al.
Population DA (%) Population DA (%)Mapuches 39.76 Nivkhs 66.75Zapotecans 40.78 Khoton Mongolian 68.89Eastern Toba 42.27 Koryaks 68.93Mixe 43.55 Eskimos 69.40Jaidukama 43.65 Singapore Chinese 70.26Toba-Pilaga 43.74 Bushmen 71.87Athabascans 47.14 New Caledonia 71.99Tuvinians 48.12 Lebanese NS 72.15Xavantes 50.43 Ainu 72.76Spaniards 52.15 Fidji 74.43Germans 52.77 Buyi 75.47French 53.49 Kets 79.54Koreans 53.62 Evenks 79.87North American Blacks 54.24 Papua New Guinea 81.63Tlinglit 54.27 Guarani 82.21Russians 54.93 Rabaul 83.43Terena 55.87 Madang 83.79Berbers (Souss) 57.03 Cape York 86.55Khalk Mongolian 57.11 Central Desert 89.75Italians 57.52 Yuendumu 94.36Chuvashians 57.75 Kimberley 96.58Danish 57.93
Table 4. The twelve most frequent HLA-A, -B, -C, -DRB1 and -DQB1 extended haplotypes in the Wiwa population.
Haplotype (A-B-C-DRB1-DQB1) HF (%) Possible originA*24:02-B*35:43-C*01:02-DRB1*04:07-DQB1*03:02a 18.2 Amerindian
A*02:01-B*35:43-C*01:02-DRB1*04:07-DQB1*03:02b 5.5 Amerindian
A*24:02-B*15:01-C*01:02-DRB1*04:07-DQB1*03:02c 4.5 Amerindian
A*29:02-B*44:03-C*16:01-DRB1*07:01-DQB1*02:02d 3.6 Western Europe
A*31:01-B*35:43-C*01:02-DRB1*04:07-DQB1*03:02e 3.6 Amerindian
A*68:01-B*15:01-C*03:03-DRB1*14:02-DQB1*03:02f 2.7 New
A*11:01-B*07:02-C*07:02-DRB1*15:03-DQB1*06:02g 1.8 New
A*24:02-B*07:02-C*07:02-DRB1*15:01-DQB1*06:02h 1.8 Eastern Europe
A*24:02-B*35:44-C*01:02-DRB1*04:07-DQB1*03:02i 1.8 Amerindian
A*24:02-B*40:03-C*01:02-DRB1*04:07-DQB1*03:02j 1.8 Amerindian
A*26:01-B*38:01-C*12:03-DRB1*13:01-DQB1*06:03k 1.8 Western Europe
A*68:01-B*15:01-C*03:04-DRB1*14:02-DQB1*03:01l 1.8 NewHF: haplotype frequency.a Found without HLA-C in Mayans (5%), Teeneks (3.7%), Seri (2.3%), Lakota-Sioux (2.2%), Aymaras (2.1%) and Quechuas (1.4%).b Found without HLA-C in Seri (18.2%), Teeneks (15.5%), Mayans (10.6%), Mixtecans (3%), Mazatecans (2.5%), Aymaras (1.7%) and PeruvianIndians (1.7%).c Found without HLA-C in Mayans (2.3%).d Found in Irish (1.3%), Tunisians (4.0%) and without HLA-C in Murcians (5.1%) and in Amerindians immigrants to Madrid (0.8%).e Found without HLA-C in Mayans (2.6%) and Quechuas (1.4%).f, g, l Not found in any other population.h Found without HLA-C in Chuvash (4.3%).i Found without HLA-C in Mayans (5%), Teeneks (3.7%), Seri (2.3%), Lakota-Sioux (2.2%), Aymaras (2.1%) and Quechuas (1.4%).j Found without HLA-C in Mayos (1.7%).k Found without HLA-C in Murcians (1.9%).References: [16, 26 - 28, 31, 52, 53, 75 - 78].
HLA-A, -B, -C, -DRB1 and -DQB1 Extended Haplotype Analysis in Wiwa: Comparison with Other Populations
Associations between different HLA loci were estimated. The most probable two loci haplotype combinations (A-B,B-DRB1 and DRB1-DQB1) were calculated (data not shown). The twelve most frequent five HLA loci haplotypecombinations (A-B-C-DRB1-DQB1) were calculated and these extended haplotypes are depicted in Table 4; they
(Table 3) contd.....

Ancestry of Amerindians and its Impact in Anthopology Open Medicine Journal, 2016, Volume 3 277
represent 48.9% of all haplotypes. Wiwa extended HLA haplotypes have been obtained for the first time, allowing theircomparison with previously reported ones in other populations (Table 4 and its footnote). The partial class II haplotypeDRB1*04:07-DQB1*03:02 is present in association with A*24:02-B*35:43-C*01:02, A*02:01-B*35:43-C*01:02,A*24:02-B*15:01-C*01:02, A*31:01-B*35:43-C*01:02, A*24:02-B*35:44-C*01:02, and A*24:02-B*40:03-C*01:02(35.4% of total haplotypes). The majority of most frequent extended HLA haplotypes have Amerindian characteristicsand they have been found in other Amerindian populations, mainly in Meso-American populations (Mayans,Mazatecans, Mixtecans, Seri, Teeneks) [26, 29, 53] and South-American populations (Aymaras and Quechuas) (Table4) [16, 31]. Haplotypes (or partial haplotypes) with no Amerindian characteristics have been found in this sample: oneof them has been found in Chuvash population in high frequency (4.3%) [52] and two extended haplotypes are presentin Murcian population [75]. The rest of extended HLA haplotypes (6.3%) have not been found in any other World wideethnic group, these haplotypes seem to be specific for this Wiwa-Colombian ethnic group.
In summary, most extended HLA haplotypes in our populations sample are either from Amerindian origin or newlyfound and bearing typical HLA Amerindian alleles.
High Frequency Wiwa HLA alleles: Their Comparison with Pacific and Other World Populations
Due to the high frequency of HLA-A*24:02 and HLA-C*01:02 alleles in our study population, (see Table 2) aWorld distribution map of these alleles was performed (see Fig. 4). That map shows that the highest frequencies ofthese alleles are found in the Pacific area. Significant differences on these two alleles frequency values were foundbetween Pacific populations and Europe Africa, continental and West Asia populations, based on t-student test (data notshown).
Fig. (4). American-Pacific-Asian highest frequency pattern of HLA-A*24:02 and C*01:02 alleles. Populations with less than 20%A*24:02 and C*01:02 frequencies have been disregarded. Alleles frequencies of each population are specified below.1- American Samoa: A*24:02→33.00%; C*01:02→24.00%.2- Australia Cape Cork Peninsula Aborigine: A*24:02→22.30% [79].3- Australia Groote Eylandt Aborigine: A*24:02→29.30%; C*01:02→26.70% [79].4- Australia Yuendumu Aborigine: A*24:02→29.80; C*01:02→24.70% [79].5- Chile Easter Island; A*24:02→35.80%; C*01:02→21.40% [80].6- China Guizhou Province Shui: A*24:02→24.30%; C*01:02→28.40% [81].7- China Tibet Region Tibetan: A*24:02→27.20% [82].8- China Yunnan Bulang: A*24:02→23.70% [83].9- Ecuador Cayapa: A*24:02→61.40% [43].10- Japan Hokkaido Ainu: A*24:02→24.00% [60].11- Japan Central: A*24:02→37.90% [84].12- Japan pop 16: A*24:02→36.48% [85].13- Japan pop 3: A*24:02→36.20% [62].14- Japan pop5: A*24:02→32.70% [86].
56
57
65
55859
4:
64
5;89<
5:
66
<
= ;
54
9>
67
6: 6;
46
4;
4=84<
6= 696>
>
7>
4
6
79
7687<
5 7
6<
94>
7:875
44849

278 Open Medicine Journal, 2016, Volume 3 Arnaiz-Villena et al.
15- Mexico Chihuahua Tarahumara: A*24:02→37.50% [32].16- Mexico Mixtec: A*24:02→25.30% [87].17- Mexico Oaxaca Mixtec: A*24:02→24.50% [88].18- Mexico Oaxaca Zapotec: A*24:02→23.10% [88].19- New Caledonia: A*24:02→60.70%; C*01:02→37.80% [89].20- New Zealand Maori with admixed history: A*24:02→29.10%; C*01:02→31.40% [90].21- New Zealand Maori with full ancestry: A*24:02→38.00%; C*01:02→44.60% [90].22- New Zealand Polynesians with admixed history: A*24:02→33.30%; C*01:02→27.80% [90].23- New Zealand Polynesians with full ancestry: A*24:02→31.00%; C*01:02→21.40% [90].24- Papua New Guinea East New Britain Rabaul: A*24:02→31.60% [89].25- Papua New Guinea Eastern Highlands Goroka Asaro: A*24:02→74.40%; C*01:02→30.20% [89].26- Papua New Guinea Karimui Plateau Pawaia: A*24:02→74.40%; C*01:02→20.00% [89].27- Papua New Guinea Waginela Keapara: A*24:02→62.70% [89].28- Papua New Guinea Wosera Abelam: A*24:02→51.30% [89].29- Peru Titikaka Lake Uro: A*24:02→28.10% [14].30- Philippines Ivatan: A*24:02→32.00%. [91].31- Russia Bering Island Aleut: A*24:02→24.10% [92].32- Russia Tuva pop 2: A*24:02→21.50% [93].33- South Korea pop 10: A*24:02→22.09% [94].34- South Korea pop 3: A*24:02→21.70% [95].35- Sweden Northern Sami: A*24:02→21.20% [96].36- Taiwan Ami: A*24:02→62.80%; C*01:02→21.90% [91].37- Taiwan Atabal: A*24:02→61.80% [91].38- Taiwan Bunun: A*24:02→58.40% [91].39- Taiwan Paiwan: A*24:02→86.30% [91].40- Taiwan Pazeh: A*24:02→33.60% [91].41- Taiwan Puyuma: A*24:02→ 64.00% [91].42- Taiwan Rukai: A*24:02→76.00% [91].43- Taiwan Saisiat: A*24:02→59.90% [91].44- Taiwan Siraya: A*24:02→47.10% [91].45- Taiwan Tao: A*24:02→54.00% [91].46- Taiwan Taroko: A*24:02→44.50% [91].47- Taiwan Thao: A*24:02→60.00% [91].48- Taiwan Tsou: A*24:02→78.40% [91].49- USA Alaska Yupik: A*24:02→58.10% [97].50- USA Arizona Gila River Amerindian: A*24:02→34.10% [98].51- USA Hawai Okinawa: A*24:02→34.30%; C*01:02→20.50%.52- USA South Dakota Lakota Sioux: A*24:02→26.20% [28].53- Mongolia Buryat: A*24:02→20.00%.54- Venezuela Sierra de Perija Yucpa: A*24:02→23.30 [99].55- Singapore Chinese Han: A*24:02→21.50%.56- USA New Mexico Canoncito Navajo: A*24:02→30.50%.57- Venezuela Perja Mountain Bari: A*24:02→60.20%; C*01:02→21.20%.58- Australia Kimberly Aborigine: C*01:02→37.50% [79].59- Wiwa: A*24:02→42.70%; C*01:02→50.00% (present study).
HLA Frequencies Between Wiwa and Other Amerindians
The comparison between Wiwa and Amerindians HLA frequencies were performed in order to determine therelationship grade inside this group of populations. In Fig. (5) can be observed a Neighbour-Joining (NJ) dendrogrambased on HLA-DRB1 allele frequencies that shows this relatedness. The bootstrap values of each of the nodes were100%.
DISCUSSION
Wiwa Amerindian Population and America Peopling According to HLA Genes
It is clear that Wiwa-Colombians HLA analysis supports our previous conclusions about peopling of America andrelationship with other groups:
Amerindians tend to group together and separate from other World populations in our statistical analyses (Table1.3 and Fig. (3), and also in Fig. (2) at a certain extent) [26, 29, 33, 100].Wiwa Chibchan language [1] does not mean that they are genetically closer to other Chibchan language2.speaking groups (Table 3, Figs. 2, 3 and 5). In some analyses they are closer to Mayans (Mayan language, Fig.

Ancestry of Amerindians and its Impact in Anthopology Open Medicine Journal, 2016, Volume 3 279
2) and to Seri Fig. (2). Also, they go close to Wayu (Arawak speaking group) [1] in correspondence analysesFig. (3).Additional HLA frequencies analyses in this paper, which include Wiwa Amerindians, do not support a three3.waves model for America peopling [29, 100]. This also supports analyses done with other genetic markers(mtDNA, YChr, or Alu sequences [3, 4, 9, 10].
Fig. (5). Neighbour-joining (NJ) dendrogram showing relatedness between Wiwa and other Amerindian populations. Geneticdistances between populations (DA) were calculated by using HLA-DRB1 (high resolution). Data from Amerindian populationswere taken from references stated in Table 1. Bootstrap values were 100% in all nodes.
In addition, a multidisciplinary approach is necessary because only genetics is not enough to accurately approach toAmerica peopling [100]. It is evident that an ancient founder effect may have disappeared because of a continuous newpopulation admixture effect. Also, European carried diseases caused that about 85% of America First Inhabitants diedafter 1492 (AD) because of newly introduced microbes [101]. This may have changed HLA profile of Amerindiansafter 1492 (AD). Stress (like epidemics) causes appearance of new HLA alleles in spermatozoa as have beeen shown bysingle spermatozoa PCR [102]. A set of new alleles may have appeared in Amerindians after 1492.
Moreover, our present analyses are useful for implementing programs of HLA pharmacogenomics [12, 87, 103] andpreventive medicine of diseases linked to HLA in Wiwa and other Amerindians. Transplantation programs will alsobenefit when established in Amerindian areas [12, 87, 103].
HLA Extended Haplotypes in Wiwa and Geographical Distribution of High Frequency A*24:02 and C*01:02Alleles
This is the first time that HLA-A, -B, -C, -DRB1 and DQB1 extended haplotypes have been calculated in Wiwa. Aconfirmation that Wiwa group has a low admixture degree is that A*24:02-B*35:43-C*01:02-DRB1*04:07-DQB1*03:02 most frequent extended haplotype has a very high frequency (18.2%, compared to the second mostfrequent haplotype A*02:01-B*35:43-C*01:02-DRB1*04:07-DQB1*03:02). Most haplotypes are of Amerindian origin,since they have already been described in Table 4.
Three new extended haplotypes have been found: A*68:01-B*15:01-C*03:03-DRB1*14:02-DQB1*03:02;A*11:01-B*07:02-C*07:02-DRB1*15:03-DQB1*06:02 and A*68:01-B*15:01-C*03:04-DRB1*14:02-DQB1*03:01,which are characteristic of this particular population.
On the other hand, striking A*24:02 and C*01:02 high frequencies were found and also these alleles are present inthe most frequent Wiwa HLA extended haplotypes.
Mayos
Uros
Tarahuamaras
Quechuas
Aymara
Cayapa
Lamas
Mapuches
Wayu
Mayans
Arhuaco
Wiwa
Seri
Kogi
Eastern Toba
Toba Pilaga
Mataco Wichi
Nahuas
Zapotecans
Mixe
Mixtecans
Mazatecans
Jaidukama
Xavantes
Terena
Guarani

280 Open Medicine Journal, 2016, Volume 3 Arnaiz-Villena et al.
Taken into account our previous detection of HLA alleles and haplotypes shared by Amerindians and PacificIslanders [12, 103], we undertook a frequency comparison of A*24:02 and C*01:02 alleles with Pacific populations,which are also frequent in other Amerindians (Fig. 4) [12, 103, 104].
These alleles were certainly found with a high frequency (compared to European populations) in some PacificOcean populations:
A*24:02: Koreans (22.09%); Taiwanese isolates (86.3%, being the maximum frequency); Papua New Guinea(74.4%), New Caledonia (60.70%, one of the highest A*24:02 frequencies); New Zealand (38%); Japan(37.90%). Amerindians also presented A*24:02 high frequencies (see Fig. 4).C*01:02: New Zealand (44.60%); New Caledonia (37.80%); Australia Kimberley Aborigine (37.50%); PapuaNew Guinea (30.20%); Taiwan (21.90%).
These Pacific populations A*24:02 and C*01:02 frequencies are statistical significantly higher when compared toEuropeans, Africans and continental and West Asia populations (data not shown).
Altogether [12, 103] our findings in this genealogical A*24:02, C*01:02 alleles study show that HLA support thatPacific Islanders and Amerindians have had genetic exchange [12, 103] in ancient times. Cultural and other partialgenetic traits also show that Amerindians have had genetics contacts with Pacific Easter Island [16, 17, 80]. Also, awidespread SNPs analyses cast doubts about Amerindian genes found admixed with Eurasian before 1492 (Columbus)but only three clear Amerindian populations are analysed [105].
Our conclusion on Amerindians and Pacific Islands relatedness is that genetic and cultural common traits [12, 103]may have been shared through a both directions traffic.
Finally, there are cultural [25] and genetic evidences (mtDNA analyses) [106 - 109] that show that SolutreanEuropeans shared them with Ancient American inhabitants [106 - 109]. Therefore, simple models of Americapopulation should be revised.
CONFLICT OF INTEREST
The authors confirm that this article content has no conflict of interest.
ACKNOWLEDGEMENTS
This work was supported in part by Grants from the Spanish Ministry of Health and Economy (PI11/00807 andPI14/01067), European FEDER funds and three different Mutua Madrileña Automovilista grants.
REFERENCES
[1] Ruhlen M. Ruhlen M. A Guide to the World’s Languages Classification. Vol. 1. California: Standford University Press 1987.
[2] Crawford MH. The Origins of Native Americans: evidence from anthropological genetics. Crawford. New York: Cambridge University Press1998.[http://dx.doi.org/10.1017/CBO9780511574658]
[3] Kolman CJ, Sambuughin N, Bermingham E. Mitochondrial DNA analysis of Mongolian populations and implications for the origin of NewWorld founders. Genetics 1996; 142(4): 1321-34.[PMID: 8846908]
[4] Merriwether DA, Hall WW, Vahlne A, Ferrell RE. mtDNA variation indicates Mongolia may have been the source for the foundingpopulation for the New World. Am J Hum Genet 1996; 59(1): 204-12.[PMID: 8659526]
[5] Greenberg JH, Turner CG, Zegura SL. The settlement of the Americas: a comparison of the linguistic, dental and genetic evidence. CurrAnthropol 1986; 27: 477-98.[http://dx.doi.org/10.1086/203472]
[6] Wallace DC, Torroni A. American Indian prehistory as written in the mitochondrial DNA: a review. Hum Biol 1992; 64(3): 403-16.[PMID: 1351474]
[7] Cavalli-Sforza LL, Menozzi P, Piazza A. The history and geography of human genes. Princeton: Princeton University Press 1994.
[8] Parham P, Ohta T. Population biology of antigen presentation by MHC class I molecules. Science 1996; 272(5258): 67-74.[http://dx.doi.org/10.1126/science.272.5258.67] [PMID: 8600539]
[9] Horai S, Kondo R, Nakagawa-Hattori Y, Hayashi S, Sonoda S, Tajima K. Peopling of the Americas, founded by four major lineages of

Ancestry of Amerindians and its Impact in Anthopology Open Medicine Journal, 2016, Volume 3 281
mitochondrial DNA. Mol Biol Evol 1993; 10(1): 23-47.[PMID: 7680748]
[10] Torroni A, Sukernik RI, Schurr TG, et al. mtDNA variation of aboriginal Siberians reveals distinct genetic affinities with Native Americans.Am J Hum Genet 1993; 53(3): 591-608.[PMID: 7688933]
[11] Goebel T, Waters MR, ORourke DH. The late Pleistocene dispersal of modern humans in the Americas. Science 2008; 319(5869): 1497-502.[http://dx.doi.org/10.1126/science.1153569] [PMID: 18339930]
[12] Arnaiz-Villena A, Areces C, Enriquez-de-Salamanca M, et al. Pacific Islanders and Amerindian relatedness according to HLA autosomalgenes. Int J Mod Anthrop 2014; 1(7): 44-67.
[13] Leon-S FE, Ariza-Deleon A, Leon-S ME, Ariza-C A. Peopling the Americas. Science 1996; 273(5276): 723-5.[http://dx.doi.org/10.1126/science.273.5276.723] [PMID: 8701319]
[14] Arnaiz-Villena A, Gonzalez-Alcos V, Serrano-Vela JI, et al. HLA genes in Uros from Titikaka Lake, Peru: origin and relationship with otherAmerindians and worldwide populations. Int J Immunogenet 2009; 36(3): 159-67.[http://dx.doi.org/10.1111/j.1744-313X.2009.00841.x] [PMID: 19490211]
[15] Cerna M, Falco M, Friedman H, et al. Differences in HLA class II alleles of isolated South American Indian populations from Brazil andArgentina. Hum Immunol 1993; 37(4): 213-20.[http://dx.doi.org/10.1016/0198-8859(93)90504-T] [PMID: 8300406]
[16] Arnaiz-Villena A, Siles N, Moscoso J, et al. Origin of Aymaras from Bolivia and their relationship with other Amerindians according to HLAgenes. Tissue Antigens 2005; 65(4): 379-90.[http://dx.doi.org/10.1111/j.1399-0039.2005.00356.x] [PMID: 15787722]
[17] Lie BA, Dupuy BM, Spurkland A, Fernández-Viña MA, Hagelberg E, Thorsby E. Molecular genetic studies of natives on Easter Island:evidence of an early European and Amerindian contribution to the Polynesian gene pool. Tissue Antigens 2007; 69(1): 10-8.[http://dx.doi.org/10.1111/j.1399-0039.2006.00717.x] [PMID: 17212703]
[18] Gonçalves VF, Stenderup J, Rodrigues-Carvalho C, et al. Identification of Polynesian mtDNA haplogroups in remains of BotocudoAmerindians from Brazil. Proc Natl Acad Sci USA 2013; 110(16): 6465-9.[http://dx.doi.org/10.1073/pnas.1217905110] [PMID: 23576724]
[19] Lawler A. Beyond Kon-Tiki: did Polynesians sail to South America? Science 2010; 328(5984): 1344-7.[http://dx.doi.org/10.1126/science.328.5984.1344] [PMID: 20538927]
[20] Storey AA, Ramírez JM, Quiroz D, et al. Radiocarbon and DNA evidence for a pre-Columbian introduction of Polynesian chickens to Chile.Proc Natl Acad Sci USA 2007; 104(25): 10335-9.[http://dx.doi.org/10.1073/pnas.0703993104] [PMID: 17556540]
[21] Storey AA, Quiroz D, Ramírez JM, et al. Pre-Columbian chickens, dates, isotopes, and mtDNA. Proc Natl Acad Sci USA 2008; 105(48): E99.[http://dx.doi.org/10.1073/pnas.0807625105] [PMID: 19033182]
[22] Matisoo-Smith EA, Ramirez JM. Human skeletal evidence of Polynesian presence in South America? Metric analyses of six crania fromMocha Island, Chile. J Pacific Archaeol 2010; 1: 76-88.
[23] Bruges-Armas J, Martinez-Laso J, Martins B, et al. HLA in the Azores Archipelago: possible presence of Mongoloid genes. Tissue Antigens1999; 54(4): 349-59.[http://dx.doi.org/10.1034/j.1399-0039.1999.540404.x] [PMID: 10551418]
[24] Holden C. Were Spaniards among the first Americans? Science 1999; 286(5444): 1467-8.[PMID: 10712138]
[25] Stanford DJ, Bradley BA. Across Atlantic ice: the origins of America's Clovis Culture. University of California Press 2012.
[26] Gómez-Casado E, Martínez-Laso J, Moscoso J, et al. Origin of Mayans according to HLA genes and the uniqueness of Amerindians. TissueAntigens 2003; 61(6): 425-36.[http://dx.doi.org/10.1034/j.1399-0039.2003.00040.x] [PMID: 12823766]
[27] Petzl-Erler ML, Gorodezky C. Anthropology report for the Latin-American Region: Amerindian and admixture populations. Genet Mol Biol1997; 37(1): 337-45.
[28] Leffell MS, Fallin MD, Hildebrand WH, Cavett JW, Iglehart BA, Zachary AA. HLA alleles and haplotypes among the Lakota Sioux: reportof the ASHI minority workshops, part III. Hum Immunol 2004; 65(1): 78-89.[http://dx.doi.org/10.1016/j.humimm.2003.10.001] [PMID: 14700599]
[29] Arnaiz-Villena A, Vargas-Alarcón G, Granados J, et al. HLA genes in Mexican Mazatecans, the peopling of the Americas and the uniquenessof Amerindians. Tissue Antigens 2000; 56(5): 405-16.[http://dx.doi.org/10.1034/j.1399-0039.2000.560503.x] [PMID: 11144288]
[30] Moscoso J, Seclen S, Serrano-Vela JI, et al. HLA genes in Lamas Peruvian-Amazonian Amerindians. Mol Immunol 2006; 43(11): 1881-9.[http://dx.doi.org/10.1016/j.molimm.2005.10.013] [PMID: 16337001]
[31] Martinez-Laso J, Siles N, Moscoso J, et al. Origin of Bolivian Quechua Amerindians: their relationship with other American Indians andAsians according to HLA genes. Eur J Med Genet 2006; 49(2): 169-85.
282 Open Medicine Journal, 2016, Volume 3 Arnaiz-Villena et al.
[http://dx.doi.org/10.1016/j.ejmg.2005.04.005] [PMID: 16530714]
[32] García-Ortiz JE, Sandoval-Ramírez L, Rangel-Villalobos H, et al. High-resolution molecular characterization of the HLA class I and class IIin the Tarahumara Amerindian population. Tissue Antigens 2006; 68(2): 135-46.[http://dx.doi.org/10.1111/j.1399-0039.2006.00636.x] [PMID: 16866883]
[33] Rey D, Parga-Lozano C, Moscoso J, et al. HLA genetic profile of Mapuche (Araucanian) Amerindians from Chile. Mol Biol Rep 2013; 40(7):4257-67.[http://dx.doi.org/10.1007/s11033-013-2509-3] [PMID: 23666052]
[34] Lewis MP, Simons GF, Fenning C. Ethnologue: languages of the world. 17th ed. Dallas: SIL International 2014.
[35] Swadesh M. Indian linguistic groups of Mexico. Escuela Nacional de Antropologia e Historia, Mexico 1959, p. 14.
[36] Grahovac B, Sukernik RI, OhUigin C, et al. Polymorphism of the HLA class II loci in Siberian populations. Hum Genet 1998; 102(1): 27-43.[http://dx.doi.org/10.1007/s004390050650] [PMID: 9490295]
[37] Rey D, Areces C, Parga-Lozano C, Gómez-Prieto P, Crawford MH, Arnaiz-Villena A. HLA genes in populations of the Aleutian islands.Hum Biol 2010; 82(5-6): 737-44.[PMID: 21417892]
[38] Imanishi T, Akaza T, Kimura A, Tokunaga K, Gojobori T. Allele and haplotype frequencies for HLA and complement loci in various ethnicgroups. In: Tsuji K, Aizawa M, Sasazuki T, Eds. HLA. Oxford: Oxford University Press 1991; pp. 1065-220.
[39] Munkhbat B, Sato T, Hagihara M, et al. Molecular analysis of HLA polymorphism in Khoton-Mongolians. Tissue Antigens 1997; 50(2):124-34.[http://dx.doi.org/10.1111/j.1399-0039.1997.tb02851.x] [PMID: 9271822]
[40] Martinez-Laso J, Sartakova M, Allende L, et al. HLA molecular markers in Tuvinians: a population with both Oriental and Caucasoidcharacteristics. Ann Hum Genet 2001; 65(Pt 3): 245-61.[http://dx.doi.org/10.1046/j.1469-1809.2001.6530245.x] [PMID: 11427183]
[41] Silvera C, Vargas-Alarcon G, Areces C, et al. HLA genes in Wayu Amerindians from Colombia. Immunol Invest 2011; 40(1): 92-100.[http://dx.doi.org/10.3109/08820139.2010.517390] [PMID: 20923327]
[42] Yunis JJ, Ossa H, Salazar M, et al. Major histocompatibility complex class II alleles and haplotypes and blood groups of four Amerindiantribes of northern Colombia. Hum Immunol 1994; 41(4): 248-58.[http://dx.doi.org/10.1016/0198-8859(94)90043-4] [PMID: 7883592]
[43] Titus-Trachtenberg EA, Rickards O, De Stefano GF, Erlich HA. Analysis of HLA class II haplotypes in the Cayapa Indians of Ecuador: anovel DRB1 allele reveals evidence for convergent evolution and balancing selection at position 86. Am J Hum Genet 1994; 55(1): 160-7.[PMID: 8023844]
[44] Martinez-Laso J, De Juan D, Martinez-Quiles N, Gomez-Casado E, Cuadrado E, Arnaiz-Villena A. The contribution of the HLA-A, -B, -Cand -DR, -DQ DNA typing to the study of the origins of Spaniards and Basques. Tissue Antigens 1995; 45(4): 237-45.[http://dx.doi.org/10.1111/j.1399-0039.1995.tb02446.x] [PMID: 7638859]
[45] Arnaiz-Villena A, Benmamar D, Alvarez M, et al. HLA allele and haplotype frequencies in Algerians. Relatedness to Spaniards and Basques.Hum Immunol 1995; 43(4): 259-68.[http://dx.doi.org/10.1016/0198-8859(95)00024-X] [PMID: 7499173]
[46] Izaabel H, Garchon HJ, Caillat-Zucman S, et al. HLA class II DNA polymorphism in a Moroccan population from the Souss, Agadir area.Tissue Antigens 1998; 51(1): 106-10.[http://dx.doi.org/10.1111/j.1399-0039.1998.tb02954.x] [PMID: 9459511]
[47] Arnaiz-Villena A, Dimitroski K, Pacho A, et al. HLA genes in Macedonians and the sub-Saharan origin of the Greeks. Tissue Antigens 2001;57(2): 118-27.[http://dx.doi.org/10.1034/j.1399-0039.2001.057002118.x] [PMID: 11260506]
[48] Arnaiz-Villena A, Iliakis P, González-Hevilla M, et al. The origin of Cretan populations as determined by characterization of HLA alleles.Tissue Antigens 1999; 53(3): 213-26.[http://dx.doi.org/10.1034/j.1399-0039.1999.530301.x] [PMID: 10203014]
[49] Martinez-Laso J, Montoya F, Areces C, et al. HLA in Jaidukama: an Amerindian secluded Colombian population with new haplotypes andAsian and Pacific-shared alleles. Mol Biol Rep 2011; 38(6): 3689-701.[http://dx.doi.org/10.1007/s11033-010-0483-6] [PMID: 21110114]
[50] Vargas-Alarcon G, Moscoso J, Martinez-Laso J, et al. Origin of Mexican Nahuas (Aztecs) according to HLA genes and their relationshipswith worldwide populations. Mol Immunol 2007; 44(5): 747-55.[http://dx.doi.org/10.1016/j.molimm.2006.04.014] [PMID: 16765444]
[51] Arnaiz-Villena A, Moscoso J, Granados J, et al. HLA genes in mayos population from Northeast Mexico. Curr Genomics 2007; 8(7): 466-75.[http://dx.doi.org/10.2174/138920207783591735] [PMID: 19412332]
[52] Arnaiz-Villena A, Martinez-Laso J, Moscoso J, et al. HLA genes in the Chuvashian population from European Russia: admixture of CentralEuropean and Mediterranean populations. Hum Biol 2003; 75(3): 375-92.[http://dx.doi.org/10.1353/hub.2003.0040] [PMID: 14527201]

Ancestry of Amerindians and its Impact in Anthopology Open Medicine Journal, 2016, Volume 3 283
[53] Vargas-Alarcón G, Hernández-Pacheco G, Moscoso J, et al. HLA genes in Mexican Teeneks: HLA genetic relationship with other worldwidepopulations. Mol Immunol 2006; 43(7): 790-9.[http://dx.doi.org/10.1016/j.molimm.2005.07.017] [PMID: 16111752]
[54] Kapustin S, Lyshchov A, Alexandrova J, Imyanitov E, Blinov M. HLA class II molecular polymorphisms in healthy Slavic individuals fromNorth-Western Russia. Tissue Antigens 1999; 54(5): 517-20.[http://dx.doi.org/10.1034/j.1399-0039.1999.540509.x] [PMID: 10599891]
[55] Lázaro AM, Moraes ME, Marcos CY, Moraes JR, Fernández-Viña MA, Stastny P. Evolution of HLA-class I compared to HLA-class IIpolymorphism in Terena, a South-American Indian tribe. Hum Immunol 1999; 60(11): 1138-49.[http://dx.doi.org/10.1016/S0198-8859(99)00092-0] [PMID: 10600013]
[56] Gao X, Zimmet P, Serjeantson SW. HLA-DR,DQ sequence polymorphisms in Polynesians, Micronesians, and Javanese. Hum Immunol 1992;34(3): 153-61.[http://dx.doi.org/10.1016/0198-8859(92)90107-X] [PMID: 1429039]
[57] Gao X, Bhatia K, Trent RJ, Serjeantson SW. HLA-DR,DQ nucleotide sequence polymorphisms in five Melanesian populations. TissueAntigens 1992; 40(1): 31-7.[http://dx.doi.org/10.1111/j.1399-0039.1992.tb01954.x] [PMID: 1440559]
[58] Monsalve MV, Edin G, Devine DV. Analysis of HLA class I and class II in Na-Dene and Amerindian populations from British Columbia,Canada. Hum Immunol 1998; 59(1): 48-55.[http://dx.doi.org/10.1016/S0198-8859(97)00251-6] [PMID: 9544239]
[59] Lester S, Cassidy S, Humphreys I, et al. Evolution in HLA-DRB1 and major histocompatibility complex class II haplotypes of Australianaborigines. Definition of a new DRB1 allele and distribution of DRB1 gene frequencies. Hum Immunol 1995; 42(2): 154-60.[http://dx.doi.org/10.1016/0198-8859(94)00087-7] [PMID: 7744619]
[60] Bannai M, Tokunaga K, Imanishi T, et al. HLA class II alleles in Ainu living in Hidaka District, Hokkaido, northern Japan. Am J PhysAnthropol 1996; 101(1): 1-9.[http://dx.doi.org/10.1002/(SICI)1096-8644(199609)101:1<1::AID-AJPA1>3.0.CO;2-Z] [PMID: 8876810]
[61] Gao X, Veale A, Serjeantson SW. HLA class II diversity in Australian aborigines: unusual HLA-DRB1 alleles. Immunogenetics 1992; 36(5):333-7.[http://dx.doi.org/10.1007/BF00215663] [PMID: 1644450]
[62] Itoh Y, Mizuki N, Shimada T, et al. High-throughput DNA typing of HLA-A, -B, -C, and -DRB1 loci by a PCR-SSOP-Luminex method inthe Japanese population. Immunogenetics 2005; 57(10): 717-29.[http://dx.doi.org/10.1007/s00251-005-0048-3] [PMID: 16215732]
[63] Arnaiz-Villena A, Reguera R, Silvera C, et al. HLA Genes in Afro-American Colombians (San Basilio de Palenque): The First Free Africansin America. Open Immunol J 2009; 2: 59-66.
[64] Excoffier L, Laval G, Schneider S. Arlequin (version 3.0): an integrated software package for population genetics data analysis. EvolBioinform Online 2007; 1: 47-50.[PMID: 19325852]
[65] Imanishi T, Akaza T, Kimura A, Tokunaga K, Gojobori T. Estimation of allele and haplotype frequencies for HLA and complement loci. In:Tsuji K, Aizawa M, Sasazuki T, Eds. HLA. Oxford: Oxford University Press 1991; pp. 76-9.
[66] Imanishi T, Akaza T, Kimura A, Tokunaga K, Gojobori T. Genetic relationships among various human populations indicated by MHCpolymorphisms. In: Tsuji K, Aizawa M, Sasazuki T, Eds. HLA. Oxford: Oxford University Press 1991; pp. 627-32.
[67] Clayton J, Lonjou C. Allele and Haplotype frequencies for HLA loci in various ethnic groups. In: Charron D, Ed. Genetic diversity of HLAFunctional and medical implications. Paris: EDK 1991; pp. 665-820.
[68] González-Galarza FF, Takeshita LY, Santos EJ, et al. Allele frequency net 2015 update: new features for HLA epitopes, KIR and disease andHLA adverse drug reaction associations. Nucleic Acids Res 2015; 43(Database issue): D784-8.[http://dx.doi.org/10.1093/nar/gku1166] [PMID: 25414323]
[69] Saitou N, Nei M. The neighbor-joining method: a new method for reconstructing phylogenetic trees. Mol Biol Evol 1987; 4(4): 406-25.[PMID: 3447015]
[70] Nei M. Genetic distance between populations. Am Nat 1972; 106: 283-92.[http://dx.doi.org/10.1086/282771]
[71] Nei M. Analysis of gene diversity in subdivided populations. Proc Natl Acad Sci USA 1973; 70(12): 3321-3.[http://dx.doi.org/10.1073/pnas.70.12.3321] [PMID: 4519626]
[72] Nei M, Tajima F, Tateno Y. Accuracy of estimated phylogenetic trees from molecular data. II. Gene frequency data. J Mol Evol 1983; 19(2):153-70.[http://dx.doi.org/10.1007/BF02300753] [PMID: 6571220]
[73] Young FW, Bann CM. A visual statistics system. In: Stine RA, Fox J, Eds. Statistical Computing Environments for Social Researches.London: Sage Publications 1991; pp. s207-36.
[74] Marlett SA. The Seri and Salinan connection revisited. Int J Am Linguist 2008; 74: 393-9.

284 Open Medicine Journal, 2016, Volume 3 Arnaiz-Villena et al.
[http://dx.doi.org/10.1086/590087]
[75] Muro M, Marín L, Torío A, et al. HLA polymorphism in the Murcia population (Spain): in the cradle of the archaeologic Iberians. HumImmunol 2001; 62(9): 910-21.[http://dx.doi.org/10.1016/S0198-8859(01)00290-7] [PMID: 11543893]
[76] Arnaiz-Villena A, Martínez-Laso J, Gómez-Casado E, et al. Relatedness among Basques, Portuguese, Spaniards, and Algerians studied byHLA allelic frequencies and haplotypes. Immunogenetics 1997; 47(1): 37-43.[http://dx.doi.org/10.1111/j.1399-0039.2005.00477.x] [PMID: 16185322]
[77] de Pablo R, Beraún Y, Nieto A, et al. HLA class I and class II allele distribution in the Peruvian population. Tissue Antigens 2000; 56(6):507-14.[http://dx.doi.org/10.1034/j.1399-0039.2000.560604.x] [PMID: 11169240]
[78] Gonzalez-Galarza FF, Christmas S, Middleton D, Jones AR. Allele frequency net: a database and online repository for immune genefrequencies in worldwide populations. Nucleic Acids Res 2011; 39(Database issue): D913-9.[http://dx.doi.org/10.1093/nar/gkq1128] [PMID: 21062830]
[79] Gao X, Lester S, Veale A, et al. HLA class I alleles in Australian aborigines and their peptide binding profiles. In: Kasahara M, Ed. MajorHistocompatibility Complex. Japan: Springer 2000; pp. 446-62.[http://dx.doi.org/10.1007/978-4-431-65868-9_33]
[80] Thorsby E, Flåm ST, Woldseth B, Dupuy BM, Sanchez-Mazas A, Fernandez-Vina MA. Further evidence of an Amerindian contribution tothe Polynesian gene pool on Easter Island. Tissue Antigens 2009; 73(6): 582-5.[http://dx.doi.org/10.1111/j.1399-0039.2009.01233.x] [PMID: 19493235]
[81] Chen S, Ren X, Liu Y, Hu Q, Hong W, Xu A. Human leukocyte antigen class I polymorphism in Miao, Bouyei, and Shui ethnic minorities ofGuizhou, China. Hum Immunol 2007; 68(11): 928-33.[http://dx.doi.org/10.1016/j.humimm.2007.09.006] [PMID: 18082574]
[82] Chen S, Hong W, Shao H, et al. Allelic distribution of HLA class I genes in the Tibetan ethnic population of China. Int J Immunogenet 2006;33(6): 439-45.[http://dx.doi.org/10.1111/j.1744-313X.2006.00637.x] [PMID: 17117954]
[83] Shi L, Shi L, Yao YF, et al. Genetic link among Hani, Bulang and other Southeast Asian populations: evidence from HLA -A, -B, -C, -DRB1genes and haplotypes distribution. Int J Immunogenet 2010; 37(6): 467-75.[http://dx.doi.org/10.1111/j.1744-313X.2010.00949.x] [PMID: 20637045]
[84] Saito S, Ota S, Yamada E, Inoko H, Ota M. Allele frequencies and haplotypic associations defined by allelic DNA typing at HLA class I andclass II loci in the Japanese population. Tissue Antigens 2000; 56(6): 522-9.[http://dx.doi.org/10.1034/j.1399-0039.2000.560606.x] [PMID: 11169242]
[85] Ikeda N, Kojima H, Nishikawa M, et al. Determination of HLA-A, -C, -B, -DRB1 allele and haplotype frequency in Japanese populationbased on family study. Tissue Antigens 2015; 85(4): 252-9.[http://dx.doi.org/10.1111/tan.12536] [PMID: 25789826]
[86] Tokunaga K, Ishikawa Y, Ogawa A, et al. Sequence-based association analysis of HLA class I and II alleles in Japanese supportsconservation of common haplotypes. Immunogenetics 1997; 46(3): 199-205.[http://dx.doi.org/10.1007/s002510050262] [PMID: 9211745]
[87] Arnaiz-Villena A, Vargas-Alarcón G, Areces C, et al. Mixtec Mexican Amerindians: an HLA alleles study for America peopling,pharmacogenomics and transplantation. Immunol Invest 2014; 43(8): 738-55.[http://dx.doi.org/10.3109/08820139.2014.926369] [PMID: 25254939]
[88] Hollenbach JA, Thomson G, Cao K, et al. HLA diversity, differentiation, and haplotype evolution in Mesoamerican Natives. Hum Immunol2001; 62(4): 378-90.[http://dx.doi.org/10.1016/S0198-8859(01)00212-9] [PMID: 11295471]
[89] Main P, Attenborough R, Chelvanayagam G, Bhatia K, Gao X. The peopling of New Guinea: evidence from class I human leukocyte antigen.Hum Biol 2001; 73(3): 365-83.[http://dx.doi.org/10.1353/hub.2001.0036] [PMID: 11459419]
[90] Edinur HA, Dunn PP, Hammond L, et al. HLA and MICA polymorphism in Polynesians and New Zealand Maori: implications for ancestryand health. Hum Immunol 2013; 74(9): 1119-29.[http://dx.doi.org/10.1016/j.humimm.2013.06.011] [PMID: 23792058]
[91] Middleton D, Menchaca L, Rood H, Komerofsky R. New allele frequency database. Tissue Antigens 2003; 61(5): 403-7.
[92] Moscoso J, Crawford MH, Vicario JL, et al. HLA genes of Aleutian Islanders living between Alaska (USA) and Kamchatka (Russia) suggesta possible southern Siberia origin. Mol Immunol 2008; 45(4): 1018-26.[http://dx.doi.org/10.1016/j.molimm.2007.07.024] [PMID: 17825912]
[93] Begovich AB, Klitz W, Steiner LL, et al. HLA-DQ haplotypes in 15 different populations. Tissue Antigens 2001; 57: 424-39.[http://dx.doi.org/10.1034/j.1399-0039.2001.057005424.x] [PMID: 11556967]
[94] Huh JY, Yi DY, Eo SH, Cho H, Park MH, Kang MS. HLA-A, -B and -DRB1 polymorphism in Koreans defined by sequence-based typing of4128 cord blood units. Int J Immunogenet 2013; 40(6): 515-23.

Ancestry of Amerindians and its Impact in Anthopology Open Medicine Journal, 2016, Volume 3 285
[http://dx.doi.org/10.1111/iji.12067] [PMID: 23724919]
[95] Lee KW, Oh DH, Lee C, Yang SY. Allelic and haplotypic diversity of HLA-A, -B, -C, -DRB1, and -DQB1 genes in the Korean population.Tissue Antigens 2005; 65(5): 437-47.[http://dx.doi.org/10.1111/j.1399-0039.2005.00386.x] [PMID: 15853898]
[96] Johansson A, Ingman M, Mack SJ, Erlich H, Gyllensten U. Genetic origin of the Swedish Sami inferred from HLA class I and class II allelefrequencies. Eur J Hum Genet 2008; 16(11): 1341-9.[http://dx.doi.org/10.1038/ejhg.2008.88] [PMID: 18478041]
[97] Leffell MS, Fallin MD, Erlich HA, et al. HLA antigens, alleles and haplotypes among the Yupik Alaska natives: report of the ASHI MinorityWorkshops, Part II. Hum Immunol 2002; 63(7): 614-25.[http://dx.doi.org/10.1016/S0198-8859(02)00415-9] [PMID: 12072196]
[98] Williams R, Chen YF, Endres R, et al. Molecular variation at the HLA-A, B, C, DRB1, DQA1, and DQB1 loci in full heritage AmericanIndians in Arizona: private haplotypes and their evolution. Tissue Antigens 2009; 74(6): 520-33.[http://dx.doi.org/10.1111/j.1399-0039.2009.01381.x] [PMID: 19845915]
[99] Layrisse Z, Guedez Y, Domínguez E, et al. Extended HLA haplotypes in a Carib Amerindian population: the Yucpa of the Perija Range. HumImmunol 2001; 62(9): 992-1000.[http://dx.doi.org/10.1016/S0198-8859(01)00297-X] [PMID: 11543901]
[100] Arnaiz-Villena A, Parga-Lozano C, Moreno E, Areces C, Rey D, Gomez-Prieto P. The origin of amerindians and the peopling of the americasaccording to HLA genes: admixture with Asian and Pacific people. Curr Genomics 2010; 11(2): 103-14.[http://dx.doi.org/10.2174/138920210790886862] [PMID: 20885818]
[101] Dobbins F. Disease transfer contact. Annu Rev Anthropol 1993; 22: 273-91.[http://dx.doi.org/10.1146/annurev.an.22.100193.001421]
[102] Huang MM, Erlich HA, Goodman MF, Arnheim N. Analysis of mutational changes at the HLA locus in single human sperm. Hum Mutat1995; 6(4): 303-10.[http://dx.doi.org/10.1002/humu.1380060404] [PMID: 8680404]
[103] Arnaiz-Villena A, Areces C, Gomez-Prieto P, et al. The peopling of the Americas: a complex issue for Amerindian, Na-dene, Aleut andEskimo first inhabitants. Int J Mod Anthropol 2010; 1(3): 65-79.
[104] Gonzalez-Galarza FF, Christmas S, Middleton D, Jones AR. Allele frequency net: a database and online repository for immune genefrequencies in worldwide populations. Nucleic Acids Res 2011; 39(Database issue): D913-9.[http://dx.doi.org/10.1093/nar/gkq1128] [PMID: 21062830]
[105] Hellenthal G, Busby GB, Band G, et al. A genetic atlas of human admixture history. Science 2014; 343(6172): 747-51.[http://dx.doi.org/10.1126/science.1243518] [PMID: 24531965]
[106] Stone AC, Stoneking M. mtDNA analysis of a prehistoric Oneota population: implications for the peopling of the New World. Am J HumGenet 1998; 62(5): 1153-70.[http://dx.doi.org/10.1086/301838] [PMID: 9545408]
[107] Brown MD, Hosseini SH, Torroni A, et al. mtDNA haplogroup X: An ancient link between Europe/Western Asia and North America? Am JHum Genet 1998; 63(6): 1852-61.[http://dx.doi.org/10.1086/302155] [PMID: 9837837]
[108] Reidla M, Kivisild T, Metspalu E, et al. Origin and diffusion of mtDNA haplogroup X. Am J Hum Genet 2003; 73(5): 1178-90.[http://dx.doi.org/10.1086/379380] [PMID: 14574647]
[109] Schurr TG. Mitochondrial DNA and the peopling of the New World. Am Sci 2000; 88: 246.[http://dx.doi.org/10.1511/2000.23.772]
© Arnaiz-Villena et al.; Licensee Bentham Open
This is an open access article licensed under the terms of the Creative Commons Attribution-Non-Commercial 4.0 International Public License(CC BY-NC 4.0) (https://creativecommons.org/licenses/by-nc/4.0/legalcode), which permits unrestricted, non-commercial use, distribution andreproduction in any medium, provided the work is properly cited.


![The Open Critical Care Medicine Journal, Open … · 2 The Open Critical Care Medicine Journal, 2014, Volume 7 Ley et al. and to what extent hypoglycemia harmed patients [10, 11].](https://static.fdocuments.net/doc/165x107/5b954b8009d3f2c2678c229e/the-open-critical-care-medicine-journal-open-2-the-open-critical-care-medicine.jpg)


