OPEN ACCESS sensors - prognostics.umd.edu · 3 Road condition sensor 16 Back-up collision, rear...
24
Sensors 2010, 10, 5774-5797; doi:10.3390/s100605774 sensors ISSN 1424-8220 www.mdpi.com/journal/sensors Review Sensor Systems for Prognostics and Health Management Shunfeng Cheng 1 , Michael H. Azarian 1 and Michael G. Pecht 1,2, * 1 Center for Advanced Life Cycle Engineering (CALCE), University of Maryland, College Park, MD 20742, USA; E-Mails: [email protected] (S.F.C.); [email protected] (M.H.A.) 2 Prognostics and Health Management Center, City University of Hong Kong, Hong Kong; E-Mail: [email protected] * Author to whom correspondence should be addressed; E-Mail: [email protected]; Tel.: +1-301-405-5323; Fax: +1-301-314-9269. Received: 20 April 2010; in revised form: 27 May 2010 / Accepted: 28 May 2010 / Published: 8 June 2010 Abstract: Prognostics and health management (PHM) is an enabling discipline consisting of technologies and methods to assess the reliability of a product in its actual life cycle conditions to determine the advent of failure and mitigate system risk. Sensor systems are needed for PHM to monitor environmental, operational, and performance-related characteristics. The gathered data can be analyzed to assess product health and predict remaining life. In this paper, the considerations for sensor system selection for PHM applications, including the parameters to be measured, the performance needs, the electrical and physical attributes, reliability, and cost of the sensor system, are discussed. The state- of-the-art sensor systems for PHM and the emerging trends in technologies of sensor systems for PHM are presented. Keywords: sensor system; failure modes; mechanisms and effects analysis (FMMEA); Prognostics and health management (PHM) 1. Introduction Prognostics and health management (PHM) generally combines sensing and interpretation of environmental, operational, and performance-related parameters to assess the health of a product and predict remaining useful life. Assessing the health of a product provides information that can be used OPEN ACCESS
Transcript of OPEN ACCESS sensors - prognostics.umd.edu · 3 Road condition sensor 16 Back-up collision, rear...
Sensors 2010, 10, 5774-5797; doi:10.3390/s100605774
sensors ISSN 1424-8220
www.mdpi.com/journal/sensors
Review
Sensor Systems for Prognostics and Health Management
Shunfeng Cheng 1
, Michael H. Azarian 1 and Michael G. Pecht
1,2,*
1 Center for Advanced Life Cycle Engineering (CALCE), University of Maryland, College Park,
MD 20742, USA; E-Mails: [email protected] (S.F.C.); [email protected] (M.H.A.) 2 Prognostics and Health Management Center, City University of Hong Kong, Hong Kong;
E-Mail: [email protected]
* Author to whom correspondence should be addressed; E-Mail: [email protected];
Tel.: +1-301-405-5323; Fax: +1-301-314-9269.
Received: 20 April 2010; in revised form: 27 May 2010 / Accepted: 28 May 2010 /
Published: 8 June 2010
Abstract: Prognostics and health management (PHM) is an enabling discipline consisting
of technologies and methods to assess the reliability of a product in its actual life cycle
conditions to determine the advent of failure and mitigate system risk. Sensor systems are
needed for PHM to monitor environmental, operational, and performance-related
characteristics. The gathered data can be analyzed to assess product health and predict
remaining life. In this paper, the considerations for sensor system selection for PHM
applications, including the parameters to be measured, the performance needs, the electrical
and physical attributes, reliability, and cost of the sensor system, are discussed. The state-
of-the-art sensor systems for PHM and the emerging trends in technologies of sensor
systems for PHM are presented.
Keywords: sensor system; failure modes; mechanisms and effects analysis (FMMEA);
Prognostics and health management (PHM)
1. Introduction
Prognostics and health management (PHM) generally combines sensing and interpretation of
environmental, operational, and performance-related parameters to assess the health of a product and
predict remaining useful life. Assessing the health of a product provides information that can be used
OPEN ACCESS
Sensors 2010, 10
5775
to meet several critical goals: (1) providing advance warning of failures; (2) minimizing unscheduled
maintenance, extending maintenance cycles, and maintaining effectiveness through timely repair
actions; (3) reducing the life-cycle cost of equipment by decreasing inspection costs, downtime, and
inventory; and (4) improving qualification and assisting in the design and logistical support of fielded
and future systems [1].
The importance of PHM has been explicitly stated in the U.S. Department of Defense 5000.2 policy
document on defense acquisition, which states that ―program managers shall optimize operational
readiness through affordable, integrated, embedded diagnostics and prognostics, embedded training
and testing, serialized item management, automatic identification technology, and iterative technology
refreshment‖ [2]. Thus, a prognostics capability has become a requirement for any system sold to the
Department of Defense.
Traditionally, prognostics have been implemented using either a data-driven approach or a
model-based approach [1]. The data-driven approach uses statistical pattern recognition and machine
learning to detect changes in parameter data, isolate faults, and estimate the remaining useful life
(RUL) of a product [1-4]. Data-driven methods do not require product-specific knowledge of such
things as material properties, constructions, and failure mechanisms. In data-driven approaches, in-situ
monitoring of environmental and operational parameters of the product is carried out, and the complex
relationships and trends available in the data can be captured by data-driven methods without the need
for specific failure models. There are many data-driven approaches, such as neural networks (NNs),
support vector machines (SVMs), decision tree classifiers, principle component analysis (PCA),
particle filtering (PF), and fuzzy logic [1].
Model-based approaches are based on an understanding of the physical processes and
interrelationships among the different components or subsystems of a product [5], including system
modeling and physics-of-failure (PoF) modeling approaches. In system modeling approaches,
mathematical functions or mappings, such as differential equations, are used to represent the product.
Statistical estimation techniques based on residuals and parity relations are then used to detect, isolate,
and predict degradation [5,6]. Model-based prognostic methods are being developed for digital
electronics components and systems such as lithium ion batteries [7], microprocessors in avionics [8],
global positioning systems [9], and switched mode power supplies [10].
PoF-based prognostic methods utilize knowledge of a product’s life cycle loading conditions,
geometry, material properties, and failure mechanisms to estimate its RUL [11-14]. PoF methodology
is based on the identification of potential failure mechanisms and failure sites of a product. A failure
mechanism is described by the relationship between the in situ monitored stresses and variability at
potential failure sites. PoF-based prognostics permit the assessment and prediction of a product’s
reliability under its actual application conditions. It integrates in situ monitored data from sensor
systems with models that enable identification of the deviation or degradation of a product from an
expected normal condition and the prediction of the future state of reliability.
Parameter monitoring and the analysis of acquired data using prognostic models are fundamental
steps for these PHM methods, while sensor systems are the essential devices used to monitor
parameters for PHM. PHM relies highly on the sensor systems to obtain long-term accurate in situ
information to provide anomaly detection, fault isolation, and rapid failure prediction.
Sensors 2010, 10
5776
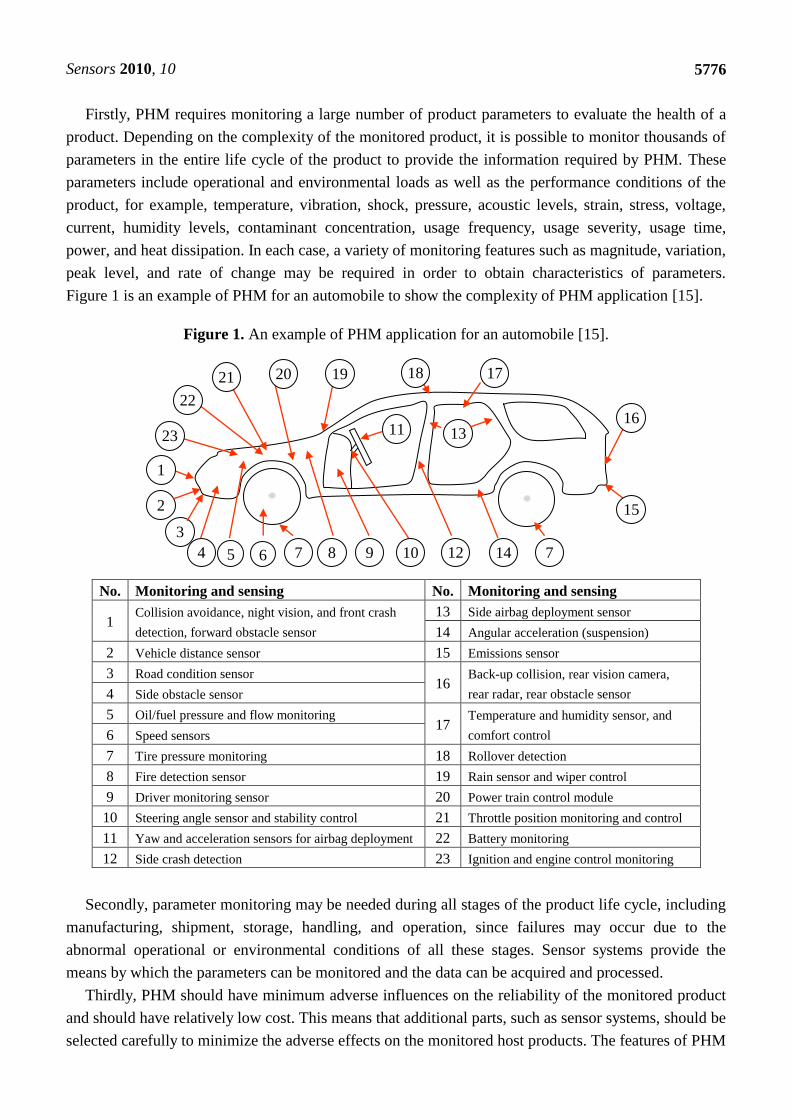
Firstly, PHM requires monitoring a large number of product parameters to evaluate the health of a
product. Depending on the complexity of the monitored product, it is possible to monitor thousands of
parameters in the entire life cycle of the product to provide the information required by PHM. These
parameters include operational and environmental loads as well as the performance conditions of the
product, for example, temperature, vibration, shock, pressure, acoustic levels, strain, stress, voltage,
current, humidity levels, contaminant concentration, usage frequency, usage severity, usage time,
power, and heat dissipation. In each case, a variety of monitoring features such as magnitude, variation,
peak level, and rate of change may be required in order to obtain characteristics of parameters.
Figure 1 is an example of PHM for an automobile to show the complexity of PHM application [15].
Figure 1. An example of PHM application for an automobile [15].
No. Monitoring and sensing No. Monitoring and sensing
1 Collision avoidance, night vision, and front crash
detection, forward obstacle sensor
13 Side airbag deployment sensor
14 Angular acceleration (suspension)
2 Vehicle distance sensor 15 Emissions sensor
3 Road condition sensor 16
Back-up collision, rear vision camera,
rear radar, rear obstacle sensor 4 Side obstacle sensor
5 Oil/fuel pressure and flow monitoring 17
Temperature and humidity sensor, and
comfort control 6 Speed sensors
7 Tire pressure monitoring 18 Rollover detection
8 Fire detection sensor 19 Rain sensor and wiper control
9 Driver monitoring sensor 20 Power train control module
10 Steering angle sensor and stability control 21 Throttle position monitoring and control
11 Yaw and acceleration sensors for airbag deployment 22 Battery monitoring
12 Side crash detection 23 Ignition and engine control monitoring
Secondly, parameter monitoring may be needed during all stages of the product life cycle, including
manufacturing, shipment, storage, handling, and operation, since failures may occur due to the
abnormal operational or environmental conditions of all these stages. Sensor systems provide the
means by which the parameters can be monitored and the data can be acquired and processed.
Thirdly, PHM should have minimum adverse influences on the reliability of the monitored product
and should have relatively low cost. This means that additional parts, such as sensor systems, should be
selected carefully to minimize the adverse effects on the monitored host products. The features of PHM
1
23
2
3
4 5 6 7
13 11
10 8 9 12 7 14
15
16
19 20 21
22
17 18
Sensors 2010, 10
5777
require many high performance sensor systems to continuously monitor record, analyze, and transfer a
large amount of parameter data in the product’s life cycle.
In this paper, the considerations of a sensor system for PHM applications are discussed. Even
though general considerations for sensor system selection can be applied to all branches of science and
engineering, the features discussed above concerning PHM applications provide unique perspectives
on these considerations and associated issues. The state-of-the-art of current commercially available
sensor systems for PHM is presented by a survey. The emerging trends of the sensor systems for PHM
are also predicted.
2. Considerations of Sensor System Selection for PHM
Considerations of sensor system selection for PHM may include the parameters to be measured, the
performance needs of the sensor system, the electrical and physical attributes of the sensor system,
reliability, and cost [16]. Sensor systems with multiple sensing abilities, miniature size and light
weight, low power consumption, long range and high rate data transmission, large onboard memory,
fast onboard data processing, low cost, and high reliability are specifically advantageous to
PHM applications.
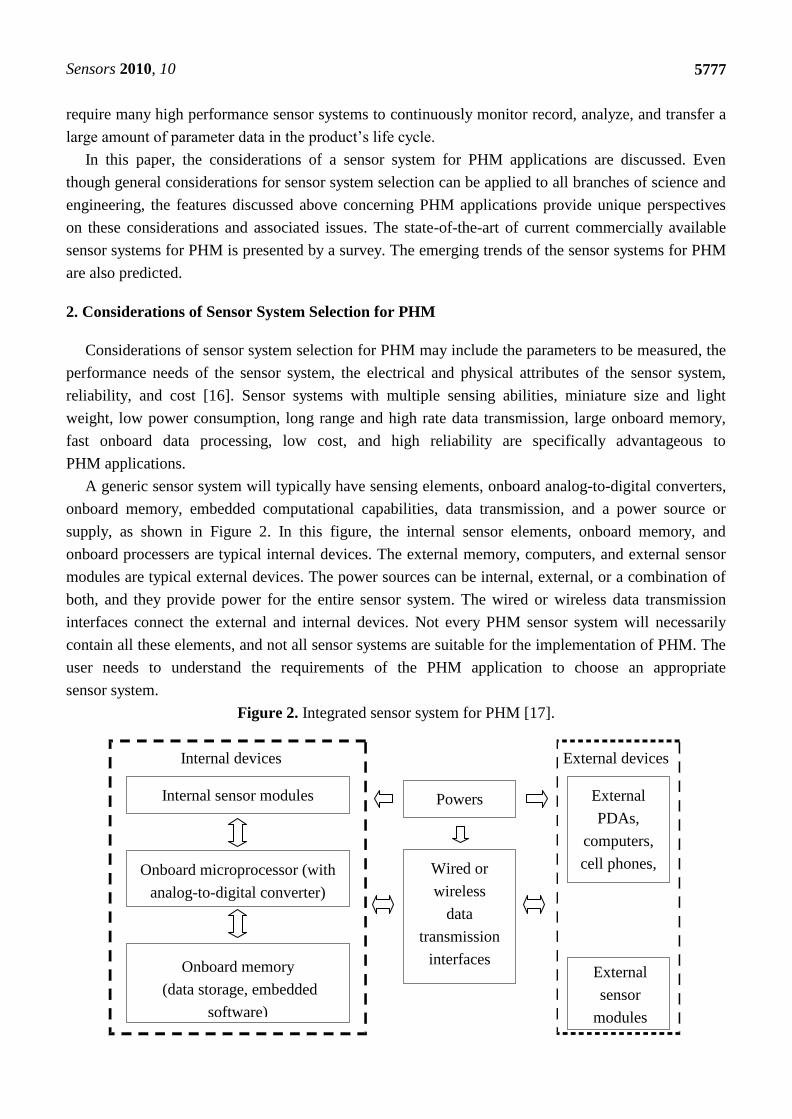
A generic sensor system will typically have sensing elements, onboard analog-to-digital converters,
onboard memory, embedded computational capabilities, data transmission, and a power source or
supply, as shown in Figure 2. In this figure, the internal sensor elements, onboard memory, and
onboard processers are typical internal devices. The external memory, computers, and external sensor
modules are typical external devices. The power sources can be internal, external, or a combination of
both, and they provide power for the entire sensor system. The wired or wireless data transmission
interfaces connect the external and internal devices. Not every PHM sensor system will necessarily
contain all these elements, and not all sensor systems are suitable for the implementation of PHM. The
user needs to understand the requirements of the PHM application to choose an appropriate
sensor system.
Figure 2. Integrated sensor system for PHM [17].
External
PDAs,
computers,
cell phones,
etc.
External
sensor
modules
Internal sensor modules
Onboard memory
(data storage, embedded
software)
Onboard microprocessor (with
analog-to-digital converter)
Wired or
wireless
data
transmission
interfaces
Internal devices External devices
Powers
Sensors 2010, 10
5778
2.1. Parameters to Be Monitored
In general, in order to assess the health of a product, the parameters to monitor for PHM include
performance parameters (e.g., the speed of the fan in a laptop); physical characteristics (e.g., the
pressure change in an oil pipeline or the strain of a printed circuit board when it is bended); electrical
characteristics (e.g., the resistance of a resistor or the current through and voltage over a resistor);
environmental conditions (e.g., temperature, vibration, pressure, acoustic levels, and humidity level);
and operational conditions (e.g., usage frequency, usage severity, usage time, power, and heat
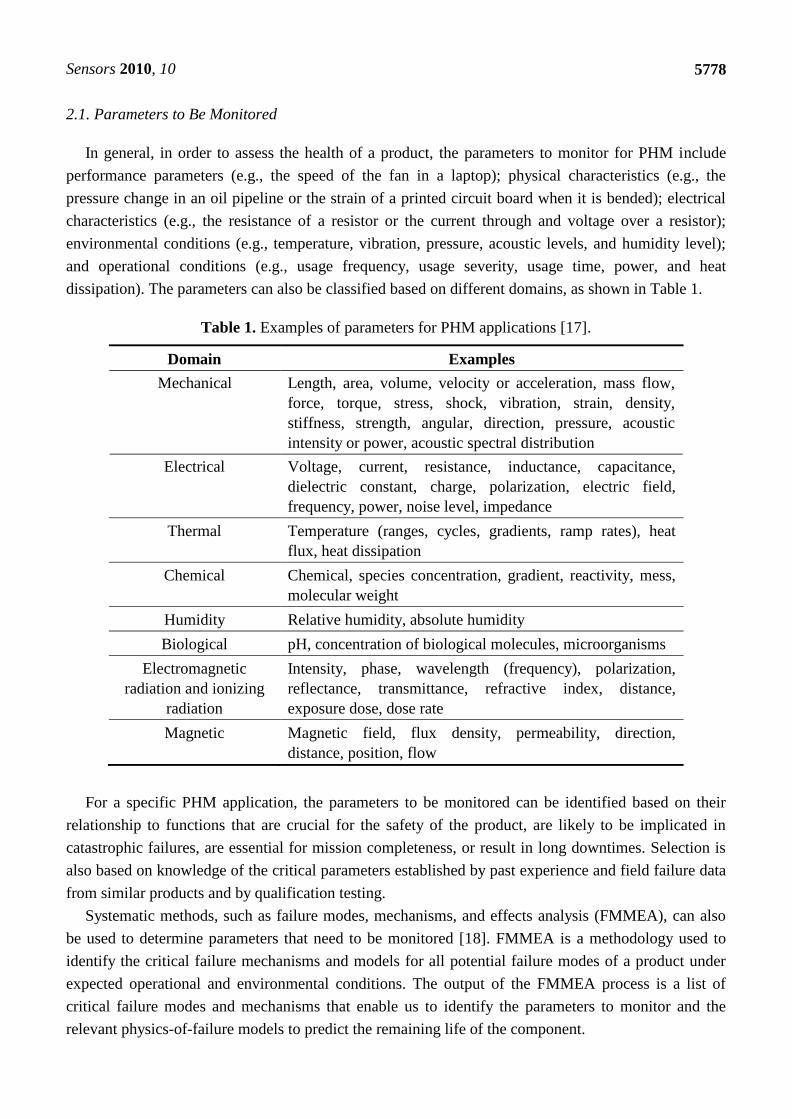
dissipation). The parameters can also be classified based on different domains, as shown in Table 1.
Table 1. Examples of parameters for PHM applications [17].
Domain Examples
Mechanical Length, area, volume, velocity or acceleration, mass flow,
force, torque, stress, shock, vibration, strain, density,
stiffness, strength, angular, direction, pressure, acoustic
intensity or power, acoustic spectral distribution
Electrical Voltage, current, resistance, inductance, capacitance,
dielectric constant, charge, polarization, electric field,
frequency, power, noise level, impedance
Thermal Temperature (ranges, cycles, gradients, ramp rates), heat
flux, heat dissipation
Chemical Chemical, species concentration, gradient, reactivity, mess,
molecular weight
Humidity Relative humidity, absolute humidity
Biological pH, concentration of biological molecules, microorganisms
Electromagnetic
radiation and ionizing
radiation
Intensity, phase, wavelength (frequency), polarization,
reflectance, transmittance, refractive index, distance,
exposure dose, dose rate
Magnetic Magnetic field, flux density, permeability, direction,
distance, position, flow
For a specific PHM application, the parameters to be monitored can be identified based on their
relationship to functions that are crucial for the safety of the product, are likely to be implicated in
catastrophic failures, are essential for mission completeness, or result in long downtimes. Selection is
also based on knowledge of the critical parameters established by past experience and field failure data
from similar products and by qualification testing.
Systematic methods, such as failure modes, mechanisms, and effects analysis (FMMEA), can also
be used to determine parameters that need to be monitored [18]. FMMEA is a methodology used to
identify the critical failure mechanisms and models for all potential failure modes of a product under
expected operational and environmental conditions. The output of the FMMEA process is a list of
critical failure modes and mechanisms that enable us to identify the parameters to monitor and the
relevant physics-of-failure models to predict the remaining life of the component.
Sensors 2010, 10
5779
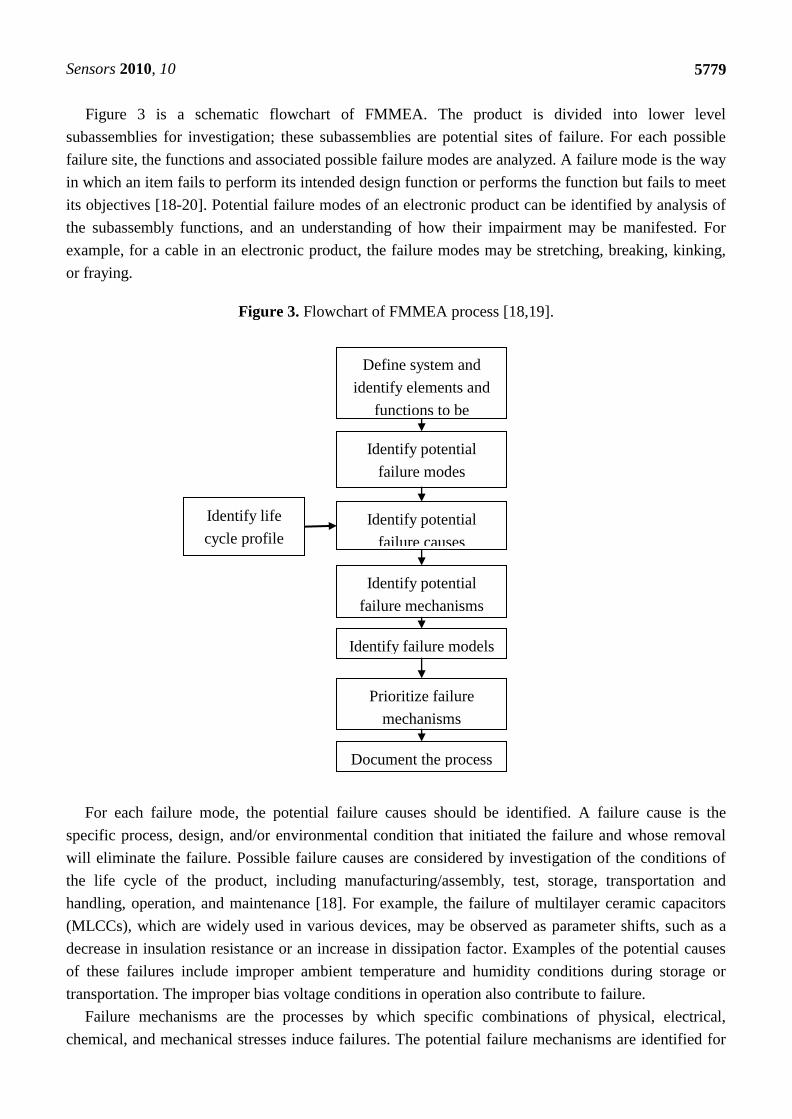
Figure 3 is a schematic flowchart of FMMEA. The product is divided into lower level
subassemblies for investigation; these subassemblies are potential sites of failure. For each possible
failure site, the functions and associated possible failure modes are analyzed. A failure mode is the way
in which an item fails to perform its intended design function or performs the function but fails to meet
its objectives [18-20]. Potential failure modes of an electronic product can be identified by analysis of
the subassembly functions, and an understanding of how their impairment may be manifested. For
example, for a cable in an electronic product, the failure modes may be stretching, breaking, kinking,
or fraying.
Figure 3. Flowchart of FMMEA process [18,19].
For each failure mode, the potential failure causes should be identified. A failure cause is the
specific process, design, and/or environmental condition that initiated the failure and whose removal
will eliminate the failure. Possible failure causes are considered by investigation of the conditions of
the life cycle of the product, including manufacturing/assembly, test, storage, transportation and
handling, operation, and maintenance [18]. For example, the failure of multilayer ceramic capacitors
(MLCCs), which are widely used in various devices, may be observed as parameter shifts, such as a
decrease in insulation resistance or an increase in dissipation factor. Examples of the potential causes
of these failures include improper ambient temperature and humidity conditions during storage or
transportation. The improper bias voltage conditions in operation also contribute to failure.
Failure mechanisms are the processes by which specific combinations of physical, electrical,
chemical, and mechanical stresses induce failures. The potential failure mechanisms are identified for
Identify life
cycle profile
Identify potential
failure modes
Identify potential
failure mechanisms
Identify failure models
Define system and
identify elements and
functions to be
analyzed
Identify potential
failure causes
Prioritize failure
mechanisms
Document the process
Sensors 2010, 10
5780
each failure mode and site based on causes, loads, and design (geometry and material) [12]. Failure
models are used as tools to assess failure propensity. In failure models, the stresses and the various
stress parameters and their relationships to materials, geometry, and product life are considered. Each
potential failure mechanism can be represented by one or more of failure models. FMMEA prioritizes
the failure mechanisms based on their occurrence and severity in order to provide guidelines for
determining the major operational stresses and environmental and operational parameters.
The following is an example demonstrating the application of FMMEA to parameter identification
for PHM. In this case, the parameters that can be used to monitor the health state of
flexible-termination MLCCs under temperature-humidity-bias (THB) conditions are identified by
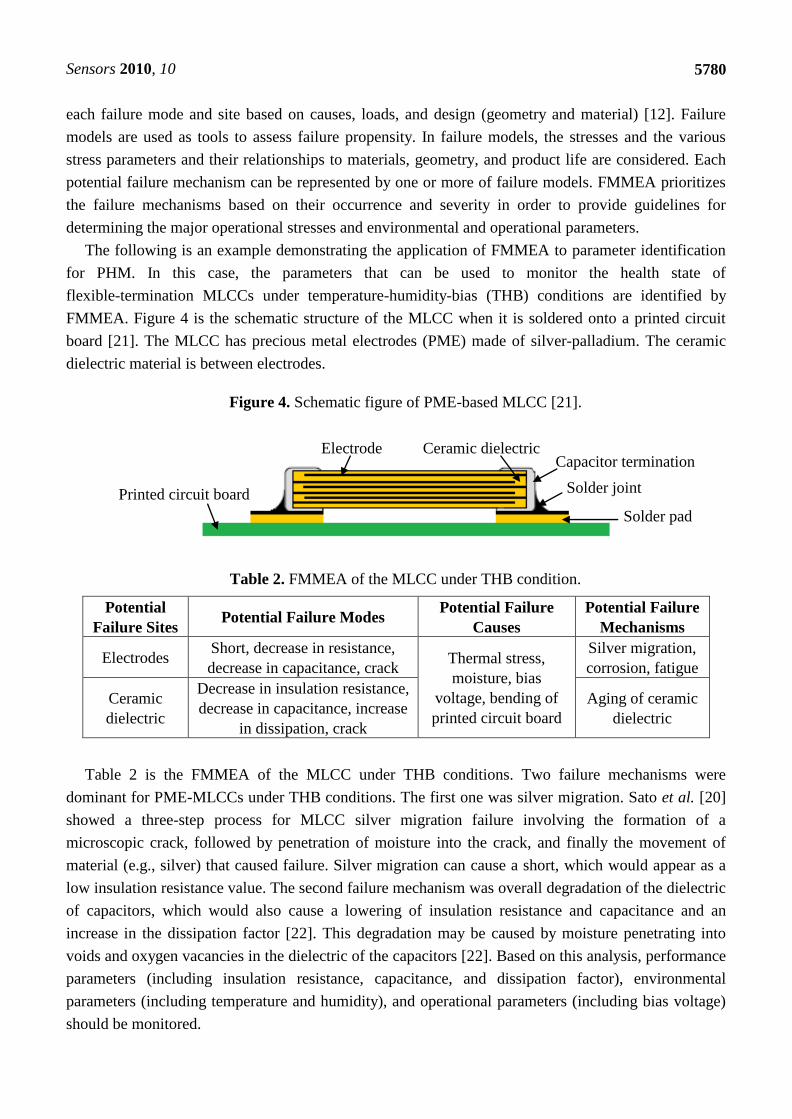
FMMEA. Figure 4 is the schematic structure of the MLCC when it is soldered onto a printed circuit
board [21]. The MLCC has precious metal electrodes (PME) made of silver-palladium. The ceramic
dielectric material is between electrodes.
Figure 4. Schematic figure of PME-based MLCC [21].
Table 2. FMMEA of the MLCC under THB condition.
Potential
Failure Sites Potential Failure Modes
Potential Failure
Causes
Potential Failure
Mechanisms
Electrodes Short, decrease in resistance,
decrease in capacitance, crack Thermal stress,
moisture, bias
voltage, bending of
printed circuit board
Silver migration,
corrosion, fatigue
Ceramic
dielectric
Decrease in insulation resistance,
decrease in capacitance, increase
in dissipation, crack
Aging of ceramic
dielectric
Table 2 is the FMMEA of the MLCC under THB conditions. Two failure mechanisms were
dominant for PME-MLCCs under THB conditions. The first one was silver migration. Sato et al. [20]
showed a three-step process for MLCC silver migration failure involving the formation of a
microscopic crack, followed by penetration of moisture into the crack, and finally the movement of
material (e.g., silver) that caused failure. Silver migration can cause a short, which would appear as a
low insulation resistance value. The second failure mechanism was overall degradation of the dielectric
of capacitors, which would also cause a lowering of insulation resistance and capacitance and an
increase in the dissipation factor [22]. This degradation may be caused by moisture penetrating into
voids and oxygen vacancies in the dielectric of the capacitors [22]. Based on this analysis, performance
parameters (including insulation resistance, capacitance, and dissipation factor), environmental
parameters (including temperature and humidity), and operational parameters (including bias voltage)
should be monitored.
Capacitor termination Electrode
Solder joint Printed circuit board
Ceramic dielectric
Solder pad
Sensors 2010, 10
5781
PHM requires integration of many different parameters to assess the health state, detect and isolate
faults, and predict the remaining life of a product. If an individual sensor system can monitor multiple
parameters, this would simplify PHM and reduce the cost of PHM. The sensing of multiple parameters
refers to one sensor system that can measure multiple types of parameters such as temperature,
humidity, vibration, and pressure. Structures that can conduct multiple sensing include the following: a
sensor system that contains several different sensing elements internally; a sensor system with flexible,
add-on external ports that support various sensor plug-in nodes; and combinations of these structures.
For these structures, some common components can be shared such as the power supply, A/D
converter, memory, and data transmission.
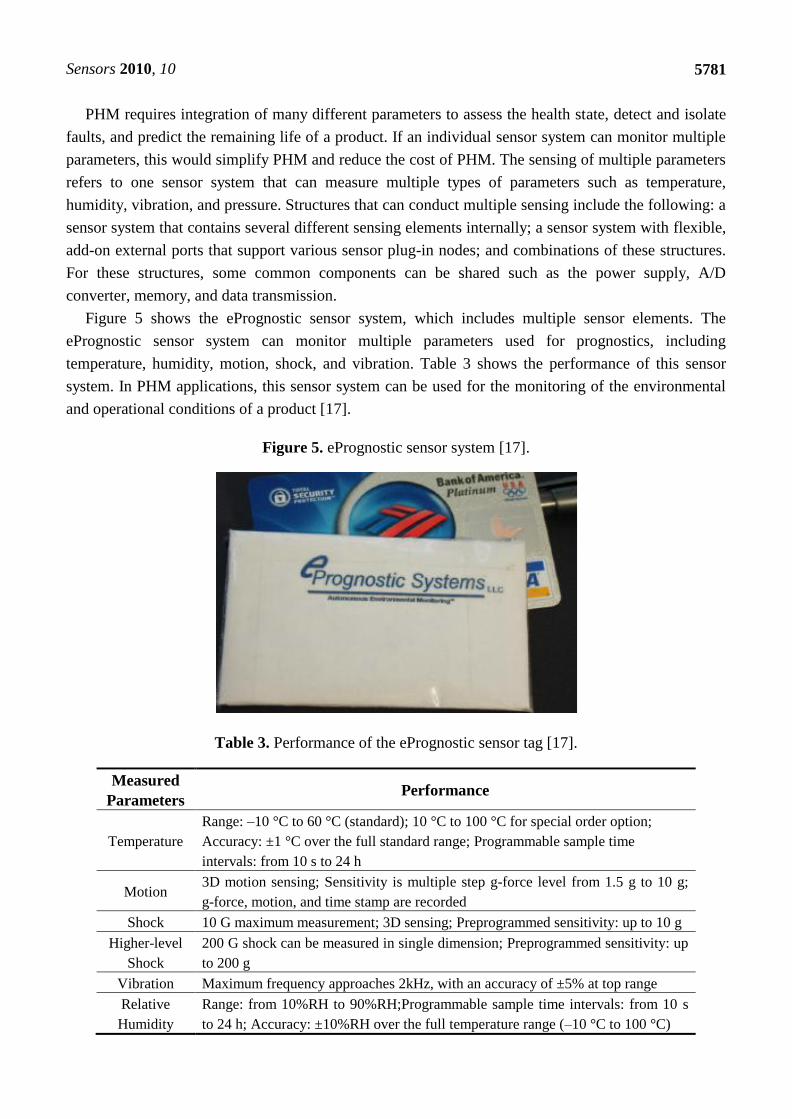
Figure 5 shows the ePrognostic sensor system, which includes multiple sensor elements. The
ePrognostic sensor system can monitor multiple parameters used for prognostics, including
temperature, humidity, motion, shock, and vibration. Table 3 shows the performance of this sensor
system. In PHM applications, this sensor system can be used for the monitoring of the environmental
and operational conditions of a product [17].
Figure 5. ePrognostic sensor system [17].
Table 3. Performance of the ePrognostic sensor tag [17].
Measured
Parameters Performance
Temperature
Range: –10 °C to 60 °C (standard); 10 °C to 100 °C for special order option;
Accuracy: ±1 °C over the full standard range; Programmable sample time
intervals: from 10 s to 24 h
Motion 3D motion sensing; Sensitivity is multiple step g-force level from 1.5 g to 10 g;
g-force, motion, and time stamp are recorded
Shock 10 G maximum measurement; 3D sensing; Preprogrammed sensitivity: up to 10 g
Higher-level
Shock
200 G shock can be measured in single dimension; Preprogrammed sensitivity: up
to 200 g
Vibration Maximum frequency approaches 2kHz, with an accuracy of ±5% at top range
Relative
Humidity
Range: from 10%RH to 90%RH;Programmable sample time intervals: from 10 s
to 24 h; Accuracy: ±10%RH over the full temperature range (–10 °C to 100 °C)
Sensors 2010, 10
5782
Fault detection and isolation is a necessary process in PHM to detect the occurrences of the faults
and then identify the types, sites, and causes of the fault. Some faults and failure mechanisms can be
identified by some sensor systems directly. For example, the resistance measurement can be used to
isolate the open or short locations in a simple circuit, and corrosion sensors can use electrochemical
impedance spectroscopy (EIS) to monitor the corrosion of structures directly [23]. For complex
electrical packages, some techniques or sensor systems can be used to isolate the failure sites. For
example, the Scanning Superconductive Quantum Interference Device (SQUID microscopy) can be
used to detect shorts in the microprocessors; 3D x-ray radiography/tomography can image various
levels of interconnections; and scanning acoustic microscopy can detect the interfacial delaminations
and defects in the packages [24]. Other sensor systems using electromagnetic nondestructive testing
technologies [25], ultrasonic guided wave technologies [26], or optical technologies [27] can detect
cracks inside a product.
Fault isolation can also be done by using mathematical models, such as principle component
analysis (PCA) [1,28] and residuals estimation [29], to analyze the data from ―general‖ sensor systems.
However, if the considered sensor system has the ability to detect and isolate the faults or failure
mechanisms, it will improve the efficiency of PHM and provide more direct information. This type of
sensor system may have a complete structure, including sensing elements, memory, processors, and
display parts. They can monitor the corresponding parameters of the product, process the data using
computers included in the system, display plots, and provide alarms. The selection considerations
presented in this paper can also be used for the selection of this type of sensor systems.
2.2. Sensor System Performance
When the parameters to monitor are identified, the characteristics of these parameters, such as the
possible range and frequency, should be understood. These characteristics can be obtained based on the
historic records of the data or the specifications of the products. These features of the parameters
should then be translated into the requirements for the performance attributes of sensor systems.
Several relevant common performance attributes of sensor systems include the following:
Measurement Range: the lowest and highest values of the measurands that the sensor can sense.
The measurement range of the sensor systems should be wider than the actual range of
the measurand.
Dynamic Range: the ratio of the largest measurable output variation to the smallest
distinguishable output variation, usually expressed in dB [30]; this is an important aspect of a
sensor’s ability to respond to signals having both large and small amplitude variation.
Accuracy: the closeness of agreement between the measurement and the true value of the
measured quantity [31]. It can be presented as the error that is the difference between the
measurement and the true value.
Sensitivity: generally, the ratio between a small change in output to a small change in input,
usually a unit change in input. Sensitivity represents the slope of the calibration curve [32]. In
general, it can be described by the derivation of the output to the input. It may be a constant for
all the inputs, but also may be different for different parts of the input.
Sensors 2010, 10
5783
Repeatability: closeness of the agreement between the results of successive measurements of the
same measurand carried out under the same conditions of measurement [31].
Resolution: the minimal change of the input necessary to produce a detectable change in the
output [32]. The resolution of the sensor is specified by the unit of the measured parameter or the
percentage of the range of the measured parameter.
Frequency Response: output-to-input ratio (the output power divided by the input power) of a
sensor as a function of frequency and often given by dB [32]. It can be represented by
gain-frequency response or phase-frequency response. The frequency response indicates the
range of frequencies of the input for which the output is adequate (i.e., does not decrease or
increase the error due to the inability of the device to operate at a frequency or range of
frequencies). The frequency range is between the lower and upper points where the amplitude of
the signal has fallen off –3 dB, or 0.707 times of the input. The frequencies at these two points
are cutoff frequencies. The frequency response range of sensor systems should be wider than the
measured parameters.
Hysteresis: the deviation of the sensor’s output at any given input point when the input is
approached from two different directions [34].
Linearity: the maximum deviation of the output functions from an ideal straight line [33].
Response time: the time a sensor takes to react to a given input. This attribute represents how fast
the sensor system can respond to the change of the measured parameter.
Stabilization time: the time a sensor takes to reach a steady output upon exposure to a
stable input.
Sampling rate: the number of samples per second (or other unit) taken from a continuous signal
to make a discrete signal.
PHM needs a high performance sensor system to identify the health of the monitored system and
keep the uncertainty at a certain level. Gu et al. [35] studied the different sources of prognostic
uncertainty and found that measurement inaccuracy by the sensor system was one of the main sources
leading to uncertainty in PHM applications. Understanding the performance attributes of sensor
systems mentioned above can help to determine the level of uncertainty caused by sensor systems and
assist in controlling the overall uncertainty of the entire PHM application.
2.3. Physical Characteristics of Sensor Systems
The physical characteristics of a sensor system include its size, weight, shape, packaging, and
mounting of sensors into the host. In some PHM applications, the size of the sensor may become one
of the most significant selection criteria due to limitations of available space for attaching the sensor or
due to the inaccessibility of locations to be sensed. In electronic products, due to the high-density
components on the circuit board, it is difficult to mount large sensor systems to measure certain local
parameters. In the motherboards of current computers, some sensors are embedded in the chips to save
space and improve performance. For instance, the temperature of the CPUs and graphic processors are
measured by thermal sensors built into the processor chips.
The weight of the sensor should also be considered in certain PHM applications, such as for
vibration and shock measurements using accelerometers, since the added mass can change the system
Sensors 2010, 10
5784
response. If a fixture is required to mount a sensor on a piece of equipment, the added mass of the
sensor and fixture itself may change the system characteristics. When selecting a sensor system, users
should determine the available size and weight capacity that can be handled by the host environment
and then consider the size and weight of the entire sensor system, which includes the battery and other
accessories such as antennas and cables.
Users should also consider the shape (round, rectangular, or flat) of the sensor system; the packaging
materials, such as metal or plastic; and the method for attaching or mounting the sensor, for example,
glue, adhesive tape, magnets, fixtures, or screws (bolts) to affix the sensor system to the host. The
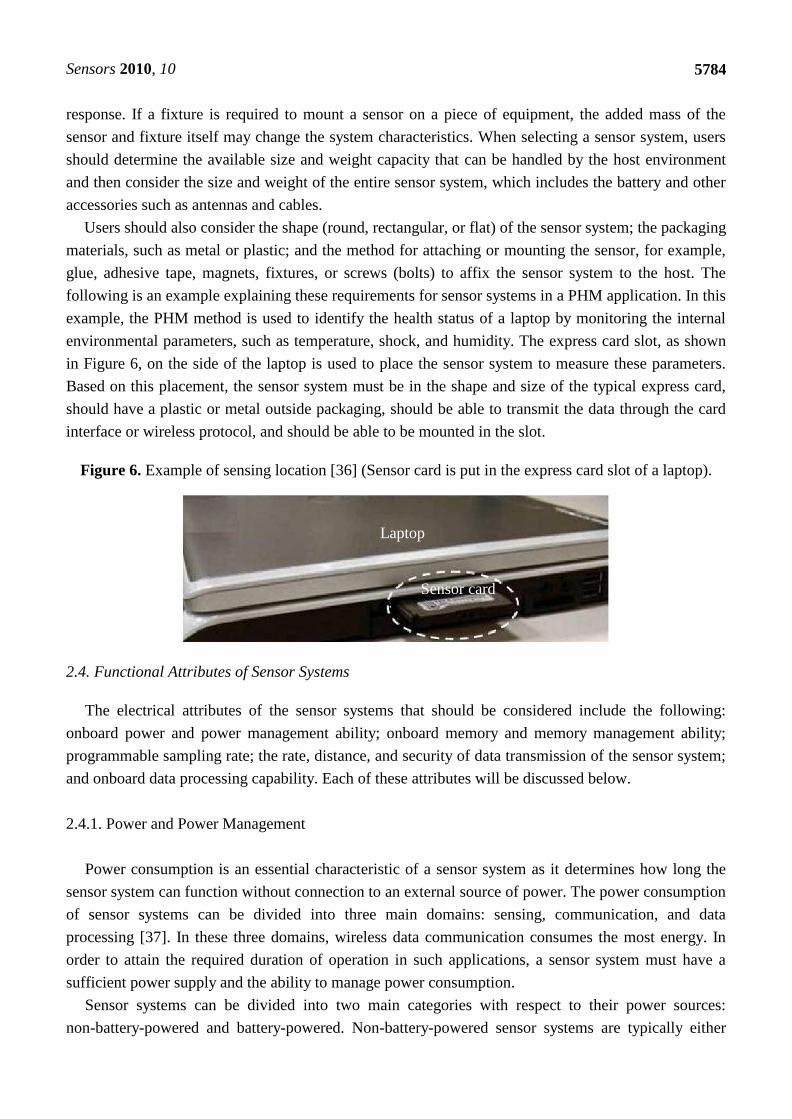
following is an example explaining these requirements for sensor systems in a PHM application. In this
example, the PHM method is used to identify the health status of a laptop by monitoring the internal
environmental parameters, such as temperature, shock, and humidity. The express card slot, as shown
in Figure 6, on the side of the laptop is used to place the sensor system to measure these parameters.
Based on this placement, the sensor system must be in the shape and size of the typical express card,
should have a plastic or metal outside packaging, should be able to transmit the data through the card
interface or wireless protocol, and should be able to be mounted in the slot.
Figure 6. Example of sensing location [36] (Sensor card is put in the express card slot of a laptop).
2.4. Functional Attributes of Sensor Systems
The electrical attributes of the sensor systems that should be considered include the following:
onboard power and power management ability; onboard memory and memory management ability;
programmable sampling rate; the rate, distance, and security of data transmission of the sensor system;
and onboard data processing capability. Each of these attributes will be discussed below.
2.4.1. Power and Power Management
Power consumption is an essential characteristic of a sensor system as it determines how long the
sensor system can function without connection to an external source of power. The power consumption
of sensor systems can be divided into three main domains: sensing, communication, and data
processing [37]. In these three domains, wireless data communication consumes the most energy. In
order to attain the required duration of operation in such applications, a sensor system must have a
sufficient power supply and the ability to manage power consumption.
Sensor systems can be divided into two main categories with respect to their power sources:
non-battery-powered and battery-powered. Non-battery-powered sensor systems are typically either
Laptop
Sensor card

Sensors 2010, 10
5785
wired to an external AC power source or they use power from an integrated host system. For example,
a temperature sensor is often integrated within the microprocessor on a motherboard and utilizes the
computer’s power supply.
Battery-powered sensor systems are equipped with an onboard battery. Replaceable or rechargeable
batteries allow sensor systems to operate continuously without replacing the entire system.
Rechargeable lithium ion batteries are commonly used in battery-powered sensor systems. In some
situations, the battery is inaccessible. The use of batteries with a larger capacity or standby batteries
may be required in such applications.
Power management is used to optimize the power consumption of the sensor system in order to
extend its operating time. Power consumption varies for different operational modes of the system
(e.g., active mode, idle mode, and sleep mode). The sensor is in active mode when it is being used to
monitor, record, transmit, or analyze data. The power consumed for sensing varies depending on the
parameter sensing methods and sampling rate. Continuous sensing will consume more power, while
periodic or event-triggered sensing will consume less power. A higher sampling rate will consume
more power because it senses and records data more frequently. Additionally, wireless data
transmission and onboard signal processing will consume more power.
In its idle state, a sensor system consumes much less power than during active mode. Sleep mode
consumes the lowest power. The tasks of power management are to track and model incoming requests
or signals in order to determine when to switch between the active state and idle state, how long the
idle state will be maintained, when to switch to the sleep state, and when to wake up the system. For
example, in continuous sensing, the sensing elements and memory are active, but if data transmission
is not required, the sensor system can be put into sleep mode. Power management will wake up the
data transmission circuit when it receives a request.
2.4.2. Onboard Memory and Memory Management
Onboard memory is the memory contained within a sensor system. It can be used to store collected
data as well as information pertaining to the sensor system (e.g., sensor identity, battery status), which
enables the sensor system to be recognized and to communicate with other systems. Firmware
(embedded algorithms) in the memory provides operating instructions to the microprocessor and
enables it to process the data in real time. Onboard memory allows for much higher data sampling and
save rates.
Memory requirements are affected by sensing mode and sampling rate. Sensor systems should allow
the user to program the sampling rate and set the sensing mode (i.e., continuous, triggered, and
threshold). These settings affect the amount of data stored in the memory.
Memory management allows a user to configure, allocate, monitor, and optimize the utilization of
memory. For multiple-sensing sensor systems, the data format will often depend on the sensing
variable. Memory management should be able to distinguish various data formats and save them into
corresponding areas of the memory. For example, the sampling rate, time stamp, and data range of
temperature are different from those of vibration data. In the memory, these different data may be
stored separately based on algorithms in order to make them easy to identify. Memory management
Sensors 2010, 10
5786
also should have the ability to show the usage status of the memory, such as the availability percentage,
and indicate when the memory is becoming full.
The sampling mode determines how the sensor monitors the parameters and at what times it will
actively sample the measurand. Commonly used sampling modes include periodic and event-triggered
sampling. The sampling rate defines the number of samples per second (or other unit of time) taken
from a continuous signal to make a discrete signal. The combination of sampling mode and sampling
rate controls the sampling of the signal.
Programmable sampling modes and rates are preferred for PHM applications, since these features
affect diagnostic and prognostic power consumption and memory requirements directly. Under the
same sampling mode, a low sampling rate consumes less power and memory than a high sampling rate.
But a sampling rate less than twice the frequency of operation leads to distortion in reconstructed
signals and may reduce the likelihood of capturing intermittent or transient events that are needed for
fault detection. Additionally, if the user wants to utilize a sensor, for example, to monitor vibration and
temperature at the same time, the sensor system should allow the user to set the sampling mode and
rate for these different types of parameters individually.
2.4.3. Onboard Data Processing
Signal processing consists of two parts: one is embedded processing that is integrated into the
onboard processor to enable immediate and localized processing of the raw sensor data; the other is
processing conducted in the host computer. When selecting sensor systems, one should consider both
of these functions.
Onboard processing can significantly reduce the number of data points and thus free up memory for
more data storage. This in turn reduces the volume of data that must be transmitted out to a base station
or computer, and hence results in lower power consumption by data transmission. In the case of a large
number of sensor systems working in a network, this would allow decentralization of computational
power and facilitate efficient parallel processing of data.
Onboard processing can also facilitate efficient data analysis for environmental monitoring
applications. Onboard processing can be set to provide real-time updates for taking immediate action
such as powering off the equipment to avoid accidents or catastrophic failures. It can also be set to
provide prognostic horizons to conduct future repair and maintenance activities.
Currently, onboard signal processing includes feature extraction (e.g., rainflow cycle counting
algorithm), data compression, fault recognition, and fault prediction. Ideally, the onboard processor
should display its calculation results and execute actions when a fault is detected, and it should
be programmable.
However, the abilities of the onboard processor are limited by some physical constraints. One
constraint is the available power. If processing requires extended calculation and high calculating
speeds, it will consume much more power. The other constraint is onboard memory capacity. Running
complex software requires a lot of memory. These two constraints make it challenging to embed
complex algorithms into onboard processors. However, even using simple algorithms and routines to
process raw sensor data can achieve significant gains for in-situ analysis.
Sensors 2010, 10
5787
2.4.4. Data Transmission
Once data is collected by the sensor system, it is typically transmitted to a base station or computer
for post-analysis. In general, the methods for data transmission are either wireless or wired. Wired data
transmission can offer high speed transmission, but this transmission is limited by the need for
transmission wires, and the cost is increased by wires. Wireless transmission has emerged as a
promising technology that can impact PHM applications. Wireless transmission refers to the
transmission of data over a distance without the use of a hard-wired connection. The distances
involved may be short (a few meters, as in a television remote control) or very long (thousands or even
millions of kilometers for radio communications). Wireless sensor systems can be used to remotely
monitor inhospitable and toxic environments and transmit measured data to a centrally located
processing station. Also, since wireless sensor systems are not dependent on extensive lengths of wires
for the transmission of measurement data, they save installation and maintenance costs. The advantage
of wireless sensor systems can be greatly enhanced by embedding micro-controllers that have data
analysis capabilities within the wireless sensor.
A lot of wireless technologies can be used for wireless data transmission of sensor systems, for
example, Radio Frequency Identification (RFID), Bluetooth, Wi-Fi (IEEE 802.11), Ultra-Wideband
(UWB), Certified Wireless USB (WUSB), WiMax (Worldwide Interoperability for Microwave Access
and IEEE 802.16), and Zigbee (IEEE 802.15.4). When selecting the wireless technology to use for a
particular application, the user should consider the range and rate of communication, power
consumption, ease of implementation, and data security.
An RFID sensor system combines the RFID tag with the sensing element. An RFID tag is an object
that can be attached to or incorporated into a product, animal, or person for the purpose of
identification or monitoring using radio waves [38]. This RFID tag uses sensing elements to detect and
record temperature, humidity, movement, or even radiation data, and then utilizes RFID to identify the
sensor as well as to transfer the raw data or processed data. RFID systems use many different
frequencies, for example, low-frequency (around 125 KHz), high-frequency (13.56 MHz), and
ultra-high-frequency (UHF, higher than 860 MHz). In order to communicate to readers, RFID tags
have to be tuned to a frequency in common with the readers. [39].
The ePrognostic sensor system shown in Figure 5 is an RFID-based sensor system. The multiple
sensing elements, such as temperature, vibration and humidity, are embedded in the RFID tag.
Monitored data is transferred by RFID to a reader connected to a computer, The RF frequency of an
ePrognostic sensor tag is typically 915 MHz or 2.4 GHz. The communications range from a few feet
(for security) to 100 m.
Bluetooth is an RF-based wireless data transmission technology. It operates in the 2.4 GHz
to 2.485 GHz ISM (industrial, scientific, medical) band utilizing low-transmit power radios and the
frequency-hopping spread spectrum technique [40]. Bluetooth devices hop though 1,600 frequency
channels per second, of which 800 channels are transmit channels and the other 800 channels are
receive channels. The channels span 79 MHz with 1 MHz spacing between the neighboring channels.
Thus, Bluetooth is designed to be functional even in very noisy RF environments [41]. The data rate
Sensors 2010, 10
5788
is 1 Mbps for Version 1.2, up to 3 Mbps supported for Version 2.0 + Enhanced Data Rate (EDR), and
up to 24 Mbps supported for Version 3.0 + Higher Speed (HS) [41].
Wi-Fi (IEEE 802.11) is another RF-based wireless technology that can be used in sensor systems. A
typical Wi-Fi setup includes one or more access points (APs) and one or more clients (computers,
video game consoles, mobiles, sensors, etc.). The primary job of an access point is to broadcast a
wireless signal that computers can detect and ―tune into‖. Wi-Fi networks operate in the 2.4 GHz
(802.11b/g/n), 5 GHz (802.11a/n), and 3.7 GHz (802.11.y) radio bands, with 11 Mbit/s (802.11b),
54 Mbit/s (802.11a/g/y), or up to 600 Mbit/s (802.11n) data rates, respectively. The outside transfer
range can be up to 120 m (802.11.a), 140 m (802.11.b/g), and 250 m (802.11.n) [42].
Zigbee (IEEE 802.15.4, Low-rate Wireless Personal Area Network (WPAN) standard) is used for
industrial controls (for example, process control and energy management), embedded sensing, medical
data collection, smoke and intruder warning, building automation (for example, access control and
energy monitoring), and home automation (e.g., smart lighting, temperature control, and safety and
access control). Zigbee works at 2.4 GHz and 868/915 MHz. The data rate is 250 Kbps at 2.4 GHz,
40 Kbps at 915 MHz, and 20 Kbps at 868 MHz. The transmission range is between 10 and 75 m and
up to 1,500 m for Zigbee Pro, although it is heavily dependent on the particular environment [43].
An Ultra-Wideband (UWB) transmitter works by sending billions of pulses across a very wide
spectrum of frequencies several GHz in bandwidth. The corresponding receiver then translates the
pulses into data by listening for a familiar pulse sequence sent by the transmitter. UWB’s combination
of a larger spectrum, lower power, and pulsed data improves speed and reduces interference with other
wireless spectra. In the United States, the Federal Communications Commission (FCC) has mandated
that UWB radio transmissions can legally operate in the range from 3.1 GHz up to 10.6 GHz at a
limited transmit power of –41 dBm/MHz [44].
Certified Wireless USB is the specification of a wireless extension of the USB standard intended to
further increase the availability of general USB-based solutions. It enables products such as personal
computers, consumer electronics, and mobile devices to connect using a common interface at up
to 480 Mbit/s at 3 m and 110 Mbit/s at 10 m. At close range, it is the same rate as Hi-Speed USB.
Wireless USB was designed to operate in the 3.1 GHz–10.6 GHz range. Certified wireless USB has
power management strategies. Sleep, listen, wake, and conserve modes ensure that devices use only the
minimum power necessary. All Certified Wireless USB products are required to encrypt their data
transmissions [45].
The security of wireless data transmission is an important factor that should be considered. The
standard approach is to encrypt the data transmitted by the sensors. In addition, it might also be
necessary to provide authentication mechanisms in order to guarantee that the data source is the
claimed sender [46,47]. Walters et al. [48] classified different security risks of wireless sensor
networks and described defensive methods to protect data transmission. One should evaluate the
security strategy of the wireless sensor system or customize the security level to protect data
during transmission.
Currently, hybrid data transmission combines wired data transmission and wireless data
transmission. This arrangement can represent a compromise that improves data transmission, power
requirements, and cost. Wired transmission offers high speed transmission and consumes low energy.
Sensors 2010, 10
5789
Wireless data transmission can offer convenient data communication and eliminate the need for wire,
but it consumes more power. There are trade-offs to be made for any given application. For example,
many sensor systems transfer data from a sensor to a receiving device wirelessly, and then the
receiving device transfers the data to a computer by a wired USB port.
2.5. Cost
The selection of the proper sensor system for a given PHM application must include an evaluation
of the cost. The cost evaluation should address the total cost of ownership including the purchase,
installation, maintenance, and replacement of sensor systems. In fact, the initial purchase cost of a
product can be less than 20% of the product’s total lifetime cost [49].
In addition to cost of ownership, justifying the cost of sensors can be quite challenging for products
produced in large volumes. Prognostics and health management (PHM) methods for these products are
more complex because more parameters need to be monitored and more sensor elements or systems are
required. In this case, the total cost could differ considerably for different sensor system integration
strategies. One strategy is that the user purchases individual sensor systems at a low cost and then
integrates them. A second strategy is to purchase integrated sensor systems with multiple sensing
abilities, onboard power, memory, processing capabilities, and wireless data transmission. Typically,
the cost for integrated sensor systems will be lower than the total cost of individual sensor systems and
the integration of these individual sensor systems. The third strategy is to integrate or build the sensor
systems in the product as part of the product. This provides the lowest cost for sensor systems, but it
will increase the cost for the product due to new hardware, software, and qualification procedures, etc.
2.6. Reliability
Failed sensor systems provide incorrect or incomplete data and cause PHM to generate wrong
detections, alarms, and predictions. If the sensor system is used to measure a critical parameter or is
installed at a limited access location, the adverse impacts to PHM will be more severe. The reliability
of a sensor system requires the ability of the sensor system to perform a necessary function under stated
conditions for a stated period. However, reliability information, such as the mean time between failures
(MTBF) and failure rate under certain environmental and operational conditions, is rarely specified by
the sensor system manufacturers.
One strategy to improve the reliability of sensor systems is to use multiple sensors (redundancy) to
monitor the same product or system. By using redundancies, the risk of losing data due to sensor
system failure is reduced, but the cost increases.
Some technologies, such as sensor validation, can also improve the reliability of sensor systems. For
example, sensor validation [50] is used to assess the integrity of a sensor system and adjust or correct it
as necessary. This functionality checks the sensor performance and ensures that the sensor system is
working correctly by detecting and eliminating the influence of systematic errors. When selecting a
sensor system, the user should check to see if the sensor system has the validation functions.
While it is essential to consider the reliability of sensor systems, it is equally necessary to consider
the effects of the sensor system on the reliability of the product it is intended to monitor. Sensor
systems that are heavy may reduce the reliability of the circuit boards they are attached to over time. In
Sensors 2010, 10
5790
addition, the method of attachment (soldering, glue, or screws) can reduce the reliability of the product
if the attachment material is incompatible with the product’s construction materials.
3. State-of-the-Art Sensor Systems for PHM Implementation
In 2008, a survey was conducted by the authors to determine the commercial availability of sensor
systems that can be used in PHM for electronic products and systems. The survey only included
commercially available sensor systems having features desirable for PHM.
The survey results showed the characteristics of 33 sensor systems from 23 manufacturers. The
sensor system characteristics included sensing parameters, power supply and power management
capability, sample rate, onboard memory, data transmission method, availability of embedded signal
processing software, size, weight, and cost. The data for each sensor system was collected from the
manufacturer’s website, product datasheets, e-mails, and evaluations of demo products. The data is
listed in Appendix A of [1].
Key findings from the survey are that state-of-the-art sensor systems: (1) can autonomously perform
multiple functions using their own power management, data storage, signal processing, and wireless
data transmission; (2) have multiple, flexible, or add-on sensor ports that support various sensor nodes
to monitor various parameters such as temperature, humidity, vibration, and pressure;
(3) have onboard power supplies, such as rechargeable or replaceable batteries; (4) have onboard
power management, allowing control of operation modes (active, idle, and sleep), and programmable
sampling modes (continuous, triggered, or threshold) and sampling rates; (5) have diverse onboard data
storage capacity (flash memory), from several KB to more than hundreds of MB; (6) have embedded
signal processing algorithms that enable data compression or simplification prior to data transfer; and
(7) use various wireless technologies including RFID, Bluetooth, Wi-Fi, Zigbee,
Ultra-Wideband, and Wireless USB.
The survey also found that current sensor systems should be improved in several aspects for PHM
applications. The first areas are size and weight. PHM for an electronics system with a high density of
components requires small-size and light-weight sensor systems that can be placed on the circuit board
and that minimize the weight increase and potential adverse effects on the reliability of the monitored
electrical system.
Onboard power is also one of the main limitations of current commercially available sensor
systems, especially for wireless data transmission sensor systems. The main onboard power is a battery,
which needs be replaced or recharged when it is used up. Higher capacity batteries with small size and
light weight or battery-free power are needed for sensor systems to operate longer in
PHM applications.
Onboard data processing ability should also be improved. In the survey, only a few sensor systems
had onboard data processing ability, and these only had very simple functions, for example, data
reduction. Onboard data processing provides timely information about the health of the system and can
reduce the cost of the entire PHM application. Onboard data processing requires high-speed
processors, large-capacity memory, more power, and processing algorithms. The processing algorithms
can be developed based on specific PHM applications.
Sensors 2010, 10
5791
4. Emerging Trends in Sensor Technology for PHM
In general, PHM application requires that sensor technology should be headed toward extreme
miniaturization, battery-free power or ultra-low power consumption, and intelligent wireless networks.
Since electronic components and systems continue to decrease in size, sensors to monitor their
environments and operation will also become smaller and weigh less in order to be integrated. As
Micro Electro Mechanical Systems (MEMS) or Nano Electro Mechanical Systems (NEMS) and smart
material technologies mature, MEMS sensors or nanosensors will integrate the sensing element,
amplification, analog-to-digital converter, and memory cells into one microchip. The fabrication of
MEMS and NEMS will offer significant advantages in terms of integration with electronics,
fabrication of arrays of sensors, small size of individual devices, low-power consumption,
and lower costs [51].
With the development of new materials and energy technologies, battery-free sensor systems are
being considered, especially for use in embedded, remote, and other inaccessible monitoring
conditions. Battery-free sensor systems will be developed based on ultra-low power electronics and
energy-harvesting technologies.
Ultra-low power electronics will enable future sensor systems to consume much less power. A lot of
new ultra-low power consumption technologies are emerging. For example, in June 2009,
STMicroelectronics announced a new ultra-low power technology platform for building a range
of 8-bit and 32-bit microcontrollers, which will enable future generations of electronic products to
consume less power, meet evolving energy-efficiency standards, and operate for longer times from
their batteries. This new platform is built on a 130nm process, which ST has further optimized with
ultra-low leakage transistors for logic functions, low voltage transistors for analog functions,
innovative low power embedded memory, new low-voltage low-power standard peripherals, and an
innovative power management architecture. ―These enhancements dramatically reduce dynamic and
static power consumption, enabling forthcoming families of microcontrollers delivering better
performance per Watt than the most frugal low-power devices on the market today‖ [52]. The
emerging ultra-low power technologies enable the production of ultra-low power consumption chips
for all kinds of electronic products.
Energy harvesting is a process to extract energy from the environment or from a surrounding system
and convert it to usable electrical energy. Current energy harvesting sources include sunlight, thermal
gradient, human motion, body heat, wind, vibration, radio power, and magnetic coupling. Several
excellent articles reviewing possible energy sources for energy harvesting can be found in the
literature [53-57]. Some large-scale energy harvesting schemes such as wind turbines and solar cells
have made the transition from research to commercial products. The interest in small-scale energy
harvesting for embedded sensor systems, such as implanted medical sensors and sensors on aerospace
structures, is increasing.
Basic effects used in energy harvesting include electromagnetic, piezoelectric, electrostatic, and
thermoelectric effects. For example, the mechanical vibration inside a device or ambient mechanical
vibration can be converted into electric energy by piezoelectric materials or electromagnetic induction.
Sensors 2010, 10
5792
Piezoelectric materials form transducers that are able to interchange electrical energy and
mechanical vibration or force. The electromagnetic induction systems are composed of a coil and a
permanent magnet attached to a spring. The mechanical movement of the magnet, which is caused by a
device or ambient vibration, induces a voltage at the coil terminal, and this energy can be delivered to
an electrical load. The thermal energy is often converted into electric energy by thermoelectric
generators (TEGs). With recent advances made in nanotechnologies, the fabrication of MEMS-scale
TEG devices has been actively studied. The combined use of several energy harvesting sources in the
same device can increase the harvesting capabilities in different situations and applications and can
minimize the gap between the required and harvested energy [58].
Distributed sensor networks (DSNs) consist of multiple sensor nodes that are capable of
communicating with each other and collaborating on the same sensing goal [59]. The advantage of a
DSN is that it allows data from multiple sensors to be combined or fused to obtain inferences that may
not be possible from a single sensor. The sensor nodes in a DSN are organized into a cooperative
system. The nodes can communicate with each other and have the ability to self-organize.
Wireless transmissions, such as Wireless USB, are being transferred to sensor products. The
development of wireless transmission technology will produce intelligent wireless sensor networks
with characteristics of long distance, high transmission rate, ultra-low power consumption, more secure
data communication, and high-speed data fusion processing. Furthermore, future smart sensor nodes
will be highly intelligent, with more functions than today’s sensors [60]. They will have built-in
diagnostic and prognostic capabilities, which will make the entire sensor network more functional. The
integration of all of the above technology accelerates the development of wireless intelligent sensor
networks [61].
5. Discussion
This paper mainly focuses on commercially available sensor systems that can be used for PHM
applications with minor or no design modifications. There are several limitations with these add-on
sensor systems. For example, they cannot be effectively integrated with the monitored product and
hence cannot sense critical variables that are integral to product operation and performance, such as
voltage rails, power buses, etc. One way for PHM application to overcome this limitation is to identify
the correlations between the parameters that can be monitored by add-on sensor systems and the
parameters integral to product operation and performance based on historic data or training data. Based
on the correlation, PHM can infer changes in critical parameters based on the parameters monitored by
add-on sensor systems. For example, Kwon et al. [62] demonstrated that monitored RF impedance
increased as a physical crack propagated across the solder joint under stress conditions, and
characterized the extent of physical solder joint degradation associated with the changes in RF
impedance. The other method is for PHM to integrate the information offered by the add-on sensor
systems and the information obtained from the system buses of the product. For example, when
applying PHM for a laptop, a sensor system that can sense temperature, humidity, shock, and position
can be integrated into a card that can be inserted into the card slot of the laptop to monitor these
parameters. On the other hand, PHM also obtains the information acquired by BIOS from the system
Sensors 2010, 10
5793
bus, for example, the internal temperature of the CPU and GPU, fan speed, memory usage condition,
CPU usage condition, etc.
Other limitations, such as accessibility to the best sensing locations due to limited space for sensing
or inhospitable or toxic environments, can be overcome with the development of sensor technologies
that can make smaller and more powerful wireless sensor systems.
The selection of a sensor system for PHM applications requires analysis of the application,
identification of the parameters to be monitored and all the requirements for the sensor systems, and
prioritization of these requirements based on the specific application. Then, sensor system candidates
should be identified and evaluated based on these requirements. Finally, some trade-offs must be made
to select proper sensor systems.
6. Conclusions
PHM is an enabling discipline that assesses the reliability of a product in its actual life cycle. PHM
for a product is a long-term effort that requires monitoring the product by continuous or periodic
measuring, sensing, recording, and analyzing of different parameters in its life cycle to assess the
health status of the product, identify abnormal conditions, and predict the remaining life of the product.
In PHM applications, sensor systems are essential devices for conducting in situ monitoring of the
actual life cycle of a product. PHM requires that sensor systems be highly integrated with multiple
sensing abilities, low power consumption, low cost, long-range and high-rate data transmission
(wireless or wired), large onboard memory capacity, fast onboard data processing abilities, miniature
weight and size, and high reliability.
A survey of the current commercially available sensor systems identified the state of the art of
sensor systems. Many sensor systems have multiple functions, such as multiple sensing capabilities,
onboard power and power management ability, onboard memory and management ability, wireless
data transmission, and onboard data processing ability. However, the survey also identified several
unmet needs of sensor systems for PHM applications, including size and weight of the sensor systems
and the limitations of onboard power supply, memory capacity, onboard data processing ability, etc.
Several technologies such as MEMS or NEMS, energy harvest techniques, ultra-low power
consumption circuits, and intelligent wireless sensor network techniques, have been emerging to
provide more powerful sensor systems in the future. The trend in sensor systems is toward extreme
miniaturization, wireless transmission with long range and high rate, low cost, ultra-low power
consumption, battery-free power supply, stronger onboard data processing ability, more intelligence,
and networking.
In a specific PHM application, the user can identify the parameters to be monitored by a failure
mechanism-based method called failure modes, mechanisms, and effects analysis (FMMEA). The
requirements of PHM applications for sensor systems regarding sensor performance, electrical and
physical attributes, reliability, cost, and availability of sensor systems must also be understood. Some
trade-offs must be made to select proper sensor systems as well.
Sensors 2010, 10
5794
References
1. Pecht, M. Prognostics and Health Management of Electronics; Wiley-Interscience: New York,
NY, USA, 2008.
2. DoD 5000.2 Policy Document. Performance Based Logistics. In Defense Acquisition Guidebook;
Defense Acquisition University: Fort Belvoir, VA, USA, December 2004; Chapter 5.3.
3. Vichare, N.; Pecht, M. Prognostics and Health Management of Electronics. IEEE Trans. Compon.
Packag. Technol. 2006, 29, 222–229.
4. Schwabacher, M.; Goebel, K. A Survey of Artificial Intelligence for Prognostics. In Proceedings
of 2007 AAAI Fall Symposium: AI for Prognostics, Arlington, VA, USA, November 9–11, 2007.
5. Liu, J.; Djurdjanovic, D.; Marko, K.; Ni, J.A. Divide and Conquer Approach to Anomaly
Detection, Localization Diagn. Mech. Syst. Signal Process. 2009, 23, 2488–2499.
6. Vachtsevanos, G.; Lewis, F.; Roemer, M.; Hess, A.; Wu, B. Intelligent Fault Diagnosis and
Prognosis for Engineering Systems, 1st ed.; John Wiley & Sons: Hoboken, NJ, USA, 2006.
7. Saha, B.; Goebel, K.; Poll, S.; Christophersen, J. Prognostics Methods for Battery Health
Monitoring Using a Bayesian Framework. Instrumentation and Measurement. IEEE Trans.
Instrum. Meas. 2009, 58, 291–296.
8. Kalgren, P.; Baybutt, M.; Ginart, A.; Minnella, C.; Roemer, M.; Dabney, T. Application of
Prognostic Health Management in Digital Electronic Systems. In Proceedings of the IEEE
Aerospace Conference, Big Sky, MT, USA, March 2007; pp. 1–9.
9. Brown, D.; Kalgren, P.; Byington, C.; Roemer, J. Electronic Prognostics—A Case Study Using
Global Positioning System (GPS). Microelectron. Rel. 2007, 47, 1874–1881.
10. Kulkarni, C.; Biswas, G.; Koutsoukos, X. A Prognosis Case Study for Electrolytic Capacitor
Degradation in DC-DC Converters. In Proceedings of Annual Conference of the Prognostics and
Health Management Society, San Diego, CA, USA, September 2009.
11. Gu, J.; Barker, D.; Pecht, M. Prognostics Implementation of Electronics under Vibration Loading.
Microelectron. Rel. 2007, 47, 1849–1856.
12. Pecht, M.; Dasgupta, A. Physics-of-Failure: An Approach to Reliable Product Development. J.
Inst. Environ. Sci. 1995, 38, 30–34.
13. Andrew, H. Real Prognostics—Challenges, Issues, and Lessons Learned: Chasing the Big ―P‖.
In Proceedings of the First International Forum on Integrated System Health Engineering and
Management in Aerospace, Napa Valley, CA, USA, November 7–10, 2005.
14. Jata, K.V.; Parthasarathy, T.A. Physics of Failure. In Proceedings of the 1st International Forum
on Integrated System Health Engineering and Management in Aerospace, Napa Valley, CA, USA,
November 7–10, 2005.
15. Kia Motors. Kia Safety: Future of Safety. Available online: http://www.kia.co.nz/PlanetKia/Kias-
Commitment-To-Sustainability/Kia-Safety.aspx (accessed on 1 June 2010).
16. Tuchband, B.; Cheng, S.; Pecht, M. Technology Assessment of Sensor Systems for Prognostics
and Health Monitoring. In Proceedings of IMAPS on Military, Aerospace, Space and Homeland
Security: Packaging Issues and Applications (MASH), Baltimore, MD, USA, May 2007.
17. Cheng, S.; Tom, K.; Thomas, L.; Pecht, M. A Wireless Sensor System for Prognostics and Health
Management. IEEE Sens. J. 2010, 10, 856–862.
Sensors 2010, 10
5795
18. Ganesan, S.; Eveloy, V.; Das, D.; Pecht, M. Identification and Utilization of Failure Mechanisms
to Enhance FMEA and FMECA. In Proceedings of the IEEE Workshop on Accelerated Stress
Testing and Reliability (ASTR), Austin, TX, USA, October 3–5, 2005.
19. IEEE Standard 1413.1-2002—IEEE Guide for Selecting and Using Reliability Predictions Based
on IEEE 1413; IEEE: New York, NY, USA, 19 February 2003.
20. Sato, K.; Ogata, Y.; Ohno, K.; Ikeo, H. Mechanism of Ceramic Capacitor Leakage Failures Due to
Low DC Stress. In Proceedings of the 18th International Reliability Physics Symposium, Los
Angeles, CA, USA, April 1980; pp. 205–212.
21. Keimasi, M.; Azarian, M.; Pecht, M. Isothermal Aging Effects on Flex Cracking of Multilayer
Ceramic Capacitors with Standard and Flexible Terminations. Microelectron. Rel. 2007, 47,
2215–2225.
22. Donahoe, D.; Pecht, M.; Lloyd, I.; Ganesan, S. Moisture Induced Degradation of Multilayer
Ceramic Capacitors. Microelectron. Rel. 2006, 46, 400–408.
23. Davis, G.D.; Dacres, C.M.; Krebs, L.A. In Situ Corrosion Sensor for Coating Testing and
Screening. Mater. Perform. 2000, 39, 46–51.
24. Pacheco, M.; Wang, Z.; Skoglund, L.; Liu, Y.; Medina, A.; Raman, A.; Dias, R.; Goyal, D.;
Ramanathan, S. Advanced Fault Isolation and Failure Analysis Techniques for Future Package
Technologies. Intel Technol. J. 2005, 9, 337–352.
25. Sophian, A.; Tian, G.Y.; Zairi, S. Pulsed Magnetic Flux Leakage Techniques for Crack Detection
and Characterization. Sensor. Actuator. A-Phys. 2006, 125, 186–191.
26. Van Velsor, J.; Owens, S.; Rose, J. Guided Waves for Nondestructive Testing of Pipes. US.
Patent US 2009/0150094 A1, June 11, 2009.
27. Wan, K.; Leung, C. Fiber Optic Sensor for the Monitoring of Mixed Mode Cracks in Structures.
Sensor. Actuator. A-Phys. 2007, 135, 370–380.
28. Sotiris, V.; Tse, P.; Pecht, M. Anomaly Detection through a Bayesian Support Vector Machine. J.
Trans. 2010, 1, 1–11.
29. Kumar, S.; Dolev, E.; Pompetzki, M.; Pecht, M. A Residual Estimation Based Approach for
Isolating Faulty Parameters. In Proceedings of IEEE Aerospace Conference, Big Sky, MT, USA,
March 7–14, 2009.
30. Bernstein, D. Sensor Performance Specifications. IEEE Control Syst. Mag. 2001, 21, 9–18.
31. ISO/IEC Guide 99:2007. International Vocabulary of Metrology—Basic and General Concepts
and Associated Terms (VIM); ISO: Geneva, Switzerland, 2007.
32. Wilson, J. Sensor Technology Handbook; Elsevier/Newnes: Burlington, MA, USA, 2005.
33. Webster, J. The Measurement, Instrumentation and Sensors Handbook; CRC/IEEE Press: Boca
Raton, FL, USA, 1999.
34. Fraden, J. AIP Handbook of Modern Sensors. Physics, Designs and Applications; AIP: Woodbury,
NY, USA, 1997.
35. Gu, J.; Barker, D.; Pecht, M. Uncertainty Assessment of Prognostics of Electronics Subject to
Random Vibration. In Proceedings of AAAI Fall Symposium on Artificial Intelligence for
Prognostics, Arlington, VA, USA, November, 2007; pp. 50–57.
Sensors 2010, 10
5796
36. Gu, J.; Vichare, N.; Tinsley, E.; Pecht, M. Computer Usage Monitoring for Design and Reliability
Tests. IEEE Trans. Compon. Packag. Technol. 2009, 32, 550–556.
37. Akyildiz, I.; Su, W.; Sankarasubramaniam, Y.; Cayirci, E. Wireless Sensor Networks: A Survey.
Comput. Netw. 2002, 38, 393–422.
38. Want, R. An Introduction to RFID Technology. IEEE Perv. Comp. 2006, 5, 25–33.
39. RFID Journal. Available online: http://www.rfidjournal.com/faq/17 and http://www.rfidjournal.
com/faq/18/ (accessed on 22 July 2009).
40. Chatschik, B. An Overview of the Bluetooth Wireless Technology. IEEE Commun. Mag. 2001,
39, 86–94.
41. SIG Bluetooth. Bluetooth Specifications. Available online: http://bluetooth.com/Bluetooth/
Technology/Building/Specifications/Default.htm/ (accessed on 22 July 2009).
42. O’Hara, B.; Petrick, A. IEEE 802.11 Handbook: A Designer’s Companion. IEEE Press, 2004.
43. Baronti, P.; Pillai, P.; Chook, V.; Chessa, S.; Gotta, A.; Hu, Y. F. Wireless Sensor Networks: A
Survey on the State of the Art and the 802.15.4 and ZigBee Standards. Comput. Commun. 2007,
30, 1655–1695.
44. Foerster, J.; Green, E.; Somayazulu, S.; Leeper, D. Ultra-Wideband Technology for Short or
Medium Range Wireless Communication. Intel Technol. J. 2001, Q2, 1-11.
45. Wireless USB Specification Revision 1.0. Available online: http://www.usb.org/developers/
wusb/wusb_2007_0214.zip/ (accessed on 22 July 2009).
46. Karygiannis, T.; Eydt, B.; Barber, G.; Bunn, L.; Phillips, T. Guidelines for Securing Radio
Frequency Identification (RFID) Systems; NIST Special Publication 800-98; National Institute of
Standards and Technology: Gaithersburg, MD, USA, 2007.
47. Shorey, R. Mobile, Wireless, and Sensor Networks: Technology, Applications, and Future
Directions; Wiley-IEEE Press: Hoboken, NJ, USA, 2006.
48. Walters, J.; Liang, Z.; Shi, W.; Chaudhary, V. Wireless Sensor Network Security: A Survey. In
Security in Distributed, Grid, Mobile, and Pervasive Computing; Xiao, Y., Ed.; CRC Press: Boca
Raton, FL, USA, 2007; Chapter 16.
49. SpaceAge Control. Sensor Total Cost of Ownership. Available online: http://www.spaceage
control.com/s054a.htm/ (accessed on 22 July 2009).
50. Ibarguengoytia, P.; Vadera, S.; Sucar, L. A Probabilistic Model for Information and Sensor
Validation. Comput. J. 2006, 49, 113–126.
51. Metras, H. Trends in Wireless Sensors: Potential Contributions of Nanotechnologies and Smart
Systems Integration Issues. In Proceedings of 2006 IST Conference, Helsinki, Japan,
November 2006.
52. STMicroelectronics. STMicroelectronics Unveils Ultra-Low-Power Technology Platform for
8-Bit and 32-Bit Microcontrollers, Enabling Next-Generation Power-Saving Products. Available
online: http://www.st.com/stonline/stappl/cms/press/news/year2009/p2389.htm/ (accessed on 20
July 2009).
53. Fry, N.D.; Holcomb, E.D.; Munro, K.J.; Oakes, C.L.; Maston, J.M. Compact Portable Electric
Power Sources; Oak Ridge National Laboratory Report ORNL/TM-13360; Oak Ridge National
Laboratory: Oak Ridge, TN, USA, 1997.
Sensors 2010, 10
5797
54. Glynne-Jones, P.; White, M.N. Self-Powered Systems: A Review of Energy Sources. Sens. Rev.
2001, 21, 91–97.
55. Roundy, J.S. Energy Scavenging for Wireless Sensor Nodes with a Focus on Vibration to
Electricity Conversion; PhD. Dissertation, Department of Mechanical Engineering, University of
California, Berkeley, CA, USA, 2003.
56. Qiwai, A.M.; Thomas, P.J.; Kellogg, C.J.; Baucom, J. Energy Harvesting Concepts for Small
Electric Unmanned Systems. Proc. SPIE 2004, 5387, 84–95.
57. Paradiso, A.J.; Starner, T. Energy Scavenging for Mobile and Wireless Electronics. IEEE
Pervasive Comput. 2005, 4, 18–27.
58. Mateu, L.; Moll, F. Review of Energy Harvesting Techniques and Applications for
Microelectronics. Proc. SPIE 2005, 5837, 359–373.
59. Eschenauer, L.; Gligor, V. A Key-Management Scheme for Distributed Sensor Networks. In
Proceedings of the 9th ACM Conference on Computer and Communications Security,
Washington, DC, USA, November 18–22, 2002; pp. 41–47.
60. Betts, B. Smart Sensors. IEEE Spectrum Mag. 2006, 43, 50–53.
61. Akyildiz, I.; Su, W.; Sankarasubramaniam, Y.; Cayirci, E. Wireless Sensor Networks: A Survey.
Comput. Netw. 2002, 4, 393–422.
62. Kwon, D.; Azarian, M.; Pecht, M. Early Detection of Interconnect Degradation by Continuous
Monitoring of RF Impedance. IEEE Trans. Dev. Mater. Rel. 2009, 9, 296–304.
© 2010 by the authors; licensee MDPI, Basel, Switzerland. This article is an Open Access article
distributed under the terms and conditions of the Creative Commons Attribution license
(http://creativecommons.org/licenses/by/3.0/).