OPEN ACCESS Research Article Nutritional Status Evaluation ...
18
Cronicon OPEN ACCESS EC DENTAL SCIENCE EC DENTAL SCIENCE Research Article Nutritional Status Evaluation of Edentulous Patients at Pre- and Post-Insertion of Complete Denture: A Before and After Comparison Groups Study Pradeep Kumar Pandey 1 , Awadhesh Kumar Singh 2 *, Arvind Kumar Singh 3 , Ritu Mohindra 3 , Abhishek Katiyar 1 and Sudhanshu Agrawal 4 1 Assistant Professor, Department of Prosthodontics, Chandra Dental College and Hospital, Barabanki, UP, India 2 Professor, Department of Periodontology, Chandra Dental College and Hospital, Barabanki, UP, India 3 Associate Professor, Department of Prosthodontics, Chandra Dental College and Hospital, Barabanki, UP, India 4 Associate Professor, Department of Periodontology, Chandra Dental College and Hospital, Barabanki, UP, India Citation: Pradeep Kumar Pandey ., et al. “Nutritional Status Evaluation of Edentulous Patients at Pre- and Post-Insertion of Complete Denture: A Before and After Comparison Groups Study”. EC Dental Science 20.5 (2021): 105-122. *Corresponding Author: Awadhesh Kumar Singh, Professor, Department of Periodontology, Chandra Dental College and Hospital, Barabanki, UP, India. Received: March 06, 2021; Published: April 28, 2021 Abstract Aim: To evaluate the nutritional status of edentulous patients before and after insertion of complete denture (CD). Methods: 30 patients were selected to evaluate change in nutritional status of edentulous patients before insertion and 3, 6 and 12 months after CD through body mass index (BMI) and blood analysis for calcium, protein, cholesterol, high density lipoprotein (HDL) and hemoglobin (Hb). Data were summarized as mean ± SD. Student’s t-test, paired t-test, Wilcoxon signed rank statistic and bivari- ate correlation were used for statistical analysis. Statistical significance was set at p ≤ 0.05. Results: Mean blood calcium, protein, cholesterol, HDL, Hb and BMI were 8.23 ± 0.16 mg/dl, 6.87 ± 0.32 g/dl, 147.28 ± 11.40 mg/dl, 37.96 ± 1.19 mg/dl, 12.18 ± 0.44 g/dl and 19.68 ± 2.10 kg/m² at baseline; which changed to 8.37 ± 0.27, 8.57 ± 0.35 and 8.95 ± 0.35 mg/dl for calcium; 7.07 ± 0.35, 7.32 ± 0.39 and 7.60 ± 0.57 g/dl for protein; 150.99 ± 9.72, 158.18 ± 9.63 and 165.96 ± 9.74 mg/dl for cholesterol; 38.71 ± 1.26, 40.03 ± 1.22 and 41.45 ± 1.22 mg/dl for HDL; 12.31 ± 0.48, 12.70 ± 0.53 and 12.99 ± 0.61 g/dl for Hb; and 19.98 ± 2.11, 20.39 ± 2.07 and 20.97 ± 2.09 kg/m 2 for BMI; at 3, 6 and 12 months post-rehabilitation respectively. The change in calcium, protein, cholesterol, HDL, Hb and BMI were statistically significant (p < 0.001). Except for mild correlation between Hb and calcium and moderate correlation between calcium and protein, all other nutrients showed weak or statistically non-significant correlation. Conclusion: All nutrients were found below normal range in edentulous patients suggesting that loss of teeth has definite impact on their blood levels. There was significant improvement in all parameters when rehabilitated with CD suggesting that rehabilitation with CD may lead to increasing all parameters. Keywords: Diet; Elderly People; Food; Nutrients; Prosthetic Rehabilitation
Transcript of OPEN ACCESS Research Article Nutritional Status Evaluation ...

CroniconO P E N A C C E S S EC DENTAL SCIENCEEC DENTAL SCIENCE
Research Article
Nutritional Status Evaluation of Edentulous Patients at Pre- and Post-Insertion of Complete Denture: A Before and After Comparison Groups Study
Pradeep Kumar Pandey1, Awadhesh Kumar Singh2*, Arvind Kumar Singh3, Ritu Mohindra3, Abhishek Katiyar1 and Sudhanshu Agrawal4
1Assistant Professor, Department of Prosthodontics, Chandra Dental College and Hospital, Barabanki, UP, India2Professor, Department of Periodontology, Chandra Dental College and Hospital, Barabanki, UP, India3Associate Professor, Department of Prosthodontics, Chandra Dental College and Hospital, Barabanki, UP, India4Associate Professor, Department of Periodontology, Chandra Dental College and Hospital, Barabanki, UP, India
Citation: Pradeep Kumar Pandey ., et al. “Nutritional Status Evaluation of Edentulous Patients at Pre- and Post-Insertion of Complete Denture: A Before and After Comparison Groups Study”. EC Dental Science 20.5 (2021): 105-122.
*Corresponding Author: Awadhesh Kumar Singh, Professor, Department of Periodontology, Chandra Dental College and Hospital, Barabanki, UP, India.
Received: March 06, 2021; Published: April 28, 2021
Abstract
Aim: To evaluate the nutritional status of edentulous patients before and after insertion of complete denture (CD).
Methods: 30 patients were selected to evaluate change in nutritional status of edentulous patients before insertion and 3, 6 and 12 months after CD through body mass index (BMI) and blood analysis for calcium, protein, cholesterol, high density lipoprotein (HDL) and hemoglobin (Hb). Data were summarized as mean ± SD. Student’s t-test, paired t-test, Wilcoxon signed rank statistic and bivari-ate correlation were used for statistical analysis. Statistical significance was set at p ≤ 0.05.
Results: Mean blood calcium, protein, cholesterol, HDL, Hb and BMI were 8.23 ± 0.16 mg/dl, 6.87 ± 0.32 g/dl, 147.28 ± 11.40 mg/dl, 37.96 ± 1.19 mg/dl, 12.18 ± 0.44 g/dl and 19.68 ± 2.10 kg/m² at baseline; which changed to 8.37 ± 0.27, 8.57 ± 0.35 and 8.95 ± 0.35 mg/dl for calcium; 7.07 ± 0.35, 7.32 ± 0.39 and 7.60 ± 0.57 g/dl for protein; 150.99 ± 9.72, 158.18 ± 9.63 and 165.96 ± 9.74 mg/dl for cholesterol; 38.71 ± 1.26, 40.03 ± 1.22 and 41.45 ± 1.22 mg/dl for HDL; 12.31 ± 0.48, 12.70 ± 0.53 and 12.99 ± 0.61 g/dl for Hb; and 19.98 ± 2.11, 20.39 ± 2.07 and 20.97 ± 2.09 kg/m2 for BMI; at 3, 6 and 12 months post-rehabilitation respectively. The change in calcium, protein, cholesterol, HDL, Hb and BMI were statistically significant (p < 0.001).
Except for mild correlation between Hb and calcium and moderate correlation between calcium and protein, all other nutrients showed weak or statistically non-significant correlation.
Conclusion: All nutrients were found below normal range in edentulous patients suggesting that loss of teeth has definite impact on their blood levels. There was significant improvement in all parameters when rehabilitated with CD suggesting that rehabilitation with CD may lead to increasing all parameters.
Keywords: Diet; Elderly People; Food; Nutrients; Prosthetic Rehabilitation

Citation: Pradeep Kumar Pandey ., et al. “Nutritional Status Evaluation of Edentulous Patients at Pre- and Post-Insertion of Complete Denture: A Before and After Comparison Groups Study”. EC Dental Science 20.5 (2021): 105-122.
Figure 1: ESR vial.
Nutritional Status Evaluation of Edentulous Patients at Pre- and Post-Insertion of Complete Denture: A Before and After Comparison Groups Study
106
Introduction
Improving health by restoring oral function is one of the goals in rehabilitating edentulous patients. Denture wearers have lower mas-ticatory performance compared to the dentate subjects. Decreased masticatory performance may restrict the selection of food which is difficult to chew [1].
The old age patients require more demand of health care. Old people have more chances of attached by disease because they become weak and careless about self careness [2]. During last decades, research and interest related to public are on top which are associated with nutrition for maintenance, management, treatment and rehabilitation of old aged people health, conditions, illness and functional limitations [2-5]. Health promotional approaches for old aged population are healthy eating and exercise. Lack of healthy eating led to loss of muscle mass, loss of function; and initiation and progression of disease in old persons [6]. The factors which influenced nutritional status are medical, dental, psychological and social well-being. Motivation to healthy nutrition and exercise is costly for decreasing initia-tion and progression of old age related disease [4,7]. In old age, proper/healthy nutrition maintain health, physical activity, psychological and social well-being [8-10].
It has been studied that individuals who have had partial or complete loss of natural teeth have poor masticatory function when com-pared to individuals who have a complete healthy natural dentition. This does not allow old age people to eat various types of food which results into hamperness of nutritional status. The extent to which the dental status is associated with the intake of nutritious foods has been little studied despite the edentulous reporting chewing problems [11-15].
Aim of the Study
This study aimed to evaluate the effect of edentulousness and prosthetic rehabilitation on the nutritional status of patients, to deter-mine whether loss of teeth was associated with reduced levels of blood calcium, protein, cholesterol, HDL, Hb and BMI status and whether the rehabilitation with CD lead to an improvement in the blood calcium, protein, cholesterol, HDL, Hb and BMI status.
Materials and Methods
30 patients were selected from the outdoor patient department of Prosthodontics, Chandra Dental College and Hospital, Barabanki, Uttar Pradesh, India after a proper clinical examination and diagnosis. Inform consent was taken from all patients. Criteria for selection were that patients should completely edentulous, free from any local, systemic or debilitating disease and not under any medication; first time denture wearers; and belonged to the same socio economic-condition.
Equipment used for analysis were ESR vial (Ajosha Bio Teknik Pvt. Ltd, Mumbai, Maharastra, India) for collection of blood sample for Hb estimation (Figure 1), Plain vial (Ajosha Bio Teknik Pvt. Ltd, Mumbai, Maharastra, India) for collection of blood sample for calcium, protein, cholesterol and HDL estimation (Figure 2), VITROS 250 machine (Przezmierowo, Poland) for estimation of blood calcium and protein (Figure 3), Photoelectric colorimeter (CLONE BIO SYSTEM PVT LTD, India) for estimation of blood Hb (Figure 4).

Citation: Pradeep Kumar Pandey ., et al. “Nutritional Status Evaluation of Edentulous Patients at Pre- and Post-Insertion of Complete Denture: A Before and After Comparison Groups Study”. EC Dental Science 20.5 (2021): 105-122.
Figure 2: Plain vial.
Figure 3: VITROS 250 machine.
107
Nutritional Status Evaluation of Edentulous Patients at Pre- and Post-Insertion of Complete Denture: A Before and After Comparison Groups Study

Citation: Pradeep Kumar Pandey ., et al. “Nutritional Status Evaluation of Edentulous Patients at Pre- and Post-Insertion of Complete Denture: A Before and After Comparison Groups Study”. EC Dental Science 20.5 (2021): 105-122.
108
Nutritional Status Evaluation of Edentulous Patients at Pre- and Post-Insertion of Complete Denture: A Before and After Comparison Groups Study
Spectrophotometry is the method for measurement of reflection density of colored complex after incubation period. The calcium con-centration in the sample is proportional to the amount of colored complex formed.
Methodology
BMI evaluated by the formula: BMI= (Body weight/ Body height x Body height) x 10000 kg/cm2.
Biochemical analyses for blood calcium, protein, cholesterol, HDL; and hematological investigation for blood Hb levels were carried out before insertion and after 3, 6 and 12 months insertion of CD.
Measurement of serum calcium
The method used for measurement of serum calcium is the VITROS Ca slide method which is done with the help of vitros Ca slides and the vitros chemistry products calibrator kit 1 on vitros chemistry systems.
One drop of the patient sample is placed on the slide and is equally distributed by the spreading layer by layers. The calcium which is bound to protein, become separated and penetrated into the reagent layer. There is shift in the absorption maximum because arsenazo 3 dye forms a complex with calcium. Reagent (reactive ingredients per cm2) used was arsenazo 3 dye 60 microgram; and other ingredients were pigment, binders, surfactants, buffer, cross linking agent and mordant.
Test type and conditions
Figure 4: Colourimeter.
Test type VITROS system Approx incubation time
Temperature Wavelength Sample drop volume
Colorimetric 5, 1 FS, 950, 750, 550, 250 5 min 37deg C 680 nm 10

Citation: Pradeep Kumar Pandey ., et al. “Nutritional Status Evaluation of Edentulous Patients at Pre- and Post-Insertion of Complete Denture: A Before and After Comparison Groups Study”. EC Dental Science 20.5 (2021): 105-122.
109
Nutritional Status Evaluation of Edentulous Patients at Pre- and Post-Insertion of Complete Denture: A Before and After Comparison Groups Study
Measurement of total protein
The VITROS TP (total protein) slide is a multilayered slide in which analytical element coated on a polyester base. The method of analy-sis is based on the biuret reaction which produces a violet complex when protein reacts with cupric ion in an alkaline medium.
One drop of the patient sample is placed on the slide and is equally distributed by the spreading layer by layers. Reagent reacts with protein when fluid penetrates reagent layer and reagent diffuses upto the spreading layer. The reaction between protein and copper tartrate takes place largely in the spreading layer where the protein is confirmed because of its high molecular weight. The amount total protein present in the sample is measured by reflectance spectrophotometry which is proportional to the amount of colored complex formed. Reagents (reactive ingredients per cm2) used were copper sulfate 0.9 mg, tartaric acid 1.2 mg, lithium hydroxide 1.3 mg and other ingredients were polymer beads, binders, and surfactants.
Test type and conditions
Test type VITROS system Approx incubation time
Temperature Wavelength Sample drop volume
Colorimetric 5, 1FS, 950, 750, 550, 250 5 min 37 deg C 540 nm 10 mic litre
Measurement of serum cholesterol
The VITROS CHOL Slide method is done with the help of the VITROS CHOL Slides and the VITROS Chemistry Products Calibrator Kit 2 on VITROS 250/350/950/5,1 FS and 4600 Chemistry Systems and the VITROS 5600 Integrated System. The multilayered VITROS CHOL Slide contains analytical element which is coated on a polyester base. This is the enzymatic based method similar to Allain., et al. method [16]. One drop of the patient sample is placed on the slide and is equally distributed by the spreading layer by layers. The Triton X-100 (TX100) surfactant which is present in the spreading layer helps in the cholesterol and cholesterol esters dissociation from lipoprotein complexes. Cholesterol ester hydrolase catalyzed the hydrolysis of the cholesterol esters to cholesterol. In the presence of cholesterol oxidase oxidation of free cholesterol to cholestenone and hydrogen peroxide occurs. Finally, in the presence of peroxidase, colored dye is formed because hydrogen peroxide oxidizes leuco dye. The density of dye formation is proportional to the cholesterol concentration of the sample which is measured by reflectance spectrophotometry. Reagents (reactive Ingredients per cm2) used were Triton X-100 0.81 mg; cholesterol oxidase (Cellulomonas, E.C.1.1.3.6) 0.4 U; cholesterol ester hydrolase (Pseudomonas, E.C.3.1.1.13) 2.0 U; peroxidase (horserad-ish root, E.C.1.11.1.7) 5.3 U; and 2-(3,5-dimethoxy- 4- hydroxyphenyl)-4, 5-bis-(4-dimethylaminophenyl) imidazole (leuco dye) 0.17 mg; and other ingredients taken were pigment, binder, buffer, surfactants, stabilizers and cross-linking agent.
Test type and conditions
Test type VITROS system Approx incubation time
Temperature Wavelength Sample drop volume
Colorimetric 5600, 4600, 5,1 FS, 950, 250/350 5min. 37 °C (98.6 °F) 540 nm 5.5 µL
Measurement of HDL
The VITROS dHDL Slide method is done with the help of the VITROS dHDL Slides and the VITROS Chemistry Products Calibrator Kit 25 on VITROS 250/350/950/5,1 FS and 4600 Chemistry Systems and the VITROS 5600 Integrated System. The multilayered VITROS

Citation: Pradeep Kumar Pandey ., et al. “Nutritional Status Evaluation of Edentulous Patients at Pre- and Post-Insertion of Complete Denture: A Before and After Comparison Groups Study”. EC Dental Science 20.5 (2021): 105-122.
110
Nutritional Status Evaluation of Edentulous Patients at Pre- and Post-Insertion of Complete Denture: A Before and After Comparison Groups Study
dHDL Slide contains analytical element which is coated on a polyester base. The method is non-HDL precipitation method which is similar to Burstein., et al. method [17], followed by enzymatic detection similar to Allain., et al. method [16]. One drop of the patient sample is placed on the slide and is equally distributed by the spreading layer by layers. In the spreading layer, precipitation of non-High Density Lipoproteins (non-HDL) occurs with the help of phosphotungstic acid and magnesium chloride as a result HDL becomes separated. The Emulgen B-66 surfactant which is present in the spreading layer helps in the cholesterol and cholesterol esters dissociation from the HDL lipoprotein complexes. Cholesterol ester hydrolase catalyzed the hydrolysis of the HDL-derived cholesterol ester to cholesterol. In the presence of cholesterol oxidase oxidation of free cholesterol to cholestenone and hydrogen peroxide occurs. Finally, in the presence of peroxidase, colored dye is formed because hydrogen peroxide oxidizes leuco dye. The density of dye formation is proportional to the cho-lesterol concentration of the sample which is measured by reflectance spectrophotometry. Reagents (reactive ingredients per cm2) used were emulgen B-66 0.7 mg; phosphotungstic acid (PTA) 0.3 mg; magnesium chloride (MgCl2) 0.2 mg, cholesterol oxidase (Cellulomonas, E.C.1.1.3.6) 0.8 U; cholesterol ester hydrolase (Candida rugosa, E.C.3.1.1.3) 1.2 U; peroxidase (horseradish root, E.C.1.11.1.7) 2.2 U; and 2- (3,5-dimethoxy-4-hydroxyphenyl)-4,5-bis-(4- dimethylaminophenyl) imidazole (leuco dye) 0.02 mg; and other ingredients taken were pigment, binders, buffer, surfactants, stabilizers, scavenger, and cross-linking agent.
Test type and conditions
Test Type Vitros System Approximate incubation time
Temperature Wavelength Reaction sample volume
Colorimetric 5600, 4600, 5,1 FS, 950, 250/350 5 minutes 37°C (98.6°F) 670 nm 6 µL
Hb estimation
Standard operating procedure: Hb is a conjugated protein present in the RBC and is responsible for the oxygen and carbon dioxide transportation. Materials required to perform the test were photoelectric colorimeter or spectrophotometers, pipette (Hb pipette .02 ml, 5 ml graduated pipette), test tubes and drabkins solution.
Statistical analysis
The statistical analysis was done with the help of Statistical Package for Social Sciences software windows version 17.0 (SPSS Inc., Chicago, Illinois, USA). The values were represented in Number (%) and Mean ± SD. Student’s t-test, paired t-test, Wilcoxon signed rank statistic and bivariate correlation were used for statistical analysis. Statistical significance was set at p ≤ 0.05.
Results
At enrolment, ages of patients were 43 years to 77 years with average age of 58.7 ± 8.79 years. A total of 16 (53.3%) patients were aged < 60 years while remaining 14 (46.7%) were aged > 60 years (Table 1 and graph 1). All the patients participated in the study were males. The period of edentulous status ranged from 4 months to 12 months with average of 6.83 ± 2.00 months. S. calcium, S. protein, S. Cholesterol, S. HDL and mean Hb, values were 8.23 ± 0.16 mg/dl, 6.87 ± 0.32 g/dl, 142.3 ± 11.4 mg/dl, 37.96 ± 1.19 mg/dl and 12.18 ± 0.44 g/dl respectively. On evaluating nutritional status in terms of BMI, the BMI of patients ranged from 15.89 to 23.84 kg/m2 with a mean value of 19.68 ± 2.10 kg/m2. 23 patients were in normal weight category (76.7%) and 7 patients were underweight (23.3%) (Table 1).

Citation: Pradeep Kumar Pandey ., et al. “Nutritional Status Evaluation of Edentulous Patients at Pre- and Post-Insertion of Complete Denture: A Before and After Comparison Groups Study”. EC Dental Science 20.5 (2021): 105-122.
111
Nutritional Status Evaluation of Edentulous Patients at Pre- and Post-Insertion of Complete Denture: A Before and After Comparison Groups Study
SN Characteristic Statistic1. Age
≤ 60 Years 16 (53.3%)> 60 Years 14 (46.7%)
Mean Age ± SD (Range) in years 58.7 ± 8.79 (43 - 77)2. Gender
Male 30 (100%)3. Duration since edentulous
≤ 6 months 14 (46.7%)7-12 months 16 (53.3%)
Mean duration ± SD (Range) in months 6.83 ± 2.00 (4 - 12)4. Mean S. Calcium ± SD (Range) mg/dl 8.23 ± 0.16 (8.05 - 8.56)5. Mean S. Protein ± SD (Range) g/dl 6.87 ± 0.32 (6.16 - 7.36)6. Mean S. Cholesterol ± SD (Range) mg/dl 142.3 ± 11.4 (128.9 - 161.4)7. Mean Haemoglobin ± SD (Range) g/dl 12.18 ± 0.44 (11.4 - 13.2)8. Mean S. High Density Lipoprotein ± SD (Range) mg/dl 37.96 ± 1.19 (36.18 - 39.47)9. BMI Status
Underweight (< 18.5 kg/m²) 7 (23.3%)Normal weight (18.5 - 25.0 kg/m²) 23 (76.7%)Mean BMI ± SD (Range) in kg/m² 19.68 ± 2.10 (15.89 - 23.84)
Table 1: Profile of patients enrolled in the study and baseline characteristics.
Graph 1: Evaluation of edentulousness with age.

Citation: Pradeep Kumar Pandey ., et al. “Nutritional Status Evaluation of Edentulous Patients at Pre- and Post-Insertion of Complete Denture: A Before and After Comparison Groups Study”. EC Dental Science 20.5 (2021): 105-122.
112
Nutritional Status Evaluation of Edentulous Patients at Pre- and Post-Insertion of Complete Denture: A Before and After Comparison Groups Study
Mean serum calcium level was 8.23 ± 0.16 mg/dl at baseline which changed to reach at 8.37 ± 0.27, 8.57 ± 0.35 and 8.95 ± 0.35 mg/dl respectively at 3 months, 6 months and 12 months post-rehabilitation intervals, thereby showing a % increase of 1.66, 4.20 and 8.82% respectively at the corresponding intervals. On comparing the data statistically, the change in calcium levels was significant statistically at all the time intervals (p < 0.001) (Table 2 and graph 2).
SN Time interval
Mean SD Change from Baseline ‘t’ ‘p’Mean SD % Change
1. Baseline 8.23 0.162. 3
months8.37 0.27 0.14 0.20 1.66 -3.724 0.001
3. 6 months
8.57 0.35 0.35 0.32 4.20 -5.967 < 0.001
4. 12 months
8.95 0.35 0.73 0.31 8.82 -12.616 < 0.001
Table 2: Evaluation of change in serum calcium levels at different time intervals.Paired ‘t’-test.
Graph 2: Evaluation of change in serum calcium levels at different time intervals.
Mean serum protein level was 6.87 ± 0.32 g/dl at baseline which changed to reach at 7.07 ± 0.35, 7.32 ± 0.39 and 7.60 ± 0.57 g/dl respectively at 3 months, 6 months and 12 months post-rehabilitation intervals, thereby showing a % increase of 2.94, 6.56 and 10.73% respectively at the corresponding intervals. On comparing the data statistically, the change in protein levels was significant statistically at all the time intervals (p < 0.001) (Table 3 and graph 3).

Citation: Pradeep Kumar Pandey ., et al. “Nutritional Status Evaluation of Edentulous Patients at Pre- and Post-Insertion of Complete Denture: A Before and After Comparison Groups Study”. EC Dental Science 20.5 (2021): 105-122.
SN Time interval
Mean SD Change from Baseline ‘t’ ‘p’Mean SD % Change
1. Baseline 147.28 11.402. 3
months150.99 9.72 3.71 2.40 2.52 -8.49 < 0.001
3. 6 months
158.18 9.63 10.90 4.49 7.40 -13.29 < 0.001
4. 12 months
165.96 9.74 18.68 5.26 12.68 -19.43 < 0.001
Table 4: Evaluation of change in serum cholesterol levels at different time intervals.Paired ‘t’-test.
113
Nutritional Status Evaluation of Edentulous Patients at Pre- and Post-Insertion of Complete Denture: A Before and After Comparison Groups Study
Mean serum cholesterol level was 147.28 ± 11.40 mg/dl at baseline which changed to reach at 150.99 ± 9.72, 158.18 ± 9.63 and 165.96 ± 9.74 mg/dl respectively at 3 months, 6 months and 12 months post-rehabilitation intervals, thereby showing a % increase of 2.52, 7.40 and 12.68% respectively at the corresponding intervals. On comparing the data statistically, the change in cholesterol levels was signifi-cant statistically at all the time intervals (p < 0.001) (Table 4 and graph 4).
SN Time interval
Mean SD Change from Baseline ‘t’ ‘p’Mean SD % Change
1. Baseline 6.87 0.322. 3
months7.07 0.35 0.20 0.13 2.94 -8.560 <
0.0013. 6
months7.32 0.39 0.45 0.22 6.56 -11.433 <
0.0014. 12
months7.60 0.57 0.74 0.43 10.73 -9.391 <
0.001
Table 3: Evaluation of change in serum protein levels at different time intervals.Paired ‘t’-test.
Graph 3: Evaluation of change in serum protein levels at different time intervals.

Citation: Pradeep Kumar Pandey ., et al. “Nutritional Status Evaluation of Edentulous Patients at Pre- and Post-Insertion of Complete Denture: A Before and After Comparison Groups Study”. EC Dental Science 20.5 (2021): 105-122.
114
Nutritional Status Evaluation of Edentulous Patients at Pre- and Post-Insertion of Complete Denture: A Before and After Comparison Groups Study
Mean serum HDL level was 37.96 ± 1.19 mg/dl at baseline which changed to reach at 38.71 ± 1.26, 40.03 ± 1.22 and 41.45 ± 1.22 mg/dl respectively at 3 months, 6 months and 12 months post-rehabilitation intervals, thereby showing a % increase of 1.99, 5.46 and 9.19% respectively at the corresponding intervals. On comparing the data statistically, the change in HDL levels was significant statistically at all the time intervals (p < 0.001) (Table 5 and graph 5).
Graph 4: Evaluation of change in serum cholesterol levels at different time intervals.
SN Time interval
Mean SD Change from Baseline ‘t’ ‘p’Mean SD % Change
1. Baseline 37.96 1.192. 3 months 38.71 1.26 0.75 0.44 1.99 -9.3 < 0.0013. 6 months 40.03 1.22 2.07 0.60 5.46 -18.96 < 0.0014. 12 months 41.45 1.57 3.49 1.27 9.19 -15.03 < 0.001
Table 5: Evaluation of change in serum HDL levels at different time intervals.Paired ‘t’-test.
Graph 5: Evaluation of change in serum HDL levels at different time intervals.

Citation: Pradeep Kumar Pandey ., et al. “Nutritional Status Evaluation of Edentulous Patients at Pre- and Post-Insertion of Complete Denture: A Before and After Comparison Groups Study”. EC Dental Science 20.5 (2021): 105-122.
115
Nutritional Status Evaluation of Edentulous Patients at Pre- and Post-Insertion of Complete Denture: A Before and After Comparison Groups Study
Mean Hb level was 12.18 ± 0.44 g/dl at baseline which changed to reach at 12.31 ± 0.48, 12.70 ± 0.53 and 12.99 ± 0.61 g/dl respectively at 3 months, 6 months and 12 months post-rehabilitation intervals, thereby showing a % increase of 1.06, 4.27 and 6.66% respectively at the corresponding intervals. On comparing the data statistically, the change in Hb levels was significant statistically at all the time inter-vals (p < 0.001) (Table 6 and graph 6).
SN Time inter-val
Mean SD Change from Baseline ‘t’ ‘p’Mean SD % Change
1. Baseline 12.18 0.442. 3 months 12.31 0.48 0.13 0.12 1.06 -5.682 < 0.0013. 6 months 12.70 0.53 0.52 0.29 4.27 -9.954 < 0.0014. 12 months 12.99 0.61 0.81 0.41 6.66 -10.865 < 0.001
Table 6: Evaluation of change in haemoglobin status at different time intervals.Paired ‘t’-test.
Graph 6: Evaluation of change in haemoglobin status at different time intervals.
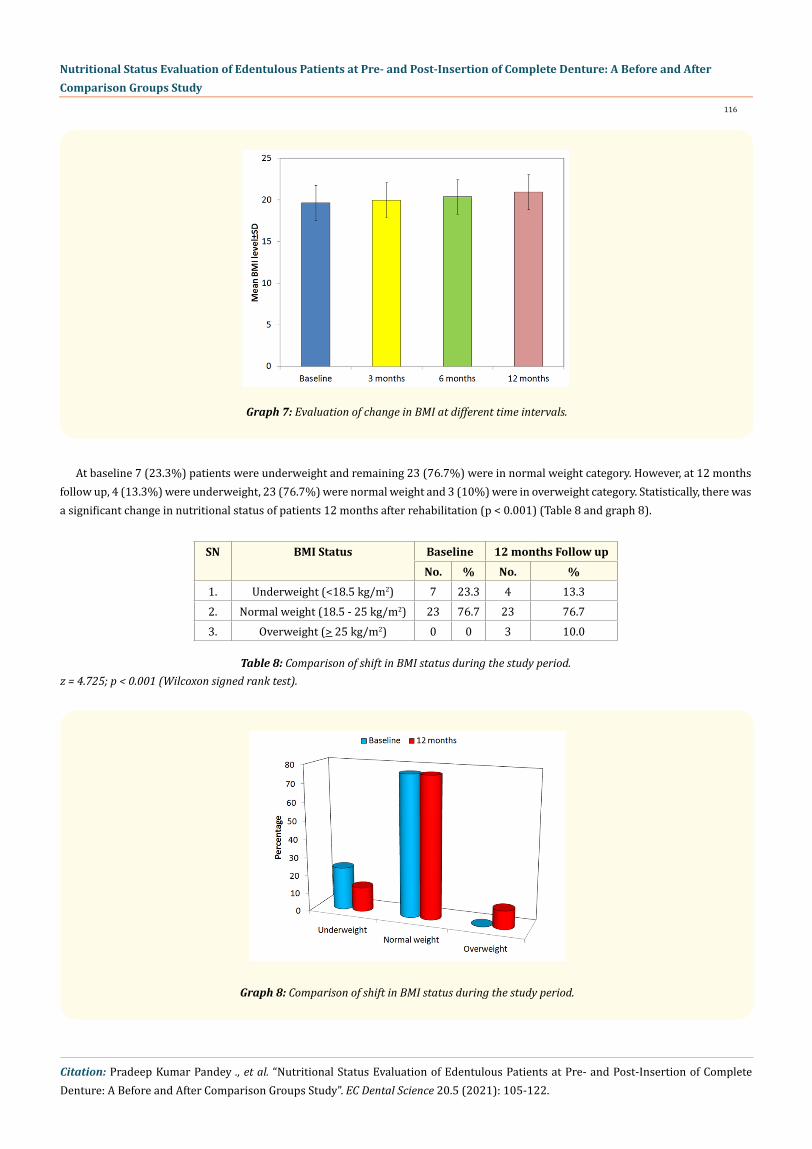
Mean body mass index was 19.68 ± 2.10 kg/m2 at baseline which changed to reach at 19.98 ± 2.11, 20.39 ± 2.07 and 20.97 ± 2.09 kg/m2 respectively at 3 months, 6 months and 12 months post-rehabilitation intervals, thereby showing a % increase of 1.52, 3.62 and 6.57% respectively at the corresponding intervals. On comparing the data statistically, the change in BMI was significant statistically at all the time intervals (p < 0.001) (Table 7 and graph 7).
SN Time interval Mean SD Change from Baseline ‘t’ ‘p’Mean SD % Change
1. Baseline 19.68 2.102. 3 months 19.98 2.11 0.30 0.22 1.52 -7.50 < 0.0013. 6 months 20.39 2.07 0.71 0.26 3.62 -14.95 < 0.0014. 12 months 20.97 2.09 1.29 0.44 6.57 -16.11 < 0.001
Table 7: Evaluation of change in BMI at different time intervals.
Paired ‘t’-test.
Citation: Pradeep Kumar Pandey ., et al. “Nutritional Status Evaluation of Edentulous Patients at Pre- and Post-Insertion of Complete Denture: A Before and After Comparison Groups Study”. EC Dental Science 20.5 (2021): 105-122.
116
Nutritional Status Evaluation of Edentulous Patients at Pre- and Post-Insertion of Complete Denture: A Before and After Comparison Groups Study
At baseline 7 (23.3%) patients were underweight and remaining 23 (76.7%) were in normal weight category. However, at 12 months follow up, 4 (13.3%) were underweight, 23 (76.7%) were normal weight and 3 (10%) were in overweight category. Statistically, there was a significant change in nutritional status of patients 12 months after rehabilitation (p < 0.001) (Table 8 and graph 8).
Graph 7: Evaluation of change in BMI at different time intervals.
SN BMI Status Baseline 12 months Follow upNo. % No. %
1. Underweight (<18.5 kg/m2) 7 23.3 4 13.32. Normal weight (18.5 - 25 kg/m2) 23 76.7 23 76.73. Overweight (> 25 kg/m2) 0 0 3 10.0
Table 8: Comparison of shift in BMI status during the study period.z = 4.725; p < 0.001 (Wilcoxon signed rank test).
Graph 8: Comparison of shift in BMI status during the study period.

Citation: Pradeep Kumar Pandey ., et al. “Nutritional Status Evaluation of Edentulous Patients at Pre- and Post-Insertion of Complete Denture: A Before and After Comparison Groups Study”. EC Dental Science 20.5 (2021): 105-122.
117
Nutritional Status Evaluation of Edentulous Patients at Pre- and Post-Insertion of Complete Denture: A Before and After Comparison Groups Study
Except for a mild correlation between Hb and serum calcium; and a moderate correlation present between serum Calcium and serum Protein, all the other nutrients showed a weak or statistically non-significant correlation (Table 9 and graph 9).
S. Ca S. Protein S. Cholesterol S. HDL BMIr’ p’ r’ p’ r’ p’ r’ p’ r’ p’
Hb 0.440 0.218 0.246 -0.037 0.844 0.083 0.665 0.037 0.846S. Ca 0.506 0.004 -0.173 0.361 -0.285 0.127 -0.101 0.595
S. Protein -0.210 0.266 -0.077 0.685 -0.071 0.711S. Cholesterol -0.314 0.091 0.014 0.943
S.HDL 0.112 0.556
Table 9: Correlation of % change in different nutritional status markers at 12 months. Pearson Correlation Coefficient.
Graph 9: Correlation of % change in different nutritional status markers at 12 months.

Citation: Pradeep Kumar Pandey ., et al. “Nutritional Status Evaluation of Edentulous Patients at Pre- and Post-Insertion of Complete Denture: A Before and After Comparison Groups Study”. EC Dental Science 20.5 (2021): 105-122.
118
Nutritional Status Evaluation of Edentulous Patients at Pre- and Post-Insertion of Complete Denture: A Before and After Comparison Groups Study
For all the parameters, the mean percentage change was higher among those aged <60 years as compared to those aged > 60 years, however, the difference was not significant statistically (Table 10 and graph 10).
SN Nutritional status marker
Age ≤60 Years (n = 16)
Age >60 Years (n = 14)
‘t’ ‘p’
Mean SD Mean SD1. S. Hb 6.76 3.14 6.54 3.61 0.179 0.8592. S. Ca 8.95 4.70 8.67 2.67 0.199 0.8443. S. Pr 11.05 7.69 10.31 3.28 0.333 0.7424. S. Cholesterol 13.60 4.74 12.11 3.78 0.939 0.3565. S. HDL 9.44 3.34 8.97 3.58 0.373 0.7126. BMI 7.36 2.72 5.93 2.23 1.557 0.131
Table 10: Association between age and % change in different nutrients at 12 months.
Graph 10: Association between age and % change in different nutrients and BMI at 12 months.
% BMI change in those with 7 - 12 months of edentulous status was significantly higher as compared to those with < 6 months of eden-tulous status (p = 0.002). For other nutritional status markers, the association was not significant statistically (Table 11 and graph 11).

Citation: Pradeep Kumar Pandey ., et al. “Nutritional Status Evaluation of Edentulous Patients at Pre- and Post-Insertion of Complete Denture: A Before and After Comparison Groups Study”. EC Dental Science 20.5 (2021): 105-122.
119
Nutritional Status Evaluation of Edentulous Patients at Pre- and Post-Insertion of Complete Denture: A Before and After Comparison Groups Study
SN Nutritional status marker
≤ 6 months (n = 14) 7 - 12 months (n = 16) ‘t’ ‘p’Mean SD Mean SD
1. S. Hb 5.89 3.69 7.33 2.89 -1.194 0.2422. S. Ca 8.03 2.37 9.51 4.73 -1.057 0.3003. S. Pr 9.75 3.54 11.55 7.51 -0.820 0.4194. S. Cholesterol 13.14 5.48 12.69 3.15 0.279 0.7825. S. HDL 9.56 3.55 8.93 3.35 0.496 0.6246. BMI 5.22 0.84 7.97 2.89 -3.432 0.002
Table 11: Association between duration since edentulous and % change in different nutrients at 12 months.
Graph 11: Association between duration since edentulous and % change in different nutrients and BMI at 12 months.
Discussion
Denture wearers consumed vegetables, whole meal bread and dietary fiber less often than those who had some natural teeth [18-22]. Tooth loss causes decreased chewing capability, hence, patients avoid hard foods including vegetables and non-vegetables, as a result their diet quality and nutritional status become poor. Some researchers, who focus on changes in eating habits and food selection, found that edentulous people consume softer food compared to dentate people [21-23]. The above and many more studies indicate that indi-viduals with natural healthy dentition consumed a wider variety of nutritious food than those with partial or total loss of teeth and it can be assumed that these subjects have an overall better nutritional status than those with missing natural teeth.
There is direct relationship between tooth and food intake because teeth are responsible for shear, tear, mastication and mixing of food with saliva; which are affected by tooth loss. There is limitation of dietary intake which affects dietary diversity of patients. This limitation

Citation: Pradeep Kumar Pandey ., et al. “Nutritional Status Evaluation of Edentulous Patients at Pre- and Post-Insertion of Complete Denture: A Before and After Comparison Groups Study”. EC Dental Science 20.5 (2021): 105-122.
120
Nutritional Status Evaluation of Edentulous Patients at Pre- and Post-Insertion of Complete Denture: A Before and After Comparison Groups Study
of intake of all types of foods as carbohydrate, protein, fat, vitamins and fibers are adversely affected which results into dietary intake imbalance [24,25].
In denture bearers, nutritional status varies greatly among them. According to Albert Yurkstas some foods must be chewed so as swallowing become comfortable [26]. Joshipura KJ., et al. found that patients with more teeth in their mouth tend to consume more hard-to-chew foods [21]. If we accept that patients with significant tooth loss eat less fruits, vegetables and non-vegetables than fully dentate people, then we face another question whether this difference in vegetables and non-vegetables diets places edentulous patients at higher risk of malnutrition.
This question was addressed in Great Britain by Sheiham with the help of findings of the National Diet and Nutrition Survey (NDNS) [27]. The author found that independently and institutions living old people have notorious impact on their intake of essential nutrients. The protocol consists of dental examination, 4-day weighted diet diaries, blood and urine samples to determine selected nutrients levels expected to be affected by the changes in food intake due to edentulism. The effects of confounding factors as gender, age and many socio-economically variables on the association between dental status and nutrition levels were taken into consideration during data analysis. In independent living people intake of various nutrients such as vitamins, proteins, fibers, minerals and galactose sugar were higher in dentate compared to edentulous people. The average nutrients intakes as well as total energy intake were increased with number of teeth in dentate people. This finding showed a dose–response effect and a cause-and-effect relationship between number of teeth present and nutritional status. The authors stated that as a general, dentate people have greater amount of nutrients intake [28-30]. At the present time, it is well known that impairment of physical activity is due to poor oral health in old aged persons. Krall and others found that there is inverse relationship between natural dentition impairment and intake of food. As impairment of natural dentition increased, intake of food dropped off [22].
At insertion, the mean and standard deviation showed a lower than normal blood level for calcium, protein, cholesterol, HDL and Hb. As previously described the foods rich in calcium, protein, cholesterol, HDL and Hb are all tough foods which are difficult to chew and are directly related to the masticatory ability. The masticatory ability of completely edentulous patients is impaired which renders them incapable to eat a variety of foods and leading to malnutrition and affects the general health [14,24] and this further showed an increase in all five nutrients at the insertion of 3, 6 and 12 months. This may be directly related to the increased masticatory efficiency and the ability to eat a variety of foods that include all these essential nutrients.
The results showed that there was a continuous increase at successive time periods for all five nutrients and it is directly related to the increased masticatory efficiency and also to the ability to eat a variety of foods and even tough foods which are rich in calcium, protein, cholesterol, HDL and Hb apart from the soft foods containing carbohydrates which are essentially rich only in glucose.
The correlation of percentage change in different nutritional status markers at 12 months, except for mild correlation between Hb and serum Calcium and there was a moderate correlation present between serum Calcium and serum Protein; a weak or statistically non-sig-nificant correlation was present between all other nutrients. The improvement of these two nutrients in blood after acquiring complete dentures can be attributed to the fact that these patients can now eat a variety of foods that include tough foods such as vegetables, meat, cereals which are rich in both protein and calcium. Also due to better chewing efficiency food may be pulverized into smaller particles enhancing the absorption.
Conclusion
The blood calcium, cholesterol, HDL, protein and Hb levels were found to be below the normal range in completely edentulous patients without any prosthetic rehabilitation suggesting that loss of teeth has a definite impact on the levels of these essential nutrients in blood.

Citation: Pradeep Kumar Pandey ., et al. “Nutritional Status Evaluation of Edentulous Patients at Pre- and Post-Insertion of Complete Denture: A Before and After Comparison Groups Study”. EC Dental Science 20.5 (2021): 105-122.
121
Nutritional Status Evaluation of Edentulous Patients at Pre- and Post-Insertion of Complete Denture: A Before and After Comparison Groups Study
There was a significant improvement in the blood calcium, cholesterol, HDL, protein and Hb levels and BMI index when rehabilitated with CD at the end of 3, 6 and 12 months post-insertion suggesting that rehabilitation with CD may lead to an increased level of blood calcium and protein. There was mild correlation between Hb and S. calcium and a moderate correlation between S. Calcium and S. Protein, all the other nutrients showed a weak or statistically non-significant correlation.
The above study was conducted with a few parameters and further studies need to be directed towards evaluating the significance of parameters like the type of diet, sex, community and occupation. Other parameter that could be taken into consideration is whether the patients had worn a removable partial denture during the state of partial edentulousness. Also, this study had a follow up period of 12 months and further longitudinal studies can be conducted.
Bibliography
1. Shinkai RSA., et al. “Dietary intake in edentulous subjects with good and poor quality complete dentures”. Journal of Prosthetic Den-tistry 89 (2002): 490-498.
2. Fried LP., et al. “Untangling the concepts of disability, frailty, and comorbidity: implications for improved targeting and care”. The Journals of Gerontology. Series A, Biological Sciences and Medical Sciences 59 (2004): 255-256.
3. Nagi SZ. “An epidemiology of disability among adults in the United States”. Milbank Memorial Fund Quarterly Health and Society 54 (1976): 439-467.
4. Fiatarone MA., et al. “Exercise training and nutritional supplementation for physical frailty in very elderly people”. The New England Journal of Medicine 330 (1994): 1769-1775.
5. Vellas B., et al. “Overview of the MNA – Its history and challenges”. The Journal of Nutrition, Health and Aging 10 (2006): 456-465.
6. Morley JE. “Anorexia, sarcopenia, and aging”. Nutrition 17 (2001): 660-663.
7. Morley JE. “Decreased food intake with aging”. The Journals of Gerontology. Series A, Biological Sciences and Medical Sciences 56 (2001): 81-88.
8. Bates CJ., et al. “Nutrition and Aging: A Consensus Statement”. The Journal of Nutrition, Health and Aging 6 (2002): 103-116.
9. Nijs KA., et al. “Effect of family style mealtimes on quality of life, physical performance, and body weight of nursing home residents: cluster randomised controlled trial”. British Medical Journal 332 (2006): 1180-1184.
10. Nijs KA., et al. “Effect of family-style meals on energy intake and risk of malnutrition in dutch nursing home residents: a randomized controlled trial”. The Journals of Gerontology. Series A, Biological Sciences and Medical Sciences 61 (2006): 935-942.
11. Smith JM., and Sheiham A. “Dental treatment needs and demands of an elderly population in England”. Community Dentistry and Oral Epidemiology 8 (1980): 360-364.
12. Locker D. “The burden of oral disorders in a population of older adults”. Community Dental Health Journal: CDH 9 (1992): 109-124.
13. Slade GD., et al. “Variations in the social impact of oral conditions among older adults in South Australia, Ontario, and North Carolina”. Journal of Dental Research 75 (1996): 1439-1450.
14. Ettinger RL. “Changing dietary patterns with changing dentition: how do people cope?”. Special Care in Dentistry 18 (1998): 33-39.

Citation: Pradeep Kumar Pandey ., et al. “Nutritional Status Evaluation of Edentulous Patients at Pre- and Post-Insertion of Complete Denture: A Before and After Comparison Groups Study”. EC Dental Science 20.5 (2021): 105-122.
122
Nutritional Status Evaluation of Edentulous Patients at Pre- and Post-Insertion of Complete Denture: A Before and After Comparison Groups Study
Volume 20 Issue 5 May 2021© All rights reserved by Awadhesh Kumar Singh., et al.
15. Sheiham A., et al. “The impact of oral health on stated ability to eat certain food; findings from the National Diet and Nutrition Survey of Older People in Great Britain”. Gerodontology 16 (1999): 11-20.
16. Allain CC., et al. “Enzymatic determination of total serum cholesterol”. Clinical Chemistr 20 (1974): 470-475.
17. Burstein M., et al. “Rapid method for the isolation of lipoproteins from human serum by precipitation with polyanions”. Journal of Lipid Research 11 (1970): 583-595.
18. Halling A., et al. “Diet in relation to number of remaining teeth in a population of middle-aged women in Gothenburg, Sweden”. Swed-ish Dental Journal 12 (1988): 39-45.
19. Moynihan PJ., et al. “Intake of non-starch polysaccharide (dietary fibre) in edentulous and dentate persons: an observational study”. The British Dental Journal 177 (1994): 243-247.
20. Joshipura KJ., et al. “The impact of edentulousness on food and nutrient intake”. Journal of the American Dental Association 127 (1996): 459-467.
21. Johansson I., et al. “Dental status, diet and cardiovascular risk factors in middle-aged people in northern Sweden”. Community Den-tistry and Oral Epidemiology 22 (1994): 431-436.
22. Krall E., et al. “How dentition status and masticatory function affect nutrient intake”. Journal of the American Dental Association 129 (1998): 1261-1269.
23. Walls AW., and Steele JG. “The relationship between oral health and nutrition in older people”. Mechanisms of Ageing and Development 125 (2004): 853-857.
24. Allen F., and McMillen A. “Food selection and perceptions of chewing ability following provision of implant and conventional prosthe-ses in complete denture wearers”. Clinical Oral Implants Research 13 (2002): 320-326.
25. Tajbakhsh S1., et al. “Selection pattern of dietary foods in edentulous participents rehabilitated with maxillary complete dentures opposed by mandibular implant-supported prostheses: a multicenter longitudinal assessment”. Journal of Prosthetic Dentistry 110 (2013): 252-258.
26. Yurkstas A. “The Masticatory Act, A review”. Journal of Prosthetic Dentistry 15 (1965): 248-253.
27. Sheiham A., et al. “The relationship among dental status, nutrient intake, and nutritional status in older people”. Journal of Dental Research 80 (2001): 408-413.
28. Fontijn-Tekamp FA., et al. “The state of dentition in relation to nutrition in elderly Europeans in the SENECA study of 1993”. European Journal of Clinical Nutrition 50 (1996): S117-122.
29. Papas AS., et al. “The effects of denture status on nutrition”. Special Care in Dentistry 18 (1998): 17-25.
30. Greksa LP., et al. “The dietary adequacy of edentulous older adults”. Journal of Prosthetic Dentistry 73 (1995): 142-145.