A Guide to Growing Small Scale Food Gardening Projects - Food Gardening Tool Kit
A new tool for converting foodfrequency questionnaire data intonutrient and food group values: FETAresearch methods and availability
Angela A Mulligan,1 Robert N Luben,1 Amit Bhaniani,1 David J Parry-Smith,1
Laura O’Connor,2 Anthony P Khawaja,1 Nita G Forouhi,2 Kay-Tee Khaw1,3
To cite: Mulligan AA,Luben RN, Bhaniani A, et al.A new tool for convertingfood frequency questionnairedata into nutrient and foodgroup values: FETA researchmethods and availability. BMJOpen 2014;4:e004503.doi:10.1136/bmjopen-2013-004503
▸ Prepublication history andAdditional material isavailable. To view please visitthe journal (http://dx.doi.org/10.1136/bmjopen-2013-004503).
NGF and K-TK contributedequally.
Received 19 November 2013Revised 4 March 2014Accepted 5 March 2014
For numbered affiliations seeend of article.
Correspondence toA Mulligan;[email protected]
ABSTRACTObjectives: To describe the research methods for thedevelopment of a new open source, cross-platform toolwhich processes data from the European ProspectiveInvestigation into Cancer and Nutrition Norfolk FoodFrequency Questionnaire (EPIC-Norfolk FFQ). A furtheraim was to compare nutrient and food group valuesderived from the current tool (FETA, FFQ EPIC Tool forAnalysis) with the previously validated but lessaccessible tool, CAFÉ (Compositional Analyses fromFrequency Estimates). The effect of text matching onintake data was also investigated.Design: Cross-sectional analysis of a prospectivecohort study—EPIC-Norfolk.Setting: East England population (city of Norwich andits surrounding small towns and rural areas).Participants: Complete FFQ data from 11 250 men and13 602 women (mean age 59 years; range 40–79 years).Outcome measures: Nutrient and food group intakesderived from FETA and CAFÉ analyses of EPIC-NorfolkFFQ data.Results: Nutrient outputs from FETA and CAFÉ weresimilar; mean (SD) energy intake from FETA was 9222 kJ(2633) in men, 8113 kJ (2296) in women, comparedwith CAFÉ intakes of 9175 kJ (2630) in men, 8091 kJ(2298) in women. The majority of differences resulted inone or less quintile change (98.7%). Only mean dailyfruit and vegetable food group intakes were higher inwomen than in men (278 vs 212 and 284 vs 255 g,respectively). Quintile changes were evident for allnutrients, with the exception of alcohol, when textmatching was not executed; however, only the cerealsfood group was affected.Conclusions: FETA produces similar nutrient and foodgroup values to the previously validated CAFÉ but has theadvantages of being open source, cross-platform andcomplete with a data-entry form directly compatible withthe software. The tool will facilitate research using theEPIC-Norfolk FFQ, and can be customised for differentstudy populations.
INTRODUCTIONFood Frequency Questionnaires (FFQs) arecommonly used in epidemiological studies to
assess the dietary intake of large populations.Their popularity derives from ease of admin-istration, ability to assess dietary intake over adefined period of time and low costs.1 TheEuropean Prospective Investigation intoCancer and Nutrition (EPIC)-Norfolk FFQ issemiquantitative and designed to record theaverage intake of foods during the previousyear. The principles involved in data collec-tion and processing of the EPIC-Norfolk FFQand the development of the structure andcontent of the CAFÉ (Compositional Analysesfrom Frequency Estimates) programme forcalculating nutrient intakes have been pub-lished previously.2 The EPIC-Norfolk FFQ hasbeen extensively validated and has beenwidely used.3–5 However, the programmesused to process these FFQs, including CAFÉ,have not been easily accessible to end-users.Our objective was to develop a new,
open source, cross-platform processing tool(FETA—FFQ EPIC Tool for Analysis) basedon and building on the earlier system,CAFÉ.2 The aim of this report was todescribe the research methods of the devel-opment of FETA, and to compare nutrientoutput from the FETA and CAFÉ
Strengths and limitations of this study
▪ FETA (Food Frequency Questionnaire EuropeanProspective Investigation into Cancer andNutrition Tool for Analysis) has been testedusing a large study sample of food intake data.
▪ No independent reference method used in thecomparisons of FETA and CAFÉ (CompositionalAnalyses from Frequency Estimates) nutrientintake data although the CAFÉ system has beenpreviously validated.
▪ Ability to modify the underlying data files inFETA to customise it for different studypopulations.
Mulligan AA, Luben RN, Bhaniani A, et al. BMJ Open 2014;4:e004503. doi:10.1136/bmjopen-2013-004503 1
Open Access Research
on 7 Septem
ber 2018 by guest. Protected by copyright.
http://bmjopen.bm
j.com/
BM
J Open: first published as 10.1136/bm
jopen-2013-004503 on 27 March 2014. D
ownloaded from

programmes. Food group intake data from FETA hasalso been described as having the effect of free textmatching on nutrient and food group intake data. Freetext matching refers to the assigning of an appropriatefood code to handwritten text in the FFQ and will befurther described in the methods section.
METHODSEPIC-FFQ designThe questionnaire consists of two parts. Part 1 consists ofa food list of 130 lines; each line has a portion sizeattached to it: medium serving, standard unit or house-hold measure. Study participants were requested to selectan appropriate frequency of consumption for each line,from the nine frequency categories. As an example,figure 1 illustrates the sections relating to bread, savourybiscuits and breakfast cereals. A pdf copy of theEPIC-Norfolk FFQ may be downloaded from http://www.srl.cam.ac.uk/epic/epicffq/websitedocumentation.html;information on how to complete and code the FFQ isalso available here. The questionnaire lines are eitherindividual foods, combinations of individual foods orfood types. The FFQ food list is based on items from anFFQ widely used within the USA,6 7 but modified toreflect differences in American versus UK brand names,and some further food items were added.Part 2 contains further questions, a number of which
ask for more detailed information that link back to foodlines in part 1, as illustrated in figure 2. Detailed infor-mation was requested for breakfast cereals and fats asthese are nutritionally important foods in the UK diet.
Data collectionThe EPIC-Norfolk FFQ was posted to 25 639 participantsin the EPIC-Norfolk cohort study.8 The participants wereaged 40–79 years, and the questionnaire was completedbetween 1993 and 1997. The study was approved by theNorfolk Local Research Ethics Committee, adhered tothe Declaration of Helsinki, and all participants gavewritten informed consent. The FFQ was returned at ahealth examination, where it was checked and com-pleted, if required, by trained nursing staff. In total,
25 351(99%) participants returned the completedquestionnaire.
Comparison of FETA and CAFÉ programmesFETA uses a comma-separated values input file. Part 1 iscoded as numeric values and part 2 is coded as numericvalues and food codes, using the flowcharts and look-uplists provided (http://www.srl.cam.ac.uk/epic/epicffq/).We have also created a Microsoft Access form-basedentry tool to facilitate FFQ data entry, based on theEPIC-Norfolk FFQ. The tool exports data in a formatdirectly compatible with FETA. The FETA software waswritten in C and C++ languages, enabling faster process-ing times than SAS and the C/C++ software can also beused from the command line. The step-based graphicalwizard for running FETA was written in Perl. Whereas inthe CAFÉ programme, an Oracle-based entry system(Oracle Corporation, Redwood Shores, California, USA)was created to enter part 1 frequency data as numericcodes and part 2 data as numeric codes and free text.CAFÉ was written using SAS (SAS Software, V.8 of theSAS System for UNIX, SAS Institute Inc, Cary, NorthCarolina, USA) and links to tables in an Oracle rela-tional database.
Part 1: Data entryData were manually entered into a spreadsheet asnumeric codes, using ‘1’ for ‘never or less than once amonth’, to ‘9’ for ‘6+ times per day’. A code of ‘−9’ wasused to mark data where a frequency was not recorded.Where two frequencies were provided for a line, this wascoded as ‘−4’ and treated by CAFÉ and FETA pro-grammes as missing data. However, in FETA, both fre-quencies may now be entered, separated by a semicolon,for example, ‘2;3’, and FETA will process the first value.
Part 2: Assigning of food codes to ticked boxes and freetextPart 2 contains handwritten text for milk, breakfastcereals and cooking fats (see figure 2, questions 3, 5, 6and 7, respectively), which needs to be matched to themost appropriate food code in order to obtain nutrientdata; this process is known as free text matching. Thedata in part 2 were coded using reference lists of food
Figure 1 Part 1 (main part) of
the EPIC-Norfolk FFQ, illustrating
bread, savoury biscuits and
breakfast cereals.
2 Mulligan AA, Luben RN, Bhaniani A, et al. BMJ Open 2014;4:e004503. doi:10.1136/bmjopen-2013-004503
Open Access
on 7 Septem
ber 2018 by guest. Protected by copyright.
http://bmjopen.bm
j.com/
BM
J Open: first published as 10.1136/bm
jopen-2013-004503 on 27 March 2014. D
ownloaded from

codes for varieties of milk, breakfast cereal and cookingfat. Where there is no clear match, it is suggested that aresearcher consults the ingredients and nutrient infor-mation of the commercial item and compares this infor-mation with the nutrient profile of similar items fromthe reference lists. These reference lists and figures relat-ing to food codes that may be assigned to appropriateticked boxes may be found at http://www.srl.cam.ac.uk/epic/epicffq/websitedocumentation.htmlDifferences between FETA versus CAFÉ processing
may also be found at http://www.srl.cam.ac.uk/epic/epicffq/websitedocumentation.html; these differencesrelate to breakfast cereals, frying and baking fats, theoutcome of selecting the ‘None’ or ‘No’ box, anddefault milk, cereal and fat codes.
DatabasesEach line in part 1 of the FFQ is mapped to up to six foodcodes. Decisions regarding which food codes to use werebased on data from UK government surveys and other UKpopulation data.7 9 10 These decisions were based on datafor individuals aged 40–74 years.7 Data for portion weightswere sourced from UK population data and weighedrecords in 40–74-year-old study participants.7 11
The EPIC-Norfolk FFQ uses 290 foods from the UKfood composition database, McCance and Widdowson’s
‘The Composition of Foods’ (5th edition) and its asso-ciated supplements.12–21 A number of new food itemswere added to the EPIC-Norfolk FFQ food list, whichare used in the FETA and CAFÉ programmes. Theseinclude low-calorie/diet fizzy drinks and crunchy oatcereal, as well as modified home-baked and fried foods(without their fat), to enable an individual’s fat type, asrecorded in part 2 of the FFQ, to be incorporated.However, the nutrient data of six of the nine new foodsused in the CAFÉ programme were modified in FETA.These foods include crunchy oat cereal, milk non-specific, low-calorie/diet fizzy drinks, solid vegetable oil,Crisp ‘n Dry (solid fat), and oil and fat non-specific.Modifications to the nutrient data were made to ensurea more accurate nutrient profile and/or to better reflectthe foods consumed, in the case of non-specific items,such as milk and oil/fat; these changes relate to nutri-ent/food data at the time of FFQ completion.
Identification of outliersOutliers were defined as detailed previously.2 In brief,the ratio of energy intake (EI) to basal metabolic rate(BMR) was calculated, where BMR was calculated usingsex-specific Schofield equations, which included age andbody weight.22 Individuals in the top and bottom 0.5%of EI:BMR ratio were identified and excluded, as were
Figure 2 Questions from part 2
of the EPIC-Norfolk FFQ, used by
FETA.
Mulligan AA, Luben RN, Bhaniani A, et al. BMJ Open 2014;4:e004503. doi:10.1136/bmjopen-2013-004503 3
Open Access
on 7 Septem
ber 2018 by guest. Protected by copyright.
http://bmjopen.bm
j.com/
BM
J Open: first published as 10.1136/bm
jopen-2013-004503 on 27 March 2014. D
ownloaded from

individuals with FFQs containing 10 or more missinglines of data in part 1 of the FFQ.
Nutrient and food group outputsFETA produces four nutrient output formats and asample of each of these can be viewed at http://www.srl.cam.ac.uk/epic/epicffq/websitedocumentation.htmlOutput 1 contains average daily nutrient and food
group intakes for an individual from all FFQ foods con-sumed, in wide format, suitable for import into a spread-sheet or statistical package. Intake data for 46 nutrientsare provided as well as data for 14 basic food groups;however, only a selection of these nutrients is shown inthis report. Output 2 contains the same nutrient intakedata as output 1, but in long format, which is mostly suit-able for programmers. Output 3 contains average dailynutrient and food group intakes (and amount of foodconsumed) for an individual for each FFQ line; thisoutput file will be very large and is mostly suitable forprogrammers. The most detailed output (output 4) con-tains average daily nutrient and food group intakes, inaddition to the amount of food consumed for an indi-vidual, for each food code, for each FFQ line (meal_id).An online description of each meal_id and nutrientcode, including units of measurement, can be found inthe data entry template. This output will also be verylarge and is mostly suitable for programmers.A log file is created along with each output file, which
records the processing of the data and provides usefulerror information (see online supplementary appendix1 for log file of output 1). In these files, notes (generalprocess information) and error messages are recorded,with a date and time stamp. The log files make it pos-sible to calculate the number of missing frequenciesbased on part 1 (main grid) of the FFQ in order toexclude individuals with 10 or more missing ticks. Thelog files also record situations where a food code doesnot have any nutrient data attached to it.
Statistical analysesThe data were analysed using STATA V.10 (STATA Corp,Texas, USA). Intake data were described using mean,SD, median, minimum and maximum for FETA andCAFÉ programme outputs, stratified by sex. The nutri-ents selected for comparison are those described in theoriginal CAFÉ paper. Where data on quintile changesare shown, cut-off points were calculated using CAFÉnutrient data in order to compare quintile shift betweenFETA and CAFÉ output data.
RESULTSWe received FFQs from 25 351 participants (11 451 menand 13 900 women), with a mean age of 59 years. Fromthis set, 249 FFQs (90 men and 159 women) containing10 or more missing lines of data in part 1 of the FFQwere excluded, followed by a further exclusion of 250FFQs (111 men and 139 women) from the top and
bottom 0.5% of EI:BMR. This resulted in the final ana-lytical dataset of 24 852 participants (11 250 men and13 602 women).
Nutrient intake data from FETA and CAFÉ programmesTable 1 shows the average daily intake data for a numberof selected nutrients for 11 250 men. The data weresimilar for most nutrients across the two programmes.The nutrients which had the highest percentage of quin-tile change (≥10%) were monounsaturated fat, saturatedfat, iron, vitamin D and vitamin E. However, only 1.3%of the men changed more than one quintile, for two ofthese five nutrients. The nutrients which had the lowestpercentage of quintile changes were alcohol, calciumand carotene, with less than 3% change (table 1).Table 2 shows average daily intake data for the
selected nutrients for 13 602 women, from FETA andCAFÉ programmes. There were similar quintile changesobserved in women to those found in men for theselected nutrients; 4 of the 19 nutrients had a quintilechange of greater than 10%: polyunsaturated fat, satu-rated fat, iron and vitamin E. However, the number ofwomen who shifted more than one quintile was gener-ally lower than the number observed in men. The nutri-ents which had the greatest percentage of women whochanged more than one quintile were vitamins D and E,with 0.7% and 0.9%, respectively.Detailed (output 4) nutrient intake data at the individ-
ual level obtained from the two programmes were com-pared for approximately half of the participants(n=12 500; data not shown). All differences (>0.1%)found were investigated and explanations for these dif-ferences are considered in the discussion.
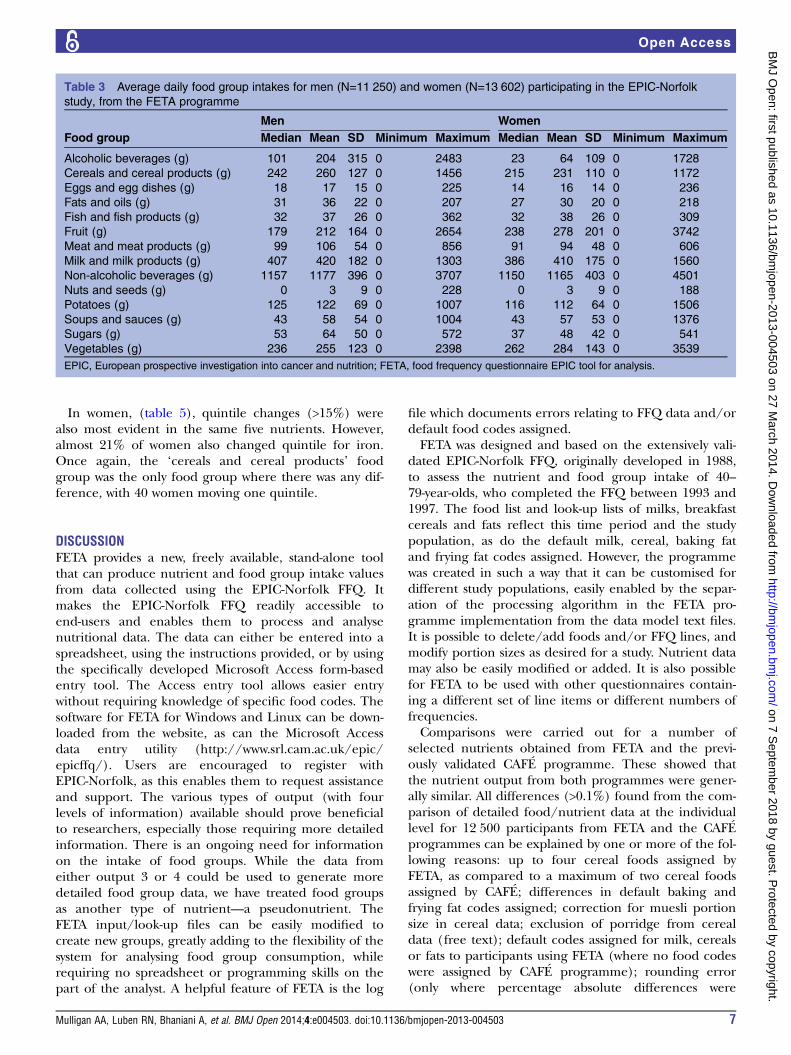
Food group intake data from FETAAverage daily intakes for men and women of the 14 foodgroups readily available from FETA are shown in table 3.Mean daily intakes of six of the food groups were higherin men than in women: alcohol, cereals, fats, meat, pota-toes and sugars. However, women had higher intakes offruit (278 vs 212 g) and vegetables (284 vs 255 g). Meandaily intakes of eggs, fish, milk, non-alcoholic beverages,nuts and seeds, and soups and sauces were similar inmen and women.
The effect of text matching in FETATables 4 and 5 illustrate the variation in nutrient andfood group intake data obtained in a random subset of1159 men and 1340 women, respectively, depending onwhether text matching of milks, breakfast cereals, andbaking and frying fats was applied. In general, meannutrient intakes were higher when text matching wascarried out. In men, (table 4), quintile changes (>15%)were most evident in the following nutrients:Englyst fibre, polyunsaturated fat, folate, vitamin D andvitamin E. The food group ‘cereals and cereal products’was the only 1 of the 14 groups where there was a differ-ence, with 31 men moving one quintile.
4 Mulligan AA, Luben RN, Bhaniani A, et al. BMJ Open 2014;4:e004503. doi:10.1136/bmjopen-2013-004503
Open Access
on 7 Septem
ber 2018 by guest. Protected by copyright.
http://bmjopen.bm
j.com/
BM
J Open: first published as 10.1136/bm
jopen-2013-004503 on 27 March 2014. D
ownloaded from

Table 1 Average daily nutrient intakes for men (N=11 250) participating in the EPIC-Norfolk study, from the FETA and CAFÉ programmes, after the exclusion of outliers,
with numbers and percentages of men who moved quintile
FETA programme CAFÉ programme Quintile
change
Quintile
change >1
Nutrient Median Mean SD Minimum Maximum Median Mean SD Minimum Maximum N Per cent N Per cent
Energy (kcal) 2126 2190 627 748 5085 2115 2179 626 748 5101 892 7.9 0 0
Energy (kJ) 8947 9222 2633 3124 21 394 8900 9175 2630 3124 21 440 891 7.9 0 0
Protein (g) 83.4 85.2 22 23.3 319.8 83.2 84.9 22 23.3 318.4 464 4.1 0 0
Alcohol (g) 6.7 12.3 16.1 0 134.2 6.7 12.3 16.1 0 134.2 0 0 0 0
Carbohydrate (g) 261 271 87 48 737 259 269 87 48 729 726 6.5 0 0
Starch (g) 123 128 45 10 504 122 127 45 10 501 813 7.2 1 0
Englyst fibre (g) 17.5 18.2 6.4 1.3 89.9 17.3 18 6.4 1.3 89.9 743 6.6 1 0
Fat (g) 78.9 83.2 31.3 13.4 260.6 78.7 83 31.3 13.4 260.6 1049 9.3 8 0.1
Monounsaturated fat (g) 27 28.8 11.6 4.8 101.2 26.8 28.5 11.5 4.8 105.1 1264 11.2 21 0.2
Polyunsaturated fat (g) 13.5 15 6.9 1.6 66.6 13.7 15.3 7.1 1.6 69.5 1074 9.5 24 0.2
Saturated fat (g) 30.1 32.3 13.6 3 110.6 29.8 31.9 13.5 3 106.7 1288 11.5 20 0.2
Calcium (mg) 1021 1039 301 189 2848 1018 1037 300 189 2849 296 2.6 1 0
Iron (mg) 12.1 12.4 3.6 2.6 38.7 11.9 12.3 3.5 2.5 38.5 1149 10.2 7 0.1
Potassium (mg) 3814 3881 911 1305 11 718 3802 3869 909 1284 11 718 411 3.7 0 0
Carotene (μg) 3188 3321 1573 147 25 720 3178 3309 1571 147 25 720 156 1.4 0 0
Folate (μg) 320 331 97 77 1547 316 327 96 77 1547 836 7.4 3 0
Vitamin C (mg) 103 111 52 10 669 105 113 52 10 669 411 3.7 14 0.1
Vitamin D (μg) 3.16 3.65 2.08 0.03 27.08 3.13 3.62 2.06 0.03 27.12 1161 10.3 145 1.3
Vitamin E (mg) 13.2 14.9 7.2 2.1 62.3 12.9 14.4 6.8 2.1 62 1545 13.7 146 1.3
CAFÉ, compositional analyses from frequency estimates; EPIC, European prospective investigation into cancer and nutrition; FETA, food frequency questionnaire EPIC tool for analysis.
Mulligan
AA,LubenRN,BhanianiA,etal.BM
JOpen
2014;4:e004503.doi:10.1136/bmjopen-2013-004503
5
OpenAccess
on 7 September 2018 by guest. Protected by copyright. http://bmjopen.bmj.com/ BMJ Open: first published as 10.1136/bmjopen-2013-004503 on 27 March 2014. Downloaded from

Table 2 Average daily nutrient intakes for women (N=13 602) participating in the EPIC-Norfolk study, from the FETA and CAFÉ programmes, after the exclusion of
outliers, with numbers and percentages of women who moved quintile
FETA programme CAFÉ programme Quintile
change
Quintile
change >1
Nutrient Median Mean SD Minimum Maximum Median Mean SD Minimum Maximum N Per cent N Per cent
Energy (kcal) 1859 1925 546 538 4733 1853 1920 547 518 4643 1030 7.6 0 0
Energy (kJ) 7833 8113 2296 2261 19 910 7811 8091 2298 2179 19 537 1018 7.5 0 0
Protein (g) 79.8 81.5 21.1 23 246 79.6 81.3 21 22.7 246.1 495 3.6 1 0
Alcohol (g) 2 5.6 8.4 0 99.5 2 5.6 8.4 0 99.5 0 0 0 0
Carbohydrate (g) 237 247 77 59 766 235 245 77 58 766 974 7.2 1 0
Starch (g) 107 112 39 13 405 106 111 39 13 406 1142 8.4 1 0
Englyst fibre (g) 18.2 19 6.8 2.3 118.5 18 18.8 6.7 2.4 118.6 850 6.2 1 0
Fat (g) 67 70.8 27.1 11.7 221 67.2 71.2 27.3 11.6 217.2 1194 8.8 4 0
Monounsaturated fat (g) 22.5 24.1 9.9 3.8 100.3 22.5 24.1 9.9 3.5 100.6 1338 9.8 7 0.1
Polyunsaturated fat (g) 12.2 13.5 6.2 2 53.6 12.5 13.8 6.3 2 53.6 1434 10.5 23 0.2
Saturated fat (g) 25 27 11.7 3.6 102.3 25 26.9 11.7 3.7 99.3 1443 10.6 9 0.1
Calcium (mg) 971 992 290 128 3159 969 990 290 127 3159 390 2.9 4 0
Iron (mg) 11.5 11.8 3.6 1.7 66.1 11.3 11.7 3.5 1.8 65.7 1496 11 12 0.1
Potassium (mg) 3781 3861 942 1150 16 568 3769 3848 939 1147 16 587 486 3.6 1 0
Carotene (μg) 3477 3719 1917 67 61 971 3469 3712 1917 64 61 983 122 0.9 0 0
Folate (μg) 322 332 103 65 2039 317 328 101 65 2024 1025 7.5 5 0
Vitamin C (mg) 123 133 64 4 1006 125 135 64 4 1006 746 5.5 35 0.3
Vitamin D (μg) 3.01 3.46 1.9 0 17.83 3.02 3.45 1.9 0 17.75 1119 8.2 90 0.7
Vitamin E (mg) 12.4 13.8 6.2 1.5 52.4 12.2 13.5 6 1.6 49.8 1863 13.7 123 0.9
CAFÉ, compositional analyses from frequency estimates; EPIC, European prospective investigation into cancer and nutrition; FETA, food frequency questionnaire EPIC tool for analysis.
6Mulligan
AA,LubenRN,BhanianiA,etal.BM
JOpen
2014;4:e004503.doi:10.1136/bmjopen-2013-004503
OpenAccess
on 7 September 2018 by guest. Protected by copyright. http://bmjopen.bmj.com/ BMJ Open: first published as 10.1136/bmjopen-2013-004503 on 27 March 2014. Downloaded from
In women, (table 5), quintile changes (>15%) werealso most evident in the same five nutrients. However,almost 21% of women also changed quintile for iron.Once again, the ‘cereals and cereal products’ foodgroup was the only food group where there was any dif-ference, with 40 women moving one quintile.
DISCUSSIONFETA provides a new, freely available, stand-alone toolthat can produce nutrient and food group intake valuesfrom data collected using the EPIC-Norfolk FFQ. Itmakes the EPIC-Norfolk FFQ readily accessible toend-users and enables them to process and analysenutritional data. The data can either be entered into aspreadsheet, using the instructions provided, or by usingthe specifically developed Microsoft Access form-basedentry tool. The Access entry tool allows easier entrywithout requiring knowledge of specific food codes. Thesoftware for FETA for Windows and Linux can be down-loaded from the website, as can the Microsoft Accessdata entry utility (http://www.srl.cam.ac.uk/epic/epicffq/). Users are encouraged to register withEPIC-Norfolk, as this enables them to request assistanceand support. The various types of output (with fourlevels of information) available should prove beneficialto researchers, especially those requiring more detailedinformation. There is an ongoing need for informationon the intake of food groups. While the data fromeither output 3 or 4 could be used to generate moredetailed food group data, we have treated food groupsas another type of nutrient—a pseudonutrient. TheFETA input/look-up files can be easily modified tocreate new groups, greatly adding to the flexibility of thesystem for analysing food group consumption, whilerequiring no spreadsheet or programming skills on thepart of the analyst. A helpful feature of FETA is the log
file which documents errors relating to FFQ data and/ordefault food codes assigned.FETA was designed and based on the extensively vali-
dated EPIC-Norfolk FFQ, originally developed in 1988,to assess the nutrient and food group intake of 40–79-year-olds, who completed the FFQ between 1993 and1997. The food list and look-up lists of milks, breakfastcereals and fats reflect this time period and the studypopulation, as do the default milk, cereal, baking fatand frying fat codes assigned. However, the programmewas created in such a way that it can be customised fordifferent study populations, easily enabled by the separ-ation of the processing algorithm in the FETA pro-gramme implementation from the data model text files.It is possible to delete/add foods and/or FFQ lines, andmodify portion sizes as desired for a study. Nutrient datamay also be easily modified or added. It is also possiblefor FETA to be used with other questionnaires contain-ing a different set of line items or different numbers offrequencies.Comparisons were carried out for a number of
selected nutrients obtained from FETA and the previ-ously validated CAFÉ programme. These showed thatthe nutrient output from both programmes were gener-ally similar. All differences (>0.1%) found from the com-parison of detailed food/nutrient data at the individuallevel for 12 500 participants from FETA and the CAFÉprogrammes can be explained by one or more of the fol-lowing reasons: up to four cereal foods assigned byFETA, as compared to a maximum of two cereal foodsassigned by CAFÉ; differences in default baking andfrying fat codes assigned; correction for muesli portionsize in cereal data; exclusion of porridge from cerealdata (free text); default codes assigned for milk, cerealsor fats to participants using FETA (where no food codeswere assigned by CAFÉ programme); rounding error(only where percentage absolute differences were
Table 3 Average daily food group intakes for men (N=11 250) and women (N=13 602) participating in the EPIC-Norfolk
study, from the FETA programme
Men Women
Food group Median Mean SD Minimum Maximum Median Mean SD Minimum Maximum
Alcoholic beverages (g) 101 204 315 0 2483 23 64 109 0 1728
Cereals and cereal products (g) 242 260 127 0 1456 215 231 110 0 1172
Eggs and egg dishes (g) 18 17 15 0 225 14 16 14 0 236
Fats and oils (g) 31 36 22 0 207 27 30 20 0 218
Fish and fish products (g) 32 37 26 0 362 32 38 26 0 309
Fruit (g) 179 212 164 0 2654 238 278 201 0 3742
Meat and meat products (g) 99 106 54 0 856 91 94 48 0 606
Milk and milk products (g) 407 420 182 0 1303 386 410 175 0 1560
Non-alcoholic beverages (g) 1157 1177 396 0 3707 1150 1165 403 0 4501
Nuts and seeds (g) 0 3 9 0 228 0 3 9 0 188
Potatoes (g) 125 122 69 0 1007 116 112 64 0 1506
Soups and sauces (g) 43 58 54 0 1004 43 57 53 0 1376
Sugars (g) 53 64 50 0 572 37 48 42 0 541
Vegetables (g) 236 255 123 0 2398 262 284 143 0 3539
EPIC, European prospective investigation into cancer and nutrition; FETA, food frequency questionnaire EPIC tool for analysis.
Mulligan AA, Luben RN, Bhaniani A, et al. BMJ Open 2014;4:e004503. doi:10.1136/bmjopen-2013-004503 7
Open Access
on 7 Septem
ber 2018 by guest. Protected by copyright.
http://bmjopen.bm
j.com/
BM
J Open: first published as 10.1136/bm
jopen-2013-004503 on 27 March 2014. D
ownloaded from

Table 4 Comparison of average daily nutrient and food group intakes for men (N=1159) participating in the EPIC-Norfolk study, from the FETA programme, with and
without the application of text matching
Nutrient/food group
FETA programme, with text matching FETA programme, without text matching
Quintile
change
Quintile
change >1
Median Mean SD Minimum Maximum Median Mean SD Minimum Maximum N Per cent N Per cent
Energy (kcal) 2095 2176 678 658 7766 2091 2170 678 658 7787 28 2.4 0 0
Energy (kJ) 8822 9161 2848 2780 32 555 8804 9138 2850 2780 32 647 26 2.2 0 0
Protein (g) 82.8 85 22.8 22.1 272.3 82.5 84.7 22.8 22.1 272.3 34 2.9 0 0
Alcohol (g) 7.2 12.3 16.1 0 112.9 7.2 12.3 16.1 0 112.9 0 0 0 0
Carbohydrate (g) 261 270 93 63 1006 259 269 93 63 1003 48 4.1 0 0
Starch (g) 120 127 49 7 643 121 126 48 7 636 65 5.6 0 0
Englyst fibre (g) 17.5 18.3 6.6 3.6 71.8 17.3 17.9 6.3 3.6 64.5 198 17.1 10 0.9
Fat (g) 77.8 82.1 33.1 12.8 387.8 77.3 82.1 33.1 12.8 389.3 32 2.8 0 0
Monounsaturated fat (g) 26.5 28.2 12.2 3.5 131.1 26.7 28.7 12.5 3.7 138.7 88 7.6 0 0
Polyunsaturated fat (g) 13.5 14.9 7.3 3 67 12.7 14.1 6.8 3 60.7 179 15.4 17 1.5
Saturated fat (g) 30.1 31.8 14.1 3.3 160 30.3 32.2 14.3 3.3 160.3 72 6.2 1 0.1
Calcium (mg) 1015 1044 312 242 2848 1012 1044 313 242 2861 42 3.6 0 0
Iron (mg) 11.9 12.5 3.8 2.6 37.9 11.7 12 3.5 2.6 38.1 173 14.9 16 1.4
Potassium (mg) 3824 3889 957 1353 12 675 3812 3873 951 1353 12 551 52 4.5 0 0
Carotene (μg) 3150 3348 1671 507 18 295 3162 3353 1672 507 18 338 6 0.5 0 0
Folate (μg) 325 333 103 94 1222 316 326 101 94 1262 226 19.5 2 0.2
Vitamin C (mg) 105 113 55 17 619 104 112 55 17 619 22 1.9 0 0
Vitamin D (μg) 3.08 3.64 2.17 0.03 16.4 3.06 3.64 2.19 0.03 20.52 227 19.6 8 0.7
Vitamin E (mg) 13.3 15 7.6 2.7 74.7 13 14.5 7.1 2.7 71.2 238 20.5 30 2.6
Alcoholic beverages (g) 104 201 301 0 1866 104 201 301 0 1866 0 0 0 0
Cereals and cereal products (g) 240 257 131 0 1378 238 255 130 0 1378 31 2.7 0 0
Eggs and egg dishes (g) 18 17 17 0 225 18 17 17 0 225 0 0 0 0
Fats and oils (g) 31 36 25 0 313 31 36 25 0 313 0 0 0 0
Fish and fish products (g) 32 37 25 0 153 32 37 25 0 153 0 0 0 0
Fruit (g) 184 216 158 0 1037 184 216 158 0 1037 0 0 0 0
Meat and meat products (g) 98 104 52 0 690 98 104 52 0 690 0 0 0 0
Milk and milk products (g) 414 428 187 0 1302 414 428 187 0 1302 0 0 0 0
Non-alcoholic beverages (g) 1159 1191 397 22 3677 1159 1191 397 22 3677 0 0 0 0
Nuts and seeds (g) 0 3 8 0 135 0 3 8 0 135 0 0 0 0
Potatoes (g) 125 121 78 0 1518 125 121 78 0 1518 0 0 0 0
Soups and sauces (g) 43 56 51 0 556 43 56 51 0 556 0 0 0 0
Sugars (g) 51 63 50 0 358 51 63 50 0 358 0 0 0 0
Vegetables (g) 238 256 128 15 1047 238 256 128 15 1047 0 0 0 0
EPIC, European prospective investigation into cancer and nutrition; FETA, food frequency questionnaire EPIC tool for analysis.
8Mulligan
AA,LubenRN,BhanianiA,etal.BM
JOpen
2014;4:e004503.doi:10.1136/bmjopen-2013-004503
OpenAccess
on 7 September 2018 by guest. Protected by copyright. http://bmjopen.bmj.com/ BMJ Open: first published as 10.1136/bmjopen-2013-004503 on 27 March 2014. Downloaded from

Table 5 Comparison of average daily nutrient and food group intakes for women (N=1340) participating in the EPIC-Norfolk study, from the FETA programme, with and
without the application of text matching
FETA programme, with text matching FETA programme, without text matching
Quintile
change
Quintile
change >1
Nutrient/food group Median Mean SD Minimum Maximum Median Mean SD Minimum Maximum N Per cent N Per cent
Energy (kcal) 1886 1946 607 608 8103 1880 1941 605 608 8134 50 3.7 0 0
Energy (kJ) 7938 8202 2554 2552 34 410 7909 8177 2547 2552 34 541 47 3.5 0 0
Protein (g) 80.3 82.5 22.2 26.8 277 79.9 82.1 22.1 26.8 276.6 43 3.2 0 0
Alcohol (g) 2 5.4 8.1 0 65.3 2 5.4 8.1 0 65.3 0 0 0 0
Carbohydrate (g) 238 250 90 67 1596 237 249 90 67 1603 58 4.3 0 0
Starch (g) 109 114 52 25 1288 108 114 52 25 1301 99 7.4 0 0
Englyst fibre (g) 18.6 19.3 7.4 4.1 103.7 17.8 18.7 7.1 3.3 97.2 247 18.4 13 1
Fat (g) 67.6 71.4 28.5 17.2 259.4 67.5 71.3 28.4 17.2 259.7 45 3.4 0 0
Monounsaturated fat (g) 22.7 24.4 10.6 4.8 104.2 23.1 24.6 10.6 4.8 103.8 133 9.9 0 0
Polyunsaturated fat (g) 12.2 13.6 6.2 2.6 42.5 11.5 12.9 5.9 2.5 39.4 224 16.7 11 0.8
Saturated fat (g) 25.2 27.2 12.4 5.1 109.6 25.5 27.5 12.4 5.1 109.6 74 5.5 2 0.1
Calcium (mg) 978 995 298 242 2528 976 992 297 242 2534 46 3.4 1 0.1
Iron (mg) 11.7 11.9 3.9 3.1 67.8 11.1 11.4 3.5 3.1 55.3 280 20.9 44 3.3
Potassium (mg) 3788 3874 994 1284 12 702 3744 3848 987 1280 12 526 68 5.1 0 0
Carotene (μg) 3489 3731 1705 178 13 796 3500 3736 1707 175 13 796 11 0.8 0 0
Folate (μg) 326 337 107 102 1311 318 329 105 97 1276 291 21.7 1 0.1
Vitamin C (mg) 124 133 63 4 809 122 132 62 4 809 34 2.5 0 0
Vitamin D (μg) 3.07 3.49 1.89 0.22 12.06 3.02 3.46 1.89 0.29 12.46 248 18.5 9 0.7
Vitamin E (mg) 12.5 13.8 6.3 2.7 52.4 12.1 13.3 5.9 3.3 43.6 270 20.2 21 1.6
Alcoholic beverages (g) 21 61 104 0 1350 21 61 104 0 1350 0 0 0 0
Cereals and cereal products (g) 214 236 174 9 4948 212 234 174 9 4948 40 3 0 0
Eggs and egg dishes (g) 14 16 14 0 136 14 16 14 0 136 0 0 0 0
Fats and oils (g) 27 30 19 0 133 27 30 19 0 133 0 0 0 0
Fish and fish products (g) 32 39 26 0 187 32 39 26 0 187 0 0 0 0
Fruit (g) 238 277 199 0 2830 238 277 199 0 2830 0 0 0 0
Meat and meat products (g) 90 95 49 0 392 90 95 49 0 392 0 0 0 0
Milk and milk products (g) 381 410 174 0 959 381 410 174 0 959 0 0 0 0
Non-alcoholic beverages (g) 1148 1153 404 8 3215 1148 1153 404 8 3215 0 0 0 0
Nuts and seeds (g) 0 3 11 0 180 0 3 11 0 180 0 0 0 0
Potatoes (g) 116 113 61 0 785 116 113 61 0 785 0 0 0 0
Soups and sauces (g) 45 57 53 0 900 45 57 53 0 900 0 0 0 0
Sugars (g) 38 50 46 0 540 38 50 46 0 540 0 0 0 0
Vegetables (g) 265 288 140 2 1387 265 288 140 2 1387 0 0 0 0
EPIC, European prospective investigation into cancer and nutrition; FETA, food frequency questionnaire EPIC tool for analysis.
Mulligan
AA,LubenRN,BhanianiA,etal.BM
JOpen
2014;4:e004503.doi:10.1136/bmjopen-2013-004503
9
OpenAccess
on 7 September 2018 by guest. Protected by copyright. http://bmjopen.bmj.com/ BMJ Open: first published as 10.1136/bmjopen-2013-004503 on 27 March 2014. Downloaded from

between 0.1% and 1%) and changes made to the nutri-ent data of six of the nine new foods as well as to thedefault code for milk. A section entitled ‘What are thedifferences between FETA versus CAFÉ processing?’found at http://www.srl.cam.ac.uk/epic/epicffq/FAQs.html further explains the aforementioned differences.Although nutrient intakes as calculated by FETA and
CAFÉ were similar, some relatively small differencesexisted, but these and the quintile shift of men andwomen can be explained. In FETA, a number ofchanges were made to the processing of breakfastcereals, affecting carbohydrate, starch, Englyst fibre, ironand folate estimates. The vitamin C content per 100 g oflow-calorie/diet fizzy drinks was changed from 5 to0 mg, and the vitamin E content of crunchy oat cerealand oil and fat non-specific was increased. Changesmade to the processing of fats in questions 6 and 7 inpart 2 of the FFQ, in addition to changes made to thefatty acid profile of the three new fats, could helpexplain the small differences observed in monounsatu-rated, polyunsaturated and saturated fat intakes.There was quite a large range in intake in the 14 food
groups, with a minimum intake of zero for each of thefood groups. It is difficult to compare food group intakedata as the groupings of foods often vary. However, thecombined mean intake of fruit (excluding juices) andvegetables for men and women was 467 and 562 grespectively, achieving the Government’s ‘Five a day’ rec-ommendation,23 using a portion size of 80 g.While text matching only affected one food group
(cereals and cereal products), more than 15% of menand women changed quintile for a number of nutrients:Englyst fibre, polyunsaturated fat, folate, vitamin D andvitamin E, and iron (women only). Yet again, thesenutrients related to the text matching of breakfastcereals and baking and frying fats. The inclusion ofthese data illustrates the effect of text matching on theranking of individuals for certain nutrients and willenable future researchers using FETA to make informeddecisions on the benefit of text matching for their study.We have not addressed or discussed common FFQ
issues, such as the number of items in a food list or theuse of a single average portion size, as these are not thefocus of this paper and have been reviewedpreviously.24 25
It is anticipated that future updates of FETA mightcontain a number of improvements and overcome someof the limitations of FETA, currently released as V.2.53for Windows and Linux (last updated 15 March and 21February 2013, respectively). The source code has beenmade available online which enables users to make mod-ifications and improvements to the programme.Currently, we have made available Windows and Linuxversions and it is hoped that an OS X version will followsoon. We are currently working on a LibreOffice versionof the Microsoft Access form-based entry tool.In conclusion, we have created a new, open source,
stand-alone, cross-platform FFQ processing tool, FETA,
to produce nutrient and food group data for researchersusing the EPIC-Norfolk FFQ. The tool produces similarnutrient and food group values to the previouslyvalidated CAFÉ programme, but is more accessible.Although FETA was designed and based on theEPIC-Norfolk FFQ, the programme was created in sucha way that it can be customised for different study popu-lations. It is anticipated that the development and avail-ability of FETA will be a useful addition to the field ofnutritional epidemiology and dietary public health.
Author affiliations1European Prospective Investigation into Cancer and Nutrition, Department ofPublic Health and Primary Care, Strangeways Research Laboratory, Universityof Cambridge, Cambridge, UK2MRC Epidemiology Unit, Institute of Metabolic Science, Addenbrooke’sHospital, University of Cambridge, Cambridge, UK3EPIC, Department of Gerontology, Addenbrooke’s Hospital, School of ClinicalMedicine, University of Cambridge, Cambridge, UK
Acknowledgements The authors would like to thank Mr Adam Dickinson,senior data manager at the MRC Epidemiology Unit, and his team membersfor their contribution to project management of FETA; Professor NickWareham, as EPIC-Norfolk study PI; and Mr Jamal Natour, as FETA softwaredeveloper. The authors would also like to thank all the participants of theEPIC-Norfolk study and the EPIC-Norfolk staff for their help with this work.
Collaborators Adam Dickinson; Nick Wareham; and Jamal Natour.
Contributors AAM, AB and RNL contributed to the software development andassisted in statistical analyses. AAM drafted the manuscript. DJP-S wrote thestep-based graphical wizard for running FETA. APK created the MicrosoftAccess form-based entry tool. All authors approved the final manuscript.
Funding This study was supported by programme grants from the MRCPopulation Health Sciences Research Network (PHSRN), Cancer Research UK(C864/A8257) and the Medical Research Council (G0401527 and G1000143).NGF was supported by the Medical Research Council (MC_UP_A100_1003);APK is funded by a Wellcome Trust Clinical Research Fellowship.
Competing interests None.
Ethics approval Norwich Local Research Ethics Committee.
Provenance and peer review Not commissioned; externally peer reviewed.
Data sharing statement EPIC-Norfolk has a wide range of collaborators.Contact details, publications and the process for collaborating and datarequests can be found on the website (http://www.epic-norfolk.org.uk).
Open Access This is an Open Access article distributed in accordance withthe terms of the Creative Commons Attribution (CC BY 3.0) license, whichpermits others to distribute, remix, adapt and build upon this work, forcommercial use, provided the original work is properly cited. See: http://creativecommons.org/licenses/by/3.0/
REFERENCES1. Subar AF. Developing dietary assessment tools. J Am Diet Assoc
2004;104:769–70. http://www.ncbi.nlm.nih.gov/pubmed/15127062(accessed 5 Nov 2013).
2. Welch AA, Luben R, Khaw KT, et al. The CAFE computer programfor nutritional analysis of the EPIC-Norfolk food frequencyquestionnaire and identification of extreme nutrient values. J HumNutr Diet 2005;18:99–116.
3. Bingham SA, Gill C, Welch A, et al. Validation of dietary assessmentmethods in the UK arm of EPIC using weighed records, and 24-hoururinary nitrogen and potassium and serum vitamin C andcarotenoids as biomarkers. Int J Epidemiol 1997;26:S137–51.
4. Bingham SA, Welch AA, McTaggart A, et al. Nutritional methods inthe European Prospective Investigation of Cancer in Norfolk. PublicHealth Nutr 2001;4:847–58.
10 Mulligan AA, Luben RN, Bhaniani A, et al. BMJ Open 2014;4:e004503. doi:10.1136/bmjopen-2013-004503
Open Access
on 7 Septem
ber 2018 by guest. Protected by copyright.
http://bmjopen.bm
j.com/
BM
J Open: first published as 10.1136/bm
jopen-2013-004503 on 27 March 2014. D
ownloaded from

5. McKeown NM, Day NE, Welch AA, et al. Use of biological markersto validate self-reported dietary intake in a random sample of theEuropean Prospective Investigation into Cancer United KingdomNorfolk cohort. Am J Clin Nutr 2001;74:188–96.
6. Rimm EB, Giovannucci EL, Stampfer MJ, et al. Reproducibility andvalidity of an expanded self-administered semiquantitative foodfrequency questionnaire among male health professionals. Am JEpidemiol 1992;135:1114–26. http://www.ncbi.nlm.nih.gov/pubmed/1632423 (accessed 5 Nov 2013).
7. Bingham SA, Gill C, Welch A, et al. Comparison of dietaryassessment methods in nutritional epidemiology: weighed recordsv. 24 h recalls, food-frequency questionnaires and estimated-dietrecords. Br J Nutr 1994;72:619–43.
8. Day N, Oakes S, Luben R, et al. EPIC-Norfolk: study design andcharacteristics of the cohort. European Prospective Investigation ofCancer. Br J Cancer 1999;80(Suppl 1):95–103. http://www.ncbi.nlm.nih.gov/pubmed/10466767 (accessed 5 Nov 2013).
9. Gregory J, Foster K, Tyler H, et al. The dietary and nutritional surveyof British adults. London: Her Majesty’s Stationary Office (HMSO),1990.
10. MAFF. The dietary and nutritional survey of British adults—furtheranalysis. London: Her Majesty’s Stationary Office (HMSO),1994.
11. MAFF. Food portion sizes. 2nd edn. London: Her Majesty’sStationary Office (HMSO), 1993.
12. Holland B, Unwin ID, Buss D. Cereals and cereal products. The thirdsupplement to McCance and Widdowson’s the composition of foods.4th edn. Cambridge: RSC, 1988.
13. Holland B, Unwin ID, Buss D. Milk products and eggs. The fourthsupplement to McCance and Widdowson’s the composition of foods.4th edn. Cambridge: RSC, 1989.
14. Holland B, Welch AA, Unwin ID, et al. McCance and Widdowson’sthe composition of foods. Cambridge: Royal Society of Chemistry(RSC), 1991.
15. Holland B, Unwin ID, Buss D. Vegetables, herbs and spices. Thefifth supplement to McCance and Widdowson’s the composition offoods. 4th edn. Cambridge: RSC, 1991.
16. Holland B, Unwin ID, Buss D. Fruit and nuts. The first supplement toMcCance and Widdowson’s the composition of foods. 5th edn.Cambridge: RSC, 1992.
17. Holland B, Welch A, Buss D. Vegetable dishes. The secondsupplement to McCance and Widdowson’s the composition of foods.5th edn. Cambridge: RSC, 1992.
18. Holland B, Brown J, Buss D. Fish and fish products. The thirdsupplement to McCance and Widdowson’s the composition of foods.5th edn. Cambridge: RSC, 1993.
19. Chan W, Brown J, Buss D. Miscellaneous foods. The fourthsupplement to McCance and Widdowson’s the composition of foods.5th edn. Cambridge: RSC, 1994.
20. Chan W, Brown J, Lee S, et al. Meat, poultry and game. The fifthsupplement to McCance and Widdowson’s the composition of foods.5th edn. Cambridge: RSC, 1995.
21. Chan W, Brown J, Church S, et al. Meat products and dishes. Thesixth supplement to McCance and Widdowson’s the composition offoods. 5th edn. Cambridge: RSC, 1996.
22. COMA. Dietary reference values for food energy and nutrients forthe United Kingdom. London: Her Majesty’s Stationary Office(HMSO), 1991.
23. Department of Health. http://www.nhs.uk/Livewell/5ADAY/Pages/5ADAYhome.aspx (accessed 5 Nov 2013).
24. Cade JE, Burley VJ, Warm DL, et al. Food-frequencyquestionnaires: a review of their design, validation and utilisation.Nutr Res Rev 2004;17:5–22. http://www.ncbi.nlm.nih.gov/pubmed/19079912 (accessed 30 Oct 2013).
25. Molag ML, de Vries JHM, Ocké MC, et al. Design characteristics offood frequency questionnaires in relation to their validity. Am JEpidemiol 2007;166:1468–78. http://www.ncbi.nlm.nih.gov/pubmed/17881382 (accessed 5 Nov 2013).
Mulligan AA, Luben RN, Bhaniani A, et al. BMJ Open 2014;4:e004503. doi:10.1136/bmjopen-2013-004503 11
Open Access
on 7 Septem
ber 2018 by guest. Protected by copyright.
http://bmjopen.bm
j.com/
BM
J Open: first published as 10.1136/bm
jopen-2013-004503 on 27 March 2014. D
ownloaded from