
Open Access New Correlations for Predicting the ... Correlations for Predicting the Thermodynamic...
11
42 The Open Petroleum Engineering Journal, 2012, 5, 42-52 1874-8341/12 2012 Bentham Open Open Access New Correlations for Predicting the Thermodynamic Properties of Supercritical Carbon Dioxide Liang-Biao Ouyang* Chevron Corporation, P. O. Box 5095, Bellaire, TX 77402-5095, USA Abstract: Six new accurate and explicit correlations have been proposed in the present paper to predict the key thermodynamic properties of carbon dioxide under operational conditions anticipated for a typical carbon capture and sequestration (CCS) project – pressure = 1100 – 9000 psia (7 – 62 MPa) and temperature = 40 – 100 °C. These physical properties include entropy, enthalpy, internal energy, thermal conductivity, Joule-Thomson coefficient, and speed of sound, which all play an important role in controlling the PVT and thermodynamic behaviors of carbon dioxide associated with its flow through pipelines, wellbores, chokes, valves, and so on. The new correlations can predict carbon dioxide properties well matched to the high accuracy carbon dioxide property data available through the National Institute of Standards and Technology (NIST) web database [1]. Keywords: Carbon dioxide, thermodynamic properties, supercritical condition, carbon capture and sequestration, correlation 1. BACKGROUND CCS (Carbon Capture and Sequestration, also known as Carbon Capture and Storage) has achieved increasing popularity all over the world for mitigating the contribution of fossil fuel emissions to global warming (a.k.a. climate change) (Ouyang [2]). The CCS process involves capturing carbon dioxide from fossil fuel power plants, natural gas production, ambient air, and so on, and injecting it into deep geological formations for permanent storage. Major CCS projects with cost ranging from millions up to dozens of billions US dollars have been built or planned in many countries from Asia Pacific (Australia, China), to Europe (Netherlands, Norway, United Kingdom, Germany, Italy, Poland), and North America (United States, Canada). Due to the dedicate thermodynamic characteristics of carbon dioxide, a change in the operating conditions in a CCS project may trigger rapid and dramatic changes in temperature, pressure, and thus phase behaviors. Some of the change would potentially lead to serious or even catastrophic consequences if not handled properly on a timely manner, causing damages to system (e. g., blowout, pipe break, weak point failure, valve breakdown), health, environment and safety (e. g., carbon dioxide leak). In order to appropriately design and safely / optimally operate a CCS project, the accurate representation of carbon dioxide properties – both physical and thermodynamic – and then applying the properties for mass, momentum and energy balance modeling is a must. In addition to density and viscosity, thermal conductivity, enthalpy, entropy, Joule-Thomson coefficient, and others, are important parameters required for accurately predicting flow and thermal characteristics of carbon dioxide related to its flow through wellbores and pipelines for CCS projects. *Address correspondence to this author at the Chevron Corporation, P. O. Box 5095, Bellaire, TX 77402-5095, USA; Tel: 618 9485 5587; E-mail: [email protected] The thermodynamic properties of carbon dioxide have been the focus of study over the past 20+ years. Vesovic et al. [3] proposed a set of equations for the viscosity and thermal conductivity of carbon dioxide. The complete correlations cover the temperature range 200 K T < 1500 K for viscosity and 200 K T 1000 K for thermal conductivity, and pressures up to 100 MPa. The uncertainties associated with the correlation vary according to the thermodynamic state from ±0.3% for the viscosity of the dilute gas near room temperature to ±5% for the thermal conductivity in the liquid phase. Liao & Zhao [4] investigated the heat transfer originating from supercritical carbon dioxide flowing in horizontal miniature circular tubes via a series of laboratory experiments that were carried out for pressures ranging from 74 to 120 bar and temperatures ranging from 20 to 110 °C. Heat transfer coefficients have been determined via the experiments. Kim et al. [5] presented the experimental data for the heat transfer and pressure drop characteristics obtained during the gas cooling process of carbon dioxide in a horizontal tube. The experimental results in their study were compared with the supercritical heat transfer coefficient estimated via existing correlations, which were found to generally under-predict the measured data. Bock et al. [6] calculated the transport properties of pure carbon dioxide from the intermolecular potential using the classical trajectory method. Results have been reported in the dilute-gas limit for thermal conductivity and thermomagnetic coefficients for temperatures ranging from 200 K to 1000 K. Colina et al. [7] presented simulation results for volume expansivity, isothermal compressibility, isobaric heat capacity, Joule-Thomson coefficient and speed of sound for carbon dioxide in the supercritical region, by using the fluctuation method based on Monte Carlo simulations in the isothermal-isobaric ensemble. Pitla et al. [8] discussed the Nusselt number variations of supercritical carbon dioxide during an in-tube cooling process. They found that the majority of the numerical and experimental values are within ±20% of the values predicted by the new
Transcript of Open Access New Correlations for Predicting the ... Correlations for Predicting the Thermodynamic...
42 The Open Petroleum Engineering Journal, 2012, 5, 42-52
1874-8341/12 2012 Bentham Open
Open Access
New Correlations for Predicting the Thermodynamic Properties of Supercritical Carbon Dioxide
Liang-Biao Ouyang*
Chevron Corporation, P. O. Box 5095, Bellaire, TX 77402-5095, USA
Abstract: Six new accurate and explicit correlations have been proposed in the present paper to predict the key
thermodynamic properties of carbon dioxide under operational conditions anticipated for a typical carbon capture and
sequestration (CCS) project – pressure = 1100 – 9000 psia (7 – 62 MPa) and temperature = 40 – 100 °C. These physical
properties include entropy, enthalpy, internal energy, thermal conductivity, Joule-Thomson coefficient, and speed of
sound, which all play an important role in controlling the PVT and thermodynamic behaviors of carbon dioxide associated
with its flow through pipelines, wellbores, chokes, valves, and so on. The new correlations can predict carbon dioxide
properties well matched to the high accuracy carbon dioxide property data available through the National Institute of
Standards and Technology (NIST) web database [1].
Keywords: Carbon dioxide, thermodynamic properties, supercritical condition, carbon capture and sequestration, correlation
1. BACKGROUND
CCS (Carbon Capture and Sequestration, also known as Carbon Capture and Storage) has achieved increasing popularity all over the world for mitigating the contribution of fossil fuel emissions to global warming (a.k.a. climate change) (Ouyang [2]). The CCS process involves capturing carbon dioxide from fossil fuel power plants, natural gas production, ambient air, and so on, and injecting it into deep geological formations for permanent storage. Major CCS projects with cost ranging from millions up to dozens of billions US dollars have been built or planned in many countries from Asia Pacific (Australia, China), to Europe (Netherlands, Norway, United Kingdom, Germany, Italy, Poland), and North America (United States, Canada).
Due to the dedicate thermodynamic characteristics of carbon dioxide, a change in the operating conditions in a CCS project may trigger rapid and dramatic changes in temperature, pressure, and thus phase behaviors. Some of the change would potentially lead to serious or even catastrophic consequences if not handled properly on a timely manner, causing damages to system (e. g., blowout, pipe break, weak point failure, valve breakdown), health, environment and safety (e. g., carbon dioxide leak). In order to appropriately design and safely / optimally operate a CCS project, the accurate representation of carbon dioxide properties – both physical and thermodynamic – and then applying the properties for mass, momentum and energy balance modeling is a must. In addition to density and viscosity, thermal conductivity, enthalpy, entropy, Joule-Thomson coefficient, and others, are important parameters required for accurately predicting flow and thermal characteristics of carbon dioxide related to its flow through wellbores and pipelines for CCS projects.
*Address correspondence to this author at the Chevron Corporation, P. O.
Box 5095, Bellaire, TX 77402-5095, USA; Tel: 618 9485 5587;
E-mail: [email protected]
The thermodynamic properties of carbon dioxide have been the focus of study over the past 20+ years. Vesovic et al. [3] proposed a set of equations for the viscosity and thermal conductivity of carbon dioxide. The complete correlations cover the temperature range 200 K T < 1500 K for viscosity and 200 K T 1000 K for thermal conductivity, and pressures up to 100 MPa. The uncertainties associated with the correlation vary according to the thermodynamic state from ±0.3% for the viscosity of the dilute gas near room temperature to ±5% for the thermal conductivity in the liquid phase. Liao & Zhao [4] investigated the heat transfer originating from supercritical carbon dioxide flowing in horizontal miniature circular tubes via a series of laboratory experiments that were carried out for pressures ranging from 74 to 120 bar and temperatures ranging from 20 to 110 °C. Heat transfer coefficients have been determined via the experiments. Kim et al. [5] presented the experimental data for the heat transfer and pressure drop characteristics obtained during the gas cooling process of carbon dioxide in a horizontal tube. The experimental results in their study were compared with the supercritical heat transfer coefficient estimated via existing correlations, which were found to generally under-predict the measured data. Bock et al. [6] calculated the transport properties of pure carbon dioxide from the intermolecular potential using the classical trajectory method. Results have been reported in the dilute-gas limit for thermal conductivity and thermomagnetic coefficients for temperatures ranging from 200 K to 1000 K. Colina et al. [7] presented simulation results for volume expansivity, isothermal compressibility, isobaric heat capacity, Joule-Thomson coefficient and speed of sound for carbon dioxide in the supercritical region, by using the fluctuation method based on Monte Carlo simulations in the isothermal-isobaric ensemble. Pitla et al. [8] discussed the Nusselt number variations of supercritical carbon dioxide during an in-tube cooling process. They found that the majority of the numerical and experimental values are within ±20% of the values predicted by the new

New Correlations for Predicting the Thermodynamic Properties The Open Petroleum Engineering Journal, 2012, Volume 5 43
correlation proposed in the study. Bahadori & Vuthaluru [9] developed new correlations for the prediction of transport properties (namely viscosity and thermal conductivity) of carbon dioxide (CO2) as a function of pressure and temperature. The average absolute deviations were found to be 2% and 2.5% for viscosity and thermal conductivity of carbon dioxide, respectively. And more recently, Ouyang [2] presented two new correlations for quickly and accurately estimating the density and viscosity of supercritical carbon dioxide for CCS applications.
In general, the thermodynamic properties of carbon dioxide, including entropy, enthalpy, internal energy, thermal conductivity, Joule-Thomson coefficient, and speed of sound, may be calculated through a black oil model, an equation of state (EoS), or empirical correlations. Most black oil models have been developed for oil and natural gas where carbon dioxide component is typically less than 3% except for sour gas where the carbon dioxide composition can reach as high as 10% – 20%; therefore, they may result in substantial errors when applied to pure carbon dioxide, which is also true for equations of state (EoSs).
On one hand, EoS or EoS based models require extensive and complex numerical computations and may not be a good choice for majority of engineering applications. On the other hand, some empirical correlations need density and/or other parameters in order to calculate the thermodynamic properties of carbon dioxide. Moreover, prediction of carbon dioxide properties via these approaches may not be sufficiently accurate when applied to pure carbon dioxide at supercritical conditions.
The primary EoS that have been applied to carbon dioxide includes Peng-Robinson [10], Soave-Redlich-Kwong (a.k.a. SRK) [11, 12], and Span & Wagner [13]. Span & Wagner EoS was specifically developed for carbon dioxide and has been widely considered as the top choice of equation of state for predicting the property of pure or high concentration carbon dioxide. Unfortunately, the Span & Wagner EoS has not been implemented in most of the commercial software packages that are routinely used for assessing the carbon dioxide flow dynamics in pipelines and wellbores. Furthermore, it could be over-complicated (i.e., computational “overkill” per Hassanzadeh et al. [14]) and/or time-consuming to use an EoS to calculate the carbon dioxide thermal properties under certain circumstances where accurate empirical correlations are preferred.
In the present paper, simple but accurate explicit correlations have been developed for predicting the key thermodynamic properties (including entropy, enthalpy, internal energy, thermal conductivity, Joule-Thomson coefficient, and speed of sound) of pure carbon dioxide under supercritical conditions expected in majority of carbon capture and sequestration (CCS) applications. The new correlations can predict the carbon dioxide thermal properties well matched to the high accuracy carbon dioxide property data provided by the National Institute of Standards and Technology (NIST) [1].
2. APPROACH
As mentioned above, the National Institute of Standards and Technology (NIST) [1] provides a high quality and high accuracy web database for carbon dioxide property. The web
database is primarily based on the Span & Wagner equation of state (EoS) [13] and a number of auxiliary models such as Vesovic et al. [3], Fenghour et al. [15], Ely et al. [16], etc, for physical and thermodynamic properties and has been considered as the standard for the carbon dioxide property.
A similar approach to those described in Ouyang [2] has
been applied to develop the new correlations to be presented
in this paper. Through the NIST database, carbon dioxide
properties have been generated under pressure and
temperature ranges expected for typical CCS operations. The
data was then applied to develop the new simple and explicit
correlations for carbon dioxide thermodynamic properties
via a least square approach. Specifically, the correlation
formulae and the associated correlation coefficients have
been adjusted and optimized such that the following criteria
are met:
(Zpre– ZNIST)2 = [Zpre (p, T) – ZNIST (p, T)]
2 = minimum (1)
where Z represents carbon dioxide entropy in J/mol/K, or
enthalpy in KJ/mol, or internal energy in KJ/mol, or thermal
conductivity in W/m/K, or Joule-Thomson coefficient in
°F/psi, or speed of sound in m/s. Subscript pre refers to data
calculated by the proposed correlations, whereas subscript
NIST refers to data obtained from the NIST web database.
3. NEW CORRELATIONS FOR CARBON DIOXIDE
THERMODYNAMIC PROPERTIES
In total, six new correlations have been proposed in the
present paper, one for each of the six thermodynamic
properties of carbon dioxide – entropy, enthalpy, internal
energy, thermal conductivity, Joule-Thomson coefficient,
and speed of sound. Details are to be provided next in this section.
3.1. New Entropy Correlation
The new entropy correlation is listed below as a function of pressure in psia, with a reference S = 0 at 0 °C for saturated liquid:
S = A0 + A1p + A2p2 + A3p
3 + A4p
4 (2)
where carbon dioxide entropy (S) is given in J/(mol*K), pressure (p) in psia, and the correlation coefficients A0, A1 – A4 are solely associated with temperature in Celsius (Celsius = Kelvin – 273.15):
Ai = bi0 + bi1T + bi2T2 + bi3T
3 + bi4T
4 (i = 0, 1, 2, 3, 4)
(3)
The values for the correlation coefficients in Eq. 3 – bio,
bi1, bi2, bi3, and bi4 (i = 0, 1, 2, 3, 4) – are listed in Table 1a
for pressure less than 3000 psia (20.68 MPa) and in Table 1b
for pressure higher than 3000 psia.
Fig. (1) shows the variation of the carbon dioxide entropy
with pressure (1100 – 9000 psia) and temperature (40 – 100
°C) anticipated under the majority of carbon capture and
sequestration (CCS) operations. It can be clearly seen that at
a particular temperature, carbon dioxide entropy decreases
with pressure. The higher the pressure, the lower the carbon
dioxide entropy. And the lower the pressure, the higher the
carbon dioxide entropy would be.

44 The Open Petroleum Engineering Journal, 2012, Volume 5 Liang-Biao Ouyang
3.2. New Enthalpy Correlation
The new correlation for carbon dioxide enthalpy takes a similar form as Eq. 2:
h = C0 + C1p + C2p2 + C3p
3 + C4p
4 (4)
where the carbon dioxide enthalpy (h) is in KJ/mol, pressure (p) in psia, and correlation coefficients C0, C1, C2, C3 and C4 to be calculated by the following equation:
Ci = di0 + di1T + di2T2 + di3T
3 + di4T
4 (i = 0, 1, 2, 3, 4) ( 5)
The temperature (T) in Eq. 5 should be in Celsius (Celsius = Kelvin – 273.15).
The values for the correlation coefficients – dij (i = 0, 1, 2, 3, 4; j = 0, 1, 2, 3, 4) – required in Eq. 5 are listed in Table 2a for pressure less than 3000 psia and Table 2b for pressure larger than 3000 psia, respectively.
The carbon dioxide enthalpy as predicted by the new correlation (Eq. 4) is displayed in Fig. (2), again for pressure and temperature ranges expected for carbon capture and sequestration (CCS) operations.
3.3. New Internal Energy Correlation
The following is the new correlation for carbon dioxide internal energy with a reference u = 0 at 0 °C for saturated liquid:
Table 1a. Value of bij Coefficients in Eq. 3 for Pressure < 3000 Psia
bi0 bi1 bi2 bi3 bi4
i = 0 6.106364859067E+03 -3.110651159189E+02 5.868648346079E+00 -4.818571961262E-02 1.460412333328E-04
i = 1 -1.368122534901E+01 7.190041099394E-01 -1.375847867975E-02 1.144569770287E-04 -3.510937763563E-07
i = 2 1.088242197556E-02 -5.822563870589E-04 1.129664782724E-05 -9.509275265084E-08 2.947408042591E-10
i = 3 -3.656121902292E-06 1.983004072964E-07 -3.891184418884E-09 3.307620888515E-11 -1.033967772429E-13
i = 4 4.417767673217E-10 -2.421433148415E-11 4.794911887275E-13 -4.108132683234E-15 1.293086605549E-17
Table 1b. Value of bij Coefficients in Eq. 3 for Pressure > 3000 Psia
bi0 bi1 bi2 bi3 bi4
i = 0 4.712595966358E+01 3.985400826702E-01 -6.299861328997E-03 1.969437514939E-04 -1.167053359820E-06
i = 1 -4.421593189998E-03 1.633856649659E-05 2.336344781141E-06 -1.054878705872E-07 6.608490190604E-10
i = 2 9.288489974773E-07 -1.807012131951E-08 -2.879467317759E-10 2.123467140063E-11 -1.404399364633E-13
i = 3 -1.015878448361E-10 2.862357408637E-12 8.049791650762E-15 -1.892828262872E-15 1.321509550066E-17
i = 4 4.104660234743E-15 -1.368232654076E-16 3.486930524614E-19 6.294762062534E-20 -4.634436088593E-22
Fig. (1). Prediction of carbon dioxide entropy by Eq. 2 for pressure = 1100 – 9000 psia and temperature = 40 – 100 °C.
40
50
60
70
80
90
100
0
20
40
60
80
100
Entropy (J/m
ol/K)
Pressure (psia)
CO2 Entropy
0‐20 20‐40 40‐60 60‐80 80‐100

New Correlations for Predicting the Thermodynamic Properties The Open Petroleum Engineering Journal, 2012, Volume 5 45
u = E0 + E1p + E2p2 + E3p
3 + E4p
4 (6)
where the carbon dioxide internal energy (u) is in KJ/mol, pressure (p) in psia, while the correlation coefficients E0, E1, E2, E3 and E4 can be assessed by the following equation:
Ei = fi0 + fi1T + fi2T2 + fi3T
3 + fi4T
4 (i = 0, 1, 2, 3, 4) (7)
where the temperature (T) in Eq. 7 is given in Celsius (Celsius = Kelvin – 273.15).
The values for the correlation coefficients – fij (i = 0, 1, 2, 3, 4; j = 0, 1, 2, 3, 4) – listed in Eq. 7 are shown in Table
3a for pressure less than 3000 psia and Table 3b for pressure larger than 3000 psia.
The carbon dioxide internal energy as predicted by the new correlation (Eq. 6) is displayed in Fig. (3). It can be observed that carbon dioxide internal energy decreases with pressure for a fixed temperature, while it slightly increases with temperature for a fixed pressure.
3.4. New Thermal Conductivity Correlation
The new correlation for carbon dioxide thermal conductivity takes a similar form as Eq. 2, Eq. 4 and Eq. 6:
Table 2a. Value of dij Coefficients in Eq. 5 for Pressure < 3000 Psia
di0 di1 di2 di3 di4
i = 0 1.909709786001E+03 -9.735735327726E+01 1.826927368615E+00 -1.490647885228E-02 4.487759324938E-05
i = 1 -4.302252688629E+00 2.257590837017E-01 -4.301286641750E-03 3.559896533439E-05 -1.086017277189E-07
i = 2 3.432036044200E-03 -1.834231755466E-04 3.546229659573E-06 -2.972366988229E-08 9.170643670878E-11
i = 3 -1.155832671093E-06 6.264501322661E-08 -1.225764090932E-09 1.038172595067E-11 -3.232655924083E-14
i = 4 1.399404590585E-10 -7.667282661821E-12 1.514718363730E-13 -1.293752011573E-15 4.058434867693E-18
Table 2b. Value of dij Coefficients in Eq. 5 for Pressure > 3000 Psia
di0 di1 di2 di3 di4
i = 0 7.543516742413E+00 2.526799076409E-01 -5.522722433539E-03 1.037765819161E-04 -5.297514351649E-07
i = 1 3.448049678082E-04 -8.497692480788E-05 3.083843258731E-06 -5.953054755232E-08 3.098847968705E-10
i = 2 -4.110311141759E-08 1.587023829809E-08 -6.443245274754E-10 1.282689478583E-11 -6.796755799505E-14
i = 3 2.335052739149E-12 -1.340783576432E-12 5.953698021537E-14 -1.223812291463E-15 6.586961442865E-18
i = 4 -1.524398124291E-17 4.235644641502E-17 -2.046347362492E-18 4.344887755222E-20 -2.371569820506E-22
Fig. (2). Prediction of carbon dioxide enthalpy by Eq. 4 for pressure = 1100 – 9000 psia and temperature = 40 – 100 °C.
40
50
60
70
80
90
100
0
5
10
15
20
25
Enthalpy (KJ/mol)
Pressure (psia)
CO2 Enthalpy
0‐5 5‐10 10‐15 15‐20 20‐25

46 The Open Petroleum Engineering Journal, 2012, Volume 5 Liang-Biao Ouyang
k = G0 + G1p + G2p2 + G3p
3 + G4p
4 (8)
where the carbon dioxide thermal conductivity (k) is in W/(m*K), pressure (p) in psia, and correlation coefficients G0, G1, G2, G3 and G4 can be calculated as follows:
Gi = mi0 + mi1T + mi2T2 + mi3T
3 + mi4T
4 (i = 0, 1, 2, 3, 4) (9)
The correlation coefficients – mij (i = 0, 1, 2, 3, 4; j = 0, 1, 2, 3, 4) – are tabulated below in Table 4.
The carbon dioxide thermal conductivity as calculated by the new correlation (Eq. 8) is shown in Fig. (4) for pressure
and temperature ranges expected for typical carbon capture and sequestration (CCS) operations. It can be clearly seen that carbon dioxide thermal conductivity increases with pressure at a specific temperature, whereas it slightly varies with temperature for a fixed pressure.
3.5. New Joule-Thomson Coefficient Correlation
The new correlation for carbon dioxide Joule-Thomson coefficient is given below:
CJ-T = N0 + N1p + N2p2 + N3p
3 + N4p
4 (10)
Table 3a. Value of fij Coefficients in Eq. 7 for Pressure < 3000 Psia
fi0 fi1 fi2 fi3 fi4
i = 0 1.784994814705E+03 -9.332202581583E+01 1.793729918821E+00 -1.497976889705E-02 4.611519170496E-05
i = 1 -3.971082324305E+00 2.130395621165E-01 -4.145651899881E-03 3.500476130251E-05 -1.088198402154E-07
i = 2 3.134747027972E-03 -1.708683784012E-04 3.366368153217E-06 -2.871896664890E-08 9.007159772292E-11
i = 3 -1.046616059717E-06 5.774880290587E-08 -1.149472986090E-09 9.891917115168E-12 -3.125606472394E-14
i = 4 1.258115434827E-10 -7.007954809653E-12 1.406524667212E-13 -1.219056858933E-15 3.875613179666E-18
Table 3b. Value of fij Coefficients in Eq. 7 for Pressure > 3000 Psia
fi0 fi1 fi2 fi3 fi4
i = 0 1.054853687907E+01 3.849151687859E-02 -1.464704376586E-05 4.058213911884E-05 -2.926902840962E-07
i = 1 -1.848414754186E-03 4.626948387540E-05 -3.443660149795E-07 -2.055433727857E-08 1.624822732898E-10
i = 2 3.985776793224E-07 -1.428900092169E-08 1.406656392613E-10 3.916580397849E-12 -3.406938250190E-14
i = 3 -4.106361669592E-11 1.660471552499E-12 -1.863584637344E-14 -3.353792303127E-16 3.189594629284E-18
i = 4 1.556770730683E-15 -6.678951914628E-17 8.046832948512E-19 1.094046691668E-20 -1.122206541924E-22
Fig. (3). Prediction of carbon dioxide internal energy by Eq. 6 for pressure = 1100 – 9000 psia and temperature = 40 – 100 °C.

New Correlations for Predicting the Thermodynamic Properties The Open Petroleum Engineering Journal, 2012, Volume 5 47
where the carbon dioxide Joule-Thomson coefficient (CJ-T) is in F/psi, pressure (p) in psia, and correlation coefficients N0, N1, N2, N3 and N4 can be determined by the following equation:
Ni = qi0 + qi1T + qi2T2 + qi3T
3 + qi4T
4 (i = 0, 1, 2, 3, 4) (11)
Note that the temperature (T) in Eq. 11 should be in Celsius (Celsius = Kelvin – 273.15).
Table 4. Value of mij Coefficients in Eq. 9
mi0 mi1 mi2 mi3 mi4
i = 0 9.859639572733E-01 -5.503641864344E-02 1.057381020708E-03 -8.653773289916E-06 2.607146719869E-08
i = 1 -8.219651988122E-04 5.199181579899E-05 -1.048105893468E-06 8.823897953704E-09 -2.706470092326E-11
i = 2 2.622601305269E-07 -1.657328960394E-08 3.402817642542E-10 -2.907643931825E-12 9.015692452402E-15
i = 3 -3.381016445331E-11 2.147179067610E-12 -4.458031806753E-14 3.845649305052E-16 -1.201102332048E-18
i = 4 1.536208590758E-15 -9.799515356723E-17 2.051753162406E-18 -1.783790285298E-20 5.608187118410E-23
Fig. (4). Prediction of carbon dioxide thermal conductivity by Eq. 8 for pressure = 1100 – 9000 psia and temperature = 40 – 100 °C.
Table 5a. Value of qij Coefficients in Eq. 11 for Pressure < 3000 Psia
qi0 qi1 qi2 qi3 qi4
i = 0 4.165030326807E+01 -2.251755282636E+00 4.423063074309E-02 -3.768490990635E-04 1.181443277790E-06
i = 1 -9.159227124874E-02 5.035008824253E-03 -9.999041122640E-05 8.593913908160E-07 -2.713998855330E-09
i = 2 7.138318487692E-05 -3.976742117066E-06 7.979603198994E-08 -6.915892955989E-10 2.199269385704E-12
i = 3 -2.359363648772E-08 1.328265886389E-09 -2.688733591922E-11 2.347311752853E-13 -7.509927215067E-16
i = 4 2.813429339184E-12 -1.597105338537E-13 3.256372221280E-15 -2.860273512404E-17 9.198255600918E-20
Table 5b. Value of qij Coefficients in Eq. 11 for Pressure > 3000 Psia
qi0 qi1 qi2 qi3 qi4
i = 0 1.733047857755E-02 4.310564795388E-04 -3.749682916813E-05 1.111747233810E-06 -6.413539797295E-09
i = 1 -1.336493223759E-05 2.488673025973E-08 1.801603865753E-08 -6.180150224206E-10 3.703378710250E-12
i = 2 3.346590736653E-09 -4.515525196201E-11 -3.317550227431E-12 1.309715181061E-13 -8.083127483764E-16
i = 3 -3.584257959718E-13 6.987669216580E-15 2.794243276559E-16 -1.244129779662E-17 7.846085323558E-20
i = 4 1.383422990403E-17 -3.160391166699E-19 -9.079433654777E-21 4.440970854204E-22 -2.843750411898E-24

48 The Open Petroleum Engineering Journal, 2012, Volume 5 Liang-Biao Ouyang
The correlation coefficients – qij (i = 0, 1, 2, 3, 4; j = 0, 1, 2, 3, 4) – as required in Eq. 11 are listed in Table 5a for pressure less than 3000 psia and Table 5b for pressure larger than 3000 psia.
Fig. (5) shows the carbon dioxide Joule-Thomson coefficient as predicted by the new correlation (Eq. 10). At a specific temperature, the carbon dioxide Joule-Thomson coefficient decreases with pressure although the amplitude of decrease reduces significantly as pressure increases. At high pressure (e.g., pressure > 7500 psia at 60 °C), the Joule-Thomson coefficient becomes negative, indicating Joule-Thomson heating behaviors (carbon dioxide behaves like liquid from Joule-Thomson effect perspective). In addition, the Joule-Thomson coefficient does not change substantially with temperature for a given pressure.
3.6. New Speed of sound Correlation
The new correlation for carbon dioxide speed of sound follows a similar form as Eq. 2, Eq. 4, Eq. 6, and Eq. 10:
Vs = X0 + X1p + X2p2 + X3p
3 + X4p
4 (12)
where the carbon dioxide speed of sound (Vs) is defined in m/s, pressure (p) in psia, and correlation coefficients X0, X1, X2, X3 and X4 can be obtained by the following equation:
Xi = yi0 + yi1T + yi2T2 + yi3T
3 + yi4T
4 (i = 0, 1, 2, 3, 4) (13)
where temperature T is given in Celsius (Celsius = Kelvin – 273.15).
The values for the correlation coefficients – yij (i = 0, 1, 2, 3, 4; j = 0, 1, 2, 3, 4) – shown in Eq. 13 are given in
Fig. (5). Prediction of carbon dioxide Joule-Thomson coefficient by Eq. 10 for pressure = 1100 – 9000 psia and temperature = 40 – 100 °C.
Table 6a. Value of yij Coefficients in Eq. 13 for Pressure < 3000 Psia
yi0 yi1 yi2 yi3 yi4
i = 0 -7.329081178316E+04 4.686854779298E+03 -1.049632252705E+02 9.961664858070E-01 -3.417203720237E-03
i = 1 1.445836614109E+02 -9.400981980516E+00 2.134769687079E-01 -2.046105422794E-03 7.070359154405E-06
i = 2 -1.001276776128E-01 6.651676879991E-03 -1.533830185110E-04 1.486566142878E-06 -5.179552634960E-09
i = 3 2.953760232881E-05 -2.000758484726E-06 4.681001240750E-08 -4.585704860333E-10 1.610747537672E-12
i = 4 -3.161823005368E-09 2.181538357413E-10 -5.173548635232E-12 5.119275636059E-14 -1.811843347520E-16
Table 6b. Value of yij Coefficients in Eq. 13 for Pressure > 3000 Psia
yi0 yi1 yi2 yi3 yi4
i = 0 -2.312012248621E+02 4.910852228075E+01 -1.650294095339E+00 1.831822376732E-02 -6.470157577372E-05
i = 1 5.389420189427E-01 -3.278592967143E-02 9.920015776806E-04 -1.105383480085E-05 3.980915640002E-08
i = 2 -1.062520118939E-04 7.377645026440E-06 -2.210521531856E-07 2.483246299627E-09 -9.060392832919E-12
i = 3 1.004723342181E-08 -7.233607881875E-10 2.164884949955E-11 -2.448415462562E-13 9.015367881338E-16
i = 4 -3.574241806794E-13 2.620284012473E-14 -7.852174521438E-16 8.928984861565E-18 -3.309868474193E-20
New Correlations for Predicting the Thermodynamic Properties The Open Petroleum Engineering Journal, 2012, Volume 5 49
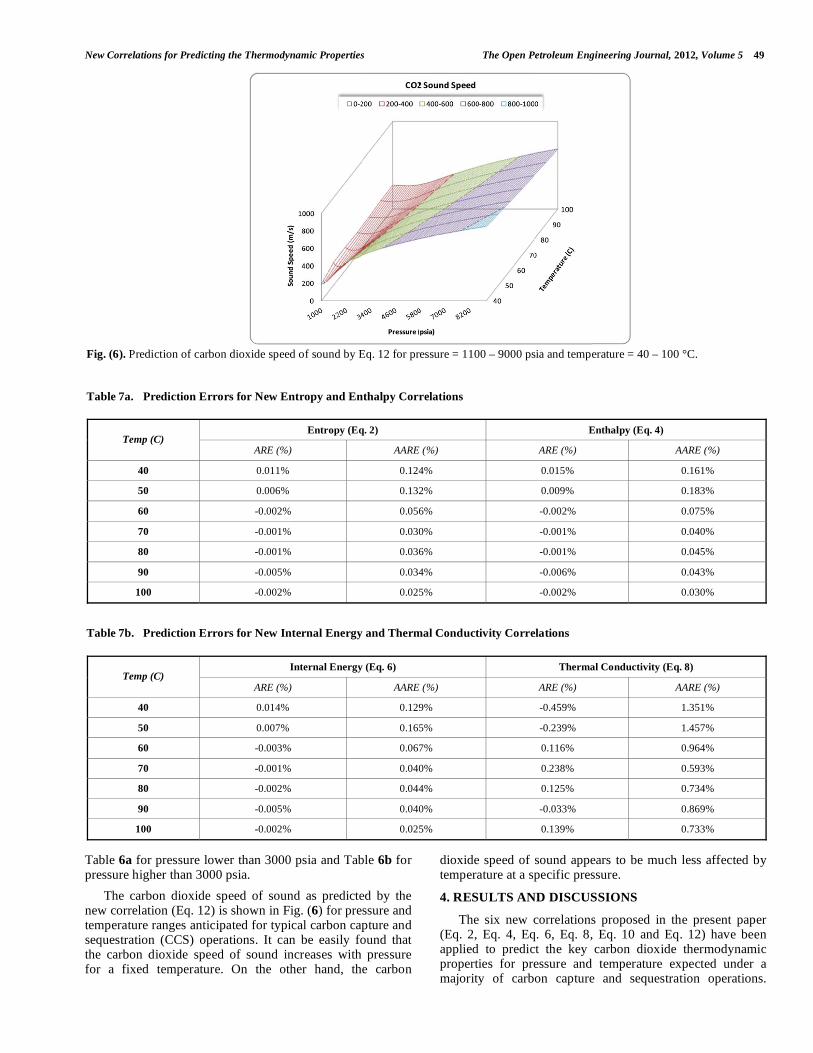
Table 6a for pressure lower than 3000 psia and Table 6b for pressure higher than 3000 psia.
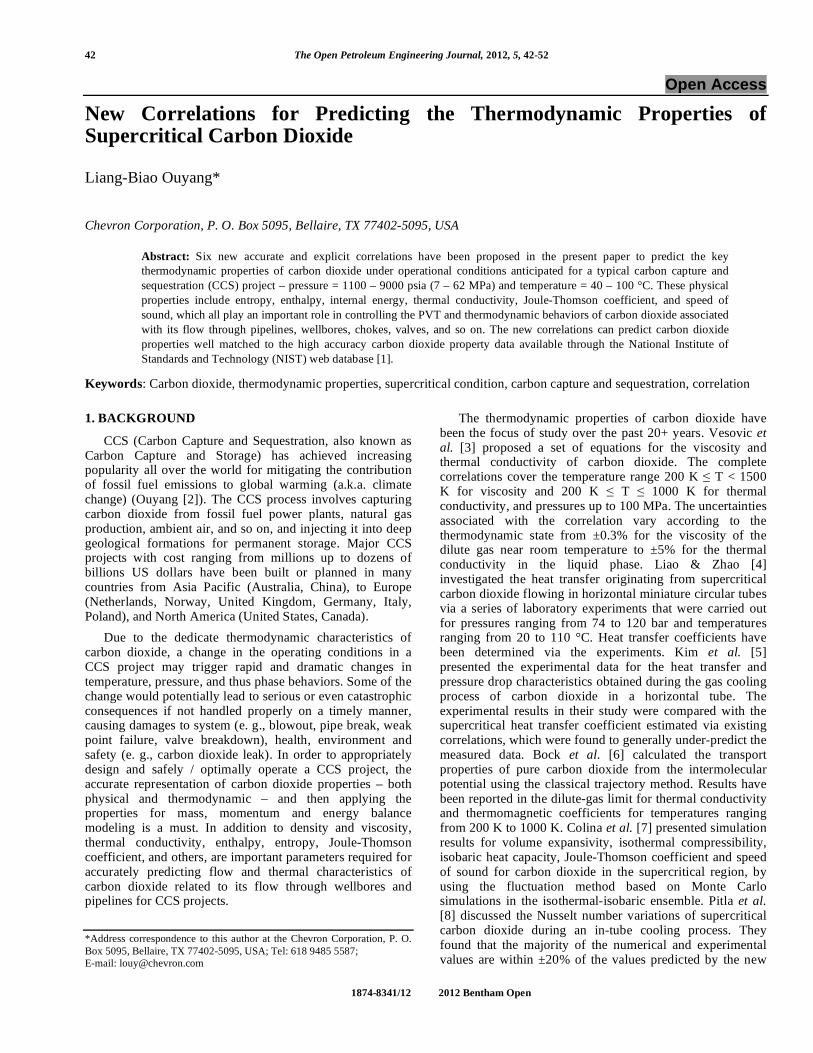
The carbon dioxide speed of sound as predicted by the new correlation (Eq. 12) is shown in Fig. (6) for pressure and temperature ranges anticipated for typical carbon capture and sequestration (CCS) operations. It can be easily found that the carbon dioxide speed of sound increases with pressure for a fixed temperature. On the other hand, the carbon
dioxide speed of sound appears to be much less affected by temperature at a specific pressure.
4. RESULTS AND DISCUSSIONS
The six new correlations proposed in the present paper (Eq. 2, Eq. 4, Eq. 6, Eq. 8, Eq. 10 and Eq. 12) have been applied to predict the key carbon dioxide thermodynamic properties for pressure and temperature expected under a majority of carbon capture and sequestration operations.
Fig. (6). Prediction of carbon dioxide speed of sound by Eq. 12 for pressure = 1100 – 9000 psia and temperature = 40 – 100 °C.
Table 7a. Prediction Errors for New Entropy and Enthalpy Correlations
Entropy (Eq. 2) Enthalpy (Eq. 4) Temp (C)
ARE (%) AARE (%) ARE (%) AARE (%)
40 0.011% 0.124% 0.015% 0.161%
50 0.006% 0.132% 0.009% 0.183%
60 -0.002% 0.056% -0.002% 0.075%
70 -0.001% 0.030% -0.001% 0.040%
80 -0.001% 0.036% -0.001% 0.045%
90 -0.005% 0.034% -0.006% 0.043%
100 -0.002% 0.025% -0.002% 0.030%
Table 7b. Prediction Errors for New Internal Energy and Thermal Conductivity Correlations
Internal Energy (Eq. 6) Thermal Conductivity (Eq. 8) Temp (C)
ARE (%) AARE (%) ARE (%) AARE (%)
40 0.014% 0.129% -0.459% 1.351%
50 0.007% 0.165% -0.239% 1.457%
60 -0.003% 0.067% 0.116% 0.964%
70 -0.001% 0.040% 0.238% 0.593%
80 -0.002% 0.044% 0.125% 0.734%
90 -0.005% 0.040% -0.033% 0.869%
100 -0.002% 0.025% 0.139% 0.733%

50 The Open Petroleum Engineering Journal, 2012, Volume 5 Liang-Biao Ouyang
Comparison with data from the NIST web database [1] has been performed and the results shown in:
Fig. (7) for entropy as a function of pressure at different temperature ranging from 40 °C to 100 °C;
Fig. (8) for enthalpy as a function of pressure at different temperature ranging from 40 °C to 100 °C;
Fig. (9) for internal energy as a function of pressure at different temperature ranging from 40 °C to 100 °C;
Fig. (10) for thermal conductivity as a function of pressure at different temperature ranging from 40 °C to 100 °C;
Fig. (11) for Joule-Thomson coefficient as a function of pressure at different temperature ranging from 40 °C to 100 °C;
Fig. (12) for speed of sound as a function of pressure at different temperature ranging from 40 °C to 100 °C.
It can be clearly found that a good match to the NIST data has been achieved for the new correlations for all the temperatures investigated. Over the entire pressure range studied, the new correlation prediction follows the NIST data extremely well.
Tables 7a, 7b and 7c list the carbon dioxide thermodynamic property prediction errors for the new correlations (Eq. 2, Eq. 4, Eq. 6, Eq. 8, Eq. 10 and Eq. 12). Both the average relative error (ARE) and the average
absolute relative error (AARE) are evaluated. Except for the thermal conductivity, the AREs for the new correlations are within -0.01% and +0.08% range, whereas the AAREs are less than 0.5% for all the temperatures investigated. For thermal conductivity, the AREs for the new correlation ranges from -0.5% to 0.3%, whereas the AAREs are less than 1.5% for all the temperatures studied.
Fig. (8). Carbon dioxide enthalpy changes with pressure at different
temperatures.
Table 7c. Prediction Errors for New Joule-Thomson Coefficient and Speed of Sound Correlations
Joule-Thomson Coefficient (Eq. 10) Speed of sound (Eq. 12) Temp (C)
ARE (%) AARE (%) ARE (%) AARE (%)
40 0.004% 0.028% 0.072% 0.465%
50 0.000% 0.049% 0.011% 0.221%
60 -0.001% 0.018% 0.011% 0.219%
70 0.000% 0.013% -0.002% 0.090%
80 -0.001% 0.013% -0.004% 0.081%
90 -0.001% 0.013% 0.003% 0.079%
100 -0.001% 0.009% -0.009% 0.050%
Fig. (7). Carbon dioxide entropy changes with pressure at different temperatures.
0
10
20
30
40
50
60
70
80
90
100
0 2000 4000 6000 8000 10000
Entropy (J/(mol*K))
Pressure (psi)
NIST ‐ 40 C New Correlation ‐ 40 C
NIST ‐ 70 C New Correlation ‐ 70 C
NIST ‐ 100 C New Correlation ‐ 100 C
0
5
10
15
20
25
0 2000 4000 6000 8000 10000
Enthalpy (KJ/mol)
Pressure (psi)
NIST ‐ 40 C New Correlation ‐ 40 C
NIST ‐ 70 C New Correlation ‐ 70 C
NIST ‐ 100 C New Correlation ‐ 100 C

New Correlations for Predicting the Thermodynamic Properties The Open Petroleum Engineering Journal, 2012, Volume 5 51
Fig. (9). Carbon dioxide internal energy changes with pressure at
different temperatures.
Fig. (10). Carbon dioxide thermal conductivity changes with
pressure at different temperatures.
Fig. (11). Carbon dioxide Joule-Thomson coefficient changes with
pressure at different temperatures.
5. CONCLUDING REMARKS
New simple yet accurate correlations have been developed for predicting the key carbon dioxide thermodynamic properties – entropy, enthalpy, internal energy, thermal conductivity, Joule-Thomson coefficient,
and speed of sound – under carbon capture and sequestration (CCS) operating conditions. The correlations have predicted carbon thermodynamic properties well matched to those available in the NIST web database [1].
Note that the correlations have been specifically developed based on the assumption that they are to be applied at pressure and temperature conditions expected in a CCS process; therefore, caution should be exercised for circumstances where the correlations are to be used for pressure and temperature sitting beyond the designed ranges.
Fig. (12). Carbon dioxide speed of sound changes with pressure at different temperatures.
CONFLICT OF INTEREST
Declared none.
ACKNOWLEDGEMENT
Declared none.
REFERENCE
[1] Available from: http://webbook.nist.gov/chemistry/ [2] L-B. Ouyang, “New correlations for predicting the density and
viscosity of supercritical carbon dioxide under conditions expected in carbon capture and sequestration operations”, Open Pet. Eng. J,
vol. 4, pp. 13-21, 2011. [3] V. Vesovic, W. A. Wakeham, G. A. Olchowy, J. V. Sengers, J. T.
R. Watson, and J. Millat, “The transport properties of carbon dioxide”, J. Phys. Chem. Ref. Data, vol. 19, pp. 763-808, 1990.
[4] S. M. Liao, and T. S. Zhao, “An experimental investigation of convection heat transfer to supercritical carbon dioxide in miniature
tubes”, Int. J. Heat Mass Tranf., vol. 45, no. 25, pp. 5025-5034, 2002.
[5] S. H. Yoon, J. H. Kim, Y. W. Hwang, M. S. Kim, K. Min, and Y. Kim, “Heat transfer and pressure drop characteristics during the in-
tube cooling process of carbon dioxide in the supercritical region”, Int. J. Refrig., vol. 26, no. 8, pp. 857-864, 2003.
[6] S. Bock, E. Bich, E. Vogel, A. S. Dickinson, and V. Vesovic, “Calculation of the transport properties of carbon dioxide. II.
Thermal conductivity and thermomagnetic effects”, J. Chem. Phys. vol. 120, pp. 7987-7997, 2004.
[7] C. M. Colina, C. G. Olivera-Fuentes, F. R. Siperstein, M. Lisa, and K. E. Gubbins, “Thermal properties of supercritical carbon dioxide
by Monte Carlo simulations”, Mol. Simul., vol. 29, no. 6 & 7, pp. 405-412, 2003.
[8] S. S. Pitla, E. A. Groll, and S. Ramadhyani, “New correlation to predict the heat transfer coefficient during in-tube cooling of
turbulent supercritical CO2”, Int. J. Refrig., vol. 25, no. 7, pp. 887-895, 2004.
[9] A. Bahadori, and H. B. Vuthaluru, “A Simple Method for Prediction of Transport Properties of Carbon Dioxide”, SPE
0
5
10
15
20
25
0 2000 4000 6000 8000 10000
Internal Energy (KJ/mol)
Pressure (psi)
NIST ‐ 40 C New Correlation ‐ 40 C
NIST ‐ 70 C New Correlation ‐ 70 C
NIST ‐ 100 C New Correlation ‐ 100 C
0.00
0.02
0.04
0.06
0.08
0.10
0.12
0.14
0.16
0 2000 4000 6000 8000 10000
Therm
al Conductivity (W/m
*K)
Pressure (psi)
NIST ‐ 40 C New Correlation ‐ 40 C
NIST ‐ 70 C New Correlation ‐ 70 C
NIST ‐ 100 C New Correlation ‐ 100 C
‐0.02
0.00
0.02
0.04
0.06
0.08
0.10
0 2000 4000 6000 8000 10000
J‐T Coefficient (F/psi)
Pressure (psi)
NIST ‐ 40 C New Correlation ‐ 40 C
NIST ‐ 70 C New Correlation ‐ 70 C
NIST ‐ 100 C New Correlation ‐ 100 C
0
100
200
300
400
500
600
700
800
900
0 2000 4000 6000 8000 10000
Sound Speed (m
/s)
Pressure (psi)
NIST ‐ 40 C New Correlation ‐ 40 C
NIST ‐ 70 C New Correlation ‐ 70 C
NIST ‐ 100 C New Correlation ‐ 100 C

52 The Open Petroleum Engineering Journal, 2012, Volume 5 Liang-Biao Ouyang
122859, Asia Pacific Health, Safety, Security and Environment
Conference, Aug 4-6, 2009, Jakarta, Indonesia 2009. [10] D. Y. Peng, and D. B. Robinson, “A new two-constant equation of
state”, Ind. Eng. Chem. Fundam., vol. 15, no. 1, p. 59, 1976. [11] O. Redlich, and J.N. S. Kwong, “On the thermodynamics of
solutions. V. An equation of state. Fugacities of gaseous solutions”, Chem. Rev., vol. 44, no. 2, p. 233, 1949.
[12] G. Soave, “Equilibrium constants from a modified Redlich-Kwong equation of state”, Chem. Eng. Sci., vol. 27, p. 1197, 1972.
[13] R. Span, and W. Wagner, “A new equation of state for carbon dioxide covering the fluid region from the triple-point temperature
to 1100K at pressures up to 800 MPa”, J. Phys. Chem. Ref. Data,
vol. 25, pp. 1509-1596, 1999. [14] H. Hassanzadeh, M. Pooladi-Darvish, A. M. Elsharkawy, D. W.
Keith, and Y. Leonenko, “Predicting PVT data for CO2-brine mixtures for black oil simulation of CO2 geological storage”, Int. J.
Greenhouse Gas Conrol, vol. 2, pp. 65-77, 2008. [15] A. Fenghour, W. A. Wakeham, and V. Vesovic, “The viscosity of
carbon dioxide”, J. Phys. Chem. Ref. Data, vol. 27, no. 1, pp. 31-44, 1998.
[16] J. F. Ely, J. W. Magee, and W. M. Haynes, “Thermophysical properties for special high CO2 content mixtures”, Research
Report RR-110, Gas Processors Association, Tulsa, OK, 1987.
Received: March 06, 2012 Revised: April 26, 2012 Accepted: May 16, 2012
© Liang-Biao Ouyang; Licensee Bentham Open.
This is an open access article licensed under the terms of the Creative Commons Attribution Non-Commercial License (http://creativecommons.org/-
licenses/by-nc/3.0/) which permits unrestricted, non-commercial use, distribution and reproduction in any medium, provided the work is properly cited.