
Open Access - Microbial Cell Factories
14
RESEARCH Open Access A low-cost, multiplexable, automated flow cytometry procedure for the characterization of microbial stress dynamics in bioreactors Alison Brognaux 1,2 , Shanshan Han 3 , Søren J Sørensen 3 , Frédéric Lebeau 4 , Philippe Thonart 1 and Frank Delvigne 1* Abstract Background: Microbial cell population heterogeneity is now recognized as a major source of issues in the development and optimization of bioprocesses. Even if single cell technologies are available for the study of microbial population heterogeneity, only a few of these methods are available in order to study the dynamics of segregation directly in bioreactors. In this context, specific interfaces have been developed in order to connect a flow cytometer directly to a bioreactor for automated analyses. In this work, we propose a simplified version of such an interface and demonstrate its usefulness for multiplexed experiments. Results: A low-cost automated flow cytometer has been used in order to monitor the synthesis of a destabilized Green Fluorescent Protein (GFP) under the regulation of the fis promoter and propidium iodide (PI) uptake. The results obtained showed that the dynamics of GFP synthesis are complex and can be attributed to a complex set of biological parameters, i.e. on the one hand the release of protein into the extracellular medium and its uptake modifying the activity of the fis promoter, and on the other hand the stability of the GFP molecule itself, which can be attributed to the protease content and energy status of the cells. In this respect, multiplexed experiments have shown a correlation between heat shock and ATP content and the stability of the reporter molecule. Conclusion: This work demonstrates that a simplified version of on-line FC can be used at the process level or in a multiplexed version to investigate the dynamics of complex physiological mechanisms. In this respect, the determination of new on-line parameters derived from automated FC is of primary importance in order to fully integrate the power of FC in dedicated feedback control loops. Keywords: Automated flow cytometry, Phenotypic heterogeneity, Escherichia coli , Membrane permeability, Green fluorescent protein, Mini-bioreactors Background Clonal populations of microbial cells exhibit phenotypic heterogeneities due to environmental factors and even in homogenous environments, considering stochastic fluctua- tions at the level of biochemical reactions [1]. Microbial heterogeneity is governed by a complex set of intrinsic, ex- trinsic and external noise components that have been thor- oughly studied at the fundamental level [2-4] but only partially applied in the field of bioprocess engineering [5]. Indeed, even though the heterogeneity of microbial popu- lations has received a lot of attention over the past few years, the real impact of this phenomenon on microbial bioprocesses remains poorly understood. The main reason behind this lack of knowledge is the difficulty in monitor- ing microbial population heterogeneity in dynamic process conditions. In this respect, flow cytometry (FC) is a very powerful tool for following physiological properties of mi- crobial cells under process-related conditions [6]. The main advantage of this method is to provide information about the phenotypic heterogeneity of a microbial popula- tion. This information is critical from a bioprocess im- provement perspective since the appearance of an unwanted phenotype can impair its efficiency. Such phenomena have been recently been noted during culture of recombinant Pichia pastoris with the ap- pearance of a non-secreting phenotype [7]. However, * Correspondence: [email protected] 1 Unité de Bio-industries/CWBI, Gembloux Agro-Bio Tech, Université de Liège, Passage des Déportés 2, Gembloux 5030, Belgium Full list of author information is available at the end of the article © 2013 Brognaux et al.; licensee BioMed Central Ltd. This is an open access article distributed under the terms of the Creative Commons Attribution License (http://creativecommons.org/licenses/by/2.0), which permits unrestricted use, distribution, and reproduction in any medium, provided the original work is properly cited. Brognaux et al. Microbial Cell Factories 2013, 12:100 http://www.microbialcellfactories.com/content/12/1/100
Transcript of Open Access - Microbial Cell Factories
Brognaux et al. Microbial Cell Factories 2013, 12:100http://www.microbialcellfactories.com/content/12/1/100
RESEARCH Open Access
A low-cost, multiplexable, automated flowcytometry procedure for the characterization ofmicrobial stress dynamics in bioreactorsAlison Brognaux1,2, Shanshan Han3, Søren J Sørensen3, Frédéric Lebeau4, Philippe Thonart1 and Frank Delvigne1*
Abstract
Background: Microbial cell population heterogeneity is now recognized as a major source of issues in thedevelopment and optimization of bioprocesses. Even if single cell technologies are available for the study ofmicrobial population heterogeneity, only a few of these methods are available in order to study the dynamics ofsegregation directly in bioreactors. In this context, specific interfaces have been developed in order to connect aflow cytometer directly to a bioreactor for automated analyses. In this work, we propose a simplified version ofsuch an interface and demonstrate its usefulness for multiplexed experiments.
Results: A low-cost automated flow cytometer has been used in order to monitor the synthesis of a destabilized GreenFluorescent Protein (GFP) under the regulation of the fis promoter and propidium iodide (PI) uptake. The results obtainedshowed that the dynamics of GFP synthesis are complex and can be attributed to a complex set of biological parameters,i.e. on the one hand the release of protein into the extracellular medium and its uptake modifying the activity of the fispromoter, and on the other hand the stability of the GFP molecule itself, which can be attributed to the protease contentand energy status of the cells. In this respect, multiplexed experiments have shown a correlation between heat shock andATP content and the stability of the reporter molecule.
Conclusion: This work demonstrates that a simplified version of on-line FC can be used at the process level or ina multiplexed version to investigate the dynamics of complex physiological mechanisms. In this respect, the determinationof new on-line parameters derived from automated FC is of primary importance in order to fully integrate the power of FCin dedicated feedback control loops.
Keywords: Automated flow cytometry, Phenotypic heterogeneity, Escherichia coli, Membrane permeability, Greenfluorescent protein, Mini-bioreactors
BackgroundClonal populations of microbial cells exhibit phenotypicheterogeneities due to environmental factors and even inhomogenous environments, considering stochastic fluctua-tions at the level of biochemical reactions [1]. Microbialheterogeneity is governed by a complex set of intrinsic, ex-trinsic and external noise components that have been thor-oughly studied at the fundamental level [2-4] but onlypartially applied in the field of bioprocess engineering [5].Indeed, even though the heterogeneity of microbial popu-lations has received a lot of attention over the past few
* Correspondence: [email protected]é de Bio-industries/CWBI, Gembloux Agro-Bio Tech, Université de Liège,Passage des Déportés 2, Gembloux 5030, BelgiumFull list of author information is available at the end of the article
© 2013 Brognaux et al.; licensee BioMed CentCommons Attribution License (http://creativecreproduction in any medium, provided the or
years, the real impact of this phenomenon on microbialbioprocesses remains poorly understood. The main reasonbehind this lack of knowledge is the difficulty in monitor-ing microbial population heterogeneity in dynamic processconditions. In this respect, flow cytometry (FC) is a verypowerful tool for following physiological properties of mi-crobial cells under process-related conditions [6]. Themain advantage of this method is to provide informationabout the phenotypic heterogeneity of a microbial popula-tion. This information is critical from a bioprocess im-provement perspective since the appearance of anunwanted phenotype can impair its efficiency. Suchphenomena have been recently been noted duringculture of recombinant Pichia pastoris with the ap-pearance of a non-secreting phenotype [7]. However,
ral Ltd. This is an open access article distributed under the terms of the Creativeommons.org/licenses/by/2.0), which permits unrestricted use, distribution, andiginal work is properly cited.
Brognaux et al. Microbial Cell Factories 2013, 12:100 Page 2 of 14http://www.microbialcellfactories.com/content/12/1/100
if many techniques are available for the determin-ation of cell physiology at a given moment in a cul-ture, dynamic evolution of microbial resistance tostress and adaptation is still poorly described. For thispurpose, an automated version of FC has been proposedfor on-line monitoring of cell population heterogeneityunder process-related conditions [8,9]. Specific interfacescomprising a mixing chamber where microbial cells arediluted prior to analysis and stained (if required) havebeen developed and commercialized. In this way, FC couldbe used for feedback control at the level of a bioreactorcontrol. Such application is of particular importance forthe optimization of bioprocesses based on recombinantmicroorganism. Indeed, the induction of protein synthesisis often performed by adding a high concentration of in-ducer molecule at a given moment of the culture. How-ever, this kind of protocol is known to induce a strongphysiological stress at the level of the host cell which inturn impairs bioprocess productivity [10]. In this case, on-line FC can be used in order to monitor the intracellularprotein synthesis at the single-cell level and the resultingsignal can be exploited in order to trigger the feeding ofan inducer. This kind of strategy has been previously in-vestigated at the lab-scale level, but no practical applica-tions are available at this time [11]. However, the use ofautomated FC is still largely underexploited in view of itspower in the context of bioprocess optimization. No ap-plication of this technique for bioreactor control could befound, except for one very basic application where au-tomated FC was used to control cell density inside achemostat (cytostat) [12]. The main reason limitingthe application of automated FC to microbial biopro-cesses is the necessity for a complex interface betweenthe FC and the bioreactor to be sampled. Commercialsystems, such as the Flowcytoprep (MSP corp, MN)device, are available but are generally expensive [13].In this work, we propose to use a benchtop Accuri flowcytometer as the basis for the design of an automated FC.This apparatus was recently tested on microbiologicalsamples and led to reliable results [14]. In addition, fluiddisplacement is ensured by peristaltic pumps, facilitatingthe set-up of an interface with a bioreactor since nopressurization of the sample is needed. The developmentof previous systems was indeed impaired by the need tomaintain pressure at the level of the sample unit [15-17].Under this condition, FC can be easily interfaced to a bio-reactor by using additional peristaltic pumps operated bya microcontroller. Sample dilution and staining is carriedout in line in the tubing between the FC and the bioreac-tor. This automated FC system was tested by followingthe dynamics of an Escherichia coli pfis::gfpAAV fluores-cent bio-reporter [18]. The reporter system consisted ofan E.coli strain carrying a growth dependent promoter, inthis case the fis promoter, fused to a gene expressing an
unstable variant of GFP. The pfis promoter is induced inearly stationary phase or when cells are shifted from lowto high substrate availability [19]. This reporter system isthus a good indicator of the nutrient status of the cells. In-deed, in a mixing-deficient bioreactor, zones with highand low nutrient availability can coexist and significantlyaffect microbial physiology [20]. In order to increasethe responsiveness of the reporter system, a destabi-lized gfpAAV variant exhibiting a half-life of less onehour was used [21]. The use of automated FC is thusparticularly useful for this application since off-linesampling would affect the quality of the results. Thecombined use of the pfis::gfpAAV bio-reporter with au-tomated FC was investigated for the first time. In asecond study, the automated FC interface was multi-plexed in order to monitor a platform of parallelizedbioreactors. The high-throughput effectiveness of mul-tiplexed FC was demonstrated by extracting dynamicdata, giving new insights about the behaviour of thegfpAAV molecule under bioprocess conditions.
Results and discussionFollowing fis::gfpAAV activity by automated FCIn order to assess the efficiency of the automated FCplatform, a first test was carried out on the basis of ourprevious results. Indeed, we have previously shown thatthe fis::gfpAAV system is strongly sensitive to substratelimitation and fluctuations [18], suggesting that this bio-reporter could be used to detect substrate concentrationgradients in heterogeneous bioreactors. In order to as-sess this sensitivity, a chemostat experiment followed bya series of glucose pulses was conducted and the re-sponse of the GFP bio-reporter was followed by auto-mated FC (Figure 1A). After an initial batch phase, achemostat mode was set up at a dilution rate (D) of0.14 h-1. After 43 hours of stabilization (correspondingto six residence times), glucose pulses were delivered ata given frequency. This latter phase can be visualized onthe basis of the dissolved oxygen profile (Figure 1B),which fluctuates according to the glucose pulses. Duringthe batch phase, GFP synthesis could be directly corre-lated to the growth rate by a relationship involving thesquare of the growth rate and known as the “mu square”rule [22]. This observation has previously been madewith off-line GFP samples [18] and could be more effi-ciently validated with a greater number of samplingpoints using the automated FC. When the system isshifted to the chemostat mode, the GFP level is stablefor a very short period of time (around 2 hours) andthen rises. This phenomenon was unexpected since GFPwould remain in steady-state if the activation of the fispromoter is effectively proportional to the growth rate,suggesting that additional physiological mechanisms areinvolved. In our previous studies, we have shown that

Figure 1 Follow-up of the cultivation of E. coli pfis::gfpAAV in a 2 L stirred bioreactor by automated FC. A: Monitoring GFP synthesisunder the control of the fis promoter by automated FC. Each point corresponds to the mean fluorescence recorded after analysing 40,000microbial cells B: The dissolved oxygen profile is shown in order to highlight the three distinct phases: batch, chemostat mode at D = 0.14 h-1
and chemostat mode at D = 0.14 h-1 with glucose pulses. The error bars displayed for the mean GFP fluorescence stand for two independentreplicates of the cultivation.
Brognaux et al. Microbial Cell Factories 2013, 12:100 Page 3 of 14http://www.microbialcellfactories.com/content/12/1/100
proteins are secreted to the extracellular medium whenmicrobial cells are exposed to prolonged substrate limi-tation [23,24]. This phenomenon has been reported byseveral authors and is generally termed protein leakage[25,26]. Since the fis promoter is known to be up-regulated when cells are shifted from minimal to richmedium conditions, this release of proteins could pos-sibly contribute to an increase in the pool of availableamino acids (a.a.) and thus turn the medium into a “richmedium” [19,27].A comparison between off-line and on-line samples
was performed and no significant differences were ob-served at the level of GFP synthesis (Additional file 1:Figure S1). Moreover, off-line analyses of extracellularproteins in supernatants confirmed the occurrence of pro-tein leakage during the chemostat phase at D = 0.14 h-1
(Additional file 2: Figure S2), potentially explaining therise in GFP synthesis during this phase according to ourhypothesis. Another hypothesis that can be advanced inorder to explain the GFP over-expression during thechemostat phase involves the characteristics of the GFPvariant itself. Indeed, GFPAAV exhibits a C-terminal tagrecognized by the ATP-dependent ClpXP machinery [21].The stability of the GFPAAV molecule is thus dependenton the protease content of the cells as well as on ATPavailability. These two factors, and particularly the ATPlevel [28], are known to fluctuate during bioreactor opera-tions, altering the degree of stability of the GFP. The risein the GFP signal observed during the chemostat phasecould thus also be explained by a decrease in the intracel-lular ATP pool fuelling the ClpXP protease complex. Un-fortunately, both hypotheses are strengthened by the fact
that the GFP signal decreases during the second phase ofthe chemostat phase (Figure 1, after 48 hours of culture).This observation can be explained either by down-regulation of the fis promoter and/or a decrease in thestability of the GFPAAV molecule after the ATP poolis refueled. An explanation about the respective contri-butions of the different above-mentioned mechanismscould thus be experimentally validated by a complexset of proteomic, transcriptomic and metabolomic pro-filing of the chemostat phase. In the context of thiswork, we demonstrate a multiplexed version of the au-tomated FC platform could also be used in order to de-cipher these dynamics. Prior to that, observationsabout secondary cytometric variables, i.e. PI uptake bythe cells, will be considered in the next section.
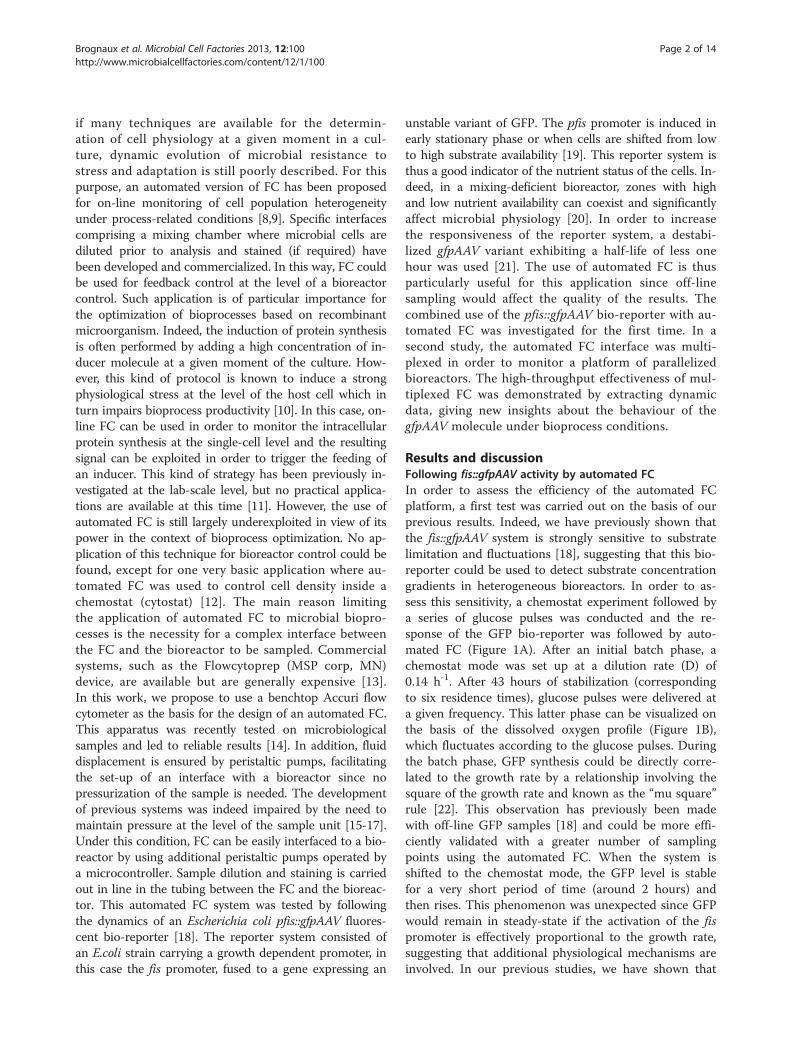
Substrate limitation induces a significant segregation ofthe population according to PI uptakeA significant segregation of the population was noted atthe level of the intensity of PI uptake (Figure 2). Whenthe bioreactor shifted from batch mode to chemostatmode, the microbial population was subjected to segre-gation. Indeed, at the beginning of the culture, no segre-gation could be observed and the majority of microbialcells were located in the R1 region according to theirlow PI uptake. However, during the chemostat phase,there was a progressive shift from the R1 region to theR2 region (Figure 2A). When the cells belonging to thisR2 subpopulation were sorted, they exhibited the samerecovery efficiency as the healthy R1 cells when cultivatedon petri dishes (results not shown). The R3 region identi-fied on the FC profiles corresponds to heat inactivated
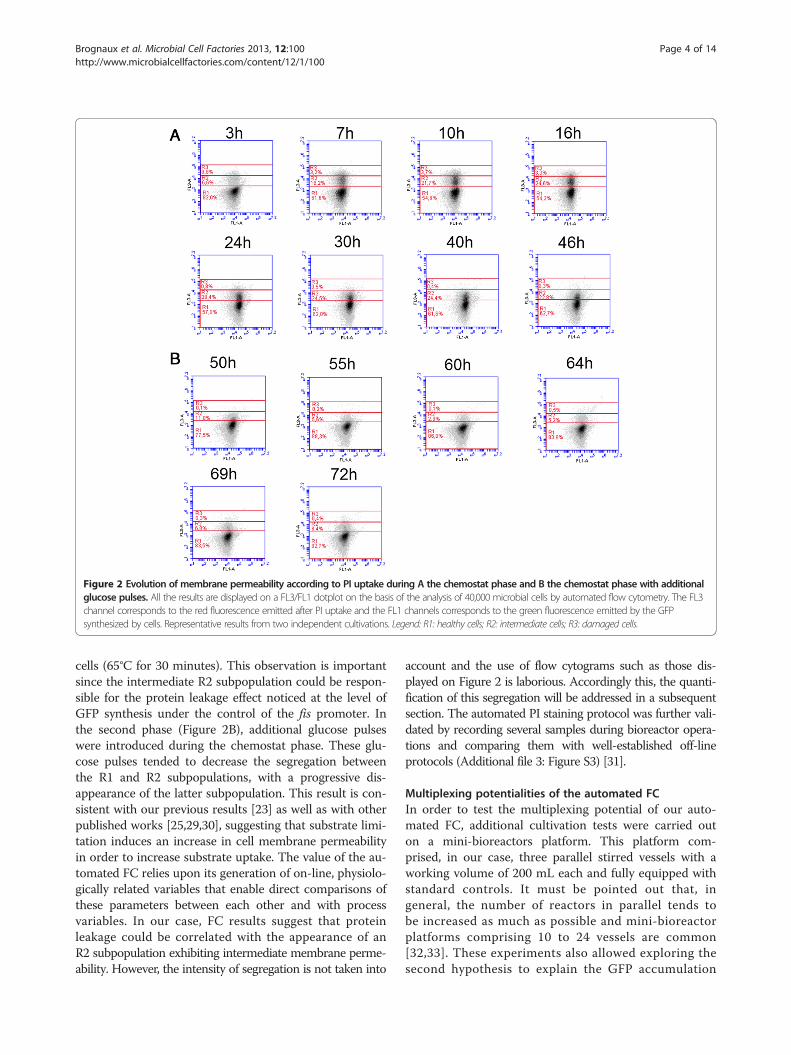
Figure 2 Evolution of membrane permeability according to PI uptake during A the chemostat phase and B the chemostat phase with additionalglucose pulses. All the results are displayed on a FL3/FL1 dotplot on the basis of the analysis of 40,000 microbial cells by automated flow cytometry. The FL3channel corresponds to the red fluorescence emitted after PI uptake and the FL1 channels corresponds to the green fluorescence emitted by the GFPsynthesized by cells. Representative results from two independent cultivations. Legend: R1: healthy cells; R2: intermediate cells; R3: damaged cells.
Brognaux et al. Microbial Cell Factories 2013, 12:100 Page 4 of 14http://www.microbialcellfactories.com/content/12/1/100
cells (65°C for 30 minutes). This observation is importantsince the intermediate R2 subpopulation could be respon-sible for the protein leakage effect noticed at the level ofGFP synthesis under the control of the fis promoter. Inthe second phase (Figure 2B), additional glucose pulseswere introduced during the chemostat phase. These glu-cose pulses tended to decrease the segregation betweenthe R1 and R2 subpopulations, with a progressive dis-appearance of the latter subpopulation. This result is con-sistent with our previous results [23] as well as with otherpublished works [25,29,30], suggesting that substrate limi-tation induces an increase in cell membrane permeabilityin order to increase substrate uptake. The value of the au-tomated FC relies upon its generation of on-line, physiolo-gically related variables that enable direct comparisons ofthese parameters between each other and with processvariables. In our case, FC results suggest that proteinleakage could be correlated with the appearance of anR2 subpopulation exhibiting intermediate membrane perme-ability. However, the intensity of segregation is not taken into
account and the use of flow cytograms such as those dis-played on Figure 2 is laborious. Accordingly this, the quanti-fication of this segregation will be addressed in a subsequentsection. The automated PI staining protocol was further vali-dated by recording several samples during bioreactor opera-tions and comparing them with well-established off-lineprotocols (Additional file 3: Figure S3) [31].
Multiplexing potentialities of the automated FCIn order to test the multiplexing potential of our auto-mated FC, additional cultivation tests were carried outon a mini-bioreactors platform. This platform com-prised, in our case, three parallel stirred vessels with aworking volume of 200 mL each and fully equipped withstandard controls. It must be pointed out that, ingeneral, the number of reactors in parallel tends tobe increased as much as possible and mini-bioreactorplatforms comprising 10 to 24 vessels are common[32,33]. These experiments also allowed exploring thesecond hypothesis to explain the GFP accumulation

Brognaux et al. Microbial Cell Factories 2013, 12:100 Page 5 of 14http://www.microbialcellfactories.com/content/12/1/100
under prolonged substrate limitation: a loss of capacity bythe cells to degrade the GFP protein. The aim of the ex-periments was to highlight the equilibrium between GFPcaused by fis induction, GFP degradation by proteases andthe activity of these proteases that are fuelled by ATP.In a first test, a simple biological test wa scarried out
with three parallel bioreactors running at three differenttemperatures: 30°C, 37°C end 42°C. At 42°C, the cellsexhibited the highest dissolved oxygen consumption(Figure 3B) and the highest growth rate (Figure 3A),while growth was significantly slowed at 30°C (see growthcurves and dissolved oxygen consumption Figure 3). Un-expectedly, the GFP signal, which depends on ribosomalactivity, decreased when the temperature was increased(Figure 3C). This observation can be explained accordingto the equilibrium between GFP synthesis, due to fis in-duction, and GFP degradation, linked to ATP-dependentproteases [34,35]. Indeed, a specific carboxyl-terminaloligopeptide extension had been added to render theGFP protein susceptible to degradation, since the nor-mal stability of GFP limits its use for studies of transi-ent gene expression. This tagged protein is recognizedand degraded by intracellular tail-specific proteases. Itcould be supposed that these proteases are more activeat 42°C. Indeed, many heat shock proteins are ATP-dependent proteases, and are induced by σ32 factor. At30°C, the level of intracellular σ32 is weak, while at 42°Cthis level increases transiently 15 to 20 fold over 5 minand then stabilizes at a level 2 to 3 fold higher than at30°C. However, these proteases requires a substantialamount of ATP to be active [36].A second test was then conducted with the three bio-
reactors in parallel in order to confirm this hypothesis.The three reactors were started at a temperature of30°C. After 4 h, the temperature was increased to 42°Cin order to induce a thermal shock and ATP-dependentprotease synthesis. In the second and the third bioreac-tors, an acetate pulse and a glucose pulse, respectively,were performed at the same time. In these reactors, theconsumption of acetate and glucose could be highlightedon-line according to the dissolved oxygen profile. Afterthe substrate pulse, the dissolved oxygen concentrationwas reduced compared to the reference reactor (no pulse),especially for the case where the glucose pulse had beenperformed (Figure 4B). In parallel, an obvious increase ingrowth was noticed in this reactor (Figure 4A). Moreover,in this case, a clear decrease in the GFP signal was noted:indeed, the proteases were massively synthesized at 42°Cbut required ATP to degrade GFP (Figure 4C). This ATPcould be produced via consumption of the added glucosethrough glycolysis and the Krebs cycle. The ATP concen-trations were followed in the three reactors in order toconfirm this hypothesis. The ATP levels were significantlyhigher in the reactor with the glucose pulse, i.e. they
increased from 4 h 30 min to 5 h and then decreased asATP was consumed by proteases degrading the GFP(Figure 5D). Moreover, when ATP was depleted, the mem-brane permeability increased significantly (Figure 5C). Thisphenomenon has been previously reported in the litera-ture, where ATP depletion has been correlated with a lossof cellular activity and viability under stress conditions[37,38]. Although these experiments cannot fully explainthe complex set of mechanism involved in the activation/deactivation of the pfis::gfpAAV bio-reporter, multiplexedFC demonstrated a clear correlation between GFP stabilityand ATP availability, suggesting that transcriptional controlof the fis promoter is not the only mechanism involved.This set of experiments demonstrated the value of using
a simple flow cytometer interface that can be multiplexedwith several bioreactors in order to perform high through-put experiments and gain insights at the level of complexbiological processes under dynamic conditions.
Towards a definition of variables for on-linecharacterization of population segregation in bioreactorsSince phenotypic heterogeneity is known to occur dur-ing bioprocesses, the use of FC as a single-cell sensor isa very promising alternative that has been consideredonly in a limited amount of studies. Indeed, automatedFC is still rarely used for bioprocess optimization con-sidering the difficulty in properly interfacing with theprocess equipment. On the other hand, significant ef-forts have been made toward the automated analysis ofFC data and, more particularly, for the description ofsub-populations by appropriate gating. However, thesealgorithms are not actually embedded in standard FCsoftware and the analysis must be performed a posteriori[39]. From the perspective of an application for bioreac-tor control this is an issue since the FC data have to beanalysed on-line in order to enable feedback regulation.As a first case study, PI uptake dynamics were followedmore in detail during the transition from the batch phaseto the chemostat phase, considering that a significant seg-regation of the microbial population according to PI up-take has been observed during this transition. Segregationcan be determined on the basis of the respective percent-ages belonging to two (or more) subpopulations. From amathematical perspective, it is possible to define a degreeof segregation varying from 0 (minimal segregation when100% of the cells are located in a single gate) to 1 (max-imal segregation when the cells are equally partitioned be-tween the two subpopulations) according to the relativepercentage of cells between the two states:
Degree of segregation ¼ 1− %R1−%R2j j
where %R1 is the percentage of PI negative cells and %R2the percentage of PI intermediate cells, whereas || stands

Figure 3 Follow-up of parallelized cultures of E. coli pfis::gfpAAV in 200 mL mini-bioreactors. The three different cultures have beencarried out in batch mode at three temperatures, 30°C, 37°C and 42°C, and monitored by automated flow cytometry. A: Evolution of opticaldensity at 600 nm. B: Recording of dissolved oxygen profiles. C: Monitoring of GFP signal under the control of the fis promoter and D: PI uptake,by automated flow cytometry. Cultures were performed in duplicate.
Brognaux et al. Microbial Cell Factories 2013, 12:100 Page 6 of 14http://www.microbialcellfactories.com/content/12/1/100
for the absolute value of the difference between the twopercentages.If we apply this principle to the data (Figure 6), max-
imum segregation is reached after 4 hours, in accord-ance with the transition from the batch culture to the
chemostat mode and with the evolution of the respectivepercentages in R1 and R2. However, this technique can-not be applied to the on-line treatment of FC data sinceit requires gating the results. Another way to analyse thedegree of the segregation is to look simultaneously at
Figure 4 (See legend on next page.)
Brognaux et al. Microbial Cell Factories 2013, 12:100 Page 7 of 14http://www.microbialcellfactories.com/content/12/1/100
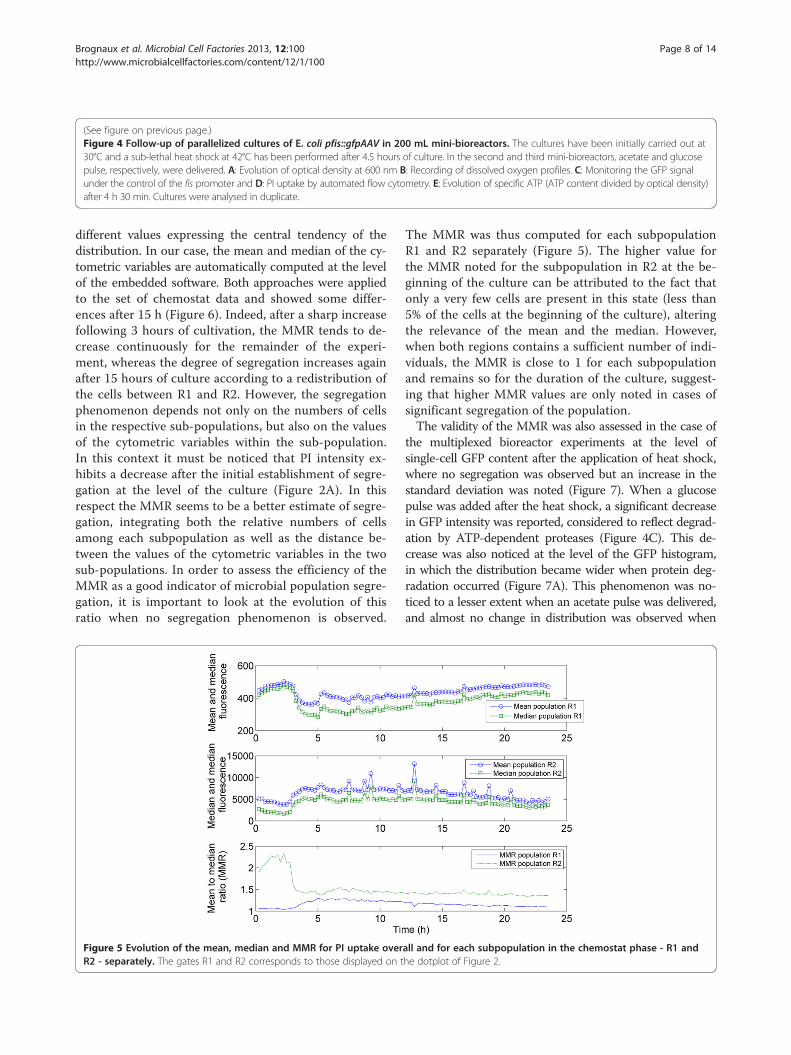
(See figure on previous page.)Figure 4 Follow-up of parallelized cultures of E. coli pfis::gfpAAV in 200 mL mini-bioreactors. The cultures have been initially carried out at30°C and a sub-lethal heat shock at 42°C has been performed after 4.5 hours of culture. In the second and third mini-bioreactors, acetate and glucosepulse, respectively, were delivered. A: Evolution of optical density at 600 nm B: Recording of dissolved oxygen profiles. C: Monitoring the GFP signalunder the control of the fis promoter and D: PI uptake by automated flow cytometry. E: Evolution of specific ATP (ATP content divided by optical density)after 4 h 30 min. Cultures were analysed in duplicate.
Brognaux et al. Microbial Cell Factories 2013, 12:100 Page 8 of 14http://www.microbialcellfactories.com/content/12/1/100
different values expressing the central tendency of thedistribution. In our case, the mean and median of the cy-tometric variables are automatically computed at the levelof the embedded software. Both approaches were appliedto the set of chemostat data and showed some differ-ences after 15 h (Figure 6). Indeed, after a sharp increasefollowing 3 hours of cultivation, the MMR tends to de-crease continuously for the remainder of the experi-ment, whereas the degree of segregation increases againafter 15 hours of culture according to a redistribution ofthe cells between R1 and R2. However, the segregationphenomenon depends not only on the numbers of cellsin the respective sub-populations, but also on the valuesof the cytometric variables within the sub-population.In this context it must be noticed that PI intensity ex-hibits a decrease after the initial establishment of segre-gation at the level of the culture (Figure 2A). In thisrespect the MMR seems to be a better estimate of segre-gation, integrating both the relative numbers of cellsamong each subpopulation as well as the distance be-tween the values of the cytometric variables in the twosub-populations. In order to assess the efficiency of theMMR as a good indicator of microbial population segre-gation, it is important to look at the evolution of thisratio when no segregation phenomenon is observed.
Figure 5 Evolution of the mean, median and MMR for PI uptake overR2 - separately. The gates R1 and R2 corresponds to those displayed on t
The MMR was thus computed for each subpopulationR1 and R2 separately (Figure 5). The higher value forthe MMR noted for the subpopulation in R2 at the be-ginning of the culture can be attributed to the fact thatonly a very few cells are present in this state (less than5% of the cells at the beginning of the culture), alteringthe relevance of the mean and the median. However,when both regions contains a sufficient number of indi-viduals, the MMR is close to 1 for each subpopulationand remains so for the duration of the culture, suggest-ing that higher MMR values are only noted in cases ofsignificant segregation of the population.The validity of the MMR was also assessed in the case of
the multiplexed bioreactor experiments at the level ofsingle-cell GFP content after the application of heat shock,where no segregation was observed but an increase in thestandard deviation was noted (Figure 7). When a glucosepulse was added after the heat shock, a significant decreasein GFP intensity was reported, considered to reflect degrad-ation by ATP-dependent proteases (Figure 4C). This de-crease was also noticed at the level of the GFP histogram,in which the distribution became wider when protein deg-radation occurred (Figure 7A). This phenomenon was no-ticed to a lesser extent when an acetate pulse was delivered,and almost no change in distribution was observed when
all and for each subpopulation in the chemostat phase - R1 andhe dotplot of Figure 2.
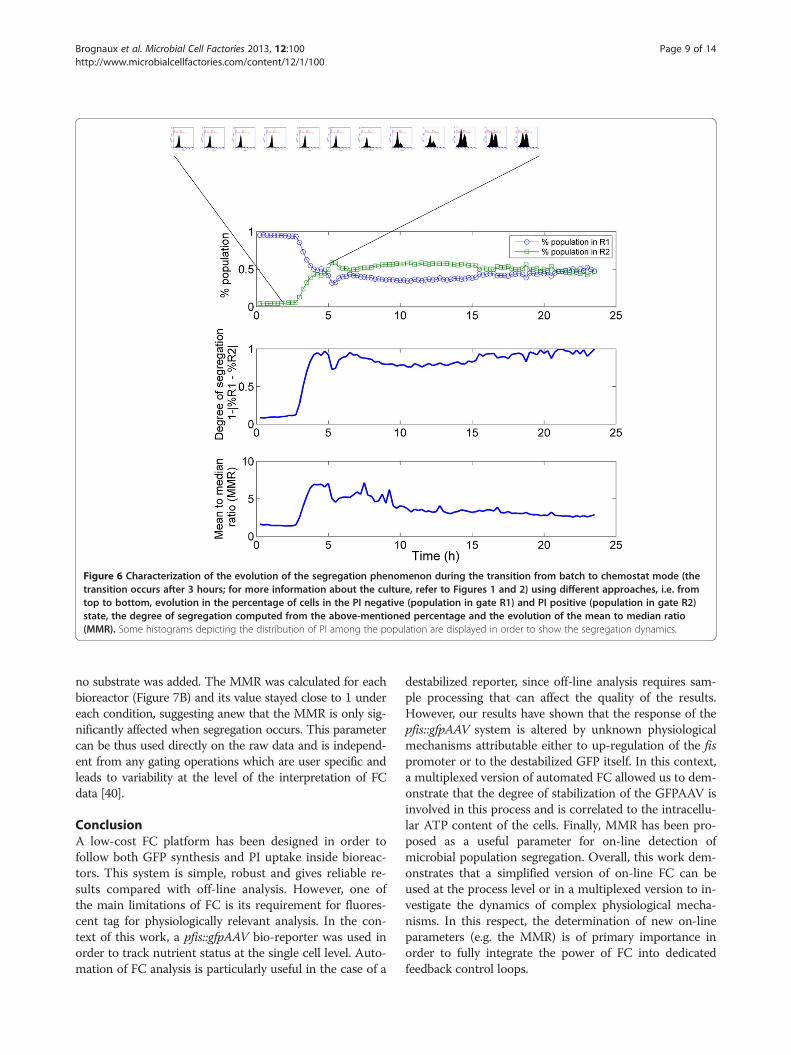
Figure 6 Characterization of the evolution of the segregation phenomenon during the transition from batch to chemostat mode (thetransition occurs after 3 hours; for more information about the culture, refer to Figures 1 and 2) using different approaches, i.e. fromtop to bottom, evolution in the percentage of cells in the PI negative (population in gate R1) and PI positive (population in gate R2)state, the degree of segregation computed from the above-mentioned percentage and the evolution of the mean to median ratio(MMR). Some histograms depicting the distribution of PI among the population are displayed in order to show the segregation dynamics.
Brognaux et al. Microbial Cell Factories 2013, 12:100 Page 9 of 14http://www.microbialcellfactories.com/content/12/1/100
no substrate was added. The MMR was calculated for eachbioreactor (Figure 7B) and its value stayed close to 1 undereach condition, suggesting anew that the MMR is only sig-nificantly affected when segregation occurs. This parametercan be thus used directly on the raw data and is independ-ent from any gating operations which are user specific andleads to variability at the level of the interpretation of FCdata [40].
ConclusionA low-cost FC platform has been designed in order tofollow both GFP synthesis and PI uptake inside bioreac-tors. This system is simple, robust and gives reliable re-sults compared with off-line analysis. However, one ofthe main limitations of FC is its requirement for fluores-cent tag for physiologically relevant analysis. In the con-text of this work, a pfis::gfpAAV bio-reporter was used inorder to track nutrient status at the single cell level. Auto-mation of FC analysis is particularly useful in the case of a
destabilized reporter, since off-line analysis requires sam-ple processing that can affect the quality of the results.However, our results have shown that the response of thepfis::gfpAAV system is altered by unknown physiologicalmechanisms attributable either to up-regulation of the fispromoter or to the destabilized GFP itself. In this context,a multiplexed version of automated FC allowed us to dem-onstrate that the degree of stabilization of the GFPAAV isinvolved in this process and is correlated to the intracellu-lar ATP content of the cells. Finally, MMR has been pro-posed as a useful parameter for on-line detection ofmicrobial population segregation. Overall, this work dem-onstrates that a simplified version of on-line FC can beused at the process level or in a multiplexed version to in-vestigate the dynamics of complex physiological mecha-nisms. In this respect, the determination of new on-lineparameters (e.g. the MMR) is of primary importance inorder to fully integrate the power of FC into dedicatedfeedback control loops.
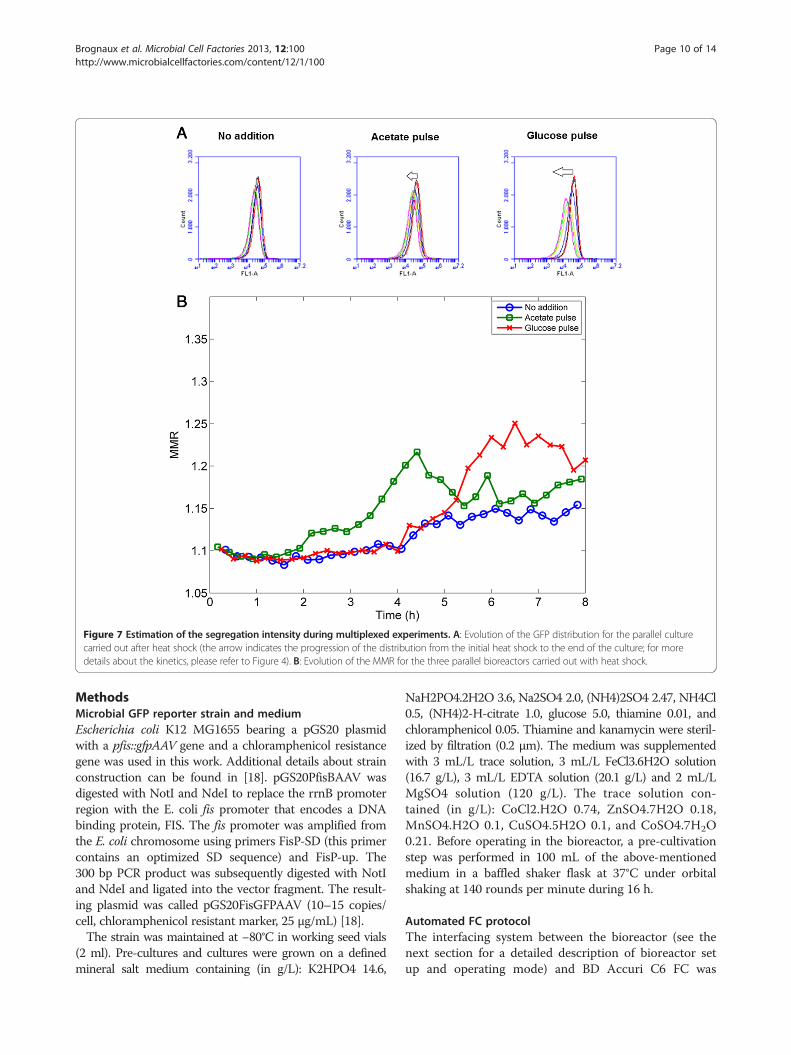
Figure 7 Estimation of the segregation intensity during multiplexed experiments. A: Evolution of the GFP distribution for the parallel culturecarried out after heat shock (the arrow indicates the progression of the distribution from the initial heat shock to the end of the culture; for moredetails about the kinetics, please refer to Figure 4). B: Evolution of the MMR for the three parallel bioreactors carried out with heat shock.
Brognaux et al. Microbial Cell Factories 2013, 12:100 Page 10 of 14http://www.microbialcellfactories.com/content/12/1/100
MethodsMicrobial GFP reporter strain and mediumEscherichia coli K12 MG1655 bearing a pGS20 plasmidwith a pfis::gfpAAV gene and a chloramphenicol resistancegene was used in this work. Additional details about strainconstruction can be found in [18]. pGS20PfisBAAV wasdigested with NotI and NdeI to replace the rrnB promoterregion with the E. coli fis promoter that encodes a DNAbinding protein, FIS. The fis promoter was amplified fromthe E. coli chromosome using primers FisP-SD (this primercontains an optimized SD sequence) and FisP-up. The300 bp PCR product was subsequently digested with NotIand NdeI and ligated into the vector fragment. The result-ing plasmid was called pGS20FisGFPAAV (10–15 copies/cell, chloramphenicol resistant marker, 25 μg/mL) [18].The strain was maintained at −80°C in working seed vials
(2 ml). Pre-cultures and cultures were grown on a definedmineral salt medium containing (in g/L): K2HPO4 14.6,
NaH2PO4.2H2O 3.6, Na2SO4 2.0, (NH4)2SO4 2.47, NH4Cl0.5, (NH4)2-H-citrate 1.0, glucose 5.0, thiamine 0.01, andchloramphenicol 0.05. Thiamine and kanamycin were steril-ized by filtration (0.2 μm). The medium was supplementedwith 3 mL/L trace solution, 3 mL/L FeCl3.6H2O solution(16.7 g/L), 3 mL/L EDTA solution (20.1 g/L) and 2 mL/LMgSO4 solution (120 g/L). The trace solution con-tained (in g/L): CoCl2.H2O 0.74, ZnSO4.7H2O 0.18,MnSO4.H2O 0.1, CuSO4.5H2O 0.1, and CoSO4.7H2O0.21. Before operating in the bioreactor, a pre-cultivationstep was performed in 100 mL of the above-mentionedmedium in a baffled shaker flask at 37°C under orbitalshaking at 140 rounds per minute during 16 h.
Automated FC protocolThe interfacing system between the bioreactor (see thenext section for a detailed description of bioreactor setup and operating mode) and BD Accuri C6 FC was
Brognaux et al. Microbial Cell Factories 2013, 12:100 Page 11 of 14http://www.microbialcellfactories.com/content/12/1/100
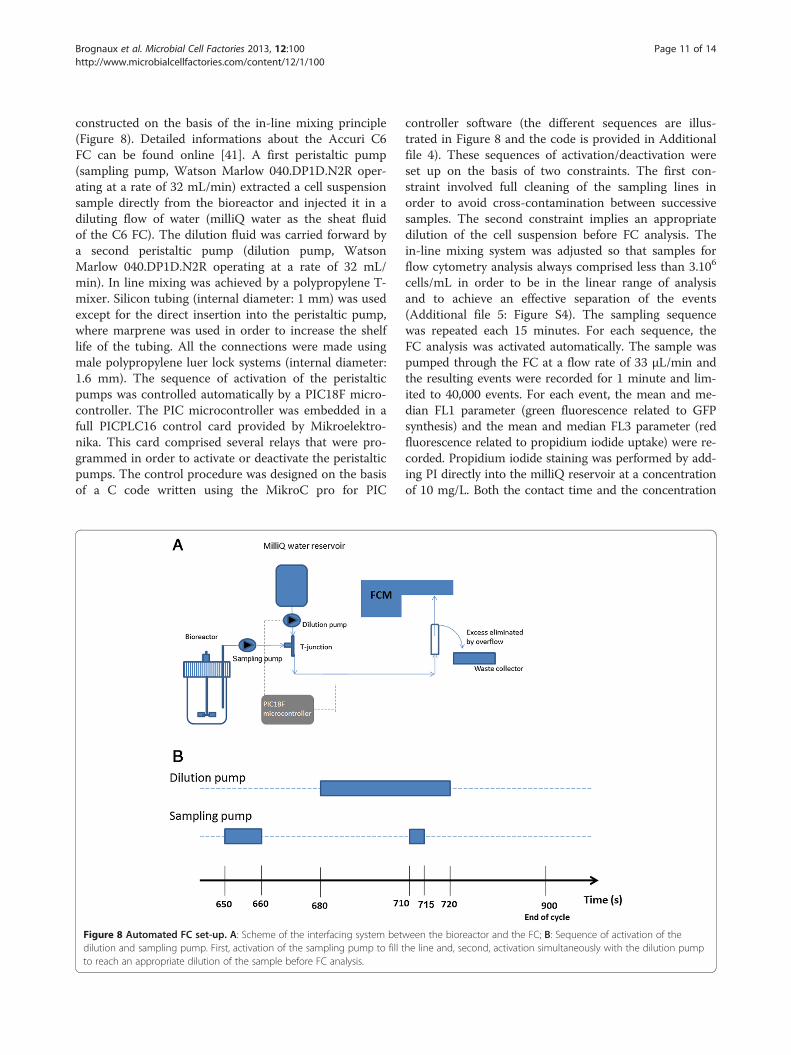
constructed on the basis of the in-line mixing principle(Figure 8). Detailed informations about the Accuri C6FC can be found online [41]. A first peristaltic pump(sampling pump, Watson Marlow 040.DP1D.N2R oper-ating at a rate of 32 mL/min) extracted a cell suspensionsample directly from the bioreactor and injected it in adiluting flow of water (milliQ water as the sheat fluidof the C6 FC). The dilution fluid was carried forward bya second peristaltic pump (dilution pump, WatsonMarlow 040.DP1D.N2R operating at a rate of 32 mL/min). In line mixing was achieved by a polypropylene T-mixer. Silicon tubing (internal diameter: 1 mm) was usedexcept for the direct insertion into the peristaltic pump,where marprene was used in order to increase the shelflife of the tubing. All the connections were made usingmale polypropylene luer lock systems (internal diameter:1.6 mm). The sequence of activation of the peristalticpumps was controlled automatically by a PIC18F micro-controller. The PIC microcontroller was embedded in afull PICPLC16 control card provided by Mikroelektro-nika. This card comprised several relays that were pro-grammed in order to activate or deactivate the peristalticpumps. The control procedure was designed on the basisof a C code written using the MikroC pro for PIC
Figure 8 Automated FC set-up. A: Scheme of the interfacing system betdilution and sampling pump. First, activation of the sampling pump to fill tto reach an appropriate dilution of the sample before FC analysis.
controller software (the different sequences are illus-trated in Figure 8 and the code is provided in Additionalfile 4). These sequences of activation/deactivation wereset up on the basis of two constraints. The first con-straint involved full cleaning of the sampling lines inorder to avoid cross-contamination between successivesamples. The second constraint implies an appropriatedilution of the cell suspension before FC analysis. Thein-line mixing system was adjusted so that samples forflow cytometry analysis always comprised less than 3.106
cells/mL in order to be in the linear range of analysisand to achieve an effective separation of the events(Additional file 5: Figure S4). The sampling sequencewas repeated each 15 minutes. For each sequence, theFC analysis was activated automatically. The sample waspumped through the FC at a flow rate of 33 μL/min andthe resulting events were recorded for 1 minute and lim-ited to 40,000 events. For each event, the mean and me-dian FL1 parameter (green fluorescence related to GFPsynthesis) and the mean and median FL3 parameter (redfluorescence related to propidium iodide uptake) were re-corded. Propidium iodide staining was performed by add-ing PI directly into the milliQ reservoir at a concentrationof 10 mg/L. Both the contact time and the concentration
ween the bioreactor and the FC; B: Sequence of activation of thehe line and, second, activation simultaneously with the dilution pump

Brognaux et al. Microbial Cell Factories 2013, 12:100 Page 12 of 14http://www.microbialcellfactories.com/content/12/1/100
of PI solution are recognized as critical parameters for ap-propriate staining of environmental bacteria [42]. How-ever, in this work a well-known industrial strain of E. coliwas used and a large number of PI staining protocolsare available in the literature for this strain. Accordingto these protocols, the contact time can vary from 10–15 minutes [43] to 20–25 minutes [31]. For this work,we determined the minimum contact time betweencells and PI necessary in order to optimize the rate ofdata acquisition by the automated FC. The controlprocedure involved an off-line PI staining test involv-ing different contact times and a real-time FC test. Inthis way a minimum contact time of 3 minutes was de-termined to be necessary, and was incorporated in theautomated FC procedure (Additional file 6: Figure S5).Data treatment was performed by a dedicated Matlabcode after export from the CFlow software as a .csv file.PI stained cells were sorted (FACSaria, BectonDickinson)and plated onto agar medium (glucose 10 g/L, yeast ex-tract 10 g/L, casein peptone 10 g/L, agar 15 g/L) in orderto assess their viability. GFP and PI measures were com-pared to those obtained off-line (Additional file 1: FigureS1 and Additional file 3: Figure S3). For off-line stainingtests, cells were stained with iodide propidium (PI, SigmaAldrich Fluka, Saint-Louis Missouri USA), which accumu-lates in membrane-compromised cells. A quantity of 10 μlof PI (working solution 1 mg/mL of PI in distilled water)was used during 15 min at 37°C. PI was measured onthe FL3 channel of the C6Flow Accuri Cytometer (BDBiosciences, NJ USA). The analysis was stopped afterthe acquisition of 30,000 events, with a threshold of80,000 set on the FSC channel. Flow cytograms of FL3/FL1 were analysed by CFlowPlus Analysis Software.The GFP signal under the control of the fis promoterwas recorded at the level of the FL1 channel (excitationwavelength: 488 nm; emission wavelength: 530 nm). Thecells were stored at - 20°C in glycerol (30%). These stabi-lized cells were centrifuged and resuspended in PBS bufferbefore analysis.
Bioreactor operating conditionsChemostats were carried out in a lab-scale stirred bio-reactor (Biostat B-Twin, Sartorius with a total volume of3 L; working volume of 1 L; mixing provided by a stand-ard Rushton disk turbine with 6 blades) in remote con-trol mode interfaced with the MFCS/win 3.0 software.During the experiments, pH was maintained at 6.9(regulation by ammonia and phosphoric acid) the stirrerrate at 800 rpm, the air flow rate at 1 L/min and thetemperature at 37°C. The chemostat phase was stabilizedduring 43 h with a feeding solution containing 5 g/L ofglucose solution (in the same minimal medium aspreviously described) at a dilution rate of 0.14 h-1
(corresponding to 6 residence times). Glucose pulses
were performed during 24 h at the same dilution rateby adding pulses of 8 mL of a glucose solution (30 g/Lmade up in distilled water) each 15 minutes. Additionalbatch experiments were performed on a Dasgip mini-bioreactor platform. The mini-bioreactors were filled with200 mL of the defined medium previously described. Stir-ring was provided by two Rushton turbines with 6 bladesat an agitation rate of 900 min-1. The air flow was main-tained at 100 mL/min and the pH was kept at 7.0. Thefirst experiments involved three bioreactors at three differ-ent temperatures: 30°C, 37°C and 42°C. A second experi-ment was also performed. The three reactors were startedat 30°C. After 4 h, the temperature was increased in thereactors to 42°C to induce a thermal shock and ATP-dependent protease synthesis. In the second and the thirdbioreactors, an acetate pulse and a glucose pulse, respect-ively, were delivered at the same time (2 g added intotal). All these experiments were carried out with tworeplicates. At both scales, cell growth was monitoredby optical density (OD) at a wavelength of 600 nm(Genesys 105 UV–VIS spectrophotometer, purchasedfrom Thermo Scientific). Cell dry weight was deter-mined on the basis of filtered samples (0.45 μm) driedduring 24 h at 105°C.Glucose concentration was monitored by a YSI (Yel-
low Spring Instrument Co) electro-enzymatic system.Samples were injected into a chamber filled with abuffer solution and the sample was diffused through apolycarbonate membrane that limited the reaction rate.Membrane-immobilised glucose oxidase produced hydro-gen peroxide that diffused through a cellulose acetatemembrane and was oxidized by a palatine electrode.The signal was proportional to the glucose concentra-tion up to 2.5 g/L. More concentrated samples werediluted first. The total amount of protein in the extra-cellular medium was measured on the basis of theFolin-Lowry method [44].ATP assays were performed on supernatants from the
mini-bioreactors according to the CellTiteGlo® lumines-cent assay. The assay procedure involved adding a sim-ple reagent directly to the cells. This resulted in cell lysisand generation of a luminescent signal proportional tothe amount of ATP present, measured by a V3 Wallacluminometer (Perkin Elmer). This relies on the proper-ties of a thermostable luciferase that generates a stableluminescent signal for 5 hours: mono-oxygenation of lu-ciferin is catalysed by luciferase in the presence of Mg2+,ATP and molecular oxygen. One hundred microlitres ofreagent was added to 100 μl of culture medium (the cellconcentration has to be less than 5.104 cell/ml). A cali-bration curve was done over the same measurementrange. All analyses were performed in triplicates andexpressed as specific ATP, i.e. the ATP concentration di-vided by cell optical density.

Brognaux et al. Microbial Cell Factories 2013, 12:100 Page 13 of 14http://www.microbialcellfactories.com/content/12/1/100
Additional files
Additional file 1: Figure S1. Comparison of the on-line and off-line FL1values (GFP synthesis).
Additional file 2: Figure S2. Evolution of the extracellular proteinconcentration in 2 L bioreactors.
Additional file 3: Figure S3. Comparison of the on-line and off-line FL3values (PI uptake).
Additional file 4: C codes written for the PIC controllercorresponding to the chemostat culture and the multiplexedversion for mini-bioreactors.
Additional file 5: Figure S4. Determination of the linear range ofanalysis of the accuri C6 flow cytometer.
Additional file 6: Figure S5. Real-time monitoring of PI uptake andcomparison with off-line staining.
Competing interestsThe authors declare that they have no competing interests.
Authors’ contributionsAB and FD performed the cultivation tests and flow cytometry analyses. FDand FL designed the interfacing of the flow cytometer. AB and FD wrote thepaper. SSH and SS constructed the bacterial strain and helped in editing andrevising the manuscript. FD and PT supervised the work and corrected thepaper. All authors read and approved the final version of the manuscript.
AcknowledgementsAB is the recipient of a PhD FRIA grant provided by the Belgian Fund forScientific Research (FRS-FNRS). The authors gratefully acknowledge SamuelTelek and Rudy Schartz for their excellent technical assistance.
Author details1Unité de Bio-industries/CWBI, Gembloux Agro-Bio Tech, Université de Liège,Passage des Déportés 2, Gembloux 5030, Belgium. 2Fond de la recherchescientifique (FRS-FNRS), Rue d’Egmont 5, Bruxelles 1000, Belgium. 3Section formicrobiology, Department of Biology, University of Copenhagen,Universitetsparken, 15, Bygning, 1, Copenhagen 2100, Denmark. 4Unité demécanique et construction, Gembloux Agro-Bio Tech, University of Liège,Passage des Déportés 2, Gembloux 5030, Belgium.
Received: 14 March 2013 Accepted: 30 October 2013Published: 31 October 2013
References1. Müller S, Harms H, Bley T: Origin and analysis of microbial population
heterogeneity in bioprocesses. Curr Opin Biotechnol 2010, 21:100–113.2. Rao CV, Wolf DM, Arkin AP: Control, exploitation and tolerance of
intracellular noise. Nature 2002, 420:231–237.3. Mettetal JT, Muzzey D, Pedraza JM, Ozbudak EM, van Oudenaarden A:
Predicting stochastic gene expression dynamics in single cells. Proc NatlAcad Sci U S A 2006, 103:7304–7309.
4. Thattai M, van Oudenaarden A: Stochastic gene expression in fluctuatingenvironments. Genetics 2004, 167:523–530.
5. Patnaik PR: External, extrinsic and intrinsic noise in cellular systems :analogies and implications for protein synthesis. Biotechnol Mol Biol Rev2006, 1:121–127.
6. Diaz M, Herrero M, Garcia LA, Quiros C: Application of flow cytometry toindustrial microbial bioprocesses. Biochem Eng J 2010, 48:385–407.
7. Love KR, Politano TJ, Panagiotou V, Jiang B, Stadheim TA, Love JC:Systematic single-cell analysis of Pichia pastoris reveals secretory cap-acity limits productivity. PLoS One 2012, 7:e37915.
8. Zhao R, Natarajan A, Srienc F: A flow injection flow cytometry system foron-line monitoring of bioreactors. Biotechnol Bioeng 1999, 62:609–617.
9. Abu-Absi NR, Zamamiri A, Kacmar J, Balogh SJ, Srienc F: Automated flowcytometry for acquisition of time-dependent population data. CytometryA 2003, 51A:87–96.
10. Lin HY: Cellular responses to the induction of recombinant genes in Escherichiacoli fed-batch cultures, in, Martin-Luther-Universität Halle-Wittenberg, Saale.Martin-Luther-Universität Halle-Wittenberg, Saale; 2000:130.
11. DeLisa MP, Li J, Rao G, Weigand WA, Bentley WE: Monitoring GFP operonfusion protein expression during high cell density cultivation ofEscherichia coli using an on-line optical sensor. Biotechnol Bioeng 1999,65:54–64.
12. Kacmar J, Gilbert A, Cockrell J, Srienc F: The cytostat: A new way to studycell physiology in a precisely defined environment. J Biotechnol 2006,126:163–172.
13. Golden JP, Verbarg J, Howell PB, Shriver-Lake LC, Ligler FS: Automated pro-cessing integrated with a microflow cytometer for pathogen detectionin clinical matrices. Biosens Bioelectron 2013, 40:10–16.
14. Van Nevel S, Koetzsch S, Weilenmann HU, Boon N, Hammes F: Routinebacterial analysis with automated flow cytometry. J Microbiol Methods2013, 94:73–76.
15. Kuystermans D, Mohd A, Al-Rubeai M: Automated flow cytometry for mon-itoring CHO cell cultures. Methods 2012, 56:358–365.
16. Hammes F, Broger T, Weilenmann HU, Vital M, Helbing J, Bosshart U, Huber P,Odermatt RP, Sonnleitner B: Development and laboratory-scale testing of afully automated online flow cytometer for drinking water analysis.Cytometry A 2012, 81:508–516.
17. Broger T, Odermatt RP, Huber P, Sonnleitner B: Real-time on-line flow cy-tometry for bioprocess monitoring. J Biotechnol 2011, 154:240–247.
18. Han S, Delvigne F, Brognaux A, Gitte C, Sorensen JS: Design of growth-dependent biosensors based on destabilized GFP for the detection ofphysiological behavior of Escherichia coli in heterogeneous bioreactors.Biotechnol Prog 2013, 29:553–563.
19. Ball CA, Osuna R, Ferguson KC, Johnson RC: Dramatic change of fis levelupon nutrient upshift in Escherichia coli. J Bacteriol 1992, 174:8043–8056.
20. Enfors SO, Jahic M, Rozkov A, Xu B, Hecker M, Jürgen B, Krüger E, Schweder T,Hamer G, O’Beirne D, Noisommit-Rizzi N, Reuss M, Boone L, Hewitt C,McFarlane C, Nienow A, Kovacs T, Trägardh C, Fuchs L, Revstedt J, Friberg PC,Hjertager B, Blomsten G, Skogman H, Hjort S, Hoeks F, Lin HY, Neubauer P, vander Lans R, Luyben K, Vrabel P, Manelius A: Physiological responses to mixingin large scale bioreactors. J Biotechnol 2001, 85:175–185.
21. Andersen JB, Sternberg C, Poulsen LK, Bjorn SP, Givskov M, Molin S: NewUnstable Variants of Green Fluorescent Protein for Studies of TransientGene Expression in Bacteria. Appl Environ Microbiol 1998, 64:2240–2246.
22. Dennis PP, Ehrenberg M, Bremer H: Control of rRNA Synthesis inEscherichia coli: a Systems Biology Approach. Microbiol Mol Biol Rev 2004,68:639–668.
23. Delvigne F, Brognaux A, Francis F, Twizere JC, Gorret N, Sorensen SJ,Thonart P: Green Fluorescent Protein (GFP) leakage from microbialbiosensors provides useful information for the estimation of the scale-down effect. Biotechnol J 2011, 6:968–978.
24. Brognaux A, Neubauer P, Twizere JC, Francis F, Gorret N, Thonart P,Delvigne F: Direct and indirect use of GFP whole cell biosensors for theassessment of bioprocess performances: Design of milliliter scale-downbioreactors. Biotechnol Prog 2012, 29:48–59.
25. Shokri A, Sanden AM, Larsson G: Growth rate dependent changes inEscherichia coli membrane structure and protein leakage. Appl MicrobiolBiotechnol 2002, 58:386–392.
26. Bäcklund E, Reeks D, Marklanda K, Weir N, Bowering L, Larsson G: Fedbatchdesign for periplasmic product retention in Escherichia coli. J Biotechnol2008, 135:358–365.
27. Bradley MD, Beach MB, de Koning AP J, Pratt TS, Osuna R: Effects of Fis onEscherichia coli gene expression during different growth stages.Microbiology 2007, 153:2922–2940.
28. Soini J, Falschlehner C, Mayer C, Böhm D, Weinel S, Panula J, Vasala A,Neubauer P: Transient increase of ATP as a response to temperature up-shift in Escherichia coli. Microb Cell Fact 2005, 4:9.
29. Egli T: How to live at very low substrate concentrations. Water Res 2011,44:4826–4837.
30. Ferenci T: Adaptation to life at micromolar nutrient levels : the regulationof Escherichia coli glucose transport by endoinduction and cAMP. FEMSMicrobiol Rev 1996, 18:301–317.
31. Berney M, Hames F, Bosshard F, Weilenmann HU, Egli T: Assessment andinterpretation of bacterial viability by using the LIVE/DEAD BacLigthkit in combination with flow cytometry. Appl Environ Microbiol 2007,70:3283–3290.

Brognaux et al. Microbial Cell Factories 2013, 12:100 Page 14 of 14http://www.microbialcellfactories.com/content/12/1/100
32. Weuster-Botz D: Parallel reactor systems for bioprocess development.Adv Biochem Eng Biotechnol 2005, 92:125–143.
33. Betts JI, Baganz F: Miniature bioreactors : current practices and futureopportunities. Microb Cell Fact 2006, 5:21.
34. Triccas JA, Pinto R, Britton WJ: Destabilized green fluorescent protein formonitoring transient changes in mycobacterial gene expression.Res Microbiol 2002, 153:379–383.
35. Li XZX, Fang Y, Jiang X, Duong T, Fan C, Huang CC, Kain SR: Generation ofdestabilized green fluorescent protein as a transcription reporter.J Biol Chem 1998, 273:34970–34975.
36. Storz G, Hengge-Aronis E: Bacterial stress response. Washington DC:American Society for Microbiology; 2000.
37. Hammes F, Berney M, Egli T: Cultivation-independent assessment ofbacterial viability. Adv Biochem Eng Biotechnol 2011, 124:123–150.
38. Breeuwer PAT: Assessment of viability of microorganisms employingfluorescence techniques. Int J Food Microbiol 2000, 55:193–200.
39. Davey HM: Prospects for the Automation of Analysis and Interpretationof Flow Cytometric Data. Cytometry A 2010, 77A:3–5.
40. LeMeur N: Computational methods for evaluation of cell-based dataassessment–Bioconductor. Curr Opin Biotechnol 2013, 24:105–111.
41. BD Biosciences. 2013. http://static.bdbiosciences.com/documents/accuri/BD_Accuri_Journal_Guidelines_TechBulletin.pdf.
42. Shi L, Günther S, Hübschmann T, Wick LY, Harms H, Müller S: Limits ofpropidium iodide as a cell viability indicator for environmental bacteria.Cytometry A 2007, 71:592–598.
43. Hewitt CJ, Nebe-Von Caron G, Axelsson B, Mc Farlane CM, Nienow AW:Studies related to the scale-up of high-cell-density E. coli fed-batch fer-mentations using multiparameter flow cytometry : effect of a changingmicroenvironment with respect to glucose and dissolved oxygen con-centration. Biotechnol Bioeng 2000, 70:381–390.
44. Lowry OH, Rosebrough NJ, Farr AL, Randall RJ: Protein measurement withthe Folin phenol reagent. J Biol Chem 1951, 193:265–275.
doi:10.1186/1475-2859-12-100Cite this article as: Brognaux et al.: A low-cost, multiplexable, automatedflow cytometry procedure for the characterization of microbial stressdynamics in bioreactors. Microbial Cell Factories 2013 12:100.
Submit your next manuscript to BioMed Centraland take full advantage of:
• Convenient online submission
• Thorough peer review
• No space constraints or color figure charges
• Immediate publication on acceptance
• Inclusion in PubMed, CAS, Scopus and Google Scholar
• Research which is freely available for redistribution
Submit your manuscript at www.biomedcentral.com/submit


![Microbial Cell Factories - COnnecting REpositories · morphogenesis, pigment formation, pathogenesis, competitor interactions and transport of metal ions [2,3]. Their ability to react](https://static.fdocuments.net/doc/165x107/5d5c14ec88c993bd778b4c1f/microbial-cell-factories-connecting-repositories-morphogenesis-pigment-formation.jpg)