
OPEN ACCESS - ed
19
CORRESPONDENCE Andrey B. Nikolaev [email protected] © 2016 Nikolaev et al. Open Access terms of the Creative Commons Attribution 4.0 International License (http://creativecommons.org/licenses/by/4.0/) apply. The license permits unrestricted use, distribution, and reproduction in any medium, on the condition that users give exact credit to the original author(s) and the source, provide a link to the Creative Commons license, and indicate if they made any changes. Introduction The congestion is major problem on the road in the urban cities, so one of the important part of ITS (Intelligent Transport System) is incident detection system. It is important to create an effective system of determining the incident (Hourdos & Garg, 2008). The system of traffic incident management has to deal with many uncontrolled and uncontrollable factors that are difficult to predict and take into account in the planning of decisions, such as weather conditions, the condition of roads, the physical and moral driver of operators (Alkandari, 2013; Akhmadieva, 2015; Akhmadieva & Minnikhanov, 2015; Sultangazinov et al., 2016; Bulat & Volkov, 2016). For the process of traffic incident, the system it is necessary to develop a decision support system based on the mathematical apparatus of INTERNATIONAL JOURNAL OF ENVIRONMENTAL & SCIENCE EDUCATION 2016, VOL. 11, NO. 16, 9060-9078 Simulation of Automatic Incidents Detection Algorithm on the Transport Network Andrey B. Nikolaev a , Yuliya S. Sapego a , Anatolij N. Jakubovich a , Leonid I. Berner b and Andrey M. Ivakhnenko a a Federal State Funded Educational Institution of Highest Education "Moscow Automobile and Road Construction State Technical University – MADI", Moscow, RUSSIA; b JSC "AtlanticTransgasSystem", Moscow, RUSSIA ABSTRACT Management of traffic incident is a functional part of the whole approach to solving traffic problems in the framework of intelligent transport systems. Development of an effective process of traffic incident management is an important part of the transport system. In this research, it’s suggested algorithm based on fuzzy logic to detect traffic incidents and determine its priority for transmission information about incident to emergency services. Sensors that are installed on the roadway provide the data for algorithm of incident detection. After the incident is detected, the algorithm of defining its priorities will be started. The traffic flow for research will be modeled in the PTV Vissim, after all receives information will be uploaded to excel for further processing. KEYWORDS ARTICLE HISTORY System of incident management, Intelligent Transport System, PTV Vissim, fuzzy logic Received 20 March 2016 Revised 28 April 2016 Accepted 19 May 2016 OPEN ACCESS
Transcript of OPEN ACCESS - ed

CORRESPONDENCE Andrey B. Nikolaev [email protected]
© 2016 Nikolaev et al. Open Access terms of the Creative Commons Attribution 4.0 International License (http://creativecommons.org/licenses/by/4.0/) apply. The license permits unrestricted use, distribution, and reproduction in any medium, on the condition that users give exact credit to the original author(s) and the source, provide a link to the Creative Commons license, and indicate if they made any changes.
Introduction
The congestion is major problem on the road in the urban cities, so one of
the important part of ITS (Intelligent Transport System) is incident detection
system. It is important to create an effective system of determining the incident
(Hourdos & Garg, 2008).
The system of traffic incident management has to deal with many
uncontrolled and uncontrollable factors that are difficult to predict and take into
account in the planning of decisions, such as weather conditions, the condition of
roads, the physical and moral driver of operators (Alkandari, 2013; Akhmadieva,
2015; Akhmadieva & Minnikhanov, 2015; Sultangazinov et al., 2016; Bulat &
Volkov, 2016). For the process of traffic incident, the system it is necessary to
develop a decision support system based on the mathematical apparatus of
INTERNATIONAL JOURNAL OF ENVIRONMENTAL & SCIENCE EDUCATION
2016, VOL. 11, NO. 16, 9060-9078
Simulation of Automatic Incidents Detection Algorithm on the Transport Network
Andrey B. Nikolaeva, Yuliya S. Sapegoa, Anatolij N. Jakubovicha, Leonid I. Bernerb and Andrey M. Ivakhnenkoa
aFederal State Funded Educational Institution of Highest Education "Moscow Automobile and Road Construction State Technical University – MADI", Moscow, RUSSIA; bJSC
"AtlanticTransgasSystem", Moscow, RUSSIA
ABSTRACT
Management of traffic incident is a functional part of the whole approach to solving traffic problems in the framework of intelligent transport systems. Development of an effective process of traffic incident management is an important part of the transport system. In this research, it’s suggested algorithm based on fuzzy logic to detect traffic incidents and determine its priority for transmission information about incident to emergency services. Sensors that are installed on the roadway provide the data for algorithm of incident detection. After the incident is detected, the algorithm of defining its priorities will be started. The traffic flow for research will be modeled in the PTV
Vissim, after all receives information will be uploaded to excel for further processing.
KEYWORDS ARTICLE HISTORY System of incident management, Intelligent
Transport System, PTV Vissim, fuzzy logic Received 20 March 2016
Revised 28 April 2016 Accepted 19 May 2016
OPEN ACCESS

INTERNATIONAL JOURNAL OF ENVIRONMENTAL & SCIENCE EDUCATION 9061
assessing situations and selection based on them the required control action
(Deniz & Celikoglub, 2011). Such a system may be implemented based on fuzzy
situational management (Simankov & Shopin, 2004; Toymentseva et al., 2016).
In this research it’s suggested algorithm based on fuzzy logic to detect
traffic incidents and determine its priority for transmission information about
incident to emergency services (Nikolaev & Sapego, 2015). The data for the
algorithm may come from the sensors installed on the roadway, as well as from
drivers, emergency services, etc (Mitrovich, Valenti & Mancini, 2006):
Figure 1. The scheme of obtaining the input data
Information on the current flow rate and volume of traffic can be obtained
from the sensors without human intervention (Mahmassani et al., 1999).
However, such information as the type of incident, the vehicle type and location
cannot be obtained without human intervention. For example, when the
notification of the presence of the incident, the controller installed on the road by
camera can determine at what point an incident occurred and what types of
vehicles (TC) are involved in it (Manstetten & Maichle, 1996).
In this paper it presents results of proposed algorithm simulations in real-
time using a modeling system PTV Vissim (“What keeps traffic flowing”, n.d.).
There are sensors (analogue of induction loops) on the tested section of the road
are located. Data from the sensors is collected for each predetermined period and
unloaded in an excel file. The received data are analyzed for the presence of the
incident (Škorput, Mandžuka & Jelušić, 2010). If the incident is detected, the
algorithm of defining its priorities will be started. In addition to determining the
priority algorithm, the system sends a notification to the appropriate emergency
services with information about occurred incident.
Materials and Methods
Simulation of incidents in PTV Vissim
Software PTV VISSIM is microscopic simulators stochastic traffic. It was
used to create a detailed model of I-210 West. In the past, it used mainly as a
tool for the design of urban public transport systems, but later it is used to

9062 A. B. NIKOLAEV ET AL.
simulate traffic on the highway. The Model of traffic is based on the work (R.
Wiedemann, 1991) combined the perceptual patterns of behavior of drivers with
car models (Gomes, 2004).
The behavioral model for drivers includes classifying of reactions in
response to the speed and distance relative to the preceding vehicle (Gettman et
al., 2008). Drivers may decide to change lanes. This decision may be (“PTV
optima and safety smart traffic control for smart cities”, 2014):
Forced - according to the routing requirements, for example, when
approaching an intersection;
Independent - to gain access to a free lane.
PTV Vissim suggests some of the stochastic variation of parameters such as
the desired speed and acceleration.
Configuring the simulation parameters
The data for the simulation of the incident will be generated in the software
PTV Vissim. Vissim has not real model of incident simulations, so the data will be
collected through the creation of parking space on the roadway, which will be
considered as a road accident (Tian & Dong, 2012). Three different locations of
incident will be modeled in research relatively sensors.
The following road setting is installed in PTV Vissim (see Figure 2):
The number of lanes in the same direction - 2 lanes;
The width of the roadway – 3.5 m (width is based the average value of
the width of the for normal use roads of different categories according to GOST
R 52398) (“GOST R 52398. The classification of highways. The main parameters
and requirements”);
The length of the roadway – 1000 m.
Figure 2. Installed road setting
Configuring of parking space (see Figure 3):

INTERNATIONAL JOURNAL OF ENVIRONMENTAL & SCIENCE EDUCATION 9063
Figure 3. Configuring of parking space
On the road it is created one parking space which is symbolized the
stopping of the vehicle, for example, due to damage). It is configured the
residence time of the car at the parking place (an average of 100 seconds) in
order to during the time for downtime congestion of vehicles may be formed for
further analysis. In addition, for the parking space it set of work time in order
the cars do not stop during the whole simulation time, but at a certain time to
analyze the state of the traffic when the incident did not happen.
Configuring of traffic flow composition with the desired speed is shown in
Figure 4:

9064 A. B. NIKOLAEV ET AL.
Figure 4. The composition of the of traffic flow
Because in the city speed limit must be 60 km/h, so for all type of vehicles
the desired speed is set to 50 km/h ("DesSpeedDistr" parameter). The percentage
ratio sets for all type of vehicles: passenger cars – 95%, HGVs (Heavy goods
vehicle) – 0,02%, buses – 0,03% (“Transport streams. The intensity and
composition on the federal highway, Moscow region”, n.d.).
Setting the traffic flow is presented in Figure 5:
Figure 5. Setting of the traffic flow with volume value - 2000 auth / h
It’s necessary to analyze the efficiency of the algorithm in a variety of
driving conditions; therefore, test will be included 3 different value of traffic
volume: 2000 auth/h, 4000 auth/h, 8000 auth/h.
Setting of detector (an analogue of inductive loops) is shown in Figure 6.
The distance between the measurement points is set 500 meters.
Figure 6. Information about on installed detectors on the roadway
Incidents (parking spaces) will be established at three different locations
(see Figure 7):
1. At a distance of 100 meters after the installation of the first detector.
2. Exactly halfway between the detectors (at a distance of 250 meters).
3. At a distance of 100 meters before the installation of the first detector.

INTERNATIONAL JOURNAL OF ENVIRONMENTAL & SCIENCE EDUCATION 9065
Figure 7. Positions of detectors and incidents (parking places)
Data from the detectors come every 30 seconds to the system. Proposed
algorithm of incident detection will be tested in 3 different values of traffic
volume and in 3 different locations. The result is 9 different scenarios.
Results
Description of experiments
9 various experiments were performed with different traffic conditions in PTV
Vissim:
a) The parking the place was located in three different locations (after 100
m, in the middle, before 100 m).
b) Trafficflowwas changed (2000 autm/h, 4000 autm/hand 8000 autm/h).
Figure 8. Screen of simulation of traffic when an incident occurred
The simulation results were unloaded in an excel file. The following data
will be analyzed on the effectiveness of the proposed algorithm based on fuzzy
logic (Parkany, 2005):
Incident detection time: from time when incident occurred (when the car
stopped at the parking place) until time when system will show the first
deviation from the normal traffic.

9066 A. B. NIKOLAEV ET AL.
Total number of detected incidents: total number of incidents detected by
the system (when the system showed that the incident actually occurred).
The number of false alarms: number of signals when the system showed
that the incident occurred, but in fact, it is not on the road.
As a result of the algorithm the following data will be obtained for each
experiment:
1. Time (“Время”): current time of simulation.
2. Incident (“Инц”): it shows the time interval of the incident action (when
the car stops at the parking place)
3. Status (“Статус ”):incident status that the system displays at the current
time:
I. Green – normal traffic;
II. Yellow - probability of occurrence of the incident;
III. Red - incident is detected.
Also the number of fuzzy rules is displays.
Amount (“Количество”): the average number of vehicles that passed
through the detector in 30 seconds (the first two lines represent data received
from the second sensor, the last two – from the first detector).
Rate (“Скорость”): average flow rate (the first two lines represent data
received from the second sensor, the last two – from the first detector).
Results of experiments
Experiment №1
The initial traffic conditions:
Value of volume: 2000 auth.
Location of parking place: before 100 m.
Figure 9. The result of the algorithm operation (experiment #1)
At given traffic conditions algorithm it does not immediately determine the
occurrence of the incident, resulting in time of incident detection is increased.
Table 1. The result of the experiment #1
# Time of incident detection (s)
Number of detected incidents
The number of false alarms
1 73 1 0
2 70 1 0
3 61 1 0

INTERNATIONAL JOURNAL OF ENVIRONMENTAL & SCIENCE EDUCATION 9067
4 45 1 0
5 67 1 0
6 50 1 0
7 71 1 0
8 71 1 0
9 57 1 0
10 68 1 0
Total 63,3 100% 0%
Experiment №2
The initial traffic conditions:
Value of volume: 4000 auth.
Location of parking place: before 100 m.
Figure 10. The result of the algorithm operation (experiment #2)
The system showed the presence of the incident, when it was eliminated. It
means that after the elimination of incident, traffic flow is not immediately come
to the normal state (Klein, 2006). This situation would not be considered as a
false alarm. A similar situation has arisen in other experiments.
Table 2. The result of the experiment #2
# Time of incident
detection (s) Number of detected
incidents The number of false
alarms
1 12 1 0
2 15 1 0
3 21 1 0
4 17 1 0
5 28 1 0
6 25 1 0
7 27 1 0
8 23 1 0
9 21 1 0
10 18 1 0
Total 20,7 100% 0%
Experiment №3
The initial traffic conditions:
Value of volume: 8000 auth.
Location of parking place: before 100 m.

9068 A. B. NIKOLAEV ET AL.
Figure 11. The result of the algorithm operation (experiment #3)
Table 3. The result of the experiment #3
# Time of incident
detection (s) Number of detected
incidents The number of false
alarms
1 11 1 0
2 15 1 0
3 10 1 1
4 21 1 0
5 27 1 0
6 13 1 0
7 31 1 0
8 17 1 0
9 21 1 0
10 17 1 0
Total 18,3 100% 10%
In this experiment, the system showed a false alarm that incident occurred.
This is because there were a large number of vehicles on the road, so average
speed was below average given initially (60 km/h).
Experiment №4
The initial traffic conditions:
Value of volume: 2000 auth.
Location of parking place: in the middle.
Figure 12. The result of the algorithm operation (experiment #4)
Table 4. The result of the experiment #4
# Time of incident Number of detected The number of false

INTERNATIONAL JOURNAL OF ENVIRONMENTAL & SCIENCE EDUCATION 9069
detection (s) incidents alarms
1 69 1 0
2 75 1 0
3 61 1 1
4 54 1 0
5 30 1 0
6 67 1 0
7 69 1 0
8 74 1 0
9 70 1 0
10 71 1 0
Total 64 100% 10%
As in the experiment №1, system with low value of traffic volume does not
immediately determine the occurrence of the incident. In addition, the system
showed a false alarm when the incident has already been eliminated and normal
traffic is restored.
Experiment №5
The initial traffic conditions:
Value of volume: 4000 auth.
Location of parking place: in the middle.
Figure 13. The result of the algorithm operation (experiment #5)
Table 5. The result of the experiment #5
# Time of incident
detection (s) Number of detected
incidents The number of false
alarms
1 35 1 0
2 47 1 0
3 31 1 0
4 29 1 0
5 37 1 0
6 42 1 0
7 33 1 0
8 34 1 0
9 42 1 0
10 33 1 0
Total 36,3 100% 0%
Experiment №6

9070 A. B. NIKOLAEV ET AL.
The initial traffic conditions:
Value of volume: 8000 auth.
Location of parking place: in the middle.
Figure 14. The result of the algorithm operation (experiment #6)
Table 6. The result of the experiment #6
# Time of incident
detection (s) Number of detected
incidents The number of false
alarms
1 45 1 0
2 48 1 0
3 37 1 0
4 41 1 0
5 39 1 0
6 40 1 0
7 35 1 0
8 31 1 0
9 34 1 0
10 43 1 0
Total 39,3 100% 0%
Experiment №7
The initial traffic conditions:
Value of volume: 2000 auth.
Location of parking place: after 100 m.
Figure 15. The result of the algorithm operation (experiment #7)
Table 7. The result of the experiment #7
# Time of incident Number of detected The number of false

INTERNATIONAL JOURNAL OF ENVIRONMENTAL & SCIENCE EDUCATION 9071
detection (s) incidents alarms
1 71 1 0
2 69 1 0
3 68 1 0
4 55 1 0
5 63 1 0
6 69 1 0
7 72 1 0
8 65 1 0
9 63 1 0
10 58 1 0
Total 65,3 100% 0%
Experiment №8
The initial traffic conditions:
Value of volume: 4000 auth.
Location of parking place: after 100 m.
Figure 16. The result of the algorithm operation (experiment #8)
Table 8. The result of the experiment #8
# Time of incident
detection (s) Number of detected
incidents The number of false
alarms
1 31 1 0
2 47 1 0
3 27 1 0
4 32 1 0
5 29 1 0
6 33 1 0
7 41 1 0
8 25 1 1
9 23 1 0
10 29 1 0
Total 31,7 100% 10%
Experiment №9
The initial traffic conditions:
Value of volume: 8000 auth.
Location of parking place: after 100 m.

9072 A. B. NIKOLAEV ET AL.
Figure 17. The result of the algorithm operation (experiment #9)
Table 9. The result of the experiment #9
# Time of incident
detection (s) Number of detected
incidents The number of false
alarms
1 27 1 0
2 40 1 0
3 29 1 0
4 31 1 0
5 35 1 0
6 27 1 0
7 22 1 0
8 39 1 0
9 28 1 0
10 25 1 0
Total 30,3 100% 0%
Discussion
Analysis of simulation results
The maximum value of incident detection time was obtained at low value of
road volume (2000 auth/h) with using the proposed algorithm. The minimum
value of detection time was observed at high value of volume (8,000 auth/h) -
18.3 seconds. This is caused by that presence of incident will affect faster on
traffic flow with high volume than with low value.
Some experimentation have shown false alarms of incidents. Two of them
were at average value of volume - 4000 auth/h.At high value of volume system
showed the presence of the incident after its elimination. This is because
congestion isn’t immediately disappeared after the elimination of the incident.
The averaged data for all simulation experiments are shown in Table 10.
Table 10. Summary results of the experiments
Number of experiment
Time of incident detection (s)
Number of detected incidents
The number of false alarms
1 63,3 1 0
2 20,7 1 0
3 18,3 1 0,1
4 64 1 0,1
5 36,3 1 0
6 39,3 1 0
7 65,3 1 0
8 31,7 1 0,1

INTERNATIONAL JOURNAL OF ENVIRONMENTAL & SCIENCE EDUCATION 9073
9 30,3 1 0
Total 41,02 100% 3,33%
In all the experiments, the proposed algorithm has shown high results in
the number of detected incidents – 100% иrelatively low rate of errors – 3,33%.
Despite the fact that at low value of volume the incident detection time was
large, the average result over time– 41,02 s. Other words on the average
proposed algorithm determines the occurrence of the incident for the two phases
(each phases of the data collection and its analysis were 30 s), that in general it
is also a good result.
The implementation of the algorithm for determining the incident
priority and emergency service
When the system has shown that the incident occurred, it runs the
algorithm to determine the priority of the incident (Nikolaev & Sapego, 2016).
Apart from the fact that the algorithm determines the priority; it is also
depending on the input data identifies the emergency services which necessary
to eliminate the incident.
For each type of incident is necessary to define its subtypes for more exact
definition of the incident priority and the emergency services. The following
subtypes of incident is defined (Kim & Choi, 2001):
Table 11. Determination of the emergency services depending on the subtype of the incident
The subtype of the incident The emergency services
1.1. Malfunction of vehicle: a tire puncture, mechanical / electrical failure, overheating
Evacuator
2.2. Hit an obstacle (without health damage)
1.2. The presence of obstacles on the road (tree, etc)
Utility services
2.1. Collision of vehicle without health damage, hit a stationary vehicles
Main Directorate for Road Traffic Safety (GIBDD)
3.1. Ignition of vehicle Main Directorate for Road Traffic Safety (GIBDD)
Fire department
3.2. Causing harm to health Emergency medical services
3.3. Spills of hazardous substances Ministry of Emergency Situations
Because the original data for the evaluation of incident occurrence uploaded
to Excel file, so language for the implementation of the algorithm has been
selected visual basic. The user form is shown in Figure 20 where it is possible to
choose define the characteristics of the incident (in real these data come from
different sources – see Figure 1).
9074 A. B. NIKOLAEV ET AL.
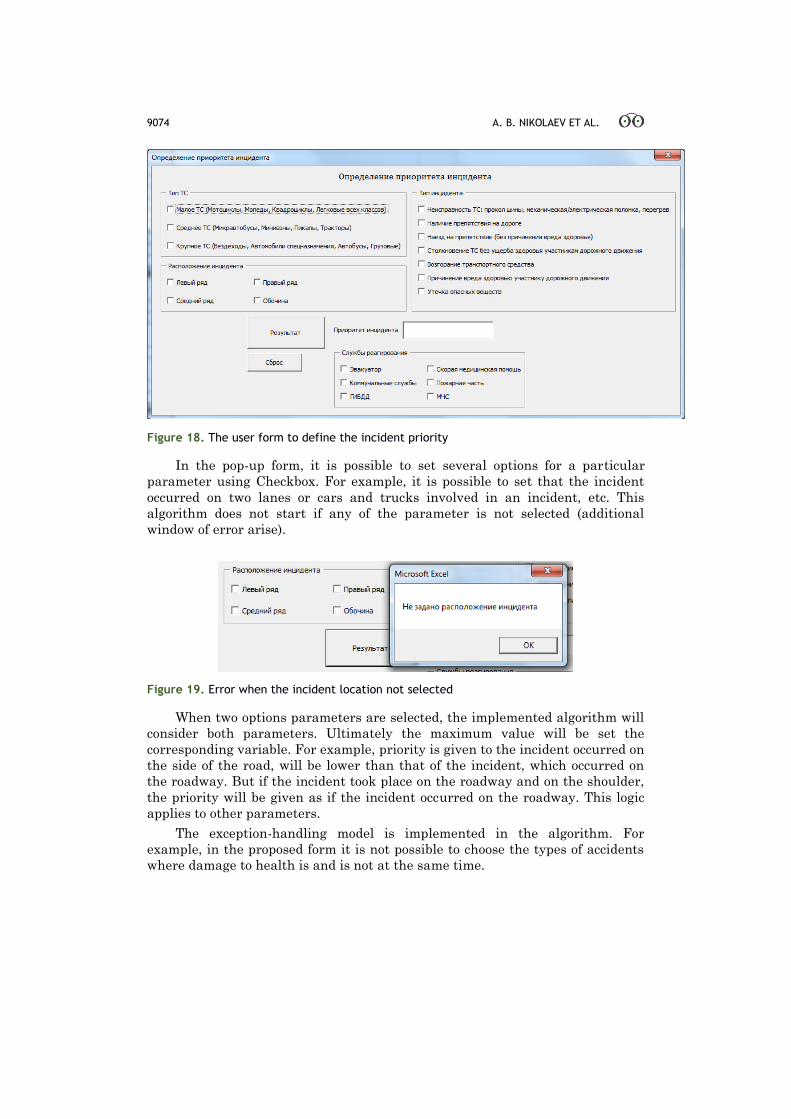
Figure 18. The user form to define the incident priority
In the pop-up form, it is possible to set several options for a particular
parameter using Checkbox. For example, it is possible to set that the incident
occurred on two lanes or cars and trucks involved in an incident, etc. This
algorithm does not start if any of the parameter is not selected (additional
window of error arise).
Figure 19. Error when the incident location not selected
When two options parameters are selected, the implemented algorithm will
consider both parameters. Ultimately the maximum value will be set the
corresponding variable. For example, priority is given to the incident occurred on
the side of the road, will be lower than that of the incident, which occurred on
the roadway. But if the incident took place on the roadway and on the shoulder,
the priority will be given as if the incident occurred on the roadway. This logic
applies to other parameters.
The exception-handling model is implemented in the algorithm. For
example, in the proposed form it is not possible to choose the types of accidents
where damage to health is and is not at the same time.

INTERNATIONAL JOURNAL OF ENVIRONMENTAL & SCIENCE EDUCATION 9075
Figure 20. Error when choosing a couple of contradictory types of incidents
If all the necessary parameters are selected and the contradictions are not
found then incident priority appears in the Textbox in the bottom of the form. In
addition, there are emergency service below needed to resolve the incident
(implemented using Checkbox).
Figure 21. An example of algorithm operation №1

9076 A. B. NIKOLAEV ET AL.
Figure 22. An example of algorithm operation №2
"Reset" button is used when it is necessary to set new parameters of the
emerged incident and get a new priority.
Conclusions
In this article, it was modeled 9 different situations related to the
occurrence of road accidents using PTV Vissim. In each experiment value of
traffic volume (2000 auth/h, 4000 auth/h, 8000 auth/h) and value of incident
(parking place) location (before 100m, between the sensors, after 100m) were
changed. The proposed algorithm is implemented to determine the occurrence of
incidents showed a good result - 100%. However, the algorithm was not the best
indicator of false alarms – 3%.
In addition, an algorithm was proposed to determine the priority of the
incident after its occurrence, implemented on visual basic. In addition to
determining the priority, the algorithm also showed what emergency services
should be notified to eliminate the incident.
Based on the results it can be concluded about the suitability of the
proposed algorithm in the circuit of intelligent transport systems.
Disclosure statement
No potential conflict of interest was reported by the authors.
Notes on contributors
Andrey B. Nikolaev is Doctor of Technical Sciences, Professor, Head of
Department at the Federal State Funded Educational Institution of Highest Education
"Moscow Automobile and Road Construction State Technical University – MADI",
Faculty of Management, Department of "Automated Control Systems", Moscow, Russia.
Yuliya S. Sapego is Postgraduate Student of the Federal State Funded
Educational Institution of Highest Education "Moscow Automobile and Road
Construction State Technical University – MADI", Faculty of Management, Department
of "Automated Control Systems", Moscow, Russia.

INTERNATIONAL JOURNAL OF ENVIRONMENTAL & SCIENCE EDUCATION 9077
Anatolij N. Jakubovich is Doctor of Technical Sciences, Professor at the Federal
State Funded Educational Institution of Highest Education "Moscow Automobile and
Road Construction State Technical University – MADI", Faculty of Management,
Department of "Automated Control Systems", Moscow, Russia.
Leonid I. Berner Doctor of Technical Sciences, Professor, currently employed at
JSC "AtlanticTransgasSystem", Moscow, Russia.
Andrey M. Ivakhnenko is Doctor of Tehcnical Sciences, Professor, Head of
"Management" Department, Faculty of Logistic and Transportation Problems at the
Federal State Funded Educational Institution of Highest Education "Moscow Automobile
and Road Construction State Technical University – MADI", Moscow, Russia.
References
Akhmadieva, R.Sh. & Minnikhanov, R.N. (2015) Regional practice of developing road safety behavior
competency in future specialists. Journal of Sustainable Development, 8(3), 242-249.
Akhmadieva, R.Sh. (2015) Competency development for safety measures on roads as a strategy for
prevention of traffic accidents. Mediterranean Journal of Social Sciences, 6(2S3), 176-181.
Alkandari, A. (2013). Accident Detection and Action System Using Fuzzy Logic Theory. Proceedings
of 2013 International Conference on Fuzzy Theory and Its Application. Taipei, Taiwan:
National Taiwan University of Science and Technology, 385-390.
Bulat, P.V. & Volkov, K.N. (2016). Detonation Jet Engine. Part II – Construction Features.
International Journal of Environmental and Science Education, 11(12), 5020-5033.
Deniz, O. & Celikoglub, H.B. (2011). Overview to some existing incident detection algorithms: a
comparative evaluation. Procedia - Social and Behavioral Sciences, 2, 153-168.
Gettman, D., Pu, L., Sayed, T. & Shelby, S. (2008). Surrogate Safety Assessment Model and
Validation: Final Report. Direct access: http://www.fhwa.dot.gov/publications/research/safety/-
08051/08051.pdf
Gomes, G., May, A. & Horowitz, R. (2004). Calibration of VISSIM for a Congested Freeway.
California PATH Research Report, 2, 56-67.
GOST R 52398. The classification of highways. The main parameters and requirements (2005).
Direct access: http://www.avtolikbez.ru/vardata/modules/lenta/images/2000-
0/12409_1_1297373695.pdf
Hourdos, J. & Garg, V. (2008). Michalopoulos P. Accident Prevention Based on Automatic Detection of
Accident Prone Traffic Conditions. Minnesota: University of Minnesota, 462 p.
Kim, H.J. & Choi, H.K (2001). A comparative analysis in incident service time on urban freeways.
IATSS RESEARCH, 25(1), 62-72
Klein, L.A. (2006). Traffic Detector. Direct access: https://www.fhwa.dot.gov/publications/res-
earch/operations/its/06139/06139.pdf
Mahmassani, H.S., Haas, С., Zhou, S. & Peterman, J. (1999). Evalution of incident detection
methodologies. Direct access: https://www.scholars.northwestern.edu/en/publications/evalu-
ation-of-incident-detection-methodologies
Manstetten, D. & Maichle, J. (1996). Determination of traffic characteristics using fuzzy logic.
Vehicle Navigation and Information Systems Conference, VNIS'96, 43 – 53.
Mitrovich, S., Valenti, G. & Mancini, M. (2006). A decision support system (DSS) for traffic incident
management in roadway tunnel infrastructure. RAIN Consortium – ENEA. Association for
European Transport and contributors, 2, 352-368.
Nikolaev, A.B. & Sapego, Y.S. (2015). Development of Traffic Accidents Control System. Automation
and Control in Technical Systems, 1, 45-50, DOI: 10.12731/2306-1561-2015-1-6.
Nikolaev, A.B. & Sapego, Y.S. (2016). A Fuzzy approach to traffic accident control system. Uniform
All-Russia Scientific Bulletin, 182-187.
Parkany, E.A (2005). Complete Review of Incident Detection Algorithms & Their Deployment: What
Works and What Doesn’t. The New England Transportation Consortium, 1(112), 267-274.
PTV optima and safety smart traffic control for smart cities (2014). Direct access:
http://www.embarqturkiyeyasanabilirsehirler.org/sites/5270e7e07d0cca5c8a00e9b7/content_en
try55b0a4075918ad5636000403/55b1f5205918adb62c000865/files/Sonal_Ahuja_PTV_OPTIMA
_and_Safety_SMART_TRAFFIC_CONTROL_For_SMART_cities.pdf?1448878461

9078 A. B. NIKOLAEV ET AL.
Simankov, V.S. & Shopin, А.B. (2004). Situational management complex object in conditions the
fuzzy initial information. Proceedings of the FOR A, 9, 116-120.
Škorput, P., Mandžuka, S. & Jelušić, N. (2010). Real-time Detection of Road Traffic Incidents.
Promet – Traffic&Transportation, 22(4), 273-283.
Sultangazinov, S.K., Yessengarayev, B.S., Kainarbekov, A., Nauryzova, K.S. & Shagiachmetow,
a.D.R. (2016). Working Capacity of Track Structure and Failure Simulation of its Components.
IEJME-Mathematics Education, 11(8), 2995-3008.
Tian, F. & Dong, H. (2012). Simulation of Traffic Incident Detection Based on VISSIM and Neural
Network. IEEE, 2(3), 51-55.
Toymentseva, I.A., Karpova, N.P., Toymentseva, A.A., Chichkina, V.D. & Efanov, A.V. (2016).
Methods of the Development Strategy of Service Companies: Logistical Approach.
International Journal of Environmental and Science Education, 11(14), 6820-6836.
Transport streams. (2016). The intensity and composition on the federal highway. Direct access:
http://www.roads.ru/articles/a29_potoki.php
What keeps traffic flowing? (2016). Direct access: http://vision-
traffic.ptvgroup.com/fileadmin/files_ptvvision/Downloads_N/0_General/2_Products/2_PTV_Viss
im/BRO_PTV_Vissim_EN.pdf