OP40 TESTING THE PREDICTIVE POWER OF …files.cie.co.at/x046_2019/x046-OP40.pdfOP40 TESTING THE...
14
OP40 TESTING THE PREDICTIVE POWER OF VISUAL DISCOMFORT FROM GLARE METRICS IN THE NEAR- WINDOW AND NEAR-WALL ZONES OF THE DAYLIT CLASSROOM ENVIRONMENT Raquel Viula et al. DOI 10.25039/x46.2019.OP40 from CIE x046:2019 Proceedings of the 29th CIE SESSION Washington D.C., USA, June 14 – 22, 2019 (DOI 10.25039/x46.2019) The paper has been presented at the 29th CIE Session, Washington D.C., USA, June 14-22, 2019. It has not been peer-reviewed by CIE. CIE 2019 All rights reserved. Unless otherwise specified, no part of this publication may be reproduced or utilized in any form or by any means, electronic or mechanical, including photocopying and microfilm, without permission in writing from CIE Central Bureau at the address below. Any mention of organizations or products does not imply endorsement by the CIE. This paper is made available open access for individual use. However, in all other cases all rights are reserved unless explicit permission is sought from and given by the CIE. CIE Central Bureau Babenbergerstrasse 9 A-1010 Vienna Austria Tel.: +43 1 714 3187 e-mail: [email protected] www.cie.co.at
Transcript of OP40 TESTING THE PREDICTIVE POWER OF …files.cie.co.at/x046_2019/x046-OP40.pdfOP40 TESTING THE...

OP40
TESTING THE PREDICTIVE POWER OF VISUAL DISCOMFORT FROM GLARE METRICS IN THE NEAR-WINDOW AND NEAR-WALL ZONES OF THE DAYLIT
CLASSROOM ENVIRONMENT
Raquel Viula et al.
DOI 10.25039/x46.2019.OP40
from
CIE x046:2019
Proceedings of the
29th CIE SESSION Washington D.C., USA, June 14 – 22, 2019
(DOI 10.25039/x46.2019)
The paper has been presented at the 29th CIE Session, Washington D.C., USA, June 14-22, 2019. It has not been peer-reviewed by CIE.
CIE 2019
All rights reserved. Unless otherwise specified, no part of this publication may be reproduced or utilizedin any form or by any means, electronic or mechanical, including photocopying and microfilm, withoutpermission in writing from CIE Central Bureau at the address below. Any mention of organizations or products does not imply endorsement by the CIE.
This paper is made available open access for individual use. However, in all other cases all rights are reserved unless explicit permission is sought from and given by the CIE.
CIE Central Bureau Babenbergerstrasse 9 A-1010 Vienna Austria Tel.: +43 1 714 3187 e-mail: [email protected] www.cie.co.at

Viula, R. et al. TESTING THE PREDICTIVE POWER OF VISUAL DISCOMFORT FROM GLARE METRICS …
TESTING THE PREDICTIVE POWER OF VISUAL DISCOMFORT FROM GLARE METRICS IN THE NEAR-WINDOW AND NEAR-WALL ZONES OF
THE DAYLIT CLASSROOM ENVIRONMENT
Viula, R.1, Hordijk, T.1 1 Delft University of Technology, Delft, NETHERLANDS
DOI 10.25039/x46.2019.OP40
Abstract
The objective of the present study was to find how well a group of selected luminance-based metrics predict reported visual discomfort from daylight glare in spatial conditions that differ from the conditions where metrics tend to developed and validated for. An empirical study involving the assessment of visual discomfort from glare by n=50 subjects (n=185 cases) in a daylit-only classroom space was carried out to investigate this problem. It was found that the glare indexes were the most robust metrics predicting reported glare. However, as all metrics failed most of the statistical tests in the near-wall zone of the classroom, it can be said that none of the metrics was able to predict with enough accuracy the glare reported across the space. Indeed, the metrics show a very poor performance in the sitting positions away from the window, an aspect that requires further investigation.
Keywords: Daylight, Glare, Metrics, Spatial conditions, Classroom, Subjective assessments
1 Introduction
Several attempts to improve existing glare models for the prediction of visual discomfort from daylight glare have been carried out since the actual glare index research started in 1960. These included the creation of the Daylight Glare Index (Hopkinson, 1972) its modified version (Fisekis et al., 2003) and of the Daylight Glare Probability (Wienold and Christoffersen 2006), the first daylight glare index resulting from a wide scientific investigation. Several field studies have since then emerged investigating visual discomfort from glare in daylit spaces, making use of field-of-view luminance capture and subjective assessments (Hirning et al., 2014) (Konis, 2014) (Jakubiec and Reinhart, 2013) (Van Den Wymelenberg and Inanici, 2014) (Mahić et al., 2017). It can be observed that successful metrics differ in all these studies, challenging a consensual approach to the evaluation of daylight glare in buildings. It is interesting to verify that most of these studies took place in spaces where the distance and view direction of the subjects in relation to the daylight source are more diverse than the cellular office type where metrics tend to be developed (Fisekis et al., 2003) (Wienold and Christoffersen, 2006) (Van Den Wymelenberg and Inanici, 2014) and validated for (Wienold et al., 2017). Field-of view luminance in deeper spaces can be expected to vary quite significantly compared to the cellular office type. The motivation for the current study was therefore to find how well existing metrics predict reported daylight glare in an alternative type of space, in this case a classroom. It is important to stress that although metrics tend to be developed in the context of the office and office-based work, it is expected them to be applicable to any type of regularly occupied daylit space (CEN, 2019) (Dilaura et al., 2011).
The problem under investigation in this study is: 1) how well do existing and newly proposed visual discomfort from glare metrics predict reported discomfort in a classroom environment and 2) how good is this prediction done across space, in particular in the positions away from the window?
2 Investigated metrics
The glare metrics investigated in this study are all field-of-view luminance metrics or luminance-derived photometric quantities. It includes the relevant glare indexes, recently proposed luminance-based metrics, the two luminance contrast ratios proposed in the IES
282 Proceedings of 29th CIE Session 2019
Viula, R. et al. TESTING THE PREDICTIVE POWER OF VISUAL DISCOMFORT FROM GLARE METRICS …
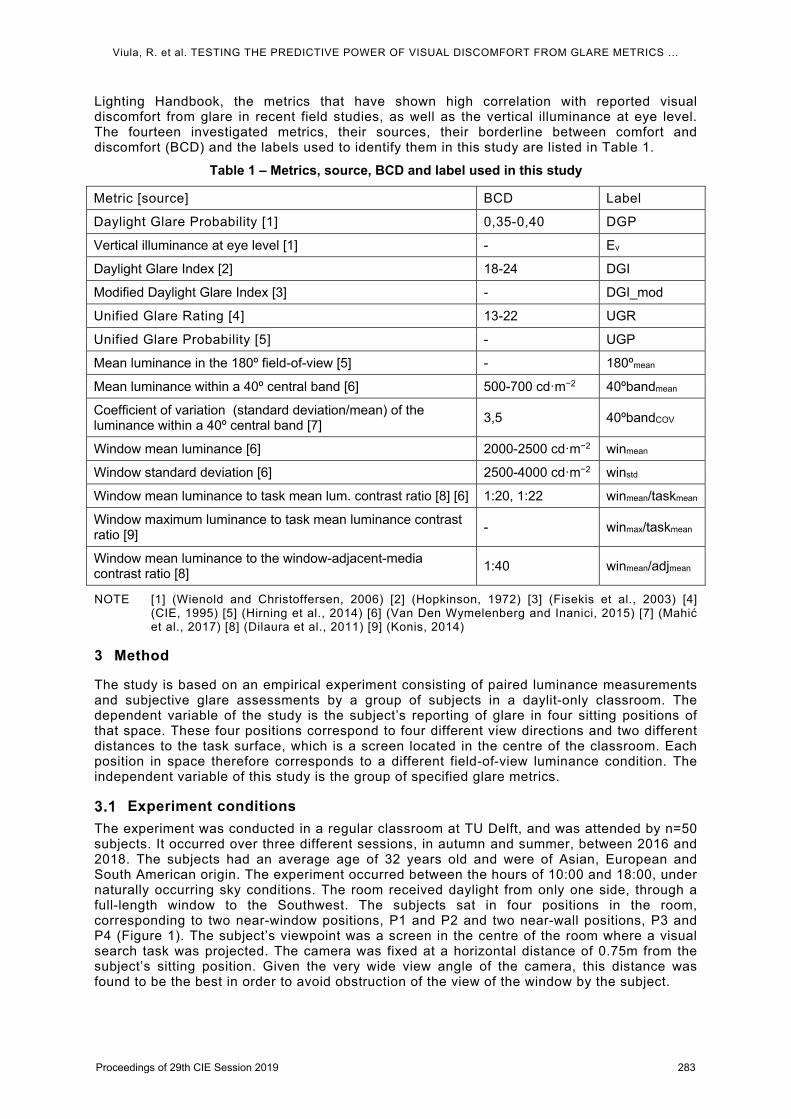
Lighting Handbook, the metrics that have shown high correlation with reported visual discomfort from glare in recent field studies, as well as the vertical illuminance at eye level. The fourteen investigated metrics, their sources, their borderline between comfort and discomfort (BCD) and the labels used to identify them in this study are listed in Table 1.
Table 1 – Metrics, source, BCD and label used in this study
Metric [source] BCD Label
Daylight Glare Probability [1] 0,35-0,40 DGP
Vertical illuminance at eye level [1] - Ev
Daylight Glare Index [2] 18-24 DGI
Modified Daylight Glare Index [3] - DGI_mod
Unified Glare Rating [4] 13-22 UGR
Unified Glare Probability [5] - UGP
Mean luminance in the 180º field-of-view [5] - 180ºmean
Mean luminance within a 40º central band [6] 500-700 cdꞏm−2 40ºbandmean
Coefficient of variation (standard deviation/mean) of the luminance within a 40º central band [7]
3,5 40ºbandCOV
Window mean luminance [6] 2000-2500 cdꞏm−2 winmean
Window standard deviation [6] 2500-4000 cdꞏm−2 winstd
Window mean luminance to task mean lum. contrast ratio [8] [6] 1:20, 1:22 winmean/taskmean
Window maximum luminance to task mean luminance contrast ratio [9]
- winmax/taskmean
Window mean luminance to the window-adjacent-media contrast ratio [8]
1:40 winmean/adjmean
NOTE [1] (Wienold and Christoffersen, 2006) [2] (Hopkinson, 1972) [3] (Fisekis et al., 2003) [4] (CIE, 1995) [5] (Hirning et al., 2014) [6] (Van Den Wymelenberg and Inanici, 2015) [7] (Mahić et al., 2017) [8] (Dilaura et al., 2011) [9] (Konis, 2014)
3 Method
The study is based on an empirical experiment consisting of paired luminance measurements and subjective glare assessments by a group of subjects in a daylit-only classroom. The dependent variable of the study is the subject’s reporting of glare in four sitting positions of that space. These four positions correspond to four different view directions and two different distances to the task surface, which is a screen located in the centre of the classroom. Each position in space therefore corresponds to a different field-of-view luminance condition. The independent variable of this study is the group of specified glare metrics.
Experiment conditions
The experiment was conducted in a regular classroom at TU Delft, and was attended by n=50 subjects. It occurred over three different sessions, in autumn and summer, between 2016 and 2018. The subjects had an average age of 32 years old and were of Asian, European and South American origin. The experiment occurred between the hours of 10:00 and 18:00, under naturally occurring sky conditions. The room received daylight from only one side, through a full-length window to the Southwest. The subjects sat in four positions in the room, corresponding to two near-window positions, P1 and P2 and two near-wall positions, P3 and P4 (Figure 1). The subject’s viewpoint was a screen in the centre of the room where a visual search task was projected. The camera was fixed at a horizontal distance of 0.75m from the subject’s sitting position. Given the very wide view angle of the camera, this distance was found to be the best in order to avoid obstruction of the view of the window by the subject.
Proceedings of 29th CIE Session 2019 283

Viula, R. et al. TESTING THE PREDICTIVE POWER OF VISUAL DISCOMFORT FROM GLARE METRICS …
4 Data collection
For the purpose of this study, only the part of the questionnaire concerning the reported visual discomfort from window glare is analysed. The question was formulated as: “When doing the test in this position, which degree of glare from the window have you experienced?”
Figure 1 – Plan view of the room (left) and views from the 4 positions (right)
The subjects were asked to respond using the 4-point scale from (Osterhaus and Bailey, 1992). In order to make sure that there was a common understanding of the scale categories among the subjects, the question was formulated using the descriptions proposed by (Osterhaus and Bailey, 1992): “Imperceptible - I do not feel any discomfort”, “Noticeable - This is a very slight discomfort that I can tolerate for approximately one day if I was placed in a desk under these conditions”, “Disturbing - I can tolerate this discomfort for 15 to 30 minutes, but I would require a change in lighting conditions for any longer period” and “Intolerable - I cannot tolerate these lighting conditions”.
The luminance capture was done with a LMK Mobile luminance-calibrated photo camera (Technoteam, 2016) (DIN, 1995) that is based on the Canon EOS70D and equipped with a sigma 4.5mm/2.8 EX DC Circular Fisheye lens. The system has an uncertainty of +/-8% and was fitted with a ND2.0 neutral density filter in the back of the lens.
Analysis sample
From the collected 200 measurements, three cases were eliminated due to problems relating to the data capture and another two cases were eliminated due to differences regarding the luminance characteristics of the sky between the camera view and the subject’s view. Cases where the sun reached the projected image area (five cases) and cases where the sun reached the screen and the subjects reported having had problems seeing the projected image (four cases) were also eliminated. A multivariable outlier analysis using the Jacknife Distances method for this dataset showed a very clear outlier that was also excluded. The studied sample if therefore comprised of 185 cases. To respond to the questions of this study the dataset will be analysed based on three samples. A full sample comprising the 185 cases, a near-window zone sample that includes the cases for positions 1 and 2 (91 cases) and a near-wall zone sample that includes the cases for positions 2 and 3 (94 cases).
Calculation
All metrics were calculated using Evalglare 2.02 (Wienold, 2017a), or derived from an Evalglare calculation output. The LMK luminance images were converted to the Radiance’s image file format PIC using pftopic (Wienold, 2017b), converted to an equi-angular projection and reduced to 1200x1200 using pcomb and pfilt (Ward, 2018), so they could be calculated by Evalglare.
DGP calculation
There are three different glare source detection methods to choose from for a DGP calculation in Evalglare: the factor method, the task method and the threshold method. It has been recommended until very recently to use the task method (Wienold and Christoffersen, 2006) (Wienold, 2014). However recent research suggests that the choice of a method should be made on the basis of the luminance characteristics of a scene (Pierson et al., 2018). A
284 Proceedings of 29th CIE Session 2019
Viula, R. et al. TESTING THE PREDICTIVE POWER OF VISUAL DISCOMFORT FROM GLARE METRICS …
pre-study for this dataset was done to test the task and the threshold calculation methods, using different glare source detection factors: the task method with a factor of 4 (DGPf4), the task method with a factor of 5 (DGPf5), the threshold method with a factor of 1000 cdꞏm−2
(DGP1000), the threshold method with a factor of 2000 cdꞏm−2 (DGP2000), and a mixed method where a threshold of 2000 cdꞏm−2 was used for the saturation scenes and the task method with a factor of 5 was used for the contrast scenes (DGPf5,2000). In this study, a saturation scene is defined as a scene with either high illuminance at eye level (Ev) or a scene where patches of sunlight can be observed in the room surfaces. Two Ev thresholds were used to identify the saturation scenes: 2000 cdꞏm−2 (DGPf5,2000
1) and 3000 cdꞏm−2 (DGPf5,20002). The definition
based on the presence or absence of sunlight within the room corresponds to DGPf5,20003.
The threshold method with factor 2000 cdꞏm−2 (DGP2000) showed the best correlations from all the tested methods for the three data samples (Table 2) and this method was chosen for further statistical analysis.
Table 2 – Spearman correlation for different DGP calculation methods for full, near-window and near-wall zone samples
Full Near-window Near-wall
rs p-value rs p-value rs p-value
DGPf5 0,356 0,000001 0,442 0,000013 0,200 0,053287
DGPf4 0,347 0,000001 0,439 0,000015 0,192 0,063725
DGP1000 0.348 0.000001 0.438 0.000016 0.189 0.067718
DGP2000 0,357 0,000001 0,447 0,000010 0,202 0,051200
DGPf5,20001 0,355 0,000001 0,437 0,000016 0,201 0,051895
DGPf5,20002 0,355 0,000001 0,439 0,000015 0,200 0,053287
DGPf5,20003 0,354 0,000001 0,444 0,000012 0,189 0,068659
Mask based calculations
Evalglare provides the possibility to calculate the luminance statistics for some pre-defined regions (e.g. 40º band) or for any other region specified by a mask file. The task, window, window-adjacent-media mask files for the four positions were provided to the programme for the calculation of the luminance in these regions (Figure 3).
Figure 3 – 40º band, task, window and window-adjacent-media region masks, for position 1
It is not specified in the IES Lighting Handbook whether the region to consider for the calculation of the window to window-adjacent-media contrast ratio should include or not the window area. For that reason, the two definitions were pre-tested, via a Spearman correlation. It was verified that the window-adjacent-media including the window region showed a better correlation (rs = –0,243, p < 0,000) with the reported glare than the window-adjacent-media excluding the window (rs = –0,125, p < 0,092) and the former method was chosen for further statistical analysis.
Proceedings of 29th CIE Session 2019 285

Viula, R. et al. TESTING THE PREDICTIVE POWER OF VISUAL DISCOMFORT FROM GLARE METRICS …
5 Statistical analysis approach
The statistical analysis approach follows a methodology that has been recently proposed by (Wienold et al., 2017). It consists of using a combination of statistical tests to find 1) the ability of a metric to describe the full glare scale and 2) the accuracy or predictive ability of the metric. As the dependent variable of this study is categorical and none of the variables have normal distribution, a Spearman correlation is used for the analysis of the ability of the metric to describe the full glare scale.
The accuracy of the prediction is analysed via three different methods: a Receiver Operating Characteristic (ROC) curve, a logistic regression and a Pearson correlation. To perform the ROC curve analysis, the reported glare variable is converted into a binary variable, whereby the responses are clustered into a “not disturbed by glare” group and “disturbed by glare” group. The area under the ROC curve (AUC) provides a measure of how well a glare metric can distinguish between the two groups. The higher the AUC the better is the performance of the metric, with an AUC > 0.7 being considered good and an AUC > 0.8 being considered very good (Šimundić, 2009). An analysis of the accuracy of the metric is done based on a pre-determined cut-off value, which is the point of the curve that is at the shortest distance to the upper left corner of a ROC plot. This point corresponds to the highest true positive rate (TPR) and highest true negative rate (TNR) of the metric’s ROC curve. In this study, the TPR stands for the correct prediction rate of reported “glare” and the TNR stands for the correct prediction rate of “no glare”. The TPR and TNR should be larger than 0.5 (or 50%) for the metric to show any discriminatory power.
As the chance of statistical error increases when multiple options (in this case metrics) are tested, Bonferroni correction is applied to the significance results of all statistical tests and the analysis is done based on that adjusted significance. The adjusted significance (αꞏ14−1 metrics) is analysed for three values of alpha - 0.05, 0.01 and 0.001, corresponding to three levels of significance - level 1 α = 3.571×10⁻³, level 2 α = 7.143×10⁻⁴ and level 3 α = 7.143×10⁻⁵, the level 3 corresponding to an extremely significant correlation.
This statistical approach is deemed to be quite robust, which is quite critical in a predictive research context.
6 Results
Most subjects reported noticeable (45%) or imperceptible (33%) levels of glare. There were more cases of glare reported for position 3 (20%) followed by position 4 (17%) and overall, there were less cases of glare reported for position 2 (14%). In positions 1, 3 and 4 glare was mostly noticeable while in position 2, glare was mostly imperceptible.
The results of the metrics (Figure 2) showed that most metrics have their higher values in position 1, but for some metrics, particularly for the window-based luminance metrics the values in position 3 and 4 are almost or as high as in position 1. Position 2 showed the lowest values for all metrics. It stands out that based on the BCD thresholds, many of the metrics predict low or no risk of glare in some or even all the positions.
7 Analysis
As described before, the analysis is done for three samples of the dataset. The analysis of the full sample is intended to provide insight on the applicability of the metrics to the classroom environment in general. The subdivision of the dataset in a near-window and near-wall zone is intended to provide insight on how good is this prediction done across space. The analysis is focused on the significance level achieved by the metrics in the statistical tests. The Spearman correlation test indicates how well the metric describes the full glare scale. The ROC curve (AUC, TPR and TNR), the logistic regression and the Pearson correlation indicate how well the metric predicts the probability of glare being reported by the subjects. For legibility of the results, metrics that fail the test are shown in red in the tables and the metric providing the best result in each test is shown in bold.
286 Proceedings of 29th CIE Session 2019

Viula, R. et al. TESTING THE PREDICTIVE POWER OF VISUAL DISCOMFORT FROM GLARE METRICS …
Ability of the metrics to describe the full glare scale
The Spearman correlation coefficient rs and significance level (sig. level) are shown in Table 3. It can be seen that for the full dataset most metrics achieve significance level 3 (extremely significant), with only 40ºbandCOV failing the test. Four metrics show low correlation (rs < 0.3) and DGP2000 shows the highest correlation coefficient (rs = 0.36). The metrics ranking the best have differences of less than 5% between each other, so it can’t be said that one metric describes significantly better the full glare scale than other.
Figure 2 – Box plots of selected metrics: DGP, DGI, UGR, 40ºbandmean, winstd and winmean/taskmean (blue band shows the BCD threshold of the metric)
For the analysis of the two zones, it can be seen that DGP2000 shows the highest correlation (rs = 0.45) in the near-window zone and two metrics fail the test (40ºbandCOV, winmean/adjmean). DGP2000, Ev, 180ºmean, winmean, winstd, winmax/taskmean achieve significance level 3. However, the difference between the correlations of these metrics is of less than 10%. As all metrics fail the significance test in the near-wall zone, it can be said that none provide satisfactory ability to predict glare across space.
Proceedings of 29th CIE Session 2019 287

Viula, R. et al. TESTING THE PREDICTIVE POWER OF VISUAL DISCOMFORT FROM GLARE METRICS …
Table 3 – Spearman correlation
Full Near-window Near-wall
rs sig. level rs sig. level rs sig. level
DGP2000 0,36 3 0,45 3 0,20 0
Ev 0,32 3 0,44 3 0,20 0
DGI 0,34 3 0,38 2 0,25 0
DGI_mod 0,34 3 0,39 2 0,24 0
UGR 0,35 3 0,40 2 0,22 0
UGP 0,35 3 0,40 2 0,22 0
180ºmean 0,29 3 0,42 3 0,19 0
40ºbandmean 0,29 3 0,39 2 0,18 0
40ºbandCOV 0,04 0 -0,02 0 -0,03 0
winmean 0,31 3 0,41 3 0,18 0
winstd 0,32 3 0,44 3 0,16 0
winmean/taskmean 0,28 2 0,34 1 0,15 0
winmax/taskmean 0,32 3 0,41 2 0,21 0
winmean/adjmean -0,24 1 -0,18 0 -0,30 0
8 Accuracy and probability of glare prediction
The ROC curve analysis includes the calculation of the area under the curve (AUC), the significance level of this statistic (Table 4), as well as the accuracy of each metric in terms of the number of correct predictions that it makes based on the true positive rate (TPR) and true negative rate (TNR) (Table 7). For these analyses, the variable’s value “not disturbed by glare” includes the “imperceptible” and “noticeable” glare responses and the variable’s value “disturbed by glare” includes the “disturbing” and “intolerable” glare responses.
For the full dataset, there are a few metrics that achieve a significant level of correlation however all metrics have AUC values lower than 0.7 showing just fair discriminatory power. DGP2000 reaches a very significant level of correlation while most of the other metrics just pass the test. For the analysis of the two zones, DGP2000, winstd and winmean/adjmean show good AUC values and significant correlations in the near-window zone. However, none of the metrics show significant correlation with the reported glare in the near-wall zone.
288 Proceedings of 29th CIE Session 2019

Viula, R. et al. TESTING THE PREDICTIVE POWER OF VISUAL DISCOMFORT FROM GLARE METRICS …
Table 4 – ROC’s Area Under the Curve (AUC) and significance
Full Near-window Near-wall
AUC sig. level AUC sig. level AUC sig. level
DGP2000 0,69 2 0,71 1 0,60 0
Ev 0,67 1 0,71 0 0,61 0
DGI 0,66 1 0,69 0 0,60 0
DGI_mod 0,66 1 0,69 0 0,60 0
UGR 0,67 1 0,70 0 0,59 0
UGP 0,67 1 0,70 0 0,59 0
180ºmean 0,65 1 0,69 0 0,60 0
40ºbandmean 0,64 0 0,68 0 0,60 0
40ºbandCOV 0,50 0 0,52 0 0,45 0
winmean 0,64 0 0,68 0 0,59 0
winstd 0,66 1 0,71 1 0,58 0
winmean/taskmean 0,62 0 0,64 0 0,57 0
winmax/taskmean 0,65 1 0,71 1 0,58 0
winmean/adjmean 0,36 0 0,40 0 0,31 0
For the accuracy of the glare prediction, the metric is analysed via a score based on the TPR and the TNR (Table 5). The higher the score the better is the combined TPR and TNR performance of the metric. Metrics that have a TPR or TNR of less than 0.5 receive a score of zero.
For the full dataset, UGR and UGP are the metrics that achieve the highest score, suggesting that these metrics are more accurate than the others. For the analysis of the two zones, UGR, UGP, DGP2000 and Ev achieve the highest score in the near-window zone. From these metrics, only DGP2000 does not score in the near-wall zone with DGI_mod, 180ºmean, winmean/taskmean and winmax/taskmean also passing the test and Ev achieving the best score. It stands out that 40ºbandCOV and winmean/adjmean fail the accuracy test for all the three samples.
Proceedings of 29th CIE Session 2019 289

Viula, R. et al. TESTING THE PREDICTIVE POWER OF VISUAL DISCOMFORT FROM GLARE METRICS …
Table 5 – ROC’s TPR, TNR and accuracy score
Full Near-window Near-wall
TPR TNR score TPR TNR score TPR TNR score
DGP2000 0,56 0,71 4 0,64 0,81 6 0,84 0,42 0
Ev 0,54 0,74 4 0,64 0,81 6 0,53 0,64 4
DGI 0,68 0,65 5 0,64 0,73 3 0,89 0,48 0
DGI_mod 0,73 0,61 5 0,64 0,76 5 0,68 0,55 2
UGR 0,76 0,61 6 0,59 0,84 6 0,68 0,52 1
UGP 0,76 0,61 6 0,59 0,84 6 0,68 0,52 1
180ºmean 0,63 0,62 4 0,68 0,72 3 0,53 0,63 3
40ºbandmean 0,61 0,62 3 0,68 0,64 1 0,79 0,44 0
40ºbandCOV 0,49 0,53 0 0,41 0,76 0 0,42 0,59 0
winmean 0,71 0,54 2 0,64 0,67 1 0,79 0,45 0
winstd 0,71 0,52 1 0,64 0,75 4 0,79 0,42 0
winmean/taskmean 0,63 0,57 2 0,50 0,70 0 0,63 0,56 2
winmax/taskmean 0,61 0,56 1 0,59 0,72 2 0,68 0,52 1
winmean/adjmean 0,49 0,51 0 0,41 0,59 0 0,37 0,63 0
The logistic regression (LR) and Pearson correlation analysis is expected to indicate if a metric can successfully predict the probability of a subject being disturbed by glare. For the logistic regression and Pearson correlation each metric variable was sorted and grouped into ten equally sized bins. The logistic regression is then applied to the binary dependent variable using the same “not disturbed by glare” / “disturbed by glare” subdivision approach used for the ROC curve. For the Pearson correlation, the average metric value in each bin is correlated with the average glare vote in each bin. Table 6 shows the results of these tests.
290 Proceedings of 29th CIE Session 2019

Viula, R. et al. TESTING THE PREDICTIVE POWER OF VISUAL DISCOMFORT FROM GLARE METRICS …
Table 6 – Logistic regression significance and Pearson correlation and significance
Full Near-window Near-wall
LR Pearson correlation
LR Pearson correlation
LR Pearson correlation
sig. r sig. sig. r sig. sig. r sig.
DGP2000 2 0,85 1 1 0,83 1 0 0,78 0
Ev 2 0,71 0 1 0,74 0 0 0,41 0
DGI 1 0,84 1 1 0,88 2 0 0,59 0
DGI_mod 1 0,90 2 1 0,94 3 0 0,64 0
UGR 1 0,92 2 1 0,94 3 0 0,64 0
UGP 1 0,92 2 1 0,91 2 0 0,64 0
180ºmean 1 0,49 0 0 0,04 0 0 0,41 0
40ºbandmean 0 0,67 0 0 0,82 0 0 0,38 0
40ºbandCOV 0 0,54 0 0 0,39 0 0 -0,09 0
winmean 0 0,19 0 0 0,39 0 0 0,30 0
winstd 1 0,48 0 1 0,76 0 0 0,29 0
winmean/taskmean 0 0,37 0 0 0,58 0 0 0,46 0
winmax/taskmean 0 0,70 0 0 0,82 0 0 0,30 0
winmean/adjmean 0 -0,43 0 0 -0,45 0 0 -0,80 0
It can be seen that for the full dataset, DGP2000 and Ev show very significant logistic regressions. For the Pearson correlation, only the glare indexes pass the significance test, with DGI_mod, UGR and UGP achieving very significant correlations.
For the analysis of the two zones, the glare indexes, the Ev and the winstd show significant logistic regressions in the near-window zone. For the Pearson correlation, only the glare indexes pass the significance test in the near-window zone, with DGI_mod and UGR achieving high significance levels. In the near-wall zone, all metrics fail the logistic regression and Pearson correlation significance tests.
9 Summary
A summary of the results of the metrics is shown in Table 7. The metrics receive a score in a scale of 0 to 3 based on their statistical significance tests, on their normalised TPR and TNR scores and on an adjustment based on the number of failed tests. A high score corresponds to a higher ability of the metric to describe the full glare scale and a higher accuracy of the glare prediction.
Proceedings of 29th CIE Session 2019 291

Viula, R. et al. TESTING THE PREDICTIVE POWER OF VISUAL DISCOMFORT FROM GLARE METRICS …
Table 7 – Summary score for the studied metrics
Metric Full Near-
window Near-Wall
DGP2000 3 3 0
Ev 1 0 0
DGI 3 1 0
DGI_mod 3 2 0
UGR 3 2 0
UGP 2 1 0
180ºmean 2 0 0
40ºbandmean 0 0 0
40ºbandCOV 0 0 0
winmean 0 0 0
winstd 0 1 0
winmean/taskmean 0 0 0
winmax/taskmean 0 0 0
winmean/adjmean 0 0 0
It can be seen that for the full dataset DGP2000, DGI, DGI_mod and UGR have the best performance of all metrics.
For the analysis of the two-zones, DGP2000 produced the best result near the window followed by DGI_mod and UGR.
In the near-wall zone all metrics receive a score of zero due to their very poor performance in the significance tests.
10 Conclusion
The objective of this study was to find how well a group of metrics predict reported visual discomfort from daylight glare in a classroom environment and across that same space. It was found that glare indexes were the most robust metrics predicting the reported visual discomfort from glare.
In the near-window zone, DGP2000 was the best performing metric having passed all the statistical tests while in the near-wall zone all metrics consistently failed the significance statistical tests.
Based on the results of this study, none of the metrics seem to be robust enough to predict visual discomfort from glare across space.
It was verified that discomfort from glare was reported for low luminance conditions, a result that is in line with findings from other studies in non-cellular office spaces and in particular in field-studies. In those studies, contrast glare was often found to be the major source of reported discomfort, with absolute luminance and window-based contrast ratios being quite successful predictors. That was not the case in this study, were the glare indexes tended to outperform those metrics. It is however important to note that there is a lot of room for interpretation in the way some region-based metrics are calculated.
The present study was limited to a range of four spatial conditions that should be extended in future studies for a better understanding of the visual discomfort from glare problem across space.
292 Proceedings of 29th CIE Session 2019

Viula, R. et al. TESTING THE PREDICTIVE POWER OF VISUAL DISCOMFORT FROM GLARE METRICS …
Acknowledgements
The authors would like to thank Sylvia Jansen from TU Delft and Jan Wienold from EPFL. Raquel Viula is funded by the Portuguese Fundação para a Ciência e Tecnologia (FCT) under the POCH programme, with grand number SFRH/BD/ 93536/2013.
References
CEN 2019. European Standard EN 17037:2019-03 Daylight in Buildings. CEN.
CIE 1995. Discomfort Glare in Interior Lighting. Commission Internatiónale de l’Éclairage.
Dilaura, D.L., Houser, K.W., Mistrick, R.G. and Steffy, G.R. 2011. The Lighting Handbook: Reference and Application, 10th Ed. New York: IESNA.
DIN 1995. DIN 5032-6. Lichtmessung, Teil 6: Photometer, Begriffe, Eigenschaften und deren Kennzeichnung. Deutsches Institut fur Normung E.V.
Fisekis, K., Davies, M., Kolokotroni, M. and Langford, P. 2003. Prediction of discomfort glare from windows. Lighting Research and Technology, 35(4), 360–369.
Hirning, M.B., Isoardi, G.L. and Cowling, I. 2014. Discomfort glare in open plan green buildings. Energy and Buildings, 70, 427–440.
Jakubiec, J.A. and Reinhart, C. 2013. Predicting Visual Comfort Conditions In A Large Daylit Space Based On Long-term Occupant Evaluations: A Field Study. In: 13th Conference of International Building Performance Simulation Association. France, Chambéry: IBPSA, 3408–3415.
Konis, K. 2014. Predicting visual comfort in side-lit open-plan core zones: Results of a field study pairing high dynamic range images with subjective responses. Energy and Buildings, 77, 67–79.
Mahić, A., Galiciano, K. and Van Den Wymelenberg, K. 2017. A pilot daylighting field study: Testing the usefulness of laboratory-derived luminance-based metrics for building design and control. Building and Environment, 113, 78–91.
Osterhaus, W. and Bailey, I. 1992. Large area glare sources and their effect on visual discomfort and visual performance at computer workstations. In: Industry Applications Society Annual Meeting. Houston.
Pierson, C., Wienold, J. and Bodart, M. 2018. Daylight Discomfort Glare Evaluation with Evalglare: Influence of Parameters and Methods on the Accuracy of Discomfort Glare Prediction. Buildings, 8(8), 94.
Šimundić, A.-M. 2009. Measures of Diagnostic Accuracy: Basic Definitions. EJIFCC, 19(4), 203–211.
Technoteam 2016. LMK mobile air camera photometer. Ilmenau, February 2016.
Van Den Wymelenberg, K. and Inanici, M. 2014. A Critical Investigation of Common Lighting Design Metrics for Predicting Human Visual Comfort in Offices with Daylight. LEUKOS, 10(3), 145–164.
Van Den Wymelenberg, K. and Inanici, M. 2015. Evaluating a New Suite of Luminance-Based Design Metrics for Predicting Human Visual Comfort in Offices with Daylight. LEUKOS, 0(0), 1–26.
Ward, G. 2018. Radiance 5.0.a.12 Darwin. Denver: NREL.
Wienold, J., Kuhn, T., Christoffersen, J., Sarey Khanie, M. and Andersen, M. 2017. Comparison of luminance based metrics in different lighting conditions. In: CIE 2017 Midterm meeting, Smarter Lighting for Better Life. CIE 2017 Midterm meeting. Republic of Korea, Jeju: CIE.
Wienold, J. 2014. Daylight Glare analysis and metrics. In: 13th Radiance Workshop. London, UK: radiance-online.org.
Proceedings of 29th CIE Session 2019 293

Viula, R. et al. TESTING THE PREDICTIVE POWER OF VISUAL DISCOMFORT FROM GLARE METRICS …
Wienold, J. 2017a. Evalglare 2.02. Lausanne: EPFL.
Wienold, J. 2017b. pftopic. Freiburg: Fraunhofer Institute for Solar Energy Systems.
Wienold, J. and Christoffersen, J. 2006. Evaluation methods and development of a new glare prediction model for daylight environments with the use of CCD cameras. Energy and Buildings, 38(7), 743–757.
294 Proceedings of 29th CIE Session 2019