Place-Based Point-of-Care Patient Education Reaching Ultra-Targeted Women, Digital OOH Advertising.
Upload
pakistanadvertiserssocietyCategory
view
489download
1
Copyright Winning Solutions 2014
Karachi Lahore Islamabad/Rawalpindi Faisalabad Multan

Copyright Winning Solutions 2014
Our Vision
To be the market leader in giving value to our clients, the value generated through our best in class research services, innovative ideas, technology solutions, superior client servicing team and most importantly the value
for client’s money.
2

Copyright Winning Solutions 2014Copyrights reserved by Winning Solutions 2015Copyrights reserved by Winning Solutions 2015
• Winning Solutions is a fast growing research company, managed & controlled by 28+
permanent and around 300 ad-hoc research professionals. Our combined international
market research experience is over 50 years
• We are a local research house with an international presence and vision, with quality
research products and solutions.
• Winning Solutions has been in the Outdoor tracking and monitoring business since 2012, we
have covered over 60 cities of Pakistan, over 12000 sites, and conducted over 120,000
tracking visits.
• Outdoor tracking and research is an integral part of the overall business portfolio being
primarily a market research and strategy specialists.
• Our other business expertise include, customized and tracking research and software
solutions with many blue chip companies as our satisfied clients.

Copyright Winning Solutions 2014Copyrights reserved by Winning Solutions 2015Copyrights reserved by Winning Solutions 2015
Background
Methodology
Outdoor Media Outlook
Topline Results
City Exposure
Exposure by Medium
Category Manufacturer Brand Split

Copyright Winning Solutions 2014Copyrights reserved by Winning Solutions 2015
Winning Solutions; the market research experts since 2010 and have many firsts in Outdoor media research including
Census, OOH consumer research, ROI calculations and numerous tracking projects.
Advertising expense tracking specific to Out of Home industry has been launched for the first time in Pakistan by Winning
Solutions
We identified the gap that there is no credible Ad spent data on Outdoor media and what is available are just
guesstimates.
Outdoor Media Census was taken as the benchmark for establishing the outdoor media Adex, and we enhanced the scope
since census was done in May last year.
Adex quality was monitored with Winning Solutions specialized tracking system “WS-Tracker” & data collection software
“WS-Activision”.

Copyright Winning Solutions 2014Copyrights reserved by Winning Solutions 2015
We have covered over 5000 sites across 150 main arteries in top 5 cities of Pakistan.
All the sites were covered twice in a month (once every fortnight) to ensure that we have covered the full
month display period twice.
Current report is OOH boards specific and does not include Pole signs in it these shall be covered in Jan report
as data is currently being collected.
Data was collected only from Permanent OOH structures on the identified roads.
Values are estimated with average market rates collected for different mediums across different roads and
locations from various OMAS.
No discount factors are applied as they vary from agency to agency and client to client.

Copyright Winning Solutions 2014Copyrights reserved by Winning Solutions 2015

Copyright Winning Solutions 2014Copyrights reserved by Winning Solutions 2015Copyrights reserved by Winning Solutions 2015
City No. of Roads Total Boards Total Average Value Most Common OOH Medium
Karachi 42 2426 634,622,020 Small Hoardings (20x10)
Lahore 32 744 362,986,472 Large Hoardings 60x20)
Islamabad 27 371 101,731,677 Pylons/High marks
Rawalpindi 10 633 78,820,000 Small Hoardings (20x10)
Faisalabad 21 309 36,318,056 Large Hoardings 60x20)
Multan 20 537 25,432,500 Small Hoardings (20x10)
Total 152 5019 1,239,910,725
Total no. of boards count in TOP 5 cities is recorded to be 5019.
Pole Signs were not covered in December there count/value is not included in the above mentioned figures.
Karachi holds around 51% market for OOH Media advertisements.
Highest number of boards are Small Hoardings (20x10) in terms of volume .

Copyright Winning Solutions 2014Copyrights reserved by Winning Solutions 2015Copyrights reserved by Winning Solutions 2015
58% of the total boards with the projected value of 757 million was used for branding where as 42% of the boards with the value of 482 million remained
vacant in December.
Karachi holds the major share in OOH Media market, In December 55% of the space with the estimated value of 349 million was used for branding
whereas 46% of the space with the value of 284 million remained unused.
45% of the boards with the value of 116 million were vacant where as 55% boards with the value of 246 million were occupied and large Hoardings
(60x20) was the most frequently used medium in Lahore.
Vacant Advertised
Volume % Value % Volume % Value %
Karachi 46% 45% 54% 55%
Lahore 45% 32% 55% 68%
Islamabad 27% 29% 73% 21%
Rawalpindi 44% 43% 56% 57%
Faisalabad 24% 23% 76% 77%
Multan 36% 39% 64% 61%

Copyright Winning Solutions 2014Copyrights reserved by Winning Solutions 2015Copyrights reserved by Winning Solutions 2015
In Islamabad boards with the projected value of 72 million were used for branding and Pylons/High marks were the
most common medium.
Rawalpindi holds the 3rd largest share in OOH Media market, 56% boards valuing 44 million
was used in December whereas Small Hoarding is the most used medium for branding in
Rawalpindi.
In Faisalabad & Multan boards with the value of 8 million & 10 million respectively remained vacant for branding in
December.
Copyright Winning Solutions 2014Copyrights reserved by Winning Solutions 2015
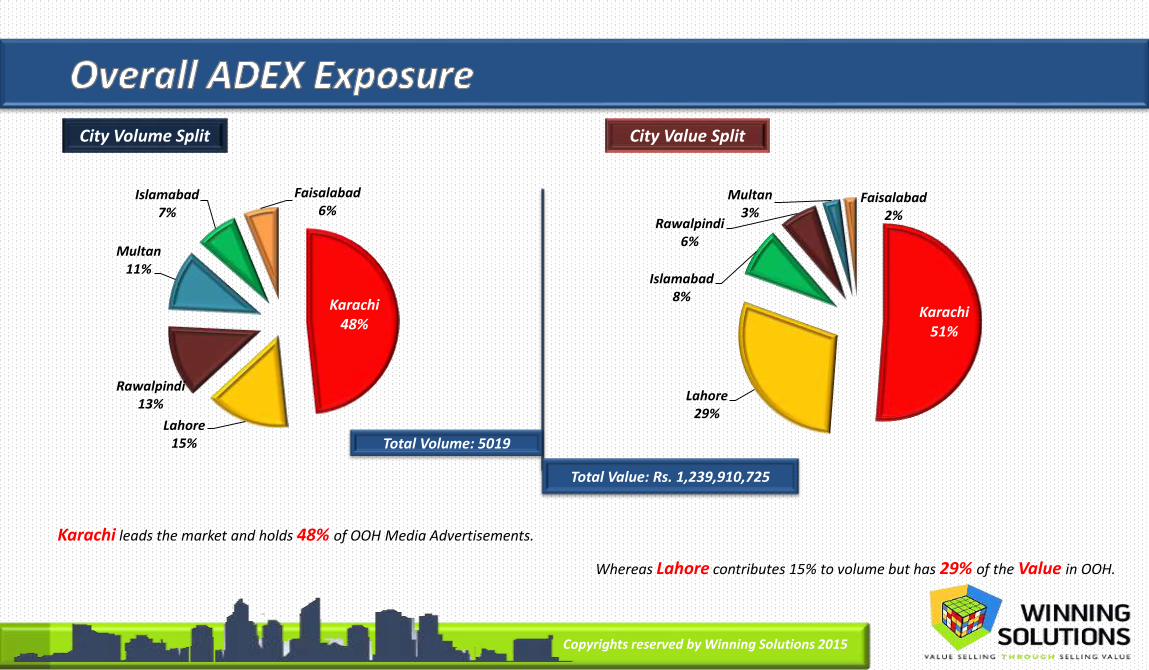
Karachi48%
Lahore15%
Rawalpindi13%
Multan11%
Islamabad7%
Faisalabad6%
Karachi51%
Lahore 29%
Islamabad8%
Rawalpindi6%
Multan3%
Faisalabad2%
Karachi leads the market and holds 48% of OOH Media Advertisements.
Whereas Lahore contributes 15% to volume but has 29% of the Value in OOH.
Total Volume: 5019
City Volume Split
Total Value: Rs. 1,239,910,725
City Value Split

Copyright Winning Solutions 2014Copyrights reserved by Winning Solutions 2015
Small Hoardings
37%
Large Hoardings
30%
Medium Hoardings
7%
Mega Structure
7%
Bus Shelters6%
Pylons/ Hi Marks
6%
Bridge Branding
4%
Gantry2% Mopi
1%
Trivision0%
Underpass Branding
0%
Roundabout Branding
0%
Large Hoardings
48%
Mega Structure
18%
Bridge Branding13%
Medium Hoardings
6%
Small Hoardings6%
Gantry5%
Bus Shelters2%
Pylons/ Hi Marks1%
Trivision1%
Underpass Branding
0%
Mopi0%
Roundabout Branding
0%
Above pie graph shows the percentage breakdown for OOH Media in all the mediums based on their volume & values
Total Volume: 5019
Total Value: Rs. 1,239,910,725
Medium Volume Split Medium Value Split

Copyright Winning Solutions 2014Copyrights reserved by Winning Solutions 2015
0%
1%
0%
3%
0%0% 0% 0% 0%
2%
0% 0%1%
1% 0% 1% 0%1% 0%
4%
0% 0% 0% 0%
3% 3%1%
16%
1%2%
1% 2%
0%
21%
0%
0%2%
0%
7%
2%
2%
0% 0% 0%
2%
0% 0%0%
0% 0% 1%
2%
0% 0% 0%0%
7%
0% 0%
1%
0% 0%
3%
0%
2%
0% 0%0%
6%
0%
0%
BridgeBranding
Bus Shelters Gantry LargeHoardings
MediumHoardings
MegaStructure
Mopi Pylons/ HiMarks
RoundaboutBranding
SmallHoardings
Trivision UnderpassBranding
Faisalabad Islamabad Karachi Lahore Multan Rawalpindi
Volume Split
NOTE: Sum of all equals 100%. E.g. Small Hoardings in Karachi are 21% of the overall universe of top 5 cities

Copyright Winning Solutions 2014Copyrights reserved by Winning Solutions 2015
0% 0% 0%
2%
0% 0% 0% 0% 0% 0% 0% 0%
2%0%
1% 1%0%
2%
0%1%
0% 0% 1% 0%
11%
0%
3%
27%
1%
5%
0% 0% 0%
3%
0% 0%0%1%
0%
14%
4%
9%
0% 0% 0%1%
0% 0%0% 0% 0%1% 1% 0% 0% 0% 0% 0% 0% 0%
1%0% 0%
3%
0%2%
0% 0% 0% 0% 0% 0%
BridgeBranding
Bus Shelters Gantry LargeHoardings
MediumHoardings
MegaStructure
Mopi Pylons/ HiMarks
RoundaboutBranding
SmallHoardings
Trivision UnderpassBranding
Faisalabad Islamabad Karachi Lahore Multan Rawalpindi
165 22 609 73 227 1.860 1.2 168 8.1 5.1 13
Million Million Million Million Million Million Million Million Million Million Million Million
In Million
Value
NOTE: Sum of all equals 100%. E.g. Large hoardings in Karachi are 27% of the overall universe of top 5 cities

Copyright Winning Solutions 2014Copyrights reserved by Winning Solutions 2015

Copyright Winning Solutions 2014Copyrights reserved by Winning Solutions 2015Copyrights reserved by Winning Solutions 2015
Apparel & Clothing brands were the top spender on OOH media in December followed by Telecom & then Biscuits at an estimated 162 million,
85 million and 35 million respectively.
Top 3 Clients dished out an approximate 131 million in December with Telenor spending 51 mil, Gul Ahmed 50.7 and
Mondelez 29.7 million across top 5 cities of Pakistan.
Top 3 Brands Gul Ahmed with the value of 50.7 million, Dairy milk 29.7 million and Telenor spread amongst Talkshawk and 3G branding
Gul Ahmed and Khaddi were top slot spenders of the apparel category in December amounting to more than half
the spent of the category.
Mondelez was the major spender in confectionary with the branding of over 90% of the spent in the category.
Telenor led the way in Telcos branding followed by Mobilink with quarter of the spent as compared to Telenor.
Unilever & P&G were neck to neck in the outdoor spending with approximately 19 and 18 million of spending in December.

Copyright Winning Solutions 2014Copyrights reserved by Winning Solutions 2015
15%
Total Category Spent: 757 million
In million
Share of Spend
42%
11%
5%
4%
3%
3%
3%
2%
2%
2%
To Let
Apparel
Telecom
Real Estate
Education
Fast Food
Hand wash
Skin Care
Ghee & Cooking…
Biscuits & CakesShare of Space
In Million
482
162
84
35
35
33
31.9
30
27
25
39%
13%
7%
3%
3%
3%
3%
2%
2%
2%
To Let
Apparel
Telecom
Biscuits & Cakes
Real Estate
Fast Food
Hand wash
Confectionary
Mobile Phones
Ketchup and Sauces

Copyright Winning Solutions 2014Copyrights reserved by Winning Solutions 2015
482
66 51.3 50.7 29.7 23.8 23.5 19.8 19
39%
5% 4% 4% 2% 2% 2% 2% 2% 1%
To Let Others Telenor GulAhmed
Mondelz Khaadi ShezanIntl.
EBM UnileverPakistan
Ltd
Procter &Gamble
18.3
In million
Share of Spend
42%
9%
3%
3%
1%
1%
1%
1%
1%
1%
To Let
Others
Telenor
Gul Ahmed
Hashim Tajir
Mondelz
Khaadi
EBM
Unilever Pakistan Ltd
Shezan Intl. Share of Space
In Million
Total Client Spent: 757 million

Copyright Winning Solutions 2014Copyrights reserved by Winning Solutions 2015
482
50.7 29.7 2723.8 23.5
21.5 15.9 12.7 12.5
39%
4%2% 2% 2% 2%
2% 1% 1% 1%
To Let GulAhmed/Ideas
Dairy Milkchocolate
Telenor Khaadi ShezanKetchup
Talk shalk Gluco Biscuit Mobilink Brite
42%
3%
1%
1% 1% 1% 1% 1% 1% 1%
To Let GulAhmed/Ideas
Telenor Tibet Soap Dairy Milkchocolate
Khaadi Pizza Hutt Talk shalk ShezanKetchup
Gluco Biscuit
Total Brands Spent: 757 million
In million
Share of Spend
Share of Space
In Million

Copyright Winning Solutions 2014Copyrights reserved by Winning Solutions 2015

Copyright Winning Solutions 2014Copyrights reserved by Winning Solutions 2015
45%
10%
7%4% 3% 3% 3% 2%
2% 2%
284
64.945.2
45.2
21.9
18.2
17
14.311.3
9.5
284
19.5
45%
3% 3%3%
2% 2% 2%1% 1%
1%
17.9 15.9
10.2 10 9.8
9.5 8.4 7.5
284
33.9
22.5
19.5
45%
5%4%
3% 3%2% 2% 2% 2% 2%
17.8
14.2
11.6
10.5
10.2
9.8
In Million
Category Clients
In Million
Brands
In Million
Total Media Spent: 356 million (46%)

Copyright Winning Solutions 2014Copyrights reserved by Winning Solutions 2015
32%
7%5%
3%3% 3% 2% 2% 2% 2%
32%
19%
6%
4% 3% 3% 3% 2% 2% 2%
32%
7%
3%3% 2% 2% 2% 2% 1% 1%
To Let GulAhmed
Khaadi Dairy Milk ShezanKetchup
Mobilink Telenor GlucoBiscuit
Big dealMcdonal
Warda
116
116
23.3
15.2
11.6
11
9.3
8.4
7.6
7
115.8
25.3
11.9
11
8.9
7
6.5
5.8
5.3
5.1
115.8
25.3
18.5
11.9
11
10.3
8.9
7
6.8
6
In Million
Category Clients
In Million
Brands
In Million
Total Media Spent: 251 million (33%)

Copyright Winning Solutions 2014Copyrights reserved by Winning Solutions 2015
43%
10%8%
5%2%
2% 2% 2% 2% 2%
In million
34.2
1.6
1.6
1.5
1.4
1.2
1.2
43%
2% 2%2% 2%
2% 2%2% 1%
1%
To Let Capitalbuilders
TapalTezdam
GreenCity
Bonanza GulAhmed
Khaadi GraceLand
Telenor3G
Charji
1.1
1.1
1
34.2
6.7
1.6
1.6
1.4
1.2
1.2
1.2
1.2
1.1
34.2
8.3
6
4.3
1.7
1.6
1.6
1.4
1.4
1.4
In Million
Category Clients
In Million
Brands
In Million
43%
8%
2% 2%
2%2% 2% 2% 2%
2%
Total Media Spent: 44 million (6%)

Copyright Winning Solutions 2014Copyrights reserved by Winning Solutions 2015
29%
13%
12%
8%
4%
3%3% 3%
2%2%
29%
14 %
3%
3% 3%3% 2% 2% 2% 2%
29%
5%
3%3% 3% 2%
2% 2% 2%2%
In million29.1
12.8 12
7.6
3.8
3.3
3.1
2.8
2.5
2.3
29.6
4.9
3.3
3
2.7
2.2
2
1.9
1.8
1.7
29.1
14
3.3
3.1
3
2.7
2.2
2.2
2
1.6
In Million
Category Clients
In Million
Brands
In Million
Total Media Spent:76 million (10%)

Copyright Winning Solutions 2014Copyrights reserved by Winning Solutions 2015
9%7%
4% 4%3% 3%
2%
23%
17%
3%
7%5%
5%
3% 3%2% 2% 2%
2%
23%
23%
7%
4%3% 3% 2% 2% 2% 2% 2%
In million8.3
6.3
3.1
2.5
1.4
1.3
1.2
0.9
0.9
0.8
8.3
2.4
1.8
1.8
1
1
0.8
0.8
0.8
0.7
8.3
2.4
1.3
1
1
0.8
0.8
0.8
0.7
0.6
In Million
Category Clients
In Million
Brands
In Million
Total Media Spent: 27 million (3%)

Copyright Winning Solutions 2014Copyrights reserved by Winning Solutions 2015
39%
3% 3%2% 2%
2% 2% 1% 1% 1%
39%
10%8%
7%3%
2% 2% 2% 2% 2%
39%
11%
4%
3%3% 2% 2%
2% 2% 1%
In million
100
0.7
0.6
0.6
0.5
0.5
0.4
0.3
0.3
0.3
100
2.7
0.9
0.8
0.6
0.6
0.5
0.4
0.3
0.3
100
2.4
1.9
1.6
0.7
0.6
0.5
0.5
0.5
0.5
In Million
Category Clients
In Million
Brands
In Million
Total Media Spent: 15 million (2%)

Copyright Winning Solutions 2014Copyrights reserved by Winning Solutions 2015

Copyright Winning Solutions 2014Copyrights reserved by Winning Solutions 2015
40%
12%6%
4% 3% 3%2% 2% 2% 2%
To Let Apparel Telecom Real Estate Biscuits & Cakes Fast Food Ghee & CookingOil
Mobile Phones Skin Care Hand wash
357,000
58,000 57,000 52,00073,000101,00063,00074,000
175,000
1.1 million
Category
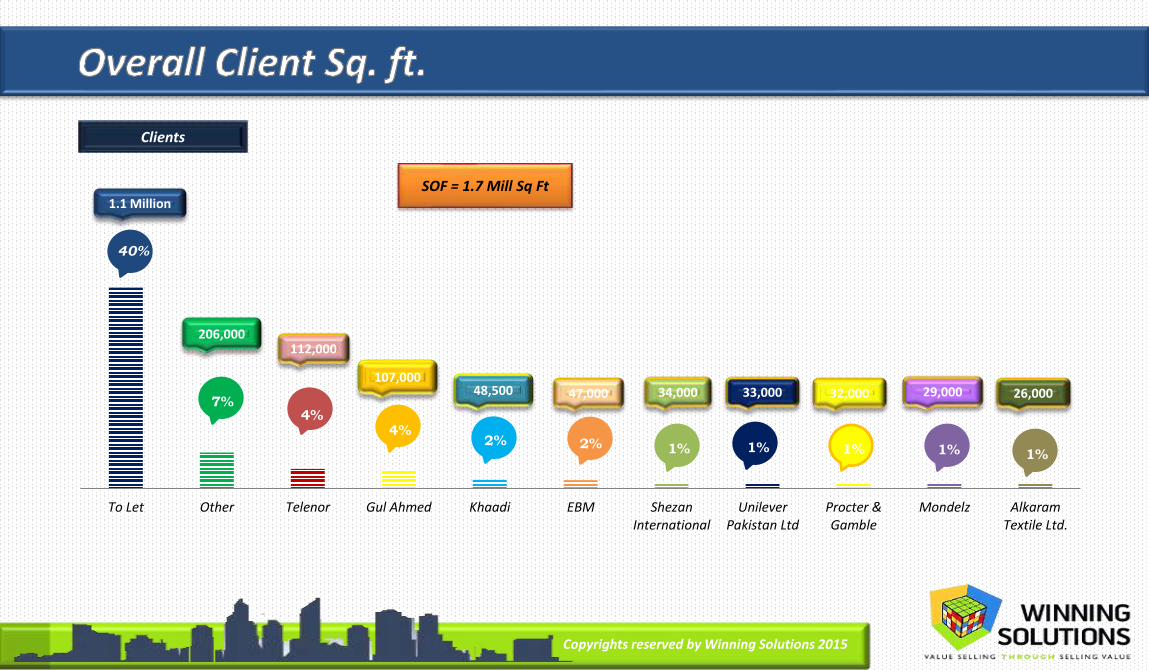
SOF = 1.7 Mill Sq Ft
Copyright Winning Solutions 2014Copyrights reserved by Winning Solutions 2015
40%
7%4%
4%2% 2% 1% 1% 1% 1% 1%
To Let Other Telenor Gul Ahmed Khaadi EBM ShezanInternational
UnileverPakistan Ltd
Procter &Gamble
Mondelz AlkaramTextile Ltd.
206,000
33,000 32,000 29,000 26,00047,000107,000
34,00048,500
112,000
1.1 Million
Clients
SOF = 1.7 Mill Sq Ft

Copyright Winning Solutions 2014Copyrights reserved by Winning Solutions 2015
40%
4%
2%2% 2%
1% 1% 1% 1% 1%
To Let GulAhmed/Ideas
Telenor Khaadi Talk shalk Gluco Biscuit Shezan Ketchup Dairy Milkchocolate
Alkaram/Alkaram Studio
Amna Ismail
0.10
0.029 0.026 0.0230.0410.048
0.0320.045
0.058
1.1
Brands
SOF = 1.7 Mill Sq Ft

Copyright Winning Solutions 2014Copyrights reserved by Winning Solutions 2015
For Details or Subscription Contact:
Syed Ali Moazzam [email protected] 0345-8591450
Farnaz Ghufran [email protected] Head Karachi 0345-8591465
M. Tanveer Ahmed [email protected] Research Executive 0345-8591454