OOH and M&A – 2016 Reflection and 2017 Look Forward · What PJSC Covers in OOH / DOOH / Digital...
27
OCTOBER 26, 2016 OOH and M&A – 2016 Reflection and 2017 Look Forward Mark Boidman Managing Director, Peter J. Solomon Company @Mboidman @PJSCtweets
Transcript of OOH and M&A – 2016 Reflection and 2017 Look Forward · What PJSC Covers in OOH / DOOH / Digital...
OCTOBER 26, 2016
OOH and M&A – 2016 Reflection and 2017 Look ForwardMark BoidmanManaging Director, Peter J. Solomon Company
@Mboidman@PJSCtweets
PRIVATE AND CONFIDENTIAL
1
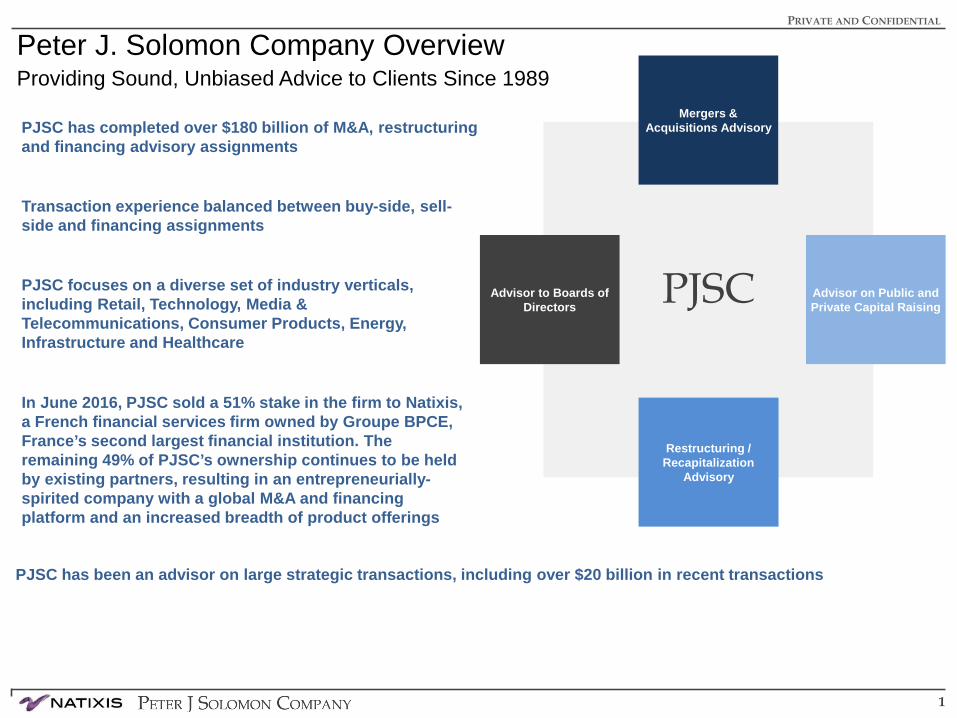
Peter J. Solomon Company OverviewProviding Sound, Unbiased Advice to Clients Since 1989
PJSC has completed over $180 billion of M&A, restructuring and financing advisory assignments
PJSC focuses on a diverse set of industry verticals, including Retail, Technology, Media & Telecommunications, Consumer Products, Energy, Infrastructure and Healthcare
Transaction experience balanced between buy-side, sell-side and financing assignments
Mergers & Acquisitions Advisory
Restructuring / Recapitalization
Advisory
Advisor on Public and Private Capital Raising
Advisor to Boards of Directors
PJSC
PJSC has been an advisor on large strategic transactions, including over $20 billion in recent transactions
In June 2016, PJSC sold a 51% stake in the firm to Natixis, a French financial services firm owned by Groupe BPCE, France’s second largest financial institution. The remaining 49% of PJSC’s ownership continues to be held by existing partners, resulting in an entrepreneurially-spirited company with a global M&A and financing platform and an increased breadth of product offerings
PRIVATE AND CONFIDENTIAL
2
POS
Local
Airport / Aerial / Water
Transit / Taxi
Stadium / Arena
Movie Theater
BillboardNational
Retail
Point of Care
Latin America
Background Music
Grocery
Content
Agency
Gas Station
Shopping MallHotel
Office / Elevator
Health / Personal Care
Bar / Club
Restaurant Solutions / Kiosk / Other
Smart Cities
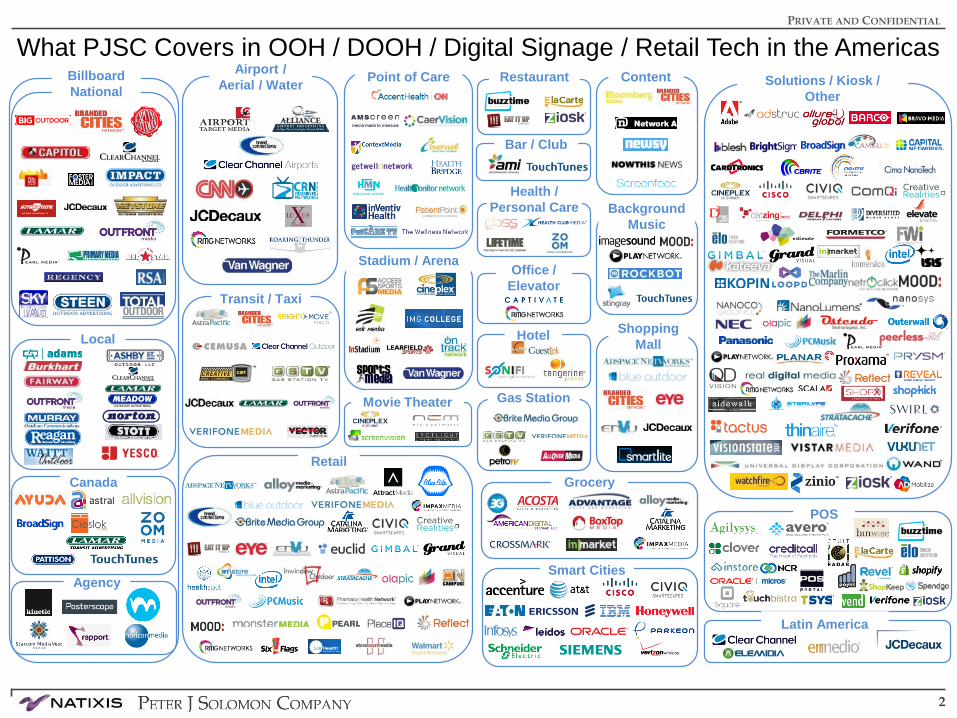
What PJSC Covers in OOH / DOOH / Digital Signage / Retail Tech in the Americas
Canada

3
What PJSC Covers in OOH / DOOH / Digital Signage / Retail Tech in Europe, Africa and Asia Pacific
Solutions / Kiosk / OtherBillboard / Outdoor/ Agency Digital Out of Home
France
Poland
POS
Belgium
Germany
Italy
Netherlands
Portugal
Spain
Scandinavia
`
Eastern Europe
Australia
Africa
Southeast Asia
India
China
Middle East
U.K.
Turkey
Japan
PRIVATE AND CONFIDENTIAL
4
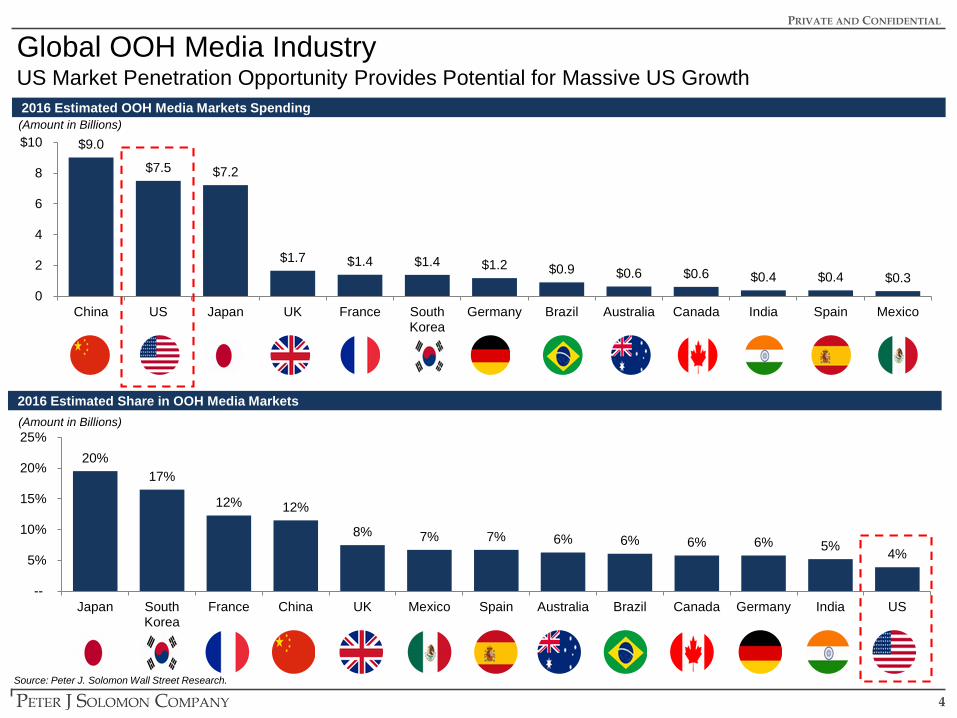
$9.0
$7.5 $7.2
$1.7 $1.4 $1.4 $1.2 $0.9 $0.6 $0.6 $0.4 $0.4 $0.3 0
2
4
6
8
$10
China US Japan UK France SouthKorea
Germany Brazil Australia Canada India Spain Mexico
Global OOH Media Industry
Source: Peter J. Solomon Wall Street Research.
2016 Estimated OOH Media Markets Spending(Amount in Billions)
2016 Estimated Share in OOH Media Markets(Amount in Billions)
US Market Penetration Opportunity Provides Potential for Massive US Growth
20% 17%
12% 12%
8% 7% 7% 6% 6% 6% 6% 5% 4%
--
5%
10%
15%
20%
25%
Japan SouthKorea
France China UK Mexico Spain Australia Brazil Canada Germany India US
5
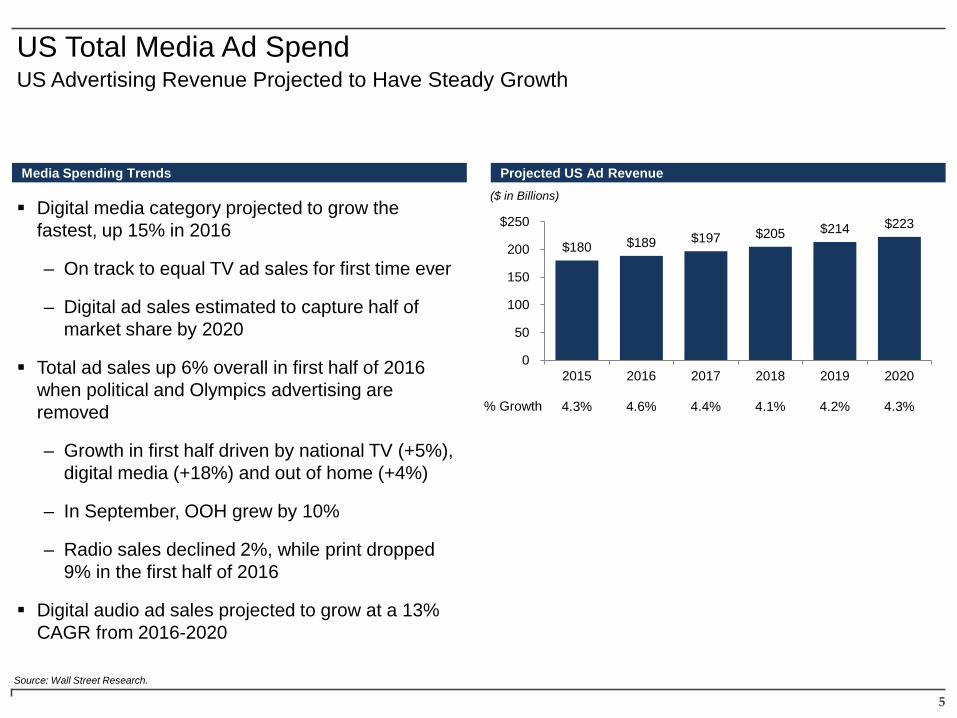
US Total Media Ad SpendUS Advertising Revenue Projected to Have Steady Growth
Source: Wall Street Research.
Projected US Ad Revenue($ in Billions)
% Growth
Digital media category projected to grow the fastest, up 15% in 2016
– On track to equal TV ad sales for first time ever
– Digital ad sales estimated to capture half of market share by 2020
Total ad sales up 6% overall in first half of 2016 when political and Olympics advertising are removed
– Growth in first half driven by national TV (+5%), digital media (+18%) and out of home (+4%)
– In September, OOH grew by 10%
– Radio sales declined 2%, while print dropped 9% in the first half of 2016
Digital audio ad sales projected to grow at a 13% CAGR from 2016-2020
Media Spending Trends
$180 $189 $197 $205 $214 $223
0
50
100
150
200
$250
2015
4.3%
2016
4.6%
2017
4.4%
2018
4.1%
2019
4.2%
2020
4.3%
PRIVATE AND CONFIDENTIAL
6
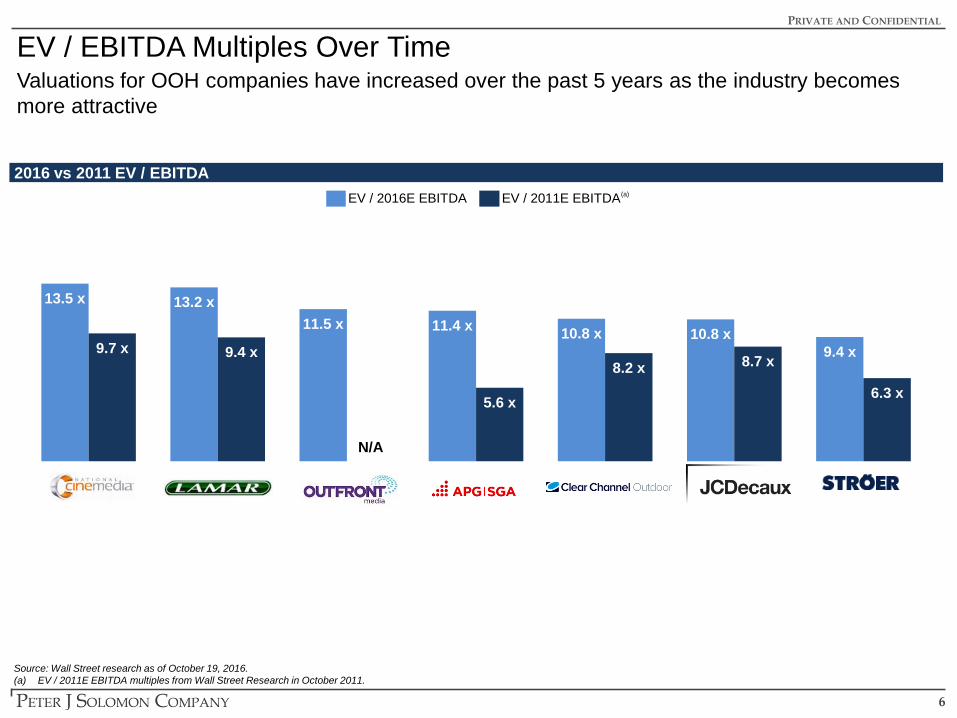
2016 vs 2011 EV / EBITDA
Source: Wall Street research as of October 19, 2016.(a) EV / 2011E EBITDA multiples from Wall Street Research in October 2011.
EV / EBITDA Multiples Over TimeValuations for OOH companies have increased over the past 5 years as the industry becomes more attractive
(a)EV / 2016E EBITDA EV / 2011E EBITDA
13.5 x 13.2 x 11.5 x 11.4 x 10.8 x 10.8 x
9.4 x 9.7 x 9.4 x
N/A
5.6 x
8.2 x 8.7 x
6.3 x
7
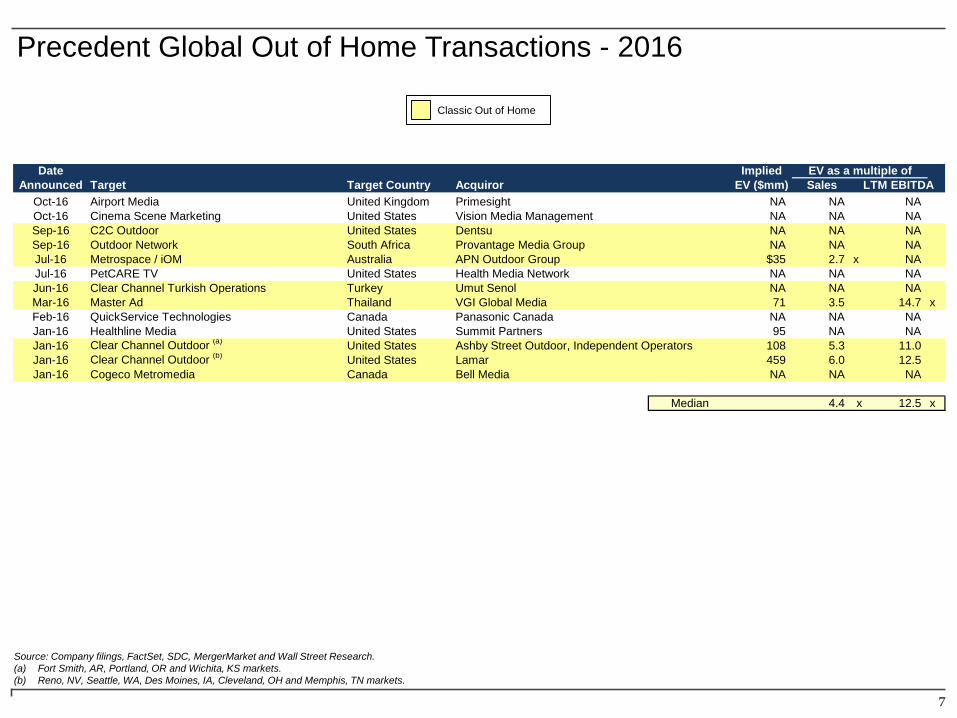
Precedent Global Out of Home Transactions - 2016
Source: Company filings, FactSet, SDC, MergerMarket and Wall Street Research. (a) Fort Smith, AR, Portland, OR and Wichita, KS markets.(b) Reno, NV, Seattle, WA, Des Moines, IA, Cleveland, OH and Memphis, TN markets.
Classic Out of Home
Date Implied EV as a multiple ofAnnounced Target Target Country Acquiror EV ($mm) Sales LTM EBITDA
Oct-16 Airport Media United Kingdom Primesight NA NA NAOct-16 Cinema Scene Marketing United States Vision Media Management NA NA NASep-16 C2C Outdoor United States Dentsu NA NA NASep-16 Outdoor Network South Africa Provantage Media Group NA NA NAJul-16 Metrospace / iOM Australia APN Outdoor Group $35 2.7 x NAJul-16 PetCARE TV United States Health Media Network NA NA NAJun-16 Clear Channel Turkish Operations Turkey Umut Senol NA NA NAMar-16 Master Ad Thailand VGI Global Media 71 3.5 14.7 xFeb-16 QuickService Technologies Canada Panasonic Canada NA NA NAJan-16 Healthline Media United States Summit Partners 95 NA NAJan-16 Clear Channel Outdoor (a) United States Ashby Street Outdoor, Independent Operators 108 5.3 11.0Jan-16 Clear Channel Outdoor (b) United States Lamar 459 6.0 12.5Jan-16 Cogeco Metromedia Canada Bell Media NA NA NA
Median 4.4 x 12.5 x
8
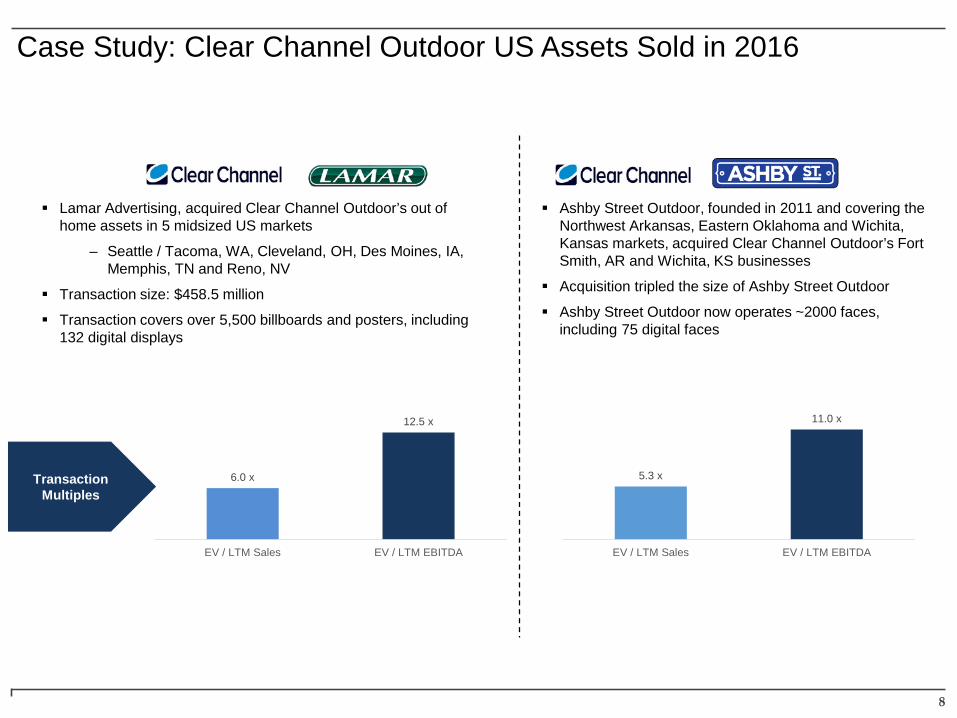
Case Study: Clear Channel Outdoor US Assets Sold in 2016
6.0 x
12.5 x
EV / LTM Sales EV / LTM EBITDA
Lamar Advertising, acquired Clear Channel Outdoor’s out of home assets in 5 midsized US markets
– Seattle / Tacoma, WA, Cleveland, OH, Des Moines, IA, Memphis, TN and Reno, NV
Transaction size: $458.5 million
Transaction covers over 5,500 billboards and posters, including 132 digital displays
Ashby Street Outdoor, founded in 2011 and covering the Northwest Arkansas, Eastern Oklahoma and Wichita, Kansas markets, acquired Clear Channel Outdoor’s Fort Smith, AR and Wichita, KS businesses
Acquisition tripled the size of Ashby Street Outdoor
Ashby Street Outdoor now operates ~2000 faces, including 75 digital faces
5.3 x
11.0 x
EV / LTM Sales EV / LTM EBITDA
Transaction Multiples
PRIVATE AND CONFIDENTIAL
9
Vision Media Management acquired Cinema Scene Marketing, which delivers promotional marketing and media solutions to cinema clients
Vision Media Management provides marketing and fulfillment services
Other 2016 Transactions
Source: Capital IQ and other publicly available information.
Dentsu acquired C2C Outdoor, a boutique out of home agency
C2C Outdoor will be powered by Posterscope US, Dentsu’s out of home agency
APN Outdoor acquired the assets of Metrospace and iOM, two Australian billboard operators
Primesight acquired Airport Media, which is the exclusive provider of digital, classic and experiential advertising opportunities within London Gatwick and London Luton airports
Primesight now covers four of the top five airports in the UK
Provantage Media Group merged its assets with Outdoor Network and will be the major shareholding in Outdoor Network
Provantage Media Group is a key operator in the South African airport and transit space
Outdoor Network is prominent in the South African billboard and street furniture space
Health Media Network acquired the rights to PetCARE TV from Saddle Ranch Media
Health Media Network is a digital Point of Care media company which is in over 12,000 medical offices and healthcare systems in the US
PetCARE TV provides informative and entertaining educational programming to pet owners across the US
PRIVATE AND CONFIDENTIAL
10
Other 2016 Transactions
Source: Capital IQ and other publicly available information.
Clear Channel sold its Turkish assets to Turkish investor Umut Senol
Panasonic Canada acquired Quickservice Technologies, which provides security and point of sale software, hardware, and integration services to the QSR industry
Panasonic Canada provides a full spectrum of professional services and technology for customers in the Quick Service Restaurant Sector (QSR)
Healthline Media, a consumer health information site, received a $95M investment from global growth equity investor, Summit Partners
Bell Media acquired CogecoMetromedia, an out of home advertising company specializing in the Montreal public transit sector
Bell Media is a Canadian media company with assets in television, radio, OOH (Astral Out of Home) and digital media
VGI Global Media acquired the remaining interest in Master Ad, an out of home operator in Thailand
VGI Global Media is the media and advertising arm of Thailand’s mass transit operator BTS Group

11
PRIVATE AND CONFIDENTIAL
2017 A Look Ahead
PRIVATE AND CONFIDENTIAL
12
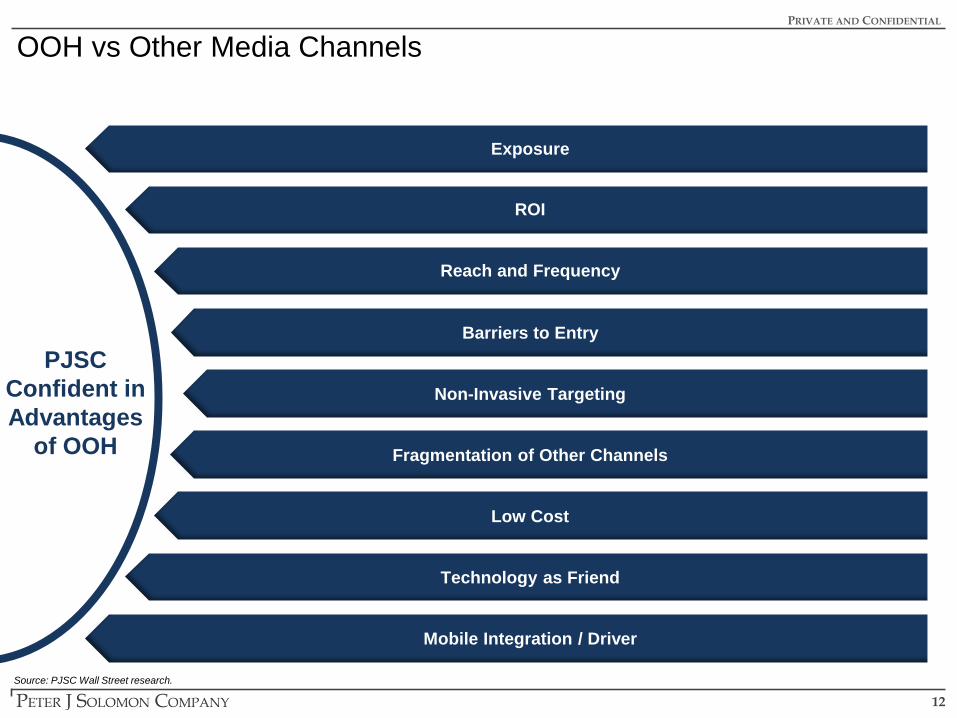
OOH vs Other Media Channels
Source: PJSC Wall Street research.
Exposure
ROI
Reach and Frequency
Non-Invasive Targeting
Barriers to Entry
Fragmentation of Other Channels
Low Cost
Technology as Friend
Mobile Integration / Driver
PJSC Confident in Advantages
of OOH
PRIVATE AND CONFIDENTIAL
13
OOH as Primer for Mobile EngagementIndustry is just scratching surface re: Mobile / Digital ad bucket and Mobile OOH integration is an untapped opportunity
“Research has shown consumers are 48 percent more likely to click a mobile ad after being exposed to the same ad on out of home first”
“By keeping location as the connecting thread and grounding campaigns in out of home, we are seeing average lifts of 30-50 percent in mobile engagement metrics, CTR and SAR”
“A billboard coupled with a mobile advertising campaign drives direct, immediate consumer action, whether that’s generating likes on Facebook or foot traffic to their establishment”
PRIVATE AND CONFIDENTIAL
14
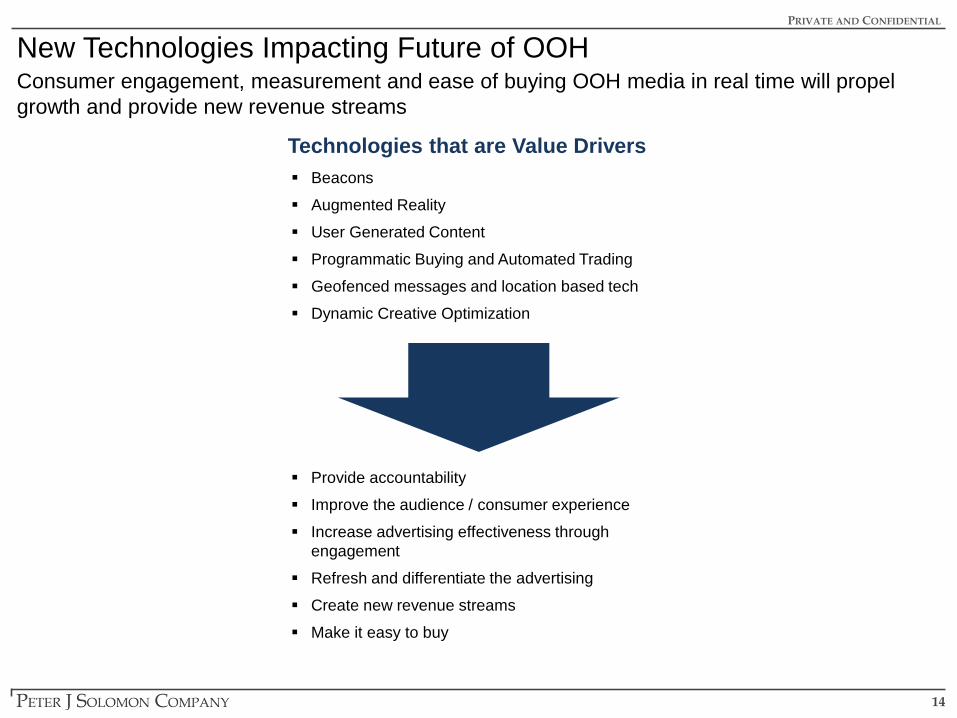
Consumer engagement, measurement and ease of buying OOH media in real time will propel growth and provide new revenue streams
Technologies that are Value Drivers Beacons
Augmented Reality
User Generated Content
Programmatic Buying and Automated Trading
Geofenced messages and location based tech
Dynamic Creative Optimization
Provide accountability
Improve the audience / consumer experience
Increase advertising effectiveness through engagement
Refresh and differentiate the advertising
Create new revenue streams
Make it easy to buy
New Technologies Impacting Future of OOH
PRIVATE AND CONFIDENTIAL
15
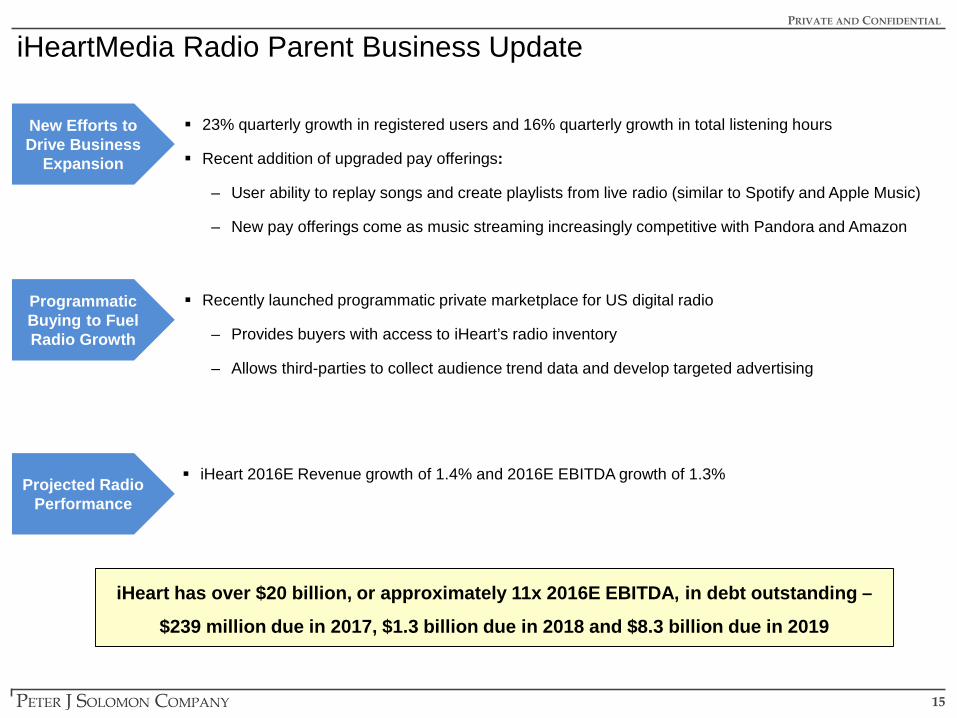
iHeartMedia Radio Parent Business Update
New Efforts to Drive Business
Expansion
23% quarterly growth in registered users and 16% quarterly growth in total listening hours
Recent addition of upgraded pay offerings:
– User ability to replay songs and create playlists from live radio (similar to Spotify and Apple Music)
– New pay offerings come as music streaming increasingly competitive with Pandora and Amazon
Programmatic Buying to Fuel Radio Growth
Recently launched programmatic private marketplace for US digital radio
– Provides buyers with access to iHeart’s radio inventory
– Allows third-parties to collect audience trend data and develop targeted advertising
iHeart has over $20 billion, or approximately 11x 2016E EBITDA, in debt outstanding –
$239 million due in 2017, $1.3 billion due in 2018 and $8.3 billion due in 2019
Projected Radio Performance
iHeart 2016E Revenue growth of 1.4% and 2016E EBITDA growth of 1.3%
PRIVATE AND CONFIDENTIAL
16
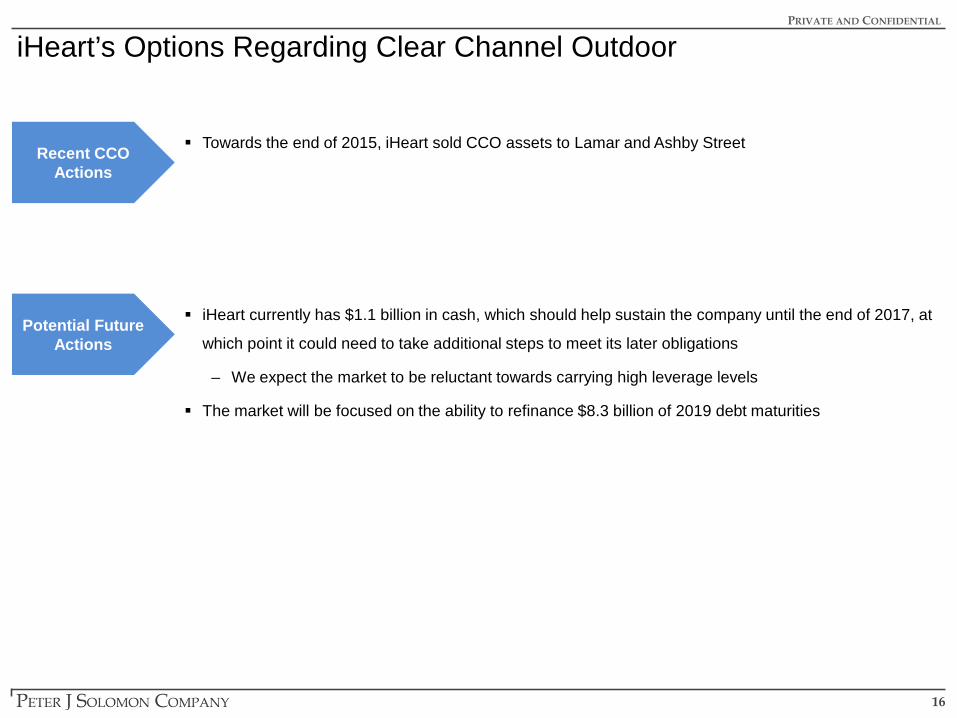
iHeart’s Options Regarding Clear Channel Outdoor
Towards the end of 2015, iHeart sold CCO assets to Lamar and Ashby StreetRecent CCO Actions
iHeart currently has $1.1 billion in cash, which should help sustain the company until the end of 2017, at
which point it could need to take additional steps to meet its later obligations
– We expect the market to be reluctant towards carrying high leverage levels
The market will be focused on the ability to refinance $8.3 billion of 2019 debt maturities
Potential Future Actions

17
PRIVATE AND CONFIDENTIAL
Smart Cities Opportunity
PRIVATE AND CONFIDENTIAL
18
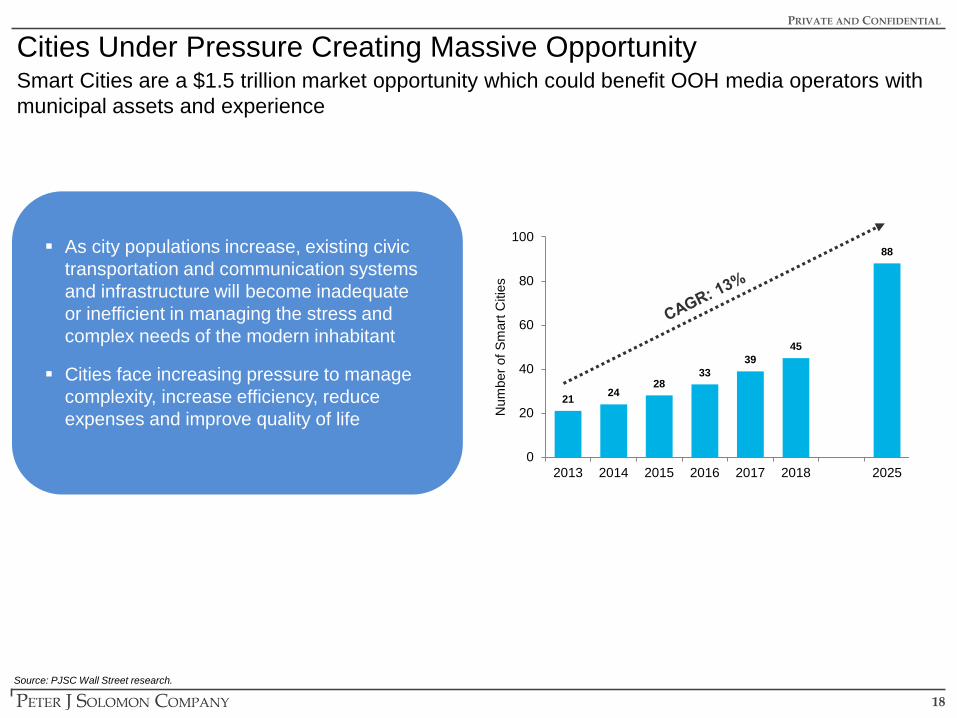
Cities Under Pressure Creating Massive Opportunity
As city populations increase, existing civic transportation and communication systems and infrastructure will become inadequate or inefficient in managing the stress and complex needs of the modern inhabitant
Cities face increasing pressure to manage complexity, increase efficiency, reduce expenses and improve quality of life
Source: PJSC Wall Street research.
Smart Cities are a $1.5 trillion market opportunity which could benefit OOH media operators with municipal assets and experience
21 2428
3339
45
88
0
20
40
60
80
100
2013 2014 2015 2016 2017 2018 2025
Num
ber o
f Sm
art C
ities

19
Ongoing Smart City Projects – Growth Area for Out of HomeMajor cities and governments are making significant investments in Smart Cities research and technology, creating massive media opportunities for those with transit advertising and street furniture contracts
Source: PJSC Wall Street research.
Australia (Budget: $50M+)• Released "Smart Cities Plan” inviting
state and territory governments to partner on nation-wide deployment of smart city infrastructure
Singapore (Est. Budget: $300M+)• Developing Virtual Singapore smart-
sensor data platform, which will provide insights into transportation, public safety and water quality
UAE (Budget: $8B)• Deploying 5,000+ free WiFi hotspots• “Dubai Plan” aims to transform 1,000
public services into smart services by 2021; also building a smarter police force through connected technology
Barcelona, Spain (Budget: $90M+)• Smart sensors to monitor urban
noise, air quality, street parking• 1,500+ WiFi hubs across the city,
half of which have been deployedNew York City, USA• Deploying 10,000 gigabit+ WiFi and
wayfinding kiosks featuring local ads• 100% funded through advertising
revenue share between private partners and the city government
India (Budget: $15B)• Targeting 100+ smart cities by 2020; currently
six smart city deployments• Will feature better connectivity, smart public
transport and improved urban mobility
20
PRIVATE AND CONFIDENTIAL
Appendix

21
PRIVATE AND CONFIDENTIAL
OOH Trading Universe
22
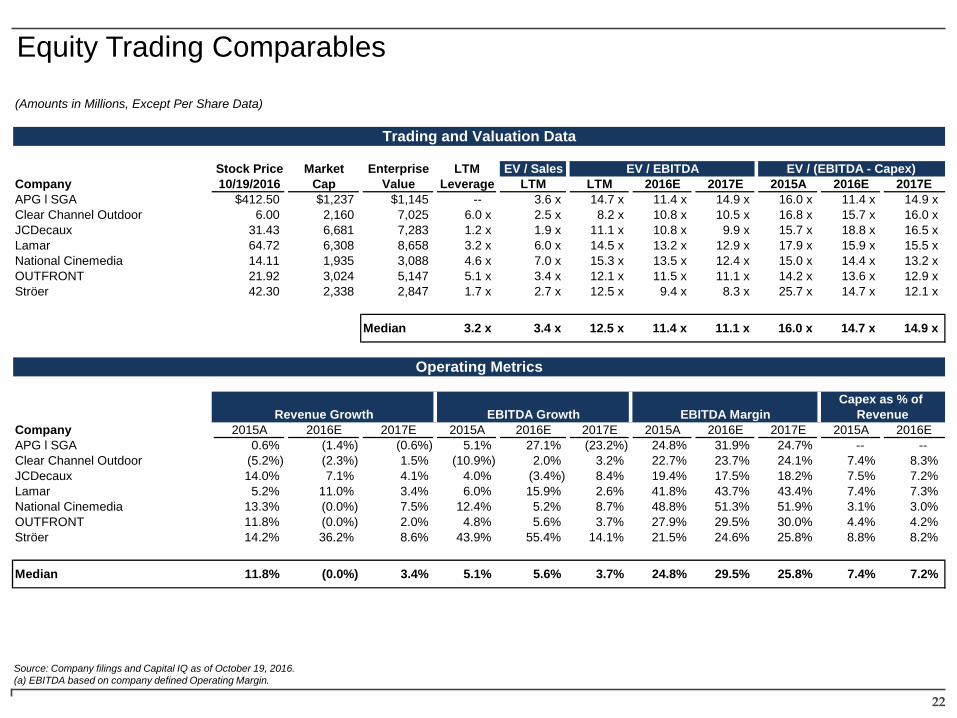
Equity Trading Comparables
Source: Company filings and Capital IQ as of October 19, 2016.(a) EBITDA based on company defined Operating Margin.
(Amounts in Millions, Except Per Share Data)
Trading and Valuation Data
Stock Price Market Enterprise LTM EV / Sales EV / EBITDA EV / (EBITDA - Capex)Company 10/19/2016 Cap Value Leverage LTM LTM 2016E 2017E 2015A 2016E 2017EAPG l SGA $412.50 $1,237 $1,145 -- 3.6 x 14.7 x 11.4 x 14.9 x 16.0 x 11.4 x 14.9 xClear Channel Outdoor 6.00 2,160 7,025 6.0 x 2.5 x 8.2 x 10.8 x 10.5 x 16.8 x 15.7 x 16.0 xJCDecaux 31.43 6,681 7,283 1.2 x 1.9 x 11.1 x 10.8 x 9.9 x 15.7 x 18.8 x 16.5 xLamar 64.72 6,308 8,658 3.2 x 6.0 x 14.5 x 13.2 x 12.9 x 17.9 x 15.9 x 15.5 xNational Cinemedia 14.11 1,935 3,088 4.6 x 7.0 x 15.3 x 13.5 x 12.4 x 15.0 x 14.4 x 13.2 xOUTFRONT 21.92 3,024 5,147 5.1 x 3.4 x 12.1 x 11.5 x 11.1 x 14.2 x 13.6 x 12.9 xStröer 42.30 2,338 2,847 1.7 x 2.7 x 12.5 x 9.4 x 8.3 x 25.7 x 14.7 x 12.1 x
Median 3.2 x 3.4 x 12.5 x 11.4 x 11.1 x 16.0 x 14.7 x 14.9 x
Operating Metrics
Capex as % of Revenue Growth EBITDA Growth EBITDA Margin Revenue
Company 2015A 2016E 2017E 2015A 2016E 2017E 2015A 2016E 2017E 2015A 2016EAPG l SGA 0.6% (1.4%) (0.6%) 5.1% 27.1% (23.2%) 24.8% 31.9% 24.7% -- --Clear Channel Outdoor (5.2%) (2.3%) 1.5% (10.9%) 2.0% 3.2% 22.7% 23.7% 24.1% 7.4% 8.3%JCDecaux 14.0% 7.1% 4.1% 4.0% (3.4%) 8.4% 19.4% 17.5% 18.2% 7.5% 7.2%Lamar 5.2% 11.0% 3.4% 6.0% 15.9% 2.6% 41.8% 43.7% 43.4% 7.4% 7.3%National Cinemedia 13.3% (0.0%) 7.5% 12.4% 5.2% 8.7% 48.8% 51.3% 51.9% 3.1% 3.0%OUTFRONT 11.8% (0.0%) 2.0% 4.8% 5.6% 3.7% 27.9% 29.5% 30.0% 4.4% 4.2%Ströer 14.2% 36.2% 8.6% 43.9% 55.4% 14.1% 21.5% 24.6% 25.8% 8.8% 8.2%
Median 11.8% (0.0%) 3.4% 5.1% 5.6% 3.7% 24.8% 29.5% 25.8% 7.4% 7.2%
PRIVATE AND CONFIDENTIAL
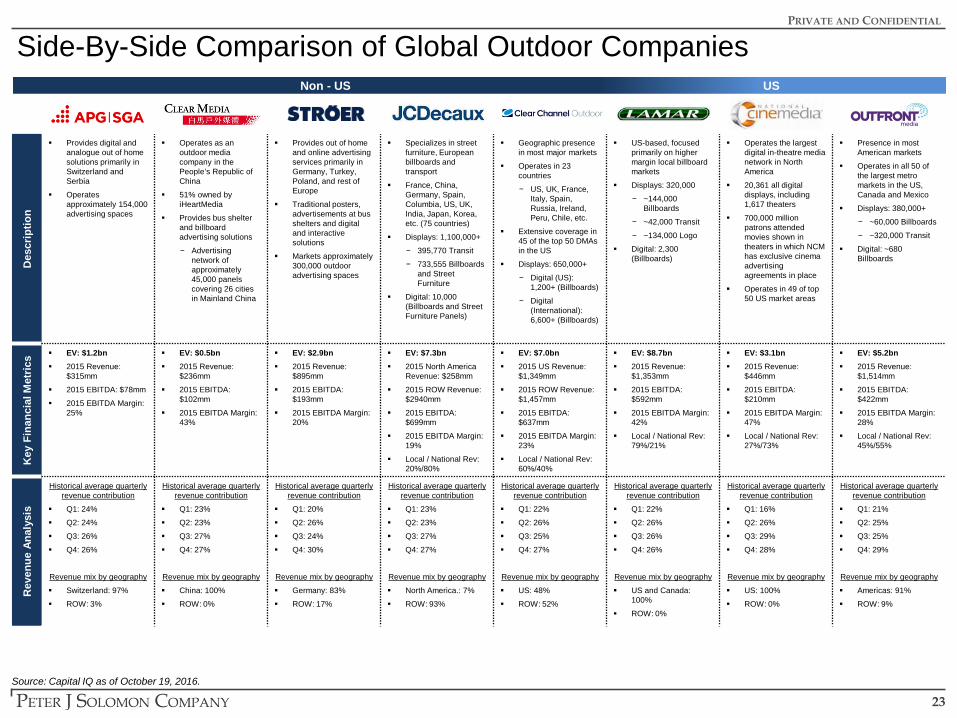
23Source: Capital IQ as of October 19, 2016.
Des
crip
tion
Provides digital and analogue out of home solutions primarily in Switzerland and Serbia
Operates approximately 154,000 advertising spaces
Operates as an outdoor media company in the People’s Republic of China
51% owned by iHeartMedia
Provides bus shelter and billboard advertising solutions
− Advertising network of approximately 45,000 panels covering 26 cities in Mainland China
Provides out of home and online advertising services primarily in Germany, Turkey, Poland, and rest of Europe
Traditional posters,advertisements at bus shelters and digital and interactive solutions
Markets approximately 300,000 outdoor advertising spaces
Specializes in street furniture, European billboards and transport
France, China, Germany, Spain, Columbia, US, UK, India, Japan, Korea, etc. (75 countries)
Displays: 1,100,000+
− 395,770 Transit
− 733,555 Billboards and Street Furniture
Digital: 10,000 (Billboards and Street Furniture Panels)
Geographic presence in most major markets
Operates in 23 countries
− US, UK, France, Italy, Spain, Russia, Ireland, Peru, Chile, etc.
Extensive coverage in 45 of the top 50 DMAs in the US
Displays: 650,000+
− Digital (US): 1,200+ (Billboards)
− Digital (International): 6,600+ (Billboards)
US-based, focused primarily on higher margin local billboard markets
Displays: 320,000
− ~144,000 Billboards
− ~42,000 Transit
− ~134,000 Logo
Digital: 2,300 (Billboards)
Operates the largestdigital in-theatre media network in North America
20,361 all digital displays, including 1,617 theaters
700,000 million patrons attended movies shown in theaters in which NCM has exclusive cinema advertising agreements in place
Operates in 49 of top 50 US market areas
Presence in most American markets
Operates in all 50 of the largest metro markets in the US, Canada and Mexico
Displays: 380,000+
− ~60,000 Billboards
− ~320,000 Transit
Digital: ~680 Billboards
Key
Fina
ncia
l Met
rics EV: $1.2bn
2015 Revenue: $315mm
2015 EBITDA: $78mm
2015 EBITDA Margin: 25%
EV: $0.5bn 2015 Revenue:
$236mm
2015 EBITDA: $102mm
2015 EBITDA Margin: 43%
EV: $2.9bn 2015 Revenue:
$895mm
2015 EBITDA: $193mm
2015 EBITDA Margin: 20%
EV: $7.3bn 2015 North America
Revenue: $258mm
2015 ROW Revenue: $2940mm
2015 EBITDA: $699mm
2015 EBITDA Margin: 19%
Local / National Rev: 20%/80%
EV: $7.0bn 2015 US Revenue:
$1,349mm
2015 ROW Revenue: $1,457mm
2015 EBITDA: $637mm
2015 EBITDA Margin: 23%
Local / National Rev: 60%/40%
EV: $8.7bn 2015 Revenue:
$1,353mm
2015 EBITDA: $592mm
2015 EBITDA Margin: 42%
Local / National Rev: 79%/21%
EV: $3.1bn 2015 Revenue:
$446mm
2015 EBITDA: $210mm
2015 EBITDA Margin: 47%
Local / National Rev: 27%/73%
EV: $5.2bn 2015 Revenue:
$1,514mm
2015 EBITDA: $422mm
2015 EBITDA Margin: 28%
Local / National Rev: 45%/55%
Rev
enue
Ana
lysi
s
Historical average quarterly revenue contribution
Q1: 24%
Q2: 24%
Q3: 26%
Q4: 26%
Revenue mix by geography
Switzerland: 97%
ROW: 3%
Historical average quarterly revenue contribution
Q1: 23%
Q2: 23%
Q3: 27%
Q4: 27%
Revenue mix by geography
China: 100%
ROW: 0%
Historical average quarterly revenue contribution
Q1: 20%
Q2: 26%
Q3: 24%
Q4: 30%
Revenue mix by geography
Germany: 83%
ROW: 17%
Historical average quarterly revenue contribution
Q1: 23%
Q2: 23%
Q3: 27%
Q4: 27%
Revenue mix by geography
North America.: 7%
ROW: 93%
Historical average quarterly revenue contribution
Q1: 22%
Q2: 26%
Q3: 25%
Q4: 27%
Revenue mix by geography
US: 48%
ROW: 52%
Historical average quarterly revenue contribution
Q1: 22%
Q2: 26%
Q3: 26%
Q4: 26%
Revenue mix by geography
US and Canada: 100%
ROW: 0%
Historical average quarterly revenue contribution
Q1: 16%
Q2: 26%
Q3: 29%
Q4: 28%
Revenue mix by geography
US: 100%
ROW: 0%
Historical average quarterly revenue contribution
Q1: 21%
Q2: 25%
Q3: 25%
Q4: 29%
Revenue mix by geography
Americas: 91%
ROW: 9%
Side-By-Side Comparison of Global Outdoor CompaniesUSNon - US
24
Rev
enue
Gro
wth
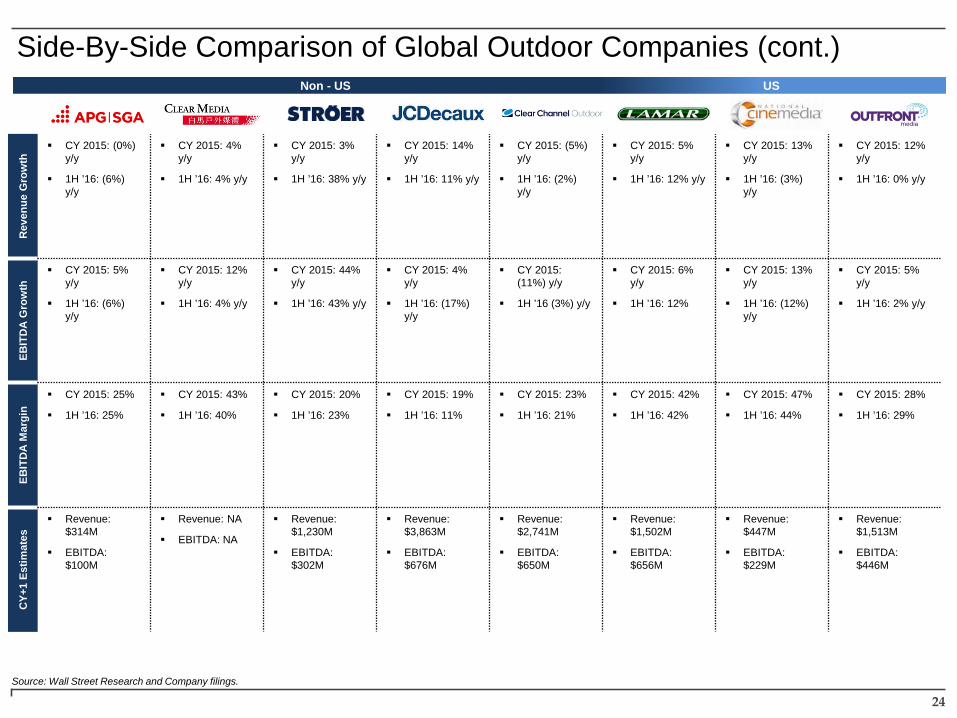
CY 2015: (0%) y/y
1H ’16: (6%) y/y
CY 2015: 4% y/y
1H ’16: 4% y/y
CY 2015: 3% y/y
1H ’16: 38% y/y
CY 2015: 14% y/y
1H ’16: 11% y/y
CY 2015: (5%) y/y
1H ’16: (2%) y/y
CY 2015: 5% y/y
1H ’16: 12% y/y
CY 2015: 13% y/y
1H ’16: (3%) y/y
CY 2015: 12% y/y
1H ’16: 0% y/y
EBIT
DA
Gro
wth
CY 2015: 5% y/y
1H ’16: (6%) y/y
CY 2015: 12% y/y
1H ’16: 4% y/y
CY 2015: 44% y/y
1H ’16: 43% y/y
CY 2015: 4% y/y
1H ’16: (17%) y/y
CY 2015: (11%) y/y
1H ’16 (3%) y/y
CY 2015: 6% y/y
1H ’16: 12%
CY 2015: 13%y/y
1H ’16: (12%) y/y
CY 2015: 5% y/y
1H ’16: 2% y/y
EBIT
DA
Mar
gin
CY 2015: 25%
1H ’16: 25%
CY 2015: 43%
1H ’16: 40%
CY 2015: 20%
1H ’16: 23%
CY 2015: 19%
1H ’16: 11%
CY 2015: 23%
1H ’16: 21%
CY 2015: 42%
1H ’16: 42%
CY 2015: 47%
1H ’16: 44%
CY 2015: 28%
1H ’16: 29%
CY+
1 Es
timat
es
Revenue: $314M
EBITDA: $100M
Revenue: NA
EBITDA: NA
Revenue: $1,230M
EBITDA:$302M
Revenue:$3,863M
EBITDA: $676M
Revenue: $2,741M
EBITDA: $650M
Revenue: $1,502M
EBITDA: $656M
Revenue: $447M
EBITDA: $229M
Revenue: $1,513M
EBITDA: $446M
Side-By-Side Comparison of Global Outdoor Companies (cont.)
Source: Wall Street Research and Company filings.
USNon - US
25
Fina
ncia
l / O
ther
Com
men
tary
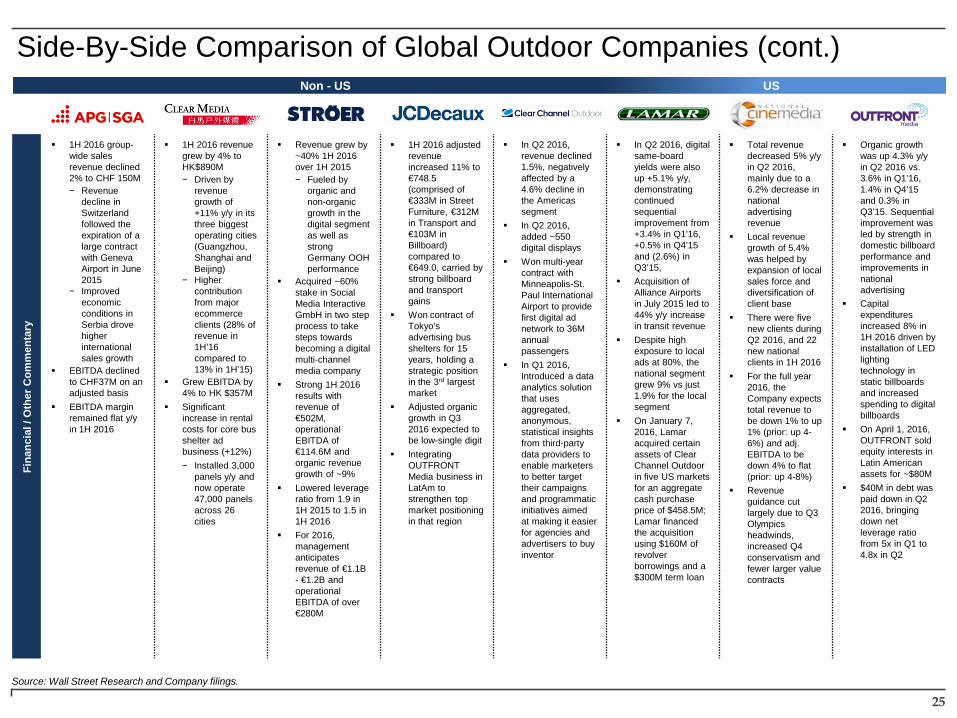
1H 2016 group-wide sales revenue declined 2% to CHF 150M− Revenue
decline in Switzerland followed the expiration of a large contract with Geneva Airport in June 2015
− Improved economic conditions in Serbia drove higher international sales growth
EBITDA declined to CHF37M on an adjusted basis
EBITDA margin remained flat y/y in 1H 2016
1H 2016 revenue grew by 4% to HK$890M− Driven by
revenue growth of +11% y/y in its three biggest operating cities (Guangzhou, Shanghai and Beijing)
− Higher contribution from major ecommerce clients (28% of revenue in 1H’16 compared to 13% in 1H’15)
Grew EBITDA by 4% to HK $357M
Significant increase in rental costs for core bus shelter adbusiness (+12%)− Installed 3,000
panels y/y and now operate 47,000 panels across 26 cities
Revenue grew by ~40% 1H 2016 over 1H 2015− Fueled by
organic and non-organic growth in the digital segment as well as strong Germany OOH performance
Acquired ~60% stake in Social Media Interactive GmbH in two step process to take steps towards becoming a digital multi-channel media company
Strong 1H 2016 results with revenue of €502M, operational EBITDA of €114.6M and organic revenue growth of ~9%
Lowered leverage ratio from 1.9 in 1H 2015 to 1.5 in 1H 2016
For 2016, management anticipates revenue of €1.1B - €1.2B and operational EBITDA of over €280M
1H 2016 adjusted revenue increased 11% to €748.5 (comprised of €333M in Street Furniture, €312M in Transport and €103M in Billboard) compared to €649.0, carried by strong billboard and transport gains
Won contract of Tokyo’s advertising bus shelters for 15 years, holding a strategic position in the 3rd largest market
Adjusted organic growth in Q3 2016 expected to be low-single digit
Integrating OUTFRONT Media business in LatAm to strengthen top market positioning in that region
In Q2 2016, revenue declined 1.5%, negatively affected by a 4.6% decline in the Americas segment
In Q2 2016, added ~550 digital displays
Won multi-year contract with Minneapolis-St. Paul International Airport to provide first digital ad network to 36M annual passengers
In Q1 2016, Introduced a data analytics solution that uses aggregated, anonymous, statistical insights from third-party data providers to enable marketers to better target their campaigns and programmatic initiatives aimed at making it easier for agencies and advertisers to buy inventor
In Q2 2016, digital same-board yields were also up +5.1% y/y, demonstrating continued sequential improvement from +3.4% in Q1’16, +0.5% in Q4’15 and (2.6%) in Q3’15,
Acquisition of Alliance Airports in July 2015 led to 44% y/y increase in transit revenue
Despite high exposure to local ads at 80%, the national segment grew 9% vs just 1.9% for the local segment
On January 7, 2016, Lamar acquired certain assets of Clear Channel Outdoor in five US markets for an aggregate cash purchase price of $458.5M; Lamar financed the acquisition using $160M of revolver borrowings and a $300M term loan
Total revenue decreased 5% y/y in Q2 2016, mainly due to a 6.2% decrease in national advertising revenue
Local revenue growth of 5.4% was helped by expansion of local sales force and diversification of client base
There were five new clients during Q2 2016, and 22 new national clients in 1H 2016
For the full year 2016, the Company expects total revenue to be down 1% to up 1% (prior: up 4-6%) and adj. EBITDA to be down 4% to flat (prior: up 4-8%)
Revenue guidance cut largely due to Q3 Olympics headwinds, increased Q4 conservatism and fewer larger value contracts
Organic growth was up 4.3% y/y in Q2 2016 vs. 3.6% in Q1’16, 1.4% in Q4’15 and 0.3% in Q3’15. Sequential improvement was led by strength in domestic billboard performance and improvements in national advertising
Capital expenditures increased 8% in 1H 2016 driven by installation of LED lighting technology in static billboards and increased spending to digital billboards
On April 1, 2016, OUTFRONT sold equity interests in Latin American assets for ~$80M
$40M in debt was paid down in Q2 2016, bringing down net leverage ratio from 5x in Q1 to 4.8x in Q2
Side-By-Side Comparison of Global Outdoor Companies (cont.)
Source: Wall Street Research and Company filings.
USNon - US
PRIVATE AND CONFIDENTIAL
26
Thank You!
Mark BoidmanManaging Director
Peter J. Solomon Company
Investment Banking
@MBoidman
Peter J. Solomon Company
www.PJSC.com
@PJSCtweets

![$OOHV /LHEH ]XP *HEXUWVWDJ · =x ghlqhp *hexuwvwdj z qvfkh lfk glu « 'dvv glu dooh 7 uhq riihq vwhkhq $ooh ghlqh 3ureohph lp :lqgh yhuzhkhq *o fn xqg )urkvlqq glfk vwhwv ehjohlwhq](https://static.fdocuments.net/doc/165x107/5f9be6c29326bf193855e07f/oohv-lheh-xp-hexuwvwdj-x-ghlqhp-hexuwvwdj-z-qvfkh-lfk-glu-dvv-glu-dooh.jpg)