ONTOLOGY-DRIVEN AND NETWORK ENABLED SYSTEMS …
104
ONTOLOGY-DRIVEN AND NETWORK–ENABLED SYSTEMS BIOLOGY CASE STUDIES Zhong Yan Submitted to the faculty of the School of Informatics in partial fulfillment of the requirements for the degree of Master of Science in Bioinformatics Indiana University December 2006
Transcript of ONTOLOGY-DRIVEN AND NETWORK ENABLED SYSTEMS …

ONTOLOGY-DRIVEN AND NETWORKndashENABLED
SYSTEMS BIOLOGY CASE STUDIES
Zhong Yan
Submitted to the faculty of the School of Informatics
in partial fulfillment of the requirements
for the degree of Master of Science
in Bioinformatics
Indiana University
December 2006
ii
Accepted by the Graduate Faculty Indiana University in partial
fulfillment of the requirements for the degree of Master of Science
_________________________________
Dr Jake Yue Chen PhD Chair
__________________________________
Dr Mark Goebl PhD
Master‟s Thesis
Committee
__________________________________
DrChangyu Shen PhD
iii
Acknowledgements
I would like to express my sincere gratitude to everyone who went along with me
during this journey and who contributed to this research
Special thanks to
My thesis advisor Dr Jake Chen
It is hard to find the right words to express my gratitude to this special and impressive
person His expertise in bioinformatics science wide knowledge and logical way of
thinking improved my research skills and prepared me for future challenges I would like
to thank Jake for his advice and especially for his excellent scientific guidance and
encouragement
Systems biology studies rely heavily on interdisciplinary collaborations Our studies
involved collaborations among the biology group statistics group and informatics group
I would like to thank Dr Changyu Shen for his contributions in the statistical testings in
my case studies Dr Shen programmed in R-scripts for the statistical testings I would
like to thank him for his support and advice Dr Mark Goebl provided me support and
encouragement during my thesis study His advice has been invaluable for my thesis
study I would also like to express my deep gratitude to his contributions to the yeast
Grr1 case study I would like to express my warm and sincere thanks to Dr Mu Wang for
his support contributions excellent advice and detailed review in the human ovarian
cancer case study
I would like to extend my sincere thanks to Josh Heyen for his contributions in the
yeast Grr1 knock-out case study Josh Heyen provided the proteomics experimental
dataset and part of the biological interpretation for my analysis results I would also like
to thank Dawn Fitzpatrick for providing human ovarian cancer proteomics experimental
dataset
iv
There are countless people to thank team members colleagues friends and my
family who supported me during the years I am using this space to present my thanks to
them
Ample thanks to
Molly Mary Todd and Kimberly for their timely support and patience during my
research work
SudhaRani Pranav Harini and Lavanya for the joy we shared along with my
research work and for the support I got from them
My deepest gratitude to the three most special persons in my life my husband
Baoguang for his encouragement and support especially during the most challenging
moments and my sons Linsu and Jason who fill my life with joy for their understanding
and support
v
ABSTRACT
Zhong Yan
ONTOLOGY-DRIVEN AND NTEWORKndashENABLE
SYSTEMS BIOLOGY CASE STUDIES
With the progress in high-throughput technologies and bioinformatics in recent years
it is possible to determine to what extent genetic or environmental manipulation of a
biological system affects the expression of thousands of genes and proteins This study
requires a shift from the conventional pure hypothesis-driven approach to an integrated
approach--systems biology method Systems biology studies the relationships and
interactions between various parts of a biological system It allows individual genes or
proteins to be placed in a global context of cellular functions This analysis can answer
the question of how networks of genesproteins differentially regulated respond to
genetic or environmental modification are placed in the global context of the protein
interaction map In this project we establish a protein interaction network-based systems
biology approach and use the method for two case studies
In particular our systems biology studies consist of the following parts (1) Analysis
of mass-spectrometry derived proteomics experimental data to identify differentially
expressed proteins in different genetic or environmental conditions (2) Integration of
genomics and proteomics data with experimental results the molecular context of
protein-protein interaction networks and gene functional categories (3) Visual
interpretation of molecular networks Our approach has been validated in two case
studies by comparing our discoveries with existing findings We also obtained new
insights In the first case study the proteomes of cisplatin-sensitive and cisplatin-resistant
ovarian cancer cells were compared and we observed that cellular physiological process
is significantly activated in cisplatin-resistant cell lines and this response arises from
endogenous abiotic and stress-related signals We found that cisplatin-resistant cell lines
demonstrated unusually high level of protein-binding activities and a broad spectrum of
across-the-board drug-binding and nucleotide-binding mechanisms are all activated In
vi
the second case study we found that the significantly enriched GO categories included
genes that are related to Grr1 perturbation induced morphological phenotype change are
highly connected in the GO sub-network which implies that Grr1 could be affecting this
process by affecting a small core group of proteins These biological discoveries support
the significance of developing a common framework of evaluating functional genomics
and proteomics data using networks and systems approaches
vii
TABLE OF CONTENTS
List of Tableshelliphelliphelliphelliphelliphelliphelliphelliphelliphelliphelliphelliphelliphelliphelliphelliphelliphelliphelliphelliphelliphelliphelliphelliphellipix
List of Figures helliphelliphelliphelliphelliphelliphelliphelliphelliphelliphelliphelliphelliphelliphelliphelliphelliphelliphelliphelliphelliphelliphelliphellipx
1 Introduction helliphelliphelliphelliphelliphelliphelliphelliphelliphelliphelliphelliphelliphelliphelliphelliphelliphelliphelliphelliphelliphelliphelliphelliphellip1
2 Backgroundhelliphelliphelliphelliphelliphelliphelliphelliphelliphelliphelliphelliphelliphelliphelliphelliphelliphelliphelliphelliphelliphelliphelliphelliphellip4
21 Mass spectrometry-based proteomics helliphelliphelliphelliphelliphelliphelliphelliphelliphelliphelliphelliphellip4
211 Mass spectrometryhelliphelliphelliphelliphelliphelliphelliphelliphelliphelliphelliphelliphelliphelliphelliphellip4
212 Proteomics data analysishelliphelliphelliphelliphelliphelliphelliphelliphelliphelliphelliphelliphelliphellip6
213 Proteomics data management toolshelliphelliphelliphelliphelliphelliphelliphelliphelliphellip7
22 Ontology-based gene annotation and network-enabled analysishelliphelliphellip9
221 Proteomics and systems biologyhelliphelliphelliphelliphelliphelliphelliphelliphelliphellip9
222 Ontology-based gene annotationhelliphelliphelliphelliphelliphelliphelliphelliphelliphelliphellip11
223 Proteomics interaction network-based analysishelliphelliphelliphelliphellip14
3 Methodshelliphelliphelliphelliphelliphelliphelliphelliphelliphelliphelliphelliphelliphelliphelliphelliphelliphelliphelliphelliphelliphelliphelliphelliphelliphellip19
31 Proteomics methodshelliphelliphelliphelliphelliphelliphelliphelliphelliphelliphelliphelliphelliphelliphelliphelliphelliphelliphelliphellip19
311 Ovarian cancer drug resistance proteomics methodhelliphelliphellip19
312 Yeast Grr1 knock-out proteomics methodhelliphelliphelliphelliphelliphelliphellip 20
32 Preparation of datasetshelliphelliphelliphelliphelliphelliphelliphelliphelliphelliphelliphelliphelliphelliphelliphelliphelliphellip23
321 Proteins in differentially expressed cisplatin-resistant
vs cisplatin-sensitive ovarian cancer cellshelliphelliphelliphelliphelliphelliphellip23
322 Differentially expressed proteins identified from Grr1
Knock -out yeast vs wild-type yeast helliphelliphelliphelliphelliphelliphelliphelliphellip24
323 Protein interactome datahelliphelliphelliphelliphelliphelliphelliphelliphelliphelliphelliphelliphelliphellip25
324 Noise-introduced human protein interactome Data helliphelliphellip27
325 Gene annotation datahelliphelliphelliphelliphelliphelliphelliphelliphelliphelliphelliphelliphelliphelliphellip27
326 Interacting protein categorical annotation datahelliphelliphelliphelliphellip28
33 Protein-protein interaction scoring modelhelliphelliphelliphelliphelliphelliphelliphelliphelliphelliphellip29
34 Network expansionhelliphelliphelliphelliphelliphelliphelliphelliphelliphelliphelliphelliphelliphelliphelliphelliphelliphelliphelliphellip33
35 Network visualizationhelliphelliphelliphelliphelliphelliphelliphelliphelliphelliphelliphelliphelliphelliphelliphelliphelliphelliphellip33
36 Network statistical examinationhelliphelliphelliphelliphelliphelliphelliphelliphelliphelliphelliphelliphelliphelliphellip34
37 Significance of testing of GO categories and GO-GO categories helliphellip34
38 Validation of under-represented GO categorieshelliphelliphelliphelliphelliphelliphelliphellip36
39 Drill-down of significant categories helliphelliphelliphelliphelliphelliphelliphelliphelliphelliphelliphelliphellip37
310 Scoring of Significant Proteins in the Sub-Networkhelliphelliphelliphelliphelliphelliphellip38
4 Resultshelliphelliphelliphelliphelliphelliphelliphelliphelliphelliphelliphelliphelliphelliphelliphelliphelliphelliphelliphelliphelliphelliphelliphelliphelliphelliphellip40
Case study 1 Ovarian cancer drug resistance case studyhelliphelliphelliphelliphelliphellip40
viii
41 Activated protein interaction sub-network propertieshelliphelliphelliphelliphelliphelliphellip40
42 Analysis of activated protein functional distributionhelliphelliphelliphelliphelliphelliphellip42
43 Functional category cross-talkshelliphelliphelliphelliphelliphelliphelliphelliphelliphelliphelliphelliphelliphelliphellip46
44 Visualization of the activated interaction functional sub-networkhelliphellip48
Case study 2 Yeast Grr1 knock-out case studyhelliphelliphelliphelliphelliphelliphelliphelliphelliphellip51
45 Activated protein interaction sub-network propertieshelliphelliphelliphelliphelliphellip51
46 Analysis of activated protein functional category distributions hellip52
47 Functional category cross-talkshelliphelliphelliphelliphelliphelliphelliphelliphelliphelliphelliphelliphelliphelliphellip56
48 Scoring of significant proteins in the sub-networkhelliphelliphelliphelliphelliphelliphelliphellip58
5 Conclusionshelliphelliphelliphelliphelliphelliphelliphelliphelliphelliphelliphelliphelliphelliphelliphelliphelliphelliphelliphelliphelliphelliphelliphelliphellip62
6 Discussionshelliphelliphelliphelliphelliphelliphelliphelliphelliphelliphelliphelliphelliphelliphelliphelliphelliphelliphelliphelliphelliphelliphelliphelliphellip64
7 Appendiceshelliphelliphelliphelliphelliphelliphelliphelliphelliphelliphelliphelliphelliphelliphelliphelliphelliphelliphelliphelliphelliphelliphelliphelliphellip68
Appendix 1 ERD diagram for Oracle schema Sysbiohelliphelliphelliphelliphelliphelliphelliphellip68
Appendix 2 Uniprot ID mappings for 119 differentially expressed
seed proteins in ovarian cancer drug resistance studyhelliphelliphellip69
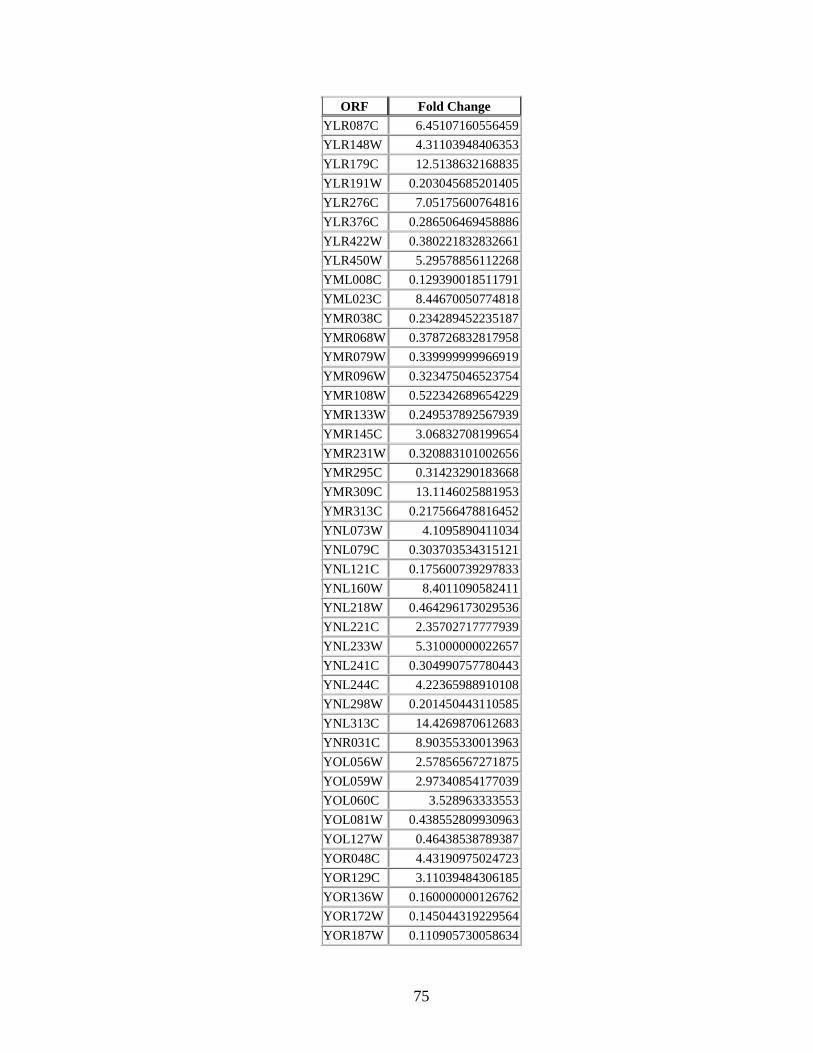
Appendix 3 ORFs for 184 differentially expressed seed proteins in
Grr1 knock-out case studyhelliphelliphelliphelliphelliphelliphelliphelliphelliphelliphelliphelliphelliphellip72
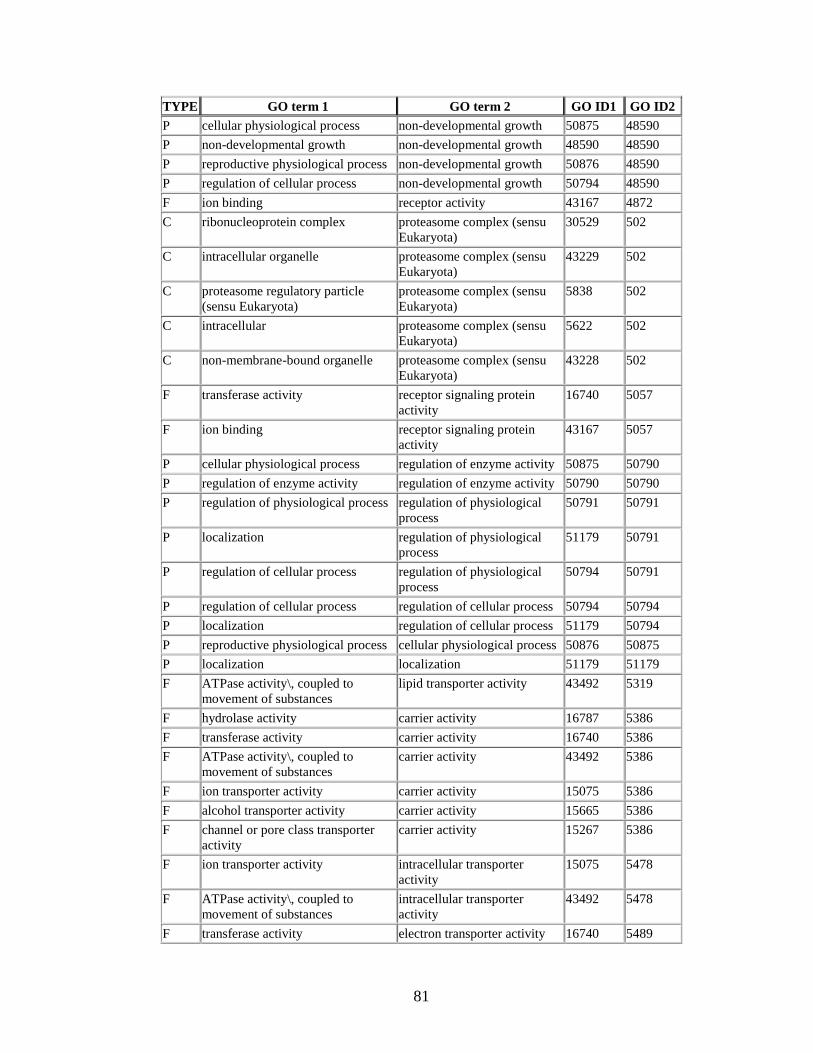
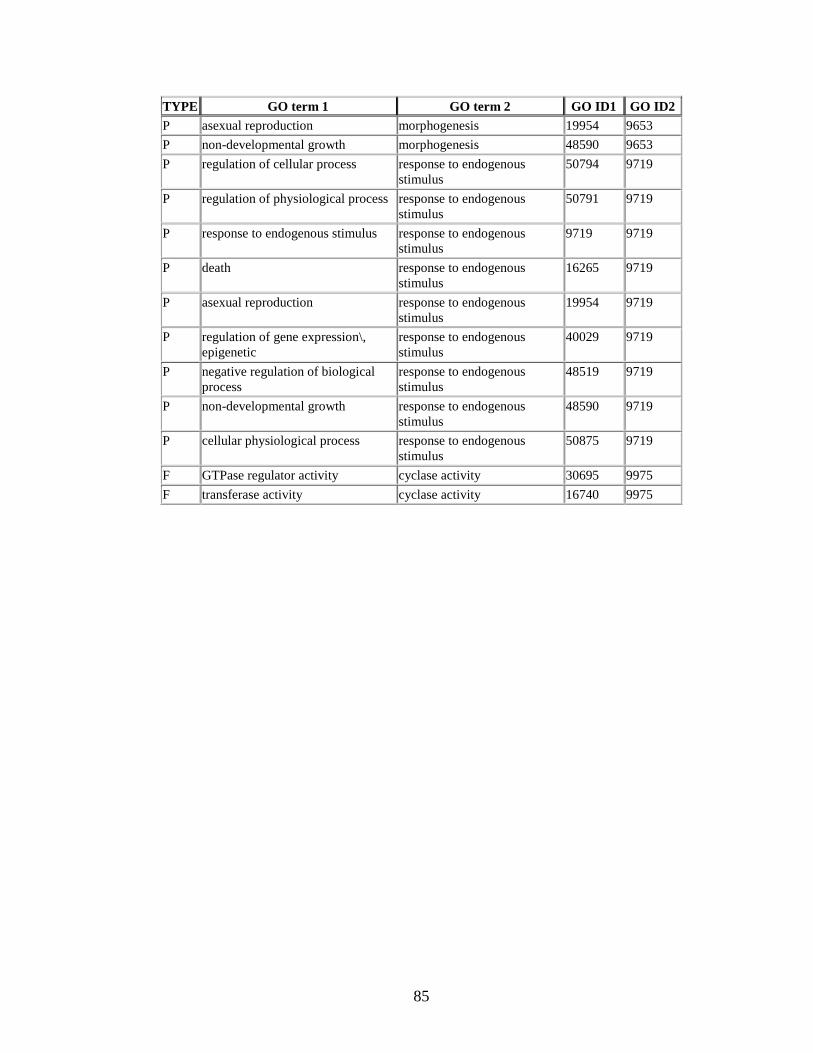
Appendix 4 Significantly overunder- represented GO cross-talk pairs
for Grr1 knock-out case studyhelliphelliphelliphelliphelliphelliphelliphelliphelliphelliphelliphellip77
Referenceshelliphelliphelliphelliphelliphelliphelliphelliphelliphelliphelliphelliphelliphelliphelliphelliphelliphelliphelliphelliphelliphelliphelliphelliphelliphelliphellip82
Curriculum Vitae
ix
LIST OF TABLES
Table 21Gene Ontology analysis tools helliphelliphelliphelliphelliphelliphelliphelliphelliphelliphelliphelliphelliphelliphelliphelliphellip13
Table 22 Leading protein interaction databases helliphelliphelliphelliphelliphelliphelliphelliphelliphelliphelliphelliphelliphellip15
Table 31 Metadata for experimental methods helliphelliphelliphelliphelliphelliphelliphelliphelliphelliphelliphelliphelliphelliphellip31
Table 32 Experimental methods for interacting pairs stored in SGD helliphellip31
Table 33 Experimental methods for interacting pairs stored in BIND helliphelliphelliphelliphellip32
Table 41 Enriched GO categories in the sub-network context helliphelliphelliphelliphelliphelliphelliphelliphelliphellip43
Table 42 Re-examination of under-represented seed protein functional categories 44
Table 43 Drill down of significant GO-GO functional category cross-talk helliphelliphelliphellip47
Table 44 Overunder ndash represented GO categories among the seed proteins52
Table 45 Overunder ndash represented GO categories among the subnet proteins helliphellip54
Table 46 Ranking analysis of the significant proteins helliphelliphelliphelliphelliphelliphelliphelliphelliphelliphelliphellip59
x
LIST OF FIGURES
Figure 11 Framework of the novel systems biology approachhelliphelliphelliphelliphelliphelliphellip2
Figure 21 Proteomics data analysis pipelinehelliphelliphelliphelliphelliphelliphelliphelliphelliphelliphelliphelliphelliphelliphellip7
Figure 22 Major elements of our systems biology approach helliphelliphelliphelliphelliphelliphelliphellip10
Figure 31 Yeast Interactome data source from SGD and BINDhelliphelliphellip helliphelliphellip25
Figure 32 Interactome data integration flow charthelliphelliphelliphelliphelliphelliphelliphellip helliphelliphelliphellip26
Figure 33 Yeast annotation database stored in Oracle 10g helliphelliphelliphelliphelliphelliphelliphelliphellip28
Figure 34 Protein interaction reliability score calculation algorithm
and formulas helliphelliphelliphelliphelliphelliphelliphelliphelliphelliphelliphelliphelliphelliphelliphelliphelliphelliphelliphelliphelliphelliphellip30
Figure 35 Illustration showing the overlap of 9959 OPHID proteins
and 4333 proteins detected by MS experiments helliphelliphelliphelliphelliphelliphelliphelliphelliphellip36
Figure 36 Application for the yeast subnet construction helliphelliphelliphellip38
Figure 41 Node degree distribution of the sub-networks (core or full)
in comparison with the human protein interaction network helliphelliphelliphellip41
Figure 42 Significantly over-represented GO-GO interaction categories
in seeded subnetworkhelliphelliphelliphelliphelliphelliphelliphelliphelliphelliphelliphelliphelliphelliphelliphelliphelliphelliphellip46
Figure 43 Activated biological process network in cisplatin-resistant
ovarian cancer cells helliphelliphelliphelliphelliphelliphelliphelliphelliphelliphelliphelliphelliphelliphelliphelliphelliphelliphellip49
Figure 44 Node degree distribution of the sub-networks (core or full)
in comparison with the yeast protein interaction networkhelliphelliphelliphelliphelliphellip51
Figure 45 Enriched GO categories (partial listing) and yeast bud
morphological phenotype helliphelliphelliphelliphelliphelliphelliphelliphelliphelliphelliphelliphelliphelliphelliphelliphelliphellip56
Figure 46 Visualization of significantly over-represented GO cross ndash talk
partial sub-networks for biological process (top) and cellular
component (bottom)helliphelliphelliphelliphelliphelliphelliphelliphelliphelliphelliphelliphelliphelliphelliphelliphelliphelliphelliphelliphellip57
Figure 47 Protein interaction sub-network seeded by Grr1 Dyn1 and Nip100helliphellip59
1
1 INTRODUCTION
Over the past two centuries life science research has been rooted in the assumption
that complex problems may be solvable by dividing them into smaller simpler and
thus more manageable units While the human body is considered to be an integrated
system with a company of components the natural tendency of medicine is to separate
the single factor that is most responsible for the consequence It is undeniable that this
approach has been a success for years However it leaves little room for contextual
information The need to make sense of complex interactions has led some researchers
to shift from a component-level to system-level perspective With the progress in high-
throughput technologies and bioinformatics (for example many bioinformatics
databases are available to the public) in recent years it is possible to determine to
what extent genetic or environmental manipulation of a biological system affects the
expression of thousands of genes and proteins This form of study requires a shift from
a conventional individual approach (divide-and-conquer approach) towards an
integrated approach The integrated approach leads to an emerging field called
systems biology[1] Systems biology takes into account complex interactions of genes
proteins and cell elements By studying the relationships and interactions between
various parts of a biological system it is hoped that researchers might build a system-
level understanding of biological systems and gain novel insights towards discoveries
In this project we have developed a novel systems biology approach to study
proteomics experimental data Using this approach we have performed case studies on
two proteomics datasets (1) human ovarian cancer drug resistance (2) yeast Grr1
knock-out Our systems biology studies consist of the following parts (see figure 11)
(1) Analyzing mass-spectrometry derived proteomics experimental data to identify
differentially expressed proteins in cisplatin-sensitive vs cisplatin-resistant ovarian
cell line samples and yeast Grr1 knock-out vs wild-type samples (2) Integrating
genomics and functional genomics data with experimental results and the molecular
context of protein-protein interaction networks and gene functional categories we use
OPHID (Online Predicted Human Interaction Database) for our ovarian cancer study
2
and an in-house developed yeast protein-protein interaction database (SBG) for our
yeast study The integration involves identifying protein interaction partners for the
differentially-expressed protein set (seed proteins) as well as identifying the gene
ontology cross-talk partners in the context of the protein-protein interaction network
(3) Visual interpretation of molecular networks[2]
Figure 11 Framework of novel systems biology approach
3
Unlike conventional methods which lack functional integration of data and
effective analysis tools to derive functional relationships between heterogeneous while
related data our studies have the following significance First we have developed a
novel systems biology approach which can identify ldquosignificantly interacting protein
categoriesrdquo This is distinct from the recent approach of using GO annotations for
differentially expressed gene classifications resulting from microarray analysis[3] Our
method can be generalized to enable other similar systems biology studies in which
statistically significant experimental ldquoomicsrdquo results public protein interactome data
and genomeproteome annotation database are integrated into an easy-to-interpret two-
dimensional visualization matrix[2] Second to integrate yeast protein-protein
interaction data from different sources we have created our own metadata for
experimental methods that are used to detect interacting protein pairs (see section 32
in paragraph ldquoProtein Interactome Datardquo) Third we have developed our unique
scoring model (see section 33) to calculate reliability scores for the interacting protein
pairs We applied our scoring model to the combined protein-protein interaction
dataset to calculate a reliability score for each unique interacting pair This enables our
significant protein ranking analysis (see section 310) Fourth we applied a unique
molecular network visual representation scheme to the significant biological process
categories and significant between-category interactions (see section 35 and section 4
for two case studies) Our new approach based analysis will help the life science
researchers validate their discoveries and generate new hypotheses
4
2 BACKGROUND
21 Mass Spectrometry - based Proteomics
Proteomics refers to the branch of discovery science focusing on large scale
analysis of proteins Initially the term proteomics was used to describe the study of
expressed proteins of a genome using a combination of two-dimensional (2D) gel
electrophoresis to separate proteins and mass spectrometry (MS) to identify them
This approach is now referred to as ldquoexpressionrdquo or ldquoglobal profilingrdquo proteomics
However the scope of proteomics has now broadened to include the study of ldquoprotein-
proteinrdquo interactions (protein complexes) referred to as cell-mapping proteomics [4
5] Proteomics complements other functional genomics including microarray
expression profiling systematic phenotypic profiling systematic genetics and small-
molecule-based arrays [6] Compared with genomics proteomics is much more
complicated While the genome is rather stable the proteome differs from cell to cell
and is constantly changing through its biochemical interactions with the genome and
the environment
Mass spectrometry-based proteomics has a distinct application in unraveling the
levels of protein abundance post-translational modifications (eg glycosylation
acetylation phosphorylation and myristoylation) as well as protein-protein
interactions which are the formative drive in a cell Changes in these parameters are
not revealed by measuring mRNA levels Mass spectrometry-based proteomics
provides opportunities to identify target proteins that are differentially regulated under
different conditions It helps biologists elucidate the dynamics of important signaling
and regulatory networks in biological process
211 Mass spectrometry
Mass spectrometry is the method for determining the molecular weight of chemical
compounds by separating molecular ions according to their mass-to-charge ratio (mz)
Mass spectrometers are powerful devices used for this purpose Mass spectrometric
measurements are carried out in the gas phase on ionized analytes A mass
5
spectrometer consists of an ionization source for ion-generation a mass analyzer that
measures the mass-to-charge ratio (mz) of the ionized analytes and a detector that
registers the number of ions at each mz value The ionization source transfers
molecules from solution or solid phase into gas-phase ions that can then be
manipulated within electric or magnetic fields Ionization techniques are critical for
determining what types of samples can be analyzed by mass spectrometry The two
most frequently used ionization techniques are ESI (Electrospray Ionization) and
MALDI (Matrix-Assisted Laser DesorptionIonization) ESI ionizes the analytes out
of a solution and is therefore readily coupled to liquid-based separation tools such as
HPLC MALDI sublimates and ionizes the samples out of a fry crystalline matrix via
laser pulses MALDI-MS is normally used to analyze relatively simple peptide
mixtures whereas integrated liquid-chromatography ESI-MS systems (LC-MS) are
preferred for the analysis of complex samples [7 8]
The mass-analyzer is used to separate gas-phase ions based on their mass-to-charge
(mz) ratios and is central to the technology In the context of proteomics its key
parameters are sensitivity resolution mass accuracy and its ability to generate
information-rich ion mass spectra from peptide fragments (tandem mass or MS-MS
spectra) There are four basic types of mass analyzers currently used in proteomics
research These are the ion trap time-of-flight (TOF) quadrupole and Fourier
Transform ion cyclotron (FT-ICR-MS) analyzers They are very different in design
and performance and each has its own strength and weakness These analyzers can be
stand alone or in some cases put in tandem to take advantage of the strengths of each
[8-11]
Both MALDI and ESI are soft ionization techniques in that ions are created with
low internal energy and thus undergo little fragmentation Mass-to-charge ratios can
be readily and accurately measured for intact ions but this information does not
provide data on the covalent structure of the ion For peptides and proteins in
particular data related to the amino acid sequence of the molecule are desired To
generate this information new configurations of mass spectrometers have been
6
developed to isolate ions fragment them and then measure the mass-to-charge ratio of
the fragments These devices are collectively called tandem mass spectrometers A
tandem mass spectrometer is a mass spectrometer that has more than one analyzer in
practice usually two The two analyzers are separated by a collision cell into which an
inert gas (eg argon henium) is admitted to collide with the selected sample ions and
bring about their fragmentation (collision-induced dissociation or CID) The analyzers
can be of the same or different types the most combinations being quadrupole-
quadrupole magnetic sector-quadrupole and quadrupole-TOF [12 13]
The first analyzer of a tandem mass spectrometer is used to select user-specific
peptide ions from peptide mixtures These chosen ions then pass into the collision cell
and are bombarded by the gas molecules into fragment ions which are then analyzed
The original mass to charge ratio of each ion as well its specific fragment spectrum are
used to search a database of theoretical peptide fragmentation spectra often resulting
in unambiguous peptide identification The data from each of these methodologies is
represented as output peak list files adherent to a specific file format that is dependent
on the instrument used for analysis Programs such as SEQUEST [14] and MASCOT
(httpwwwmatrixsciencecom) correlate the experimentally acquired MSMS spectra
to the computer generated MSMS spectra and produce various scores used to assess
the validity of this correlation Each correlation program uses a different algorithm to
assign peptides and thus each program produces overlapping but variable outputs
Various laboratories have used different approaches to exploit the advantages of both
software algorithms [15] and to validate more thoroughly the results of these
algorithms individually [16 17] It is apparent that no single analysis system has been
universally accepted to date
212 Proteomics data analysis
In a typical mass spectrometry based experiment protein samples are digested by a
protease (usually trypsin) and the resulting peptides can be further separated by liquid
chromatography before directly introduced into MS The peptide fragment masses are
determined by MS which provides a fingerprint of the protein of interest The masses
7
are compared to the predicted proteolytic peptides from sequence databases taking into
account user specified parameters such as the number of missed cleavage sites If
however database searching leads to ambiguous results then further MS analyses
involving the usage of tandem mass spectrometry (MSMS) are undertaken
sequentially on each peptide in the mixture to generate a sequence or partial sequence
known as a sequence tag for these peptides This is frequently achieved by using ESI-
MSMS Further database searching with both the molecular mass of the peptide and
the sequence tag information should lead to unambiguous protein identification[18-20]
Finally the instrument generates an output peak list file in a specific file format
depending on the type of instrument used and an analysis pipeline (Figure 21) can be
used to take the peak list file as input and generate a series of output files
Figure 21 Proteomics data analysis pipeline
213 Proteomics data management tools
The scale and complexity of proteomics data require software tools to facilitate
data management Compared with microarray data management tools there are few
tools available for mass spectrometry proteomics studies Below we summarize most
of the proteomics data management tools This work is based on my previous
publication [21]
PEDRo database tool (httppedromanacuk ) is an open source tool for
proteomics data entry and modeling However it is not a comprehensive query and
analysis tool The PEDRo tool implements the PEDRo data model (Refer to section 3)
which was released early in 2003 The schema of the PEDRo data model is available
8
at the website PEDRo supports an ontology service It stores the XML directly in an
open-source XML storage system Xindice The data are presented to the users by
gathering web pages from the stored XML using XSLT[22 23]
SBEAMS-Proteomics (httpwwwsbeamsorgProteomics ) is one of the modules of
SBEAMS integrated platform developed by ISB that is used for proteomics
experimental data storage and retrieval These experiments can be correlated later
under the same framework The integrated open source system SBEAMS adopts a
relational database management system backend and a web interface front end
Information about the quality of identification can be stored with the data peptides
which could not be properly identified from mass spectra can be flagged and
reanalyzed with additional searches The database schema for SBEAMS-Proteomics is
available at the website (httpwwwsbeamsorgProteomics )
ProteinScape is a commercial client-server platform for proteomics data
management (httpwwwbdalcomproteinscapehtml) It organizes data such as gel
data mass spectra process parameters and search results It can manage gel-based or
LC-based workflows as well as quantitative proteomics ProteinScape also enables
automated analysis through interactions with database search engines such as Mascot
Phenux and Profound ProteinScape‟s relational database system can be Microsoft
SQL or Oracle 91
PROTEIOS (httpwwwproteiosorg) is an mzData-compliant open source client-
server application that implements mass spectrometry data storage organization and
annotation The server is a relational database that can be MySQL Oracle as well as
utilize other alternatives The client side runs as a Java application One of the main
objectives of Proteios is to provide a GUI enabling queries based on experiment data
and annotation data The schematic diagram is available at the website Currently the
input data files must be in XML format It is working on imports of tab-separated files
[24]
9
PROTICdb is a web-based proteomics data management tool used for plant
proteomics data storage and analysis The data can come from 2D-GEL and MS The
data stored can also be in the form of quantitative measurements To support data
interpretation PROTICdb allows the integration of information from the user‟s own
expertise and other sources into a knowledge base It also provides links to external
databases [25]
ProDB is an open source proteomics data management tool
(httpwwwcebitecuni-bielefelddegroupsbrfsoftwareprodb_infoindexhtml) that
can handle data conversion between different mass spectrometer software automate
data analysis and allow the annotation of MS spectra (ie assigning gene names or
storing data on protein modifications) The system is based on an extensive relational
database to store the mass spectra together with the experimental setup [26] The first
release will be available to the public soon
There are several other proteomics data management tools not described here such
as PROTEUS [27] Proteomics Rims (developed by Bruker BioSciences) Xome and
Mass Navigator [28]
22 Ontology-based Gene Annotation and Network-enabled Analysis
221 Proteomics and Systems Biology
The goal of proteomics research is to understand the expression and function of
proteins on a global level It strives to characterize protein structure and function
protein-protein protein-nucleic acid protein-lipid and enzyme-substrate interactions
post-translational modifications protein processing and folding protein activation
cellular and sub-cellular localization protein turnover and synthesis rates and even
alternative isoforms caused by differential splicing and promoter usage In addition
the ability to capture and compare all of this information between two cellular states is
essential for understanding cellular responses Achieving the goals of proteomics is
10
not trivial Adding to the complexity of this field is the need to integrate proteomics
data with other information to fully understand how systems work
Systems biology is a newly emerging field that seeks to analyze the relationships
among elements in a system in response to genetic or environmental perturbations
with the goal of understanding the system or the properties of the system[29]
Therefore systems biology is a holistic approach that seeks to integrate biological data
as an attempt to understand how biological systems function thus being distinct from
a pure omics - based or other bioinformatics methods The present thesis is an attempt
in this direction We captured the proteome difference between cellular states and
integrate this information with information from gene ontology as well as protein
interaction database Thus for the first time it provides an in-depth interpretation at
the molecular signaling network level
In particular our systems biology approach consists of the following three major
elements [2] (1) Omics analyzing mass-spectrometry derived proteomics
experimental data to identify differentially expressed proteins in different genetic or
environmental conditions (2) Ontology annotating the proteomics data based on gene
ontology functional categories (3) Network mapping the proteomic data into protein-
protein interaction network and translating the protein-protein interaction network into
a gene ontology cross-talk network
Figure 22 Major elements of our systems biology approach The lines represent
the tight connections of the elements
Proteomics
(see 211 ~
213)
Gene
Ontology
(see 222)
Protein - Protein
Interaction Network
(see 223 and 32)
11
Figure 22 shows the three major elements of our systems biological approach In
this approach the data from omics experimental results is analyzed against gene
functional categories and gene functional category network It is the first time that the
gene ontology concept has been brought to the molecular context of protein-protein
interaction networks which has been used to interpret the proteomics experimental
result
222 Ontology ndash based gene annotations
From the point of view of systems biology the interpretation of differentially
expressed protein lists identified from proteomics experiments is not a trivial task
Given a set of differentially expressed genes proteins or a set of genes proteins in a
cluster one would often wish to know whether these genes proteins share a common
function subcellular localization metabolic or regulatory pathway In addition to
characterizing the geneprotein set this type of analysis may also reveal information
on new and previously unknown genes in the set This type of work often requires the
mapping of the genesproteins into gene ontology (GO) terms The introduction of
Gene Ontology (GO) as a standardized vocabulary for describing genes gene products
and their biological functions represents an important milestone in the possibilities to
handle and include biological background information in functional genomics and
proteomics analyses
The gene ontology is represented as a network or a bdquodirected acyclic graph‟ (DAG)
in which terms may have multiple parents and multiple relationships to their parents
The controlled vocabularies are structured in levels so that attributes can be assigned
to a gene product at different levels of description depending on how much is known
about this gene product[30] There are three different sets of vocabularies for gene
ontology (1) Molecular function describes the activity of a gene product at the
molecular level It does not provide information about the compounds or locations of
the activity Example of molecular function at level 2 can be binding and at level 3 can
be protein binding The more specific term at level 4 can be transcription factor
binding (2) Biological process describes recognized series of events or molecular
12
functions A biological process is not equivalent to a pathway though some GO terms
do describe pathways Examples of biological process are death at level 3 and cell
death at level 4 (3) Cellular component refers to the location in the cell in which a
gene product exerts its activity Examples are nucleolus organelle and polarisome
Many databases today provide GO annotations for a variety of organisms including
humans yeast and other species
Annotation of genes with GO terms creates a biological knowledge profile in three
layers (biological process molecular function or cellular component) Three common
methods are used to query GO categories by individual gene by gene function and
by using a list of genes [31] Translation of the differentially expressed geneprotein
list into a functional profile helps biologist get insight into the cellular mechanisms
relevant to a given condition Therefore it has been widely used in the analysis of
functional genomics and proteomics studies [32-36]
The ontological analysis of gene expression or proteomics data usually follows the
following steps (1) Prepare the gene or protein list of interest (2) Prepare reference
gene or protein list which is used to calculate P-values against (3) Map both lists
(interested list and reference list) to GO categories (4) Select statistical model The
gene ontology analysis can be performed with a number of statistical models including
hypergeometric binomial Fisher‟s exact test and chi-square These tests are
discussed in detail in [37] (5) Find significantly enriched GO categories in your list of
interest using the selected statistical model (6) Perform corrections for multiple
comparisons When many genesproteins are analyzed at the same time some
significance will happen by chance The multiple comparison corrections control the
overall probability of making a Type I error Many different statistical methods have
been published to perform this kind of correction for example Bonferroni correction
[38] FDR [39] and permutation correction [40] Each method has its unique feature
(7) Interpret the result in terms of the biological significance
13
The statistical evaluation of enriched GO categories enables to highlight the most
significant biological characteristics of a gene or protein set therefore allows us to
mine knowledge from data In recent years many tools have been developed to
automate the gene ontology analysis Table 21 lists some popular GO analysis tools
the statistical models the tools used multiple comparison correction methods
implemented and the GO visualization view
Table 21 Gene Ontology analysis tools
Tool Statistical model Multiple comparison
corrections
GO
visualization
WebGestalt[41] Hypergeometric test
Fisher‟s exact test
NA Tree bar chart
DAG
GeneMerge[42] Hypergeometric Bonferroni No tree view
CLENCH[43] Chi-square test Binomial
Hypergeometric
NA DAG
GOSurfer[44] Chi-square test FDR Tree
Onto-
Express[45]
Chi-square test Binomial
Hypergeometric Fisher‟s
exact test
Bonferroni Holm
Sidak
Tree
GOToolBox[46] Binomial Hypergeometric
Fisher‟s exact test
Bonferroni
HolmFDR Hochberg
Hommel
NA
Onto-
Express[45 47]
Binomial Hypergeometric
Chi-square test
Bonferroni Holm
Sidak FDR
Tree bar chart
GO Term
Finder[48]
Binomial NA Tree
The ontology-based omics data analysis approach enables researchers to find out
enriched functional categories involved in the experimental conditions While
biological systems contain large number of different genes and proteins that are
14
interacted with each other it is necessary to develop an approach to bring the
ontology-based omics data analysis to the interaction network This integrated
approach will definitely benefit the biologists to obtain more insight for biological
phenomena
223 Protein interaction network- based analysis
A discrete biological function is rarely attributable to an individual protein [49]
Instead most biological characteristics arise from complex interactions between the
cell‟s numerous constituents such as proteins DNA RNA and small molecules In
particular the network of protein-protein interactions also referred to as interactome
forms a backbone of signaling pathways metabolic pathways and cellular processes
for normal cell function Protein interaction network analysis provides an effective
way to understand the relationships between genes It places the genes identified in
functional genomics and proteomics experiments in a broader biological context
thereby facilitating the understanding of the structure and function of a living cell
The network-based analysis has been enabled by the recent elucidation of large-
scale protein interaction networks in different species including S cerevisiae
(yeast)[50-53] D melanogaster (fly)[54] C elegans (worm)[55] and H sapiens
(human)[56 57] )[56 57] Collections of these protein interactions representing a
subset of the whole interactome are stored in various data repositories as the Database
of Interacting Proteins (DIP) (ref) the Biomolecular Interaction Database (BIND)
The Molecular INTeraction Database (MINT) InAct the human Protein Reference
Database (HPRD) and the Online Predicted Human Interaction Database (OPHID)
[58] The protein network-based analysis has been utilized for the analysis of
functional genomics experiments recently [59 60]
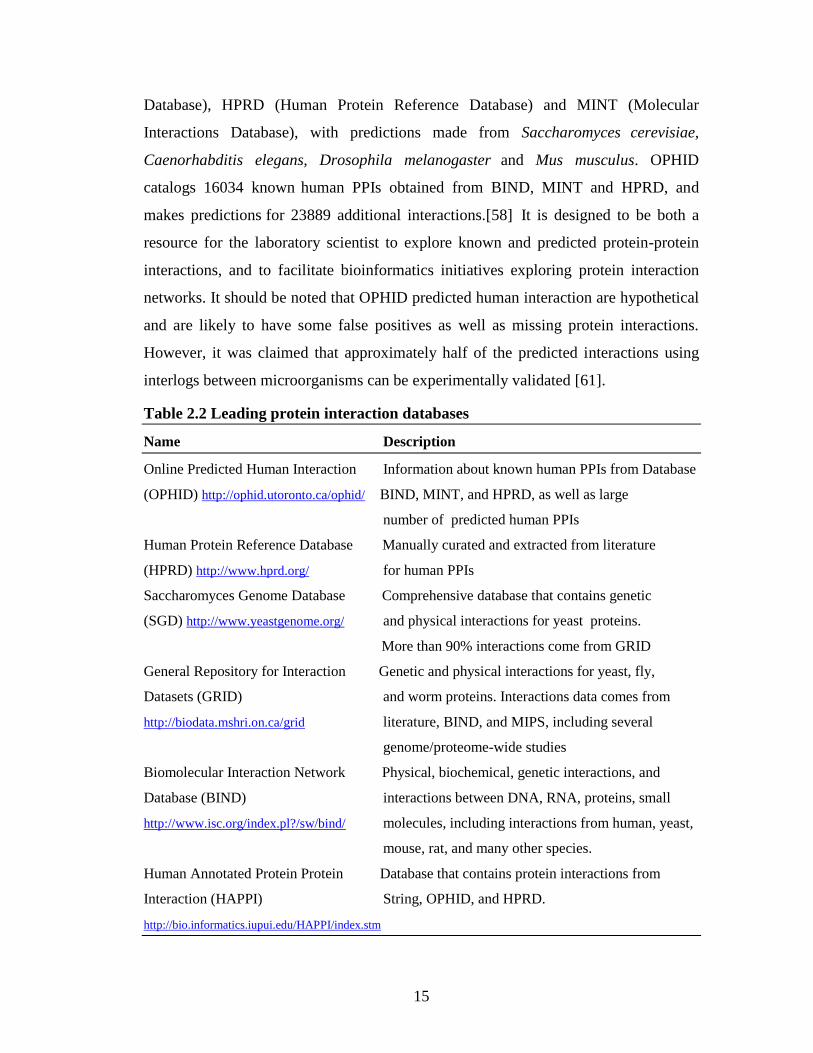
The most comprehensive database for a human protein network is the Online
Predicted Human Interaction Database (OPHID) [58] OPHID is a web-based database
of predicted interactions between human proteins It combines the literature-derived
human protein-protein interactions from BIND (Biomolecular Interaction Network
15
Database) HPRD (Human Protein Reference Database) and MINT (Molecular
Interactions Database) with predictions made from Saccharomyces
cerevisiae
Caenorhabditis elegans Drosophila melanogaster
and Mus musculus OPHID
catalogs 16034 known human PPIs obtained from BIND MINT and HPRD and
makes predictions for 23889 additional interactions[58]
It is designed to be both a
resource for the laboratory scientist to explore known and predicted protein-protein
interactions and to facilitate bioinformatics initiatives exploring protein interaction
networks It should be noted that OPHID predicted human interaction are hypothetical
and are likely to have some false positives as well as missing protein interactions
However it was claimed that approximately half of the predicted interactions using
interlogs between microorganisms can be experimentally validated [61]
Table 22 Leading protein interaction databases
Name Description
Online Predicted Human Interaction Information about known human PPIs from Database
(OPHID) httpophidutorontocaophid BIND MINT and HPRD as well as large
number of predicted human PPIs
Human Protein Reference Database Manually curated and extracted from literature
(HPRD) httpwwwhprdorg for human PPIs
Saccharomyces Genome Database Comprehensive database that contains genetic
(SGD) httpwwwyeastgenomeorg and physical interactions for yeast proteins
More than 90 interactions come from GRID
General Repository for Interaction Genetic and physical interactions for yeast fly
Datasets (GRID) and worm proteins Interactions data comes from
httpbiodatamshrioncagrid literature BIND and MIPS including several
genomeproteome-wide studies
Biomolecular Interaction Network Physical biochemical genetic interactions and
Database (BIND) interactions between DNA RNA proteins small
httpwwwiscorgindexplswbind molecules including interactions from human yeast
mouse rat and many other species
Human Annotated Protein Protein Database that contains protein interactions from
Interaction (HAPPI) String OPHID and HPRD
httpbioinformaticsiupuieduHAPPIindexstm
16
On the other hand SGD (Saccharomyces Genome Database) is a scientific
database of the molecular biology and genetics of the yeast Saccharomyces cerevisiae
which is commonly known as Bakers or budding yeast Besides protein-protein
interaction datasets SGD also contains genes and proteins sequence information
descriptions and classifications of their biological roles molecular functions and
subcellular localizations and links to literature information (see table 22) [62-64]
More than 90 of the interactions stored in SGD come from GRID BIND
(Biomolecular Interaction Network Database) is the database that stores the
interactions between DNA RNA proteins and small molecules for many species
including yeast [65-67] Table 22 lists the information for the leading protein
interaction databases
The protein network-based analysis has been considered as one of the most
important elements of the systems biology approach Protein network analysis place
the genes identified in microarray experiments or differentially expressed proteins
detected in mass-spectrometry experiments in a global biological context Protein-
protein interaction networks reflect the functional grouping of these coordinated
genesproteins It enables the study of the roles of subsets of genesproteins
A few papers published recently reported mapping the differentially expressed
protein lists identified through microarray or proteomics experiments into protein-
protein interaction database such as OPHID Using the network-based analysis Wachi
et al found that the genes differentially elevated in cancer as obtained from
microarray profiling data are well connected[60] In this study genes in the array
were mapped onto OPHID using gene symbols and protein sequences Connectivity
analysis was performed for the protein network constructed Then k-core analysis was
conducted where less connected nodes were removed in an iterative way This
resulted in a series of subgraphs that gradually revealed the globally central region of
the original network Using k-core analysis the authors measured how differentially
expressed genes were close to the topological center of the protein network Centrality
17
of the genes is associated with the essential functions of the genes in the yeast The
analysis concluded that squamous cell lung cancer genes share similar topological
features for essential proteins
Calvano et al recently performed a network analysis of systematic inflammation in
humans [68] Gene expression patterns in human leukocytes receiving an
inflammatory stimulus were first analyzed using genome-wide microarray analysis
Genes significantly perturbed after stimulus were identified using significance analysis
of microarray method which controls the false discovery rate to less than 01 To
identify significant pathways in a biological process the differentially expressed genes
were overlaid onto the interactome the Ingenuity Pathways Knowledge Base (KB)
which is the largest curated database of previously published findings on mammalian
biology from the public literature Target genes were identified as the subset having
direct interactions with other genes in the database The specificity of connections for
each target gene was calculated by the percentage of its connections to other
significant genes Pathways of highly connected genes were identified by likelihood
Using this strategy the authors demonstrated that upon acute systematic inflammation
the human blood leukocyte response includes widespread suppression at the
transcriptional level of mitochondria energy production and protein synthesis
machinery
Said et al [69] used protein interaction networks to analyze the phenotypic effects
in yeast Toxicity-modulation non-phenotypic classifications and high-throughput
genomic phenotyping were conducted Networks that represented a phenotypically
annotated interactome of essential toxicity-modulating and no-phenotype proteins
were constructed The analysis showed interesting results For example
toxicologically important protein complexes pathways and modules were identified
which have potential implications for understanding toxicity-modulating processes
relevant to human diseases
18
In other studies Seiden-Long et al integrated the microarray datasets with OPHID
and found six of the target genes by HGFMetRAS signaling belong to a hypothetical
network of function at the protein level [70] Motamed-Khorasani et al found that six
of the total of 17 androgen-regulated genes could be mapped into OPHID database
Five of the six genes are networked within two interacting partners [71]
The current project will integrate the three elements proteomics ontology and
network and perform ontology-driven and network-enabled systems biology case
studies The following sections will describe the details of our methods and results
19
3 METHODS
All methods related to ovarian cancer study in this section were based on the
published methods and private communications with Dr Chen Dr Shen and Dr
Wang I am one of the primary contributing members (Chen J Yan Y Shen C
Fitzpatrick D Wang M A Systems Biology Case Study of Ovarian Cancer Drug
Resistance JBCB 2007[2]) Method in 322 was kindly provided by Dr Shen who
developed a statistical model to identify differentially expressed proteins as one of the
inputs of my case study 2 Ovarian cancer proteomics experimental methods in
section 311 were kindly provided by Dr Mu Wang Yeast proteomics experimental
methods in section 312 were kindly provided by Josh Heyen Tables 31 ~ 33 were
based on discussion with Dr Goebl and Josh Heyen where I am one of the
contributors The use of the materials was granted with the permission from
participating contributors
31 Proteomics Method
311 Ovarian cancer drug resistance proteomics method
A2780 and 2008 cisplatin-sensitive human ovarian cancer cell lines and their
resistant counterparts A2780CP and 2008C13525 were used in the ovarian cancer
drug resistant study Proteins were prepared and subjected to LCMSMS analysis as
described in [72] There were two groups (two different parent cell lines) six samples
per cell line and two HPLC injections per sample Samples were run on a Surveyor
HPLC (ThermoFinnigan) with a C18 microbore column (Zorbax 300SB-C18 1mm x
5cm) All tryptic peptides (100 L or 20 g) were injected onto the column in random
order Peptides were eluted with a linear gradient from 5 to 45 acetonitrile
developed over 120 min at a flow rate of 50 Lmin Fluant was introduced into a
ThermoFinnigan LTQ linear ion-trap mass spectrometer The data were collected in
the ldquotriple-playrdquo mode (MS scan Zoom scan and MSMS scan) The acquired data
were filtered by proprietary software and Database searching against International
Protein Index (IPI) database NR-Homo Sapiens database was carried out using both
SEQUEST and XTandem algorithms Protein quantification was carried out using the
20
LCMS-based label-free proprietary protein quantification software licensed from Eli
Lilly and Company [72] Briefly once raw files are acquired from the LTQ all
extracted ion chromatogram (XIC) is aligned by retention time Each aligned peak
should match parent ion charge state daughter ions (MSMS data) and retention time
(within a one-minute window) If any of these parameters were not matched the peak
will be disqualified from the quantification analysis The area-under-the-curve (AUC)
from individually aligned peak was measured normalized and compared for their
relative abundance All peak intensities were transformed to a log2 scale before
quantile normalization [73] If multiple peptides have the same protein identification
then their quantile normalized log2 intensities were averaged to obtain log2 protein
intensities The log2 protein intensity is the final quantity that is fit by a separate
ANOVA statistical model for each protein log2 (Intensity) = overall mean + group
effect (fixed) + sample effect (random) + replicate effect (random) Group effect refers
to the effect caused by the experimental conditions or treatments being evaluated
Sample effect is caused by random effects from individual biological samples It also
includes random effects from sample preparation The replicate effect refers to the
random effects from replicate injections of the same sample All of the injections were
in random order and the instrument was operated by the same operator The inverse
log2 of each sample mean was determined to resolve the fold change between samples
312 Yeast Grr1 knock-out proteomics method
For the yeast Grr1 knock-out study a customized SILAC approach was used to
perform mass labeling Scerevisiae strain DBY2059 (Mat α leu2-3) was cultured
overnight to stationary phase in two replicate 10ml batches of modified SD media
consisting of 2 glucose 5 glutamine and 05 mgml C613
leucine (Cambridge
Isotope Laboratories Inc Andover MA USA) Concurrently strain JH001 (Mat A
grr1ΔNat) was also cultured overnight to stationary phase in two replicate 10ml
batches of the same media supplemented with C612
leucine Each 10ml culture was
then used to inoculate a 500ml culture of the same media and cells were grown for
nine population doublings to mid-log phase (~5x10⁶ cellsml) Cell density was
determined by cell counting using a hemacytometer (Reichert BuffaloNY USA)
21
Cells were harvested by centrifugation in a Beckman JA-14 rotor at 4000 X G for 10
minutes washed three times in ice cold water and immediately re-suspended in 5ml
of extraction buffer [8M Urea 01M Ammonium Bicarbonate] Cells were then
immediately flash frozen in liquid nitrogen and stored at -80C overnight Protein
extract was prepared the following day by manual bead beating using 300 um acid
washed glass beads (Sigma StLouis MO) Specifically samples were subjected to 10
cycles consisting of 30 seconds on ice and 30 seconds of vortexing in the presence of
glass beads Glass beads and cellular debris were then spun down at 2000 X G and the
supernatant was placed in 15ml conical tubes Protein concentrations were determined
using the Bradford protein assay and protein samples were mixed in a 11 ratio
(DBY2059 C613
leucine JH001 C612
leucine) producing two replicate protein mixes
from four independently grown batch cultures Each protein mixture was diluted with
100mM Ammonium Bicarbonate to a final Urea concentration of 4M Protein
disulfide bond reduction was carried out by adding a 40 fold molar excess of
Dithiothreitol (DTT) to each protein mixture followed by a three hour incubation at
36C Reduced protein mixtures were then alkylated using a 180 molar ratio of protein
to iodoacetamide (IAM) followed by incubation on ice in complete darkness for 2
hours The reduced and alkylated protein mixture was then diluted to 2M Urea using
an equal volume of 100mM ammonium bicarbonate and subjected to trypsin digestion
using 2 (weightweight) of TPCK-treated trypsin Digestion was carried out at 37C
for twenty four hours Peptide samples were then dried down in a speed-vac and
resuspended in a buffer consisting of 5 Acetonitrile 95 EMD water 0025
Formic Acid and 00025 HFBA
The two replicate peptide mixtures were analyzed 3 times each through an
automated de-salt2DLCMS system Peptide De-salting and separation were
performed in tandem using the Paradigm MG4 HPLC System (Michrom Biosciences
Inc) Initially approximately 150ug of the tryptic peptide mixture was loaded directly
onto a C-18 microtrap (Michrom Biosciences Inc) and desalted by flushing the trap
with 20 column volumes of mobile phase A (2 Acetonitrile 98 Water 0025
Formic Acid) at a flow rate of 50 ulmin Peptides were then eluted onto an SCX
22
microtrap (Michrom Biosciences Inc) using 20 volumes of mobile phase B (98
Acetonitrile 2 Water 0025 Formic Acid 0001 HFBA) Peptides were then
bumped off the SCX microtrap in a stepwise fashion using increasing concentrations
of Ammonium Formate Ten steps were used in our analysis of 0 4 8 12 15 18 21
25 50 and 100 mM Ammonium Formate followed by two identical steps of 1M
Ammonium Formate Each population of peptides were eluted off the SCX micro-trap
onto a C8 nano-trap (Michrom Biosciences Inc) coupled directly to a hand packed
C18 column with a hand pulled tip A home made high pressure bomb was used to
pack 15 cm of 5um-100 angstrom Magic C18 resin (Michrom Biosciences Inc)
Peptides were then eluted off this column at 500nlmin using an Acetonitrile gradient
from 5-50 and analyzed by an LTQ Mass Spectrometer (Thermo Electron
Corporation) on the fly
The LTQ-MS was set for data dependent MSMS acquisition with a total ion count
threshold of 1000 Dynamic exclusion was used to only collect two MSMS spectra on
a single parent ion every 45 seconds Two types of data collection were performed in
this analysis termed gas phase fractionation and full scan analysis Typically the
LTQ-MS is set to scan across an mz range from 500-2000 throughout the course of
the analysis This type of analysis was done in replicate for both replicate peptide
mixtures culminating in four 12 step full scan analyses Each of the peptide mixtures
was also subjected to a single gas phase fractionation analysis This analysis is
essentially equivalent to three full scan analyses but the mass spectrometer is set to
scan 13 of the mz scan range This allows for greater mz resolution and increased
peptide detection sensitivity due to the fact MSMS spectra are being collected for a
smaller fraction of the peptide population eluting from the column However this
process is time consuming given that three separate analyses must be performed to
acquire data across the whole scan range and thus we only conducted a single gas
phase analysis for each peptide mixture The scan ranges for gas phase fractionation
were 500-1000 mz 900-1500 mz and 1400-2000 mz In all each of the two
replicate peptide mixes were loaded and analyzed five times through the 2D-LC-MS
system for a total of ten different runs
23
Peptide assignments for experimental MSMS spectra were made using the
SEQUEST program (Thermo Electron Corporation) The 12 raw files generated for
each run are run individually through the SEQUEST software Peptide assignments
were then analyzed for validity using a suite of software available from the Institute
for Systems Biology termed the Trans-Proteomic Pipeline This analysis toolkit
provides computational tools that validate peptide assignments (Peptide Prophet)
protein assignments (Protein Prophet) and quantify relative peptide and protein
abundance ratios (ASAPRatio) It is important to note that prior to analysis through
the TPP the 12 raw files are combined into a single mzXML using the TPP This
mzXML file captures raw parent MS spectra for use in quantification by the program
ASAPratio The SEQUEST output files are converted to summaryhtml files that are
readable by the programs Peptide Prophet and Protein Prophet All the individual raw
files and SEQUEST out files for a given analysis are analyzed together through the
TPP to calculate the most accurate peptide probabilities protein probabilities and
ratios for a given analysis
32 Preparation of Datasets
321 Proteins in differentially expressed cisplatin-resistant vs cisplatin-sensitive
ovarian cancer cells
The protein quantification data was stored in Oracle schema Sysbio (see appendix
1) 574 differentially expressed proteins with q-value (false discovery rate) lt=010
both up- and down-regulation values or 141 proteins (with q-value lt=005) were
generated by mass spectrometry based proteomics experiment Proteins were mapped
into IPI database IDs These IPI identifiers were converted into UniProt IDs in order to
integrate this data set with all other annotated public data 119 of the 141 proteins
(005 q-value threshold) were successfully mapped and converted (see appendix 2)
using the International Protein Index (IPI) database[74] downloaded in February 2006
the UniProt database downloaded in November 2005[75] and additional internally
curated public database mapping tables Similarly 451 out of the 574 proteins with the
less strict threshold (q-value lt=010) were mapped from IPI IDs to UniProt IDs
24
322 Differentially expressed proteins identified from Grr1 knock-out yeast vs
wild-type yeast
For each protein identified in mass spectrometry experiment there are two
measures (i) the probability that the identification is correct (output from
ProteinProphet) and (ii) the relative abundance ratio and its standard error (output
from ASAPratio)
Since some proteins might be identified by more than one experiment one can
improve the reliability and accuracy of the two measures by combining the estimates
from each experiment If a protein is identified by k experiments labeled r1 r2hellip rk
then the summarized probability is calculated as
1
1 (1 )i
k
id r
i
P P
Where ir
P is the probability measure from experimentir
To summarize the estimate of the relative abundance ratio we use a linear
combination of the estimate at the log10 scale from each experiment The weight is
determined so that the summarized estimate has the lowest standard error among all
possible linear combinations Then the z-score is calculated by dividing the
summarized estimate by its standard error for each protein The local false discovery
rate approach proposed by Effron[76] is applied to the z-scores to calculate the
probability that the relative abundance ratio is different from 1 (ratioP ) Finally we take
id ratioP P P as the final confidence measure that a protein is differentially expressed
between the two samples In other words to be claimed as ldquodifferentially expressedrdquo
a protein needs to have high confidence in its identification and high confidence in its
differential abundance 184 proteins were selected (Combined Probabilitygt=08) from
Grr1 knock-out vs wild-type yeast mass spectrometry experiment (see appendix 3)
25
323 Protein interactome data
The primary source of human data comes from the Online Predicted Human
Interaction Database (OPHID) [58] which were downloaded in February 2006 It
contains more than 47213 human protein interactions among 10577 proteins
identified by UniProt accession numbers After mapping the proteins in OPHID to
UniProt IDs we recorded 46556 unique protein interactions among 9959 proteins
Note that even though more than half of OPHID entries are interacting protein pairs
inferred from available lower organisms onto their human orthologous protein pair
counterparts the statistical significance of these predicted human interactions was
confirmed by additional evidences according to OPHID and partially cross-validated
according to our previous experience [77] We assigned a heuristic interaction
confidence score to each protein interaction based on the type and source protein
recorded in OPHID according to a method described in [77] We call this data set PiD0
49
12
39BIND ONLY
SGD ONLY
BIND AND SGDOVERLAPPINGS
Figure 31 Yeast interactome data source from BIND and SGD The percentages
show the proportion of the non-redundant interacting pairs of each category among the
combined non-redundant interacting pairs from BIND and SGD
The source of yeast interactome data was the Saccharomyces Genome Database
(SGD) [58] Biomolecular Interaction Network Database (BIND) and a small set of
in-house manually curated data by our biology group (Goebl) The data from SGD and
26
BIND were downloaded in February 2006 Figure 31 summarized the percentage of
overlappings of the interactome data from SGD and BIND A total of 25418 non-
redundant interactions were obtained after combining the 3 interactome datasets and
the intensive processing (see Figure 32 for the data processing flow chart) We call
this interactome dataset SBG Non-redundant interactions are defined as the
interactions that only contain unique interacting pairs The same interaction detected
by different methods or published in different papers is counted as one unique pair
For each interacting pair in SBG we calculated a reliability score based on the scoring
model developed (see section 33)
Figure 32 Interactome data integration flow chart
27
324 Noise-introduced human protein interactome data
To test how robust the final computational results would hold up against noise
which is commonly believed to exist in large portions of the public protein interaction
data set we generated two additional human protein interaction data sets PiD-a20 and
PiD-r20
For PiD-a20 we add ldquoprotein interaction noiserdquo by randomly connecting protein
pairs from the set of 9959 unique proteins for as many times as necessary to
eventually generate 120 46556= 55869 unique interactions Therefore we
generate 20 new and unique ldquonoisyrdquo interactions in the PiD-a20 data set
For PiD-r20 we eliminate ldquoprotein interaction noiserdquo by randomly removing
protein interaction pairs from the total 45556 initial pairs of protein interactions in
PiD0 to eventually reduce the total number of protein interactions down to (1-20)
46556= 37243 Therefore 80 of original interactions are kept intact in the PiD-r20
data set
325 Gene annotation data
The human gene annotation database was downloaded from
httpwwwgenmapporg in January 2006 The whole annotation database (in MS
Access) was then migrated to Oracle 10g Human proteome GO annotation was
performed based on human gene GO annotation and human gene ID to protein
UniProt ID mappings
The yeast gene annotation database was downloaded from wwwgenmapporg in
January 2006 This database (in MS Access) was migrated to Oracle 10g We also
downloaded additional annotation datasets from other websites such as
httpwwwyeastgenomeorg in January and February Based on these datasets we
designed and implemented our yeast gene annotation database (see Figure 33) Yeast
28
proteome GO annotation was performed based on yeast gene GO annotation and yeast
gene ID to ORFs mappings curated internally
Figure 33 ERD diagram of yeast annotation database stored in Oracle 10g
326 Interacting protein categorical annotation data
Each GO term from the human or yeast protein annotation data was annotated with
its minimal GO level number in the GO term hierarchy Each GO term‟s higher-level
parent GO terms (multiple parent GO terms are possible) up to GO level 1 (three GO
terms at this level molecular function cellular components and biological processes)
29
are also traced and recorded in an internally curated GO annotation table When
calculating interacting protein GO category information we use this internally curated
GO term table to map all the low-level GO term IDs (original GO Term ID) used to
annotate each protein to all the GO term IDs‟ high-level GO term IDs (folded GO
Term ID) For this study we designate that all the folded GO term ID should be at GO
term hierarchy Level = 3 Note that our method allows for multiple GO annotation
Term IDs (original or folded) generated for each protein ID on purpose Therefore it
is possible for a protein or a protein interaction pair to appear in more than one folded
GO term category or more than one folded GO term interacting category pairs
33 Protein-Protein Interaction Scoring Model
The reliability score of a pair of interaction can be assigned based on what
experimental methods detected the interaction how many different methods were used
and how many different papers have published the same interaction
Our scoring model was developed in 3 steps
First we mapped the interaction methods stored in SGD (see table 31) or BIND
(see table 32) into certain codes for SGD the code begins with ldquosrdquo for BIND the
code begins with ldquobrdquo Then we created our metadata (see table 33) to unify the
experimental methods for interacted pairs stored in SGD and BIND We created the
code for the unified method which begins with ldquoGrdquo For each unified term a
reliability score was assigned based on the characteristics of the experimental method
Generally interactions identified from low throughput experiments are more reliable
than from high throughput experiments for example the method ldquoTwo Hybridrdquo was
assigned the lowest score ldquo01rdquo Based on this an interaction pair j identified by
experimental method i can be assigned a base score of S0ji
(2) For interaction pair j a specified experimental method i can associate with certain
number (Cji) of unique PubMed IDs A maximum number of publications can be
calculated among all methods for the same pair of interaction The adjusted rate ji
30
for experimental method i of a certain interacted pair j can be calculated as (see figure
34)
110
max(max 1 1)
Cjiji
Cji
(Where j denotes the jth unique interaction pair i denotes the ith experimental method)
The adjusted score for experimental method i of a specified interaction pair j can be
calculated as (see figure 34)
S ji = S0ji ( 1+ ji)
Figure 34 Protein interaction reliability score calculation algorithm and
formulas PMID stands for PubMed ID
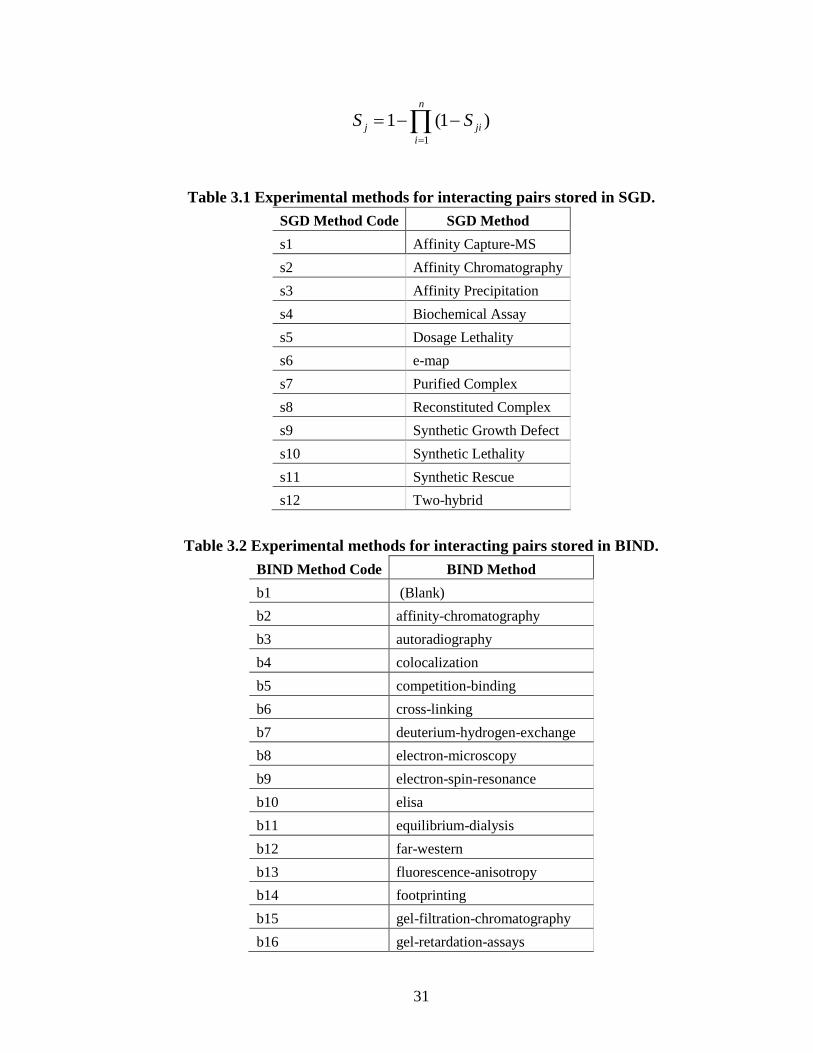
(3) Similar to [78] we combine Sj1 Sj2 hellip Sji hellip Sjn and calculate a final score Sj
for the specified interaction pair j (see figure 34)
31
1
1 (1 )n
j ji
i
S S
Table 31 Experimental methods for interacting pairs stored in SGD
SGD Method Code SGD Method
s1 Affinity Capture-MS
s2 Affinity Chromatography
s3 Affinity Precipitation
s4 Biochemical Assay
s5 Dosage Lethality
s6 e-map
s7 Purified Complex
s8 Reconstituted Complex
s9 Synthetic Growth Defect
s10 Synthetic Lethality
s11 Synthetic Rescue
s12 Two-hybrid
Table 32 Experimental methods for interacting pairs stored in BIND
BIND Method Code BIND Method
b1 (Blank)
b2 affinity-chromatography
b3 autoradiography
b4 colocalization
b5 competition-binding
b6 cross-linking
b7 deuterium-hydrogen-exchange
b8 electron-microscopy
b9 electron-spin-resonance
b10 elisa
b11 equilibrium-dialysis
b12 far-western
b13 fluorescence-anisotropy
b14 footprinting
b15 gel-filtration-chromatography
b16 gel-retardation-assays
32
b17 hybridization
b18 immunoblotting
b19 immunoprecipitation
b20 immunostaining
b21 interaction-adhesion-assay
b22 light-scattering
b23 mass-spectrometry
b24 membrane-filtration
b25 monoclonal-antibody-blockade
b26 not-specified
b27 other
b28 phage-display
b29 resonance-energy-transfer
b30 sucrose-gradient-sedimentation
b31 surface-plasmon-resonance-chip
b32 three-dimensional-structure
b33 transient-coexpression
b34 two-hybrid-test
Table 33 Metadata for experimental methods
SGD and BIND
Method Code Code Unified Term Reliability Score
b2 s1 s2 s3 b19 G1 Affinity_Purification 08
b6 G2 Cross_Linking 05
b10 G3 Elisa 07
b28 G4 Phage_Display 01
b29 G5 Resonance_Energy_Transfer 04
b34 s12 G6 Two_Hybrid 01
s6 G7 E_Map 08
s9 s10 G8 Synthetic_Growth_Defect 08
s11 G9 Synthetic_Rescue 08
s7 G10 Purified_Complex 08
s5 G11 Dosage_Lethality 08
s4 G12 Biochemical_Assay 08
s8 G13 Reconstituted_Complex 06
33
b3 b4 ~ b9 G99 Other 01
b11 b12 ~ b18 G99 Other 01
b20 b21 ~ b27 G99 Other 01
b1 b30 ~ b33 G99 Other 01
34 Network Expansion
We derive differentially expressed protein interaction sub-network using a nearest-
neighbor expansion method described in [77] We call the original list of differentially
expressed proteins (119 proteins in ovarian cancer study or 184 proteins in yeast Grr1
knock-out study) seed (S) proteins and all the protein interactions within the seed
interactions (or S-S type interactions) After expansion we call the collection of seed
proteins and expanded non-seed (N) proteins sub-network proteins (including both S
and N proteins) we call the collection of seed interactions and expanded seed-to-non-
seed interactions (or S-N type interactions) sub-network protein interactions (including
both S-S type and S-N type interactions) Note that we do not include non-seed-to-
non-seed protein interactions (or ldquoN-Nrdquo type interactions) in our definition of the sub-
network primarily because the N-N type of protein interactions often outnumbered
total S-S and S-N types of protein interaction by several folds with molecular network
context often not tightly related to the initial seed proteins and seed interactions The
only occasion to consider the N-N type interactions is when we calculate sub-network
properties such as node degrees for proteins in the sub-network
35 Network Visualization
We use Spotfire DecisionSite Browser 72 to implement the 2-dimensional
functional categorical crosstalk matrix for human ovarian cancer drug resistance study
To perform interaction network visualization we used ProteoLens[79] ProteoLens
has native built-in support for relational database access and manipulations It allows
expert users to browse database schemas and tables query relational data using SQL
and customize data fields to be visualized as graphical annotations in the visualized
network
34
36 Network Statistical Examination
Since the seed proteins are those that are found to display different abundance level
between two different cell lines via mass spectrometry one would expect that the
network ldquoinducedrdquo by them to be more ldquoconnectedrdquo in the sense that they are to a
certain extent related to the same biological process(es) To gauge network
ldquoconnectivityrdquo we introduced several basic concepts We define a path between two
proteins A and B as a set of proteins P1 P2hellip Pn such that A interacts with P1 P1
interacts with P2 hellip and Pn interacts with B Note that if A directly interacts with B
then the path is the empty set We define the largest connected component of a
network as the largest subset of proteins such that there is at least one path between
any pair of proteins in the network We define the index of aggregation of a network
as the ratio of the size of the largest connected component of the network to the size of
the network by protein counts Therefore the higher the index of aggregation the
more ldquoconnectedrdquo the network should be Lastly we define the index of expansion of
a sub-network as the ratio of S-S type interactions among seed proteins over all seed
and expanded sub-network interactions (S-S and S-N types) The higher the index of
expansion the more relevant roles seed proteins plays in the network
To examine the statistical significance of observed index of aggregation and index
of expansion in expanded protein networks we measure the likelihood of the topology
of the observed sub-network under random selection of seed proteins This is done by
randomly selecting 119 proteins (in ovarian cancer study) or 184 proteins (in yeast
Grr1 knock-out study) identifying the sub-network inducedexpanded and calculating
sub-network indexes accordingly The same procedure is repeated n=1000 times to
generate the distribution of the indexes under random sampling with which the
observed values are compared to obtain significance levels (for details refer to [77])
37 Significance of Testing of GO Categories and GO-GO Categories
To assess how significantly the seed proteins (119 in human study and 184 in yeast
study) in the subnetwork are distributed across their specific GO function categories
35
we hypothesize the task as observing the outcome of a random draw of the same
number of proteins from the pool of proteins in the whole interacting network (9959
proteins in human study and 5240 in yeast study) Then the count in a certain GO
category follows a hypergeometric distribution A p-value is calculated based on the
hypergeometric distribution to evaluate the likelihood that we observe an outcome
under random selection of a subset of proteins (119 in human and 184 in yeast) that is
at least as ldquoextremerdquo as what we have observed Note ldquoextremerdquo either implies an
unusually large (over-representation) or usually small (under- representation) number
Let x be the count of the seed proteins that falls in a function category in the
subnetwork n is the sample size (119 in human study or 184 in yeast study) N is the
population size (9959 in human study or 5240 in yeast study) and k=corresponding
count in OPHID then the p-value for overunder-representation of the observed count
can be calculated as
Over representation
Under representation
We also expand the protein list from the 184 seed proteins to 1251 sub-network
proteins in yeast study and calculate a p-value for randomly drawing of 1251 proteins
from the pool of 5240 proteins in SBG based on its hypergeometric distribution
Similarly we can use the above formula to assess how significantly the protein
interactions from the seeded subnetwork are distributed across specific GO-GO
functional interaction categories For a GO-GO functional interaction category we
refer to a pair of GO categories which are derived by aggregating all the protein-
protein interaction pairs with the same pairing of GO annotation categories for the
0
Pr[ | ] x
i
k N k Np X x n N k
i n i n
min( )
Pr[ | ] n k
i x
k N k Np X x n N k
i n i n
36
interacting proteins For example if 3 protein interactions share annotation category A
in one side of the interaction and annotation category B in the other side of the
interaction we say that A-B is a functional interaction category with an observed
count of 3 To identify significant GO-GO functional interaction category in the
seeded subnetwork we hypothesize the task as the observing the outcome of a random
draw of 1723 pairs from the pool of 46556 pairs in OPHID in human study (or
random draw of 1698 pairs from the pool of 25418 pairs in SBG in yeast study)
Then the count of a certain GO-GO function interaction category follows a
hypergeometric distribution A p-value for overunder-representation of the observed
count can be calculated similarly based on the hypergeometric distribution Since tests
of overunder representation of various categories are correlated with one another
(over representation of one category could imply under representation of other
categories) we also control the false discovery rate (FDR) using method developed by
Benjamini and Yekutieli[80]
38 Validation of Under-Represented GO Categories
Figure 35 Illustration showing the overlap of 9959 OPHID proteins and 4333
proteins detected by MS experiments 119 seed proteins is a high-confidence subset
of the overlapped proteins
Proteomics techniques are generally known for problems with false positives and
false negatives primarily for reasons such as complex digested peptide samples noisy
un-separated peptide peaks and computationally intensive proteinpeptide
9959 OPHID proteins
3690 proteins in both
OPHID and MS
4333 proteins detected
by MS
119
seed
proteins
37
identifications that cannot afford to take all post-translational modifications into
account Since we control false positives by choosing 119 high-confidence seed
proteins in this study false negatives instead of false positives are a potential concern
Therefore when we interpret over-under- representation of proteins in GO functional
categories or GO-GO functional interaction categories over-representation results are
likely under-exaggerated and will remain true but under-representation results are
likely over-exaggerated and needs additional validation or some adjustment
We take 4333 of all reported proteins which includes proteins identified with both
high and low confidence from the MS search software and overlap this set with all
the 9959 proteins found in OPHID Out of 4333 raw UniProt IDs 3690 of which can
be further mapped to OPHID interaction human database The 3690 is then assumed
to be the upper limit of instrumentsoftware detectable proteins When re-examining
over-under- representation GO functional categories we let n=3690 N=9959
k=corresponding count in OPHID and use the same formula introduced in section 26
to calculate significant protein overunder- representation This relationship is
illustrated in Figure 35
39 Drill-Down of Significant Categories
Once certain GO functional categories or GO-GO functional interaction categories
are determined to be significant they become candidates for subsequent ldquodrill-downrdquo
examinations For drill-down of GO functional categories we refer to exploration of
the next-level GO functional annotation by tracing down the GO structure and re-
calculating the significance value based on each protein‟s new next-level GO
functional annotation labels using methods described in section 26 For drill-down of
GO-GO functional categories we refer to exploring the next-level GO-GO functional
annotations by tracing both proteins of the interaction pair down the GO structure and
re-calculating the significance value The new next-level GO-GO functional
annotation categories consist of all paired combinations of sub GO functional
categories The use of drill-down allows us to zoom in our attention to detailed
biologically interesting categories to obtain further insights in enriched molecular
38
functions and biological processes without incurring a huge computational cost at the
very beginning of the exploration
310 Scoring of Significant Proteins in the Sub-Network
Protein ranking analysis was performed in MS Access front-end database which
connects to the Oracle back-end database First 184 differentially expressed proteins
were imported (with replacement) into linked Oracle table from the application
interface (see Figure 36 ) after correct login information was verified then the
application automatically create the sub-network data by querying the linked Oracle
SBG interactome dataset We calculated ranking scores for the significant proteins in
the sub-network using the heuristic relevance scoring formula[81]
1
2 ( ) ( )i
i
k
i ij
j
R LOG S LOG k
Where Ri is the ith seed protein ranking score Ki denotes its connectivity and Sij
denotes its interaction reliability score with the jth partner
Figure 36 Application for the yeast subnet construction
39
Our ranking analysis was built on the hypothesis the significance of a protein‟s
contribution in the network depends on its ability to connect to other proteins in the
network and the reliability of the detected interactions The higher the connectivity
and reliability the higher the ranking score should be
40
4 RESULTS
Case Study 1 Ovarian Cancer Drug Resistance Case Study
This part was written based on the published result[2] where I am one of the
primary contributing members The use of the material was granted with the
permission from participating contributors
41 Activated Protein Interaction Sub-Network Properties
The network topology for the protein interaction sub-network expanded from seed
proteins was examined The resulting protein interaction sub-network (core sub-
network) consists of 1230 seed and non-seed proteins in 1723 sub-network
interactions (including 17 S-S type interactions and 1706 S-N type protein
interactions) The node degree frequency distributions were plotted in Figure 41
where the whole human protein interaction network from OPHID (labeled ldquonetworkrdquo)
is also shown As expected both the network and the sub-network (full) display good
ldquoscale-freerdquo property These results also show that the cisplatin resistant activated sub-
network (full) contains more ldquohubsrdquo than ldquoperipheralrdquo proteins to form a cohesive
functional sub-network The core sub-network while perhaps limited in size shows
ldquoscale-free likerdquo distribution although hubs in the sub-network (core) are more
distinctively identifiable than overly abundant peripheral nodes by high node degree
counts
Other network features for the core sub-network are also examined The largest
connected component (defined in the Method section ibid) of the sub-network
consists of 1193 proteins The index of aggregation is 11931230=970 The index of
expansion as the percentage of S-S type interactions (17) over the core sub-network
interactions (1723) ie 171723=096 The index of aggregation has a p-value of
less than 0001 (upper tail) and the index of expansion is 006 (upper tail) A significant
and high network index of aggregation suggests that the core sub-network has
connectivity structures that are not random by nature This correlates well with the
41
node degree distribution in Figure 41 where an exceptionally large number of hubs
are shown to exist
1
10
100
1000
10000
1 10 100 1000
node degree in sub-network
co
un
t
Sub-Network (core)
Subnetwork (Full)
Network
Figure 41 Node degree distribution of the sub-networks (core or full) in
comparison with the human protein interaction network
42
42 Analysis of Activated Protein Functional Category Distributions
Although GO-based functional category analysis can be done routinely using many
existing bioinformatics methods [3] the inclusion of protein interaction network
context has not been previously described In this analysis we are more interested in
enriched protein categories in the cisplatin-response functional process This includes
both up-regulated and down-regulated proteins Therefore we transformed protein-
protein interaction sub-network to GO cross-talk sub-network Enriched protein
functional categories were discovered among differentially expressed seed proteins
and its immediate protein interaction sub-network nearest interaction partners
Table 41 shows significantly enriched GO categories in the sub-network 17 GO
categories were filtered from 70 GO categories (data not shown) The filter criteria are
1) the P-value over- or under- representation must be within 005 and 2) the total
category count of GO in the whole network is greater than 10 In GO_TERM column
we have listed three types of information level 3 GO terms GO term category type
(bdquoC‟ for cellular component bdquoF‟ for molecular function and bdquoP‟ for biological process
in parenthesis preceding the dash) and GO identifier (seven digit number following
the dash in parenthesis) In the ENRICHMENT column we listed two types of
counts of proteins with GO annotation levels falling in the corresponding category
within core sub-network and whole network (in parenthesis) In the PVALUE column
we have listed two numbers the p-value from the significance test of whether there is
an over- or an under- representation (two numbers separated by a bdquo‟) of an observed
GO term category count in the sub-network In the last CONCLUSION column bdquo++‟
suggests significant over-representation when the false discovery rate (FDR) is
controlled at 005 bdquo--‟ suggests significant under-representation when FDR controlled
at 005 bdquo+‟ to suggest insignificant over-representation when FDR controlled at 005
but significant overrepresentation at native p-value=005 bdquo-‟ to suggest insignificant
over-representation when FDR controlled at 005 but significant overrepresentation at
native p-value=005
43
Table 41 Enriched GO categories in the sub-network Context An asterisk
indicates adjustment may be needed for further interpretation
We also tested how robust the network is by introducing noise in protein
interaction data sets Two experiments were performed (for a description of the
methods see section 311) ldquoadd20rdquo in which we added 20 new randomly-selected
GO_TERM ENRICHMENT
PVALULE
(OVERUNDER) CONCLUSION
membrane (C-0016020) 7 (2034) 10 --
proton-transporting two-sector
ATPase complex (C-0016469) 2 (12) 0091 +
non-membrane-bound
organelle (C-0043228) 19 (834) 0059980 +
organelle lumen (C-0043233) 2 (13) 01019996 +
proton-transporting ATP
synthase complex (C-0045259) 2 (17) 01719990 +
proton-transporting ATP
synthase complex catalytic
core (C-0045261) 1 (1) 00121 +
proton-transporting ATP
synthase catalytic core
(C-0045267) 1 (1) 00121 +
protein binding (F-0005515) 26 (1387) 0129937 +
drug binding (F-0008144) 2 (12) 00091 +
isomerase activity (F-0016853) 7 (69) 01 ++
nucleotide binding (F-0000166) 23 (1205) 01489923 +
receptor activity (F-0004872) 2 (642) 99680149 -
receptor binding (F-0005102) 1 (422) 99440354 -
oxidoreductase activity
(F-0016491) 12 (271) 01 ++
Kinase
regulator activity (F-0019207) 3 (50) 002209970 +
metabolism (P-0008152) 67 (4634) 002009875 +
response to biotic stimulus
(P-0009607) 1 (711) 100014 -
regulation of physiological
process (P-0050791) 17 (2129) 98170328 -
regulation of cellular process
(P-0050794) 15 (2182) 99680066 -
44
connections between OPHID proteins to create a new OPHID proteins data set PiD-
a20 and ldquoremove20rdquo in which we removed 20 existing randomly-selected
connections between OPHID proteins to create a new OPHID proteins data set PiD-
r20 Surprisingly although the individual category counts fluctuate all conclusions
made through the above-described threshold values of p-value and FDR remain the
same (this conclusion also remains true for high-level GO-GO category enrichment
experiments in next section results not shown) This suggests the significance of our
discovery is robust against reasonable noise inherent in the protein interaction
databases
After the above analysis we then re-examined all ldquounder-represented categoriesrdquo
under a new false-negative controlled experiment to see if these under-representations
have been ldquoexaggeratedrdquo due to bias of the MS experimental methods Therefore we
set up an experiment to observe the inherent bias (either over- or under- representation)
in all detectable MS proteins overlapped with OPHID data sets (also described in
section 316)
Table 42 Re-examination of under-represented seed protein functional
categories
GO_TERM
P-VALUE OVER-
REPRESENTED
(seedbackground)
P-VALUE
UNDER-
REPRESENTED
(seedbackground)
CONCLU-
SION
Membrane (C-0016020) 10000 (00000) 00001 (10000) --
receptor activity (F-0004872) 99681 (00002) 01489 (99998) --
receptor binding (F-0005102) 99439 (99937) 03550 (00092)
response to biotic stimulus
(P-0009607) 99986 (10000) 00144 (00000)
regulation of physiological
process
(P-0050791) 98169 (00000) 03276 (10000) --
regulation of cellular process
(P-0050794) 99685 (00000) 00664 (10000) --
45
Table 42 lists the results Here seed experiment refers to the earlier experiment
which we examined the enrichment (in this case all under-representations) of 119
seed proteins background experiment refers to the re-examination experiment which
we examined the enrichment bias of 3690 MS detectable proteins also found in
OPHID data set When we observe significant over-representation of certain GO
functional categories in the background we make the conclusion that the category is
indeed under-represented in the seed (marked as ldquo--ldquo)When we observe significant
under-representation of certain GO functional categories in the background we make
the conclusion that the category is not necessarily under-represented (or likely over-
represented) in the seed (marked as ldquoldquo for inclusive)
From the above comprehensive analysis we can obtain the following biological
insights First proton-transporting ATP synthase activity is related to the cell cisplatin
resistance function (see table 5 for the enriched GO categories) which may imply
higher oxidative energy production capability among cancerous functions in cisplatin
resistant cell lines over cisplatin sensitive cell lines This is consistent with the existing
findings mitochondria -- ldquoATP factoryrdquo was considered to be a major target of
cisplatin leading to mitochondrial loss of energy production[82] Second although the
protein interaction network in general is inherently enriched with proteins with
ldquoprotein bindingrdquo capabilities (note 1412 proteins in the category from the whole
network) the cisplatin-resistant cell line demonstrated an unusually high level of
protein-binding activities in addition a broad spectrum of across-the-board drug-
binding and nucleotide-binding mechanisms are all activated to fight again cisplatin-
induced DNA damage in cancer cells This suggests that many intracellular signaling
cascades are intensely mobilized with cisplatin-resistance Third the data suggest that
the location of the biological activities of cisplatin resistant response take place in
cytoplasm or nucleus rather than on ldquomembranerdquo This correlates well with the
previous hypothesis that transporters that are responsible for assisting with cisplatin
import into the cell seem to become blocked in drug-resistant cells This analysis gives
essential clues to the overall picture of molecular signaling events for cisplatin
46
GOT2
cell communication
cellular physiological process
localization
locomotory behavior
metabolism
organ development
organismal physiological process
regulation of cellular process
regulation of development
regulation of physiological process
regulation of viral life cycle
response to abiotic stimulus
response to biotic stimulus
response to endogenous stimulus
response to external stimulus
response to stress
resistant cell lines We also obtained categorical enrichment data at lower GO levels
than are shown in this section using the drill-down method (for method refer to
section 317 results not shown) to obtain detailed views of biological process
molecular function and cellular components
43 Functional Category Cross-Talks
We developed a two-dimensional visualization matrix (extended from our
technique described in [83]) to show significant cross-talk between GO categories in
Figure 42 (only biological processes at level=3 are shown due to space constraints)
Figure 42 Significantly over-represented GO-GO interaction categories in seeded
subnetwork (only biological processes at level=3 are shown due to space constraints)
47
Table 43 Drill down of significant GO-GO functional category cross-talk
ldquoCellular Physiological Processrdquo vs ldquoCellular Physiological Processrdquo at GO term level
4 Note only p-value lt005 for over-representation are shown (FDRlt005 cases are
also in bold)
GO TERM 1 GO TERM 2 ENRICHMENT
P-
VALUE
cell homeostasis (P-
0019725) transport (P-0006810) 18 (120) 0
transport (P-0006810) transport (P-0006810) 75 (1377) 00006
regulation of cellular
physiological process (P-
0051244) transport (P-0006810) 130 (2045) 0
cell cycle (P-0007049) transport (P-0006810) 68 (708) 0
cell death (P-0008219) transport (P-0006810) 45 (694) 00002
cell proliferation (P-
0008283) transport (P-0006810) 22 (238) 00001
cellular metabolism (P-
0044237) transport (P-0006810) 359 (6041) 0
cellular metabolism (P-
0044237) cell cycle (P-0007049) 253 (4439) 0
cellular metabolism (P-
0044237)
cell proliferation (P-
0008283) 85 (1412) 0
cell homeostasis (P-
0019725)
cell organization and
biogenesis
(P-0016043) 11 (73) 00001
cellular metabolism (P-
0044237)
cell homeostasis (P-
0019725) 25 (279) 0
cellular metabolism (P-
0044237)
cellular metabolism (P-
0044237) 764 (17604) 0
cell homeostasis (P-
0019725) cell cycle (P-0007049) 5 (43) 00207
regulation of cellular
physiological process (P-
0051244) cell cycle (P-0007049) 130 (2655) 00007
cell cycle (P-0007049) cell cycle (P-0007049) 39 (702) 00084
cell organization and
biogenesis
(P-0016043) cell cycle (P-0007049) 53 (936) 00017
cell homeostasis (P-
0019725)
chromosome
segregation
(P-0007059) 1 (1) 0037
regulation of cellular
physiological process (P-
0051244)
cell homeostasis (P-
0019725) 13 (149) 00037
48
The size of each node is inversely proportional to the p-value of interacting categories
The color legends are red (dark) for interacting categories that are significant when
FDR controlled at 005 and gray (light) for interacting categories that are not
significant when FDR controlled at 005 The figure 42 reveals additional interesting
findings First cellular physiological processes are significantly activated in drug-
resistant cell lines (the largest and reddest dot at the bottom left corner) This could
lead to further drill-down of protein interaction in the interacting category for
biological validations (see Table 43 for an example) Second these cellular
physiological processes seem to be quite selective rather than comprehensive For
example when looking at significant regulation of cellular response categories
significant cross-talk functional patterns strongly suggest the cellular and
physiological responses arise from endogenous abiotic and stress-related signals
(internalized cisplatin causing DNA damage and inducing cell stress) Using a cross-
talk matrix such as this cancer biologists can quickly filter out other insignificant
secondary responses (such as cell growth cell development shown) to establish a new
prioritized hypothesis to test
44 Visualization of the Activated Interaction Functional Sub-Network
In Figure 43 we show a visualization of the activated biological process functional
network using a recently developed software tool ldquoProteoLensrdquo[79] ProteoLens is a
biological network data mining and annotation platform which supports standard
GML files and relational data in the Oracle Database Management System (for
additional details visit httpbioinformaticsiupuieduproteolens) In the figure 43
in contrast with regular protein interaction network we encode nodes as significantly
over-under- represented protein functional categories and edges as significantly
interacting protein functional categories Several additional information types are also
represented The original abundance (by count) of each functional category is encoded
in the node size The p-values of activated protein category significance in the sub-
network is encode as node color intensity on a scale from light yellow (less significant)
to dark red (more significant)
49
Figure 43 Activated biological process network in cisplatin-resistant ovarian
cancer cells Red-colored lines stand for ldquosignificantrdquo while blue-colored lines stand
for ldquonot significantrdquo (FDR=005)
50
From this figure 43 we can see that cisplatin-resistant ovarian cancer cells
demonstrated significant cellular physiological changes which are related to cancer
cell‟s native response to stimulus that is endogenous abiotic and stress-related
Interestingly we also observed that the regulation of viral life cycle also plays very
significant roles in the entire drug resistant process This previously unknown
observation may be further examined at protein levels to formulate hypothesis about
acquired cisplatin resistance in ovarian cancer
51
Case Study 2 Yeast Grr1 Knock-Out Case Study
Case study 2 is the collaborative work among the biology group (Dr Goebl and
Josh) biostatistics group (Dr Shen) and Informatics group (Dr Chen and I) The
manuscript is in preparation
45 Activated Protein Interaction Sub-Network Properties
Figure 44 Node degree distribution of the sub-networks (core or full) in
comparison with the yeast protein interaction network
52
The resulting protein interaction sub-network consists of 1251 seed and non-seed
proteins in 1698 sub-network interactions (including 54 S-S type interactions and
1644 S-N type protein interactions) This protein interaction sub-network is called a
ldquocore sub-networkrdquo The ldquofull sub-networkrdquo includes all N-N type protein interactions
in addition to the S-S type and S-N type interactions We plot their node degree
frequency distributions in Figure 44 where the whole yeast protein interaction
network from SBG (labeled ldquonetworkrdquo) is also shown As expected both the network
and the sub-network (full) display good ldquoscale-freerdquo property (some nodes act as
highly connected hubs although most nodes are of low degree) The core sub-
network while perhaps limited in size begins to show ldquoscale-free likerdquo distribution
although hubs in the sub-network (core) are more distinctively identifiable than overly
abundant peripheral nodes by high node degree counts
We also examined other network features for the core sub-network The largest
connected component of the sub-network consists of 1163 proteins with 1637
interactions The index of aggregation is 11631251=930 The index of expansion
as the percentage of S-S type interactions (54) over the core sub-network interactions
(1698) is 541698=318 The high network index of aggregation here suggests that
the core sub-network has high connectivity
46 Analysis of Activated Protein Functional Category Distributions
We first analyzed significantly enriched GO categories among 184 seed proteins
We limited our analysis to level 3 GO categories as previously described Our result
revealed 11 significantly enriched GO biological process functional categories and
cellular components in response to Grr1 perturbation After filtering out the general
GO categories that have more than 200 ORFs from the whole yeast PPI have been
annotated to only 3 significantly enriched GO categories are left (see table 44) The
table column header definition is the same as previously defined in the human case
study
53
Table 44 Overunder ndash represented GO categories among the seed proteins
GO_TERM ENRICHMENT
(OVERUNDER
)
CONCLUSIO
N
eukaryotic 43S preinitiation
complex (C-0016282) 5 (55) 004270988 +
lipid transporter activity (F-
0005319) 2 (8) 0029909979 +
oxidoreductase activity (F-
0016491) 16 (184) 0000709998 +
The analysis result from the above apparently provides limited information Thus a
simple ontology-based annotation for global proteomics data offers no significant
further understanding of Grr1 function This is partially due to the fact that the current
proteomics techniques are not sensitive enough to capture the whole proteome
especially those proteins with low-abundance eg Grr1 However we expect to find
many abundant proteins whose expression levels are directly or indirectly regulated by
Grr1 These proteins may look disparate or isolated in their GO-annotation but may
interact with other proteins and impact the cellular components or functions
We expanded our protein list by mapping our differentially expressed proteins onto
protein interaction networks and including the immediate partners in our analysis The
expanded sub-network included 1251 proteins (184 seeds and 1067 immediate
partners) We then mapped these proteins into GO categories and re-analyzed the
enriched GO categories using statistical methods previously described We discovered
53 enriched GO categories including both over- and under-represented GO categories
We applied the same filtering criteria to the 53 GO categories to remove generalized
GO categories that contain 200 or more annotations and obtained 40 enriched GO
categories with 15 terms categorized as component terms 15 categorized as process
terms and 10 categorized as function terms (see table 10) The table column header
definition is the same as previously defined in the human case study Therefore the
application of the GO analysis to the sub-network leads to the extraction of more GO
terms overall and more specific GO terms
54
Table 45 Overunder ndash represented GO categories among the subnet proteins
GO_TERM
ENRICH-
MENT (OVERUNDER)
CONCLU
-SION
transcription export complex (C-0000346) 4 (4) 000321 +
proteasome complex (sensu Eukaryota) (C-
0000502) 25 (37) 01 ++
transcription factor complex (C-0005667) 43 (106) 000011 ++
mitochondrial inner membrane presequence
translocase complex (C-0005744) 3 (4) 0044609968 +
proteasome regulatory particle (sensu
Eukaryota) (C-0005838) 8 (9) 000011 ++
microtubule associated complex (C-0005875) 14 (29) 000350999 +
bud (C-0005933) 48 (107) 01 ++
eukaryotic 43S preinitiation complex (C-
0016282) 19 (55) 004790975 +
chromatin remodeling complex (C-0016585) 30 (71) 0000409998 ++
DNA-directed RNA polymerase II
holoenzyme (C-0016591) 32 (66) 01 ++
external encapsulating structure (C-0030312) 14 (102) 0996400077 -
site of polarized growth (C-0030427) 50 (109) 01 ++
replisome (C-0030894) 12 (27) 001490995 +
cell projection (C-0042995) 19 (36) 000021 ++
pyruvate dehydrogenase complex (C-
0045254) 3 (4) 0044609968 +
RNA polymerase II transcription factor
activity (F-0003702) 42 (93) 01 ++
receptor signaling protein activity (F-
0005057) 8 (13) 0004109993 +
amine transporter activity (F-0005275) 1 (33) 0999900014 -
organic acid transporter activity (F-0005342) 2 (39) 099970002 -
carrier activity (F-0005386) 24 (158) 0997600046 -
enzyme activator activity (F-0008047) 20 (56) 0030409848 +
lipid binding (F-0008289) 11 (15) 000011 ++
protein transporter activity (F-0008565) 11 (25) 0021109928 +
carbohydrate transporter activity (F-0015144) 3 (31) 098820041 -
GTPase regulator activity (F-0030695) 26 (63) 0001609994 ++
aging (P-0007568) 15 (29) 000109997 ++
55
morphogenesis (P-0009653) 46 (103) 01 ++
response to endogenous stimulus (P-0009719) 64 (172) 01 ++
cell growth (P-0016049) 3 (4) 0044609968 +
death (P-0016265) 15 (39) 0029509871 +
sexual reproduction (P-0019953) 41 (93) 01 ++
asexual reproduction (P-0019954) 39 (75) 01 ++
cell differentiation (P-0030154) 39 (100) 0000509998 ++
Filamentous growth (P-0030447) 23 (54) 0001809993 ++
regulation of growth (P-0040008) 3 (3) 001361 +
regulation of gene expression epigenetic (P-
0040029) 25 (76) 0045909737 +
negative regulation of biological process (P-
0048519) 53 (155) 0002109988 ++
non-developmental growth (P-0048590) 14 (28) 0002309994 ++
regulation of enzyme activity (P-0050790) 13 (25) 0002109995 ++
reproductive physiological process (P-
0050876) 27 (65) 0001209995 ++
To assess the validity of our analysis we first determined whether the expanded
GO annotation was supported by known Grr1 functions from previous publications
Grr1 affects many different cellular processes in Saccharomyces cerevisiae through
its role as a receptor for the SCF ubiquitin ligase[84-86] In conjugation with this
multimeric protein complex Grr1 serves to target protein substrates for ubiquitylation
an event that ultimately results in the substrates degradation by the 26S proteasome
Currently there are ten proteins that are thought to be ubiquitylated by the SCFGrr1
ubiquitin ligase each of these proteins playing distinct roles in multiple cellular
processes[86] The cells lacking Grr1 exhibit multiple abnormalities including cell
elongation slow growth on glucose increased sensitivity to osmotic stress and
nitrogen starvation decreased divalent cation transport enhanced filamentous growth
defects in sporulation and slow growth or invariability when combined with amino
acid biosynthesis mutants[84 87-90] We expect our ontology-driven network enabled
approach would capture some of the GO functions through extracting the enriched GO
terms directly associated with Grr1 or with the targets of Grr1
56
Intriguingly among the 40 enriched GO categories 14 GO categories are directly
ascribed to Grr1 or at least one of its targets 10 categories over-represented and 4
under-represented In figure 45 the 10 over-represented GO categories that are
directly related to Grr1 or related to targets of Grr1 are shown The Grr1 protein is
known to participate in regulating bud emergence and growth through its role in
targeting the Cdc42 effectors Gic1 and Gic2 as well as the cyclins Cln1 and Cln2 for
degradation by the 26S proteasome [85 90-93] The GO categories ldquopolarized
growthrdquo ldquobudrdquo ldquomorphogenesisrdquo ldquoasexual reproductionrdquo and ldquocell projectionrdquo are
all involved in the elongated bud morphological phenotype of Grr1 knock-out cells
The elongated bud morphology resembles invasive growth for Grr1 knock-out yeast
Therefore based on the existing evidence from previous publications the ontology-
driven network-enabled analysis approach proves to be not only valid but also have
the potential to drive the generation of the novel hypothesis for future investigations
57
Figure 45 Enriched GO categories (partial listing) and yeast bud morphological
phenotype This figure was modified based on Josh‟s original figure
47 Functional Category Cross-Talks
Figure 46 Visualization of significantly over-represented GO cross ndash talk sub-
networks related to Grr1 induced morphological change The partial sub-networks
were constructed by seeding the significantly enriched GO cross-talk sub-network by
ldquobudrdquo ldquocell projectionrdquo ldquosite of polarized growthrdquo ldquoasexual reproductionrdquo and
ldquomorphogenesis The top one is for biological process and the bottom one is for
58
cellular component The numbers and the thickness both denote the enrichment of the
GO cross-talk pairs in the protein-protein interaction sub-network The larger the
number or the thicker the line the more enriched the GO pair is
To investigate how these Grr1-deletion enriched GO categories are functionally
associated with each other we subsequently performed functional category cross-talk
analysis (for detailed method see method section 37) and identified 287 significant
overunder-represented GO-GO cross-talks (see appendix 4)
In particular the significantly enriched GO categories discovered previously ie
ldquobudrdquo ldquocell projectionrdquo ldquosite of polarized growthrdquo ldquoasexual reproductionrdquo and
ldquomorphogenesis are also involved in the significantly enriched GO-GO cross-talk
pairs These cross-talk GO categories are functionally related to the yeast bud
morphological phenotype change induced by Grr1 knock-out perturbation
Importantly some of the GO-GO pairs are highly connected and form the GO-GO
interaction subnet for Grr1 (Figure 46) implying that Grr1 perturbation may affect
some specific biological processes or cellular components through a small core group
of proteins Further more we also observe that microtube associated complex is highly
connected to other GO categories in the GO cross-talk sub-network that are related to
Grr1 induced morphological change This intrigues us since there is no previously
known role for Grr1 in microtubule related processes
Drill-down analysis of the group of proteins involved in the GO cross-talk sub-
network might help biologists discover the proteins that significantly contribute to the
Grr1 perturbed morphological phenotype change
48 Scoring of Significant Proteins in the Sub-Network
We further performed significant proteins ranking analysis with the hope of
isolating important proteins that contribute to Grr1s possible new function that we
discovered earlier by our ontology-driven network-enabled approach
59
Based on the connectivity and the confidence of the protein-protein interactions we
ranked significant seed proteins (for detail of the method see section 310) Table 46
shows the top-ranked 20 proteins among 184 seed proteins
Table 46 Ranking analysis of the significant proteins Only 20 top-ranked proteins
were listed here due to the space
Rank Score ORF Gene Symbol Fold Change (Grr1 vs wt)
1 41826 YGL167C PMR1 0250
2 39453 YPR141C KAR3 5970
3 38658 YNL298W CLA4 0202
4 30236 YPL174C NIP100 0111
5 28646 YOR261C RPN8 033
6 28301 YNL233W BNI4 531
7 2784 YML008C ERG6 0129
8 27606 YDR155C CPR1 0524
9 26697 YNL244C SUI1 4224
10 26495 YKL173W SNU114 0409
11 26329 YKR054C DYN1 39224
12 26311 YMR309C NIP1 13115
13 26219 YJL148W RPA34 0129
14 25001 YGL055W OLE1 6486
15 23706 YBL047C EDE1 0343
16 23508 YBR152W SPP381 4658
17 2328 YDL006W PTC1 0229
18 23236 YGL112C TAF6 04029
19 23079 YLR087C CSF1 64511
20 22101 YOR290C SNF2 01812
Later we isolated the actual proteins from the top ranked protein list that mapped
to the GO component term microtubule associated complex The analysis revealed that
two of the most highly connected proteins Nip100 and Dyn1 Both proteins also
represented most extensively changed proteins in the network Dyn1 protein levels
were observed to increase in the Grr1 mutant ~ 40 fold while Nip100 protein levels
were observed to decrease ~10 fold in the analysis Nip100 is part of the dynactin
complex[94] where it is thought to act as a tether for Dynein encoded by Dyn1 Thus
we probed the relationship between Grr1 and Nip100 Figure 47 shows protein
interaction sub-network seeded by Grr1 Dyn1 and Nip100 where Grr1 connects to
60
Nip100 through Bzz1 and Tub3 Grr1 connects to Dyn1 through Cdc12 and Pac10
We hypothesized that Grr1‟s influence on the GO component microtubule associated
complex could be possibly through one or more of these bridge proteins such as Bzz1
The biological experiments are being conducted by our biology group to validate this
hypothesis
Figure 47 Protein interaction sub-network seeded by Grr1 Dyn1 and Nip100
Node colors Red = protein level gt 2 fold Bright blue = -2gt= protein level lt=2 Grey
= no detection Green = protein level lt-2 Line colors Red = Synthetic Lethality Pink
= Synthetic Growth Defect Light Blue = Two Hybrid or Affinity Capture MS Dark
Blue = Reconstituted Complex or Affinity Capture Western Green = Synthetic
Rescue Purple = Dosage Rescue Orange = Phenotypic Suppression Yellow =
Phenotypic Enhancement This figure was provided by Josh Heyen
61
Through ranking analysis we also further validated our ontology-driven network-
enabled approach Kar3 a kinesin-like nuclear fusion protein is ranked at the second
place in the table It belongs to gene ontology categories ldquosexual reproductionrdquo (level
3 biological process) and ldquointracellularrdquo (level 3 cellular component) The third top-
ranked protein Cla4 a protein kinase can be mapped to GO categories ldquoasexual
reproductionrdquo at level 4 biological process and ldquobudding cell apical bud growthrdquo
ldquocell communicationrdquo ldquometabolismrdquo and ldquomorphogenesisrdquo at level 3 biological
process All of the GO categories mapped by these proteins have been shown to be
important in Grr1 perturbation induced morphological changes through our ontology-
driven and network-enabled approach based analysis
62
5 CONCLUSIONS
In the current study we developed a systems biology approach to analyze the
proteomics data We applied this novel approach to two case studies human ovarian
cancer drug resistance study and yeast Grr1 knock-out study
The identified differentially expressed proteins formed basic dataset ndash seed proteins
of our case studies We used the seed proteins to construct our protein-protein sub-
network Then we analyzed the core protein-protein interaction sub-network feature
Both human ovarian cancer drug resistance related and yeast Grr1 knock-out sub-
networks showed high connectivity feature After we mapped the proteins and protein-
protein interactions to GO annotations and constructed GOndashGO cross-talk sub-
networks we performed statistical testing to find significantly enriched over under-
represented GO categories and GO-GO cross-talk categories The visualization tools
ldquoSpotfirerdquo and ldquoProteolenserdquo were used to aid in the analysis
Our approach has been validated in the two case studies by comparing our
discoveries with existing findings Some new insights were obtained
In the first case study we observed that cellular physiological process is
significantly activated in drug-resistant cell lines and this response arises from
endogenous abiotic and stress-related signals Our studies also showed that cisplatin
resistant cell line demonstrated unusually high level of protein-binding activities and
a broad spectrum of cross-the-board drug-binding and nucleotide-binding mechanisms
are all activated
In the second case study we observed that a subset of significantly over-
represented enriched GO categories is highly connected in the GO sub-network which
implies that Grr1 induced morphological phenotype change might be resulted from a
small core group of proteins We hypothesized Grr1s new role in microtubule related
processes based on the high connectivity of microtubule associated complex with
63
other GO categories for Grr1s known functions We further performed ranking
analysis of the significant seed proteins based on their connectivities and reliabilities
of the interactions in the sub-network The ranking analysis further validated our
findings revealed by the ontology-driven network-enabled approach These biological
discoveries support the significance of developing a common framework of evaluating
functional genomics and proteomics data using networks and systems approaches
64
6 DISCUSSIONS
Molecular biology focuses the mechanistic study of biological phenomena One of
its strengths is to concentrate on the actions of a small number of genes without being
distracted by the complex biological milieu in which they are found However in
terms of a series of binary interactions or when pathways become complex and many
genes work together using molecular biology to model function shows its weakness
In this case more network-level understanding is required In this study we showed
that the key to interpreting omics data is a systems biology approach which is both
hypothesis-driven and data-driven with the ultimate goal of integrating multi-
dimensional biological signals at molecular signaling network levels It is important
to note that systems biology approach and the traditional molecular biology approach
should complement each other in order to achieve a deep understanding of the
molecular mechanisms The systems biology approach is not a replacement of the
traditional approach
In the present study we described a novel systems biology approach to integrate
omics data with both GO annotation and protein interaction networks and its
application in two proteomic case studies The whole proteome of two cellular
conditions of yeast or human cells were interrogated using LC-MSMS A
differentially expressed protein lists were obtained by statistical analyses controlling
false discovery rate We obtained 114 and 184 significantly over- or under-expressed
proteins for our two case studies respectively The mass spectrometer-based
proteomics analysis is one of the major techniques recently developed to examine
thousands of proteins simultaneously Since it directly analyzes the protein level and
protein modifications the mass spectrometer- based proteomics provides more direct
explanations for cellular processes involving multiple protein components However
the current proteomics analysis was unable to detect and quantify an entire proteome
and has low sensitivity to the low-abundant proteins such as Grr1 which may play
critical roles in many important biological processes
65
The large volume of differentially expressed proteins derived from the proteomics
and microarray studies provide us the opportunity for investigating the biological
function at the systems level However the protein lists themselves offers very limited
clues to our understanding of the biological processes that underlie cisplatin resistance
of human ovarian cancer cells or abnormal phenotype that is associated with Grr1
deletion Most of the identified significant differentially regulated proteins are not
obviously related to the known function of Grr1 or drug resistance As our first
attempt to understand the function of our protein list we performed ontology-based
analysis which is now widely used in data mining of functional genomic data as well
as proteomics data Gene ontology annotation is an important milestone on
possibilities to handle and link biological knowledge with gene profiles identified in
functional genomics and proteomics analysis
Nevertheless mapping differentially expressed protein list onto ontology provided
only limited information to our understanding of the biological processes associated
with cellular conditions For example our GO annotation analysis of Grr1-deletion
affected protein list leads to identification of three enriched GO terms after applying
certain filter eukaryotic 43S preinitiation complex lipid transporter activity
oxidoreductase activity none seems to be clearly associated with known function of
Grr1 Thus although GO-based analysis proved to be useful in interpretation of the
gene profiling experiments using microarray[95 96] this technique on its own provide
only limited information for our understanding of biological function at the systems
level
Another important approach for interpretation of omics data is network-based
analysis Since most biological characteristics arise from complex interactions
between the cellular constitutes such as proteins mapping changed proteins identified
onto protein network will place these proteins in a broader biological context thereby
facilitating the understanding of the structure and function of living cells In our yeast
case study we mapped our 184 proteins into protein interaction database and ranked
the importance of these proteins according to the number of their immediate
66
connectivity and the reliability score calculated using a formula We hypothesized that
the most highly connected proteins in the sub-network may represent proteins that
may be mostly directly affected by Grr1 gene deletion Intriguingly two of the 20 top-
ranked proteins Nip100 and Dyn1 are genetically and physically connected with each
other (Figure 47) The physical association of Grr1 with Nip100 is through Bzz1
which appears in our extended protein ranking list As Nip100 and Dyn1 are a part of
the microtubule components Grr1 may exert its function though its influence on its
immediate target Bzz1 This hypothesis warrants a detailed study in the future
One of the distinct features of our systems biology approach is to bring the gene
ontology category concept into the context of protein-protein interaction network and
use it for omics data analysis We hypothesized that the limited number of changed
proteins identified through proteomics may actually be connected within Grr1 sub-
network These changed proteins may exert their function by influencing the protein
networks that they are involved in We thus expand our interest of proteins to include
those proteins that directly interact with our changed proteins To understand the
biological function of these expanded protein list we then mapped the protein list onto
gene ontology terms and identified significantly enriched GO terms Through this
approach we found about 40 significantly enriched GO terms by applying a certain
filter Strikingly 10 of the enriched GO-terms could be ascribed to Grr1 or its target
proteins (Figure 45) according to previous publications Thus our ontology-driven
and protein network-enabled approach can not only be used to validate existing
knowledge but also have the potential to generate the hypothesis for future
investigation
In our approach we also explored GO-GO cross-talks and identified Grr1-deletion
associated GO-GO cross talks This information further extends our understanding of
the connection of multiple processes induced by gene deletion or other stress
conditions We also demonstrated that functional 2-dimensional matrix and protein
interaction network visualization tool may significantly facilitate the biologists to form
their hypotheses
67
Our systems biology approach provides a framework for further improvement in
the future First our analysis is currently based on proteomics data only The method
described here is readily applicable to microarray data analysis We expect to gain
more in-depth understanding of the Grr1 function by incorporation of published Grr1
microarray data into our analysis Because the relationship between transcription and
translation is likely to vary based on the individual geneprotein it may not be realistic
to expect a high degree of correlation between protein and RNA levels when
attempting to correlate dynamic change in RNA with a static picture of proteins
Combination of genomics and proteomics data requires further development of current
approach Second our network-based analysis focuses on the functional significance
of changed proteins through protein-protein interaction analysis We made no attempt
to understand how the changed proteins are regulated by genetic or environmental
stress One of the future directions is to incorporate gene regulatory network analysis
in order to identify regulatory relationships among large numbers of genes that form a
network representation of the underlying regulatory processes Finally our current
model needs fine adjustment to provide elegant interpretation of omics data For
example the validity of ranking model needs further investigation Drill-down of GO
categories analysis may provide further details for interpretation of biological
consequences induced by genetic or environmental stresses
In summary our ontology-driven network-enabled systems biology approach
provides in-depth understanding of cellular functions and creates a robust concept
framework for further improvement in the future
68
7 Appendices
Appendix 1 ERD diagram for Oracle schema Sysbio For details see [21]
69
Appendix 2 Uniprot ID mappings for 119 differentially expressed seed proteins
in ovarian cancer drug resistance study
UNIPROTID
ANKS1_HUMAN
1433T_HUMAN
1433Z_HUMAN
1433E_HUMAN
1433F_HUMAN
ACTN1_HUMAN
AL3A1_HUMAN
AL3A1_HUMAN
AKAP9_HUMAN
AL1A1_HUMAN
CBX3_HUMAN
DEST_HUMAN
CENPE_HUMAN
CNN2_HUMAN
CRIP2_HUMAN
CRTC_HUMAN
E41L1_HUMAN
FKBP4_HUMAN
6PGD_HUMAN
ABCG1_HUM AN
ACADM_HUMAN
DOCK4_HUMAN
ANXA3_HUMAN
B2MG_HUMAN
DHCA_HUMAN
CAP1_HUMAN
ATPA_HUMAN
ATPB_HUMAN
CU059_HUMAN
CYBP_HUMAN
FA49B_HUMAN
MDHC_HUMAN
KCRU_HUMAN
LPPRC_HUMAN
GALT3_HUMAN
HS70L_HUMAN
HSP76_HUMAN
GANAB_HUMAN
IF4H_HUMAN
HSBP1_HUMAN
70
HS90B_HUMAN
KAP0_HUMAN
ETFA_HUMAN
PHS3_HUMAN
PP2CG_HUMAN
PPIA_HUMAN
PGK1_HUMAN
PPIB_HUMAN
PDIA1_HUMAN
PDIA6_HUMAN
PARP3_HUMAN
PADI3_HUMAN
RS14_HUMAN
SERA_HUMAN
SODC_HUMAN
SFRS2_HUMAN
SFRS3_HUMAN
INSI1_HUMAN
MYLK_HUMAN
PSB3_HUMAN
PUR6_HUMAN
MYH13_HUMAN
MYL6_HUMAN
MYL6_HUMAN
MYL6_HUMAN
NDK8_HUMAN
PDCD6_HUMAN
O2T35_HUMAN
NDKB_HUMAN
PCNA_HUMAN
PLSI_HUMAN
RL15_HUMAN
TYSY_HUMAN
VINC_HUMAN
UGDH_HUMAN
S10A1_HUMAN
ST1A2_HUMAN
TBA1_HUMAN
TBA3_HUMAN
TCP4_HUMAN
THIL_HUMAN
THIO_HUMAN
SMCA5_HUMAN
71
TPIS_HUMAN
TBA8_HUMAN
TBAK_HUMAN
STMN1_HUMAN
RPA5_HUMAN
Q12803_HUMAN
O75935_HUMAN
O60486_HUMAN
O14950_HUMAN
Q6IQ55_HUMAN
Q6MZM0_HUMAN
Q6ZSF4_HUMAN
Q5HYM0_HUMAN
Q5VVN3_HUMAN
Q5S007_HUMAN
Q5VU19_HUMAN
Q7Z4V5_HUMAN
Q86XQ2_HUMAN
Q86WH0_HUMAN
Q75MT3_HUMAN
Q9P2M8_HUMAN
Q9NVS0_HUMAN
Q9NZI8_HUMAN
Q9Y2K3_HUMAN
Q9UPT8_HUMAN
Q8TBR1_HUMAN
Q8WU10_HUMAN
ALDOA_HUMAN
CH60_HUMAN
PDIA3_HUMAN
SEC5_HUMAN
PSA6_HUMAN
TBA6_HUMAN
STMN2_HUMAN
RL12_HUMAN
Q96D18_HUMAN
72
Appendix 3 ORFs for 184 differentially expressed seed proteins in Grr1 knock-
out case study
ORF Fold Change
Q0255 415793714718904
YAL038W 0545852252758714
YAR009C 605360443593325
YBL015W 0328014440120407
YBL016W 814232901955471
YBL030C 428248520447998
YBL047C 034267736598115
YBL088C 249526272717271
YBL092W 0483721610343309
YBR021W 0157116451158551
YBR078W 023105360448864
YBR115C 2225185704536
YBR136W 419593345669184
YBR148W 186570263971014
YBR149W 025000000018879
YBR152W 465804066570279
YBR169C 603512014781145
YBR214W 0203327171879698
YBR218C 831792976604813E-02
YBR225W 426987061012334
YBR231C 954316594964094E-02
YBR233W 128927911263819
YBR241C 213537469763711
YBR263W 0147874306878216
YBR272C 231265108764462
YBR275C 496736103277175
YBR286W 296785473982758
YCL011C 259830512475747
YCR065W 0101522842755918
YDL006W 0228887134956306
YDL019C 93956486699021
YDL058W 98820593963859
YDL075W 226719154500437
YDL127W 534195933395087
YDL131W 201603150013112
YDL154W 566956521767448
YDL176W 0346494762223967
YDL239C 0295748613985256
YDR035W 0419114082837675
YDR058C 417638479544648
73
ORF Fold Change
YDR081C 0175600739297833
YDR116C 301369863012484
YDR138W 244157937145452
YDR155C 0523771152122715
YDR168W 0194085027742803
YDR171W 426062846561671
YDR177W 0166358595066621
YDR226W 331896375814804
YDR247W 368435004836908
YDR351W 211090573011355
YDR379W 0191304347619674
YDR450W 197524910005861
YDR464W 203099999997752
YDR469W 0331450044758495
YDR483W 0240000000159372
YER026C 584103511998871
YER042W 630314232922456
YER158C 191551565055894
YER166W 0273972603027691
YER176W 012628255728794
YER178W 210660620275169
YFL003C 0470655774025158
YFL007W 573796369408722
YFR034C 219983883943257
YGL003C 0110667072598724
YGL055W 648573742222094
YGL103W 207971802652271
YGL112C 0402900886532899
YGL131C 0370668815315337
YGL148W 0277264325355963
YGL151W 0203327171879698
YGL156W 259468170831708
YGL167C 0249798549363811
YGR004W 125138632168835
YGR027C 178132111635026
YGR087C 0228887134956306
YGR132C 0360000000192903
YGR175C 0129390018511791
YGR189C 029008863801562
YGR203W 98383973630905
YGR235C 369863013665815
YGR275W 688539741255251
YGR284C 0304990757780443
74
ORF Fold Change
YGR288W 141988950288631
YHL011C 273300000004619
YHL033C 245951318287733
YHR104W 914445109656317
YHR114W 639305445942334
YHR179W 263093435531901
YHR198C 646253021778323
YIL019W 012628255728794
YIL031W 501739130432334
YIL041W 231952362986739
YIL053W 0345265042503515
YIL112W 250699522170334
YIL143C 891870560378892
YIL159W 0265416928466571
YIR006C 886321626617145
YJL005W 32126713688849
YJL016W 238517324759968
YJL051W 283078162776328
YJL148W 0129390018511791
YJL190C 231551734904835
YJL216C 752310536012055
YJL218W 0175600739297833
YJR045C 181916371834376
YJR061W 596954314750328
YJR066W 230050761405552
YKL014C 0434430958041895
YKL088W 0306204673567028
YKL173W 040890152098861
YKL180W 19170591930552
YKL195W 0394842869081812
YKL209C 81319796956819
YKR018C 0173638516204436
YKR054C 392236598928196
YKR057W 0308407642817507
YKR064W 0258780037223804
YKR096W 0177276389876017
YLL007C 364222401278672
YLL045C 245951318287733
YLL046C 220789685726298
YLL057C 459352801929727
YLR004C 308622078989969
YLR028C 413321763210272
YLR080W 0173638516204436
75
ORF Fold Change
YLR087C 645107160556459
YLR148W 431103948406353
YLR179C 125138632168835
YLR191W 0203045685201405
YLR276C 705175600764816
YLR376C 0286506469458886
YLR422W 0380221832832661
YLR450W 529578856112268
YML008C 0129390018511791
YML023C 844670050774818
YMR038C 0234289452235187
YMR068W 0378726832817958
YMR079W 0339999999966919
YMR096W 0323475046523754
YMR108W 0522342689654229
YMR133W 0249537892567939
YMR145C 306832708199654
YMR231W 0320883101002656
YMR295C 031423290183668
YMR309C 131146025881953
YMR313C 0217566478816452
YNL073W 41095890411034
YNL079C 0303703534315121
YNL121C 0175600739297833
YNL160W 84011090582411
YNL218W 0464296173029536
YNL221C 235702717777939
YNL233W 531000000022657
YNL241C 0304990757780443
YNL244C 422365988910108
YNL298W 0201450443110585
YNL313C 144269870612683
YNR031C 890355330013963
YOL056W 257856567271875
YOL059W 297340854177039
YOL060C 3528963333553
YOL081W 0438552809930963
YOL127W 046438538789387
YOR048C 443190975024723
YOR129C 311039484306185
YOR136W 0160000000126762
YOR172W 0145044319229564
YOR187W 0110905730058634
76
ORF Fold Change
YOR191W 102233502548427
YOR261C 0330000000092788
YOR290C 0181206660197459
YPL007C 277043478253533
YPL113C 707182320476699
YPL174C 0110497237621271
YPL231W 0444474029156303
YPL239W 499999999958532
YPL248C 0149960536676909
YPL255W 123475046219541
YPR004C 0323475046523754
YPR117W 122912449348497
YPR134W 055600322290172
YPR141C 597042513829489
YPR186C 290894439963127
77
Appendix 4 Significantly overunder-represented GO cross-talk pairs for Grr1
knock-out case study
TYPE GO term 1 GO term 2 GO ID1 GO ID2
F channel or pore class transporter
activity
ion transporter activity 15267 15075
F ATPase activity coupled to
movement of substances
ion transporter activity 43492 15075
F ion binding ion transporter activity 43167 15075
F hydrolase activity ion transporter activity 16787 15075
F transferase activity ion transporter activity 16740 15075
F alcohol transporter activity ion transporter activity 15665 15075
F peptide transporter activity ion transporter activity 15197 15075
F ion transporter activity ion transporter activity 15075 15075
C intracellular organelle ubiquitin ligase complex 43229 151
C intracellular ubiquitin ligase complex 5622 151
C membrane-bound organelle ubiquitin ligase complex 43227 151
F ATPase activity coupled to
movement of substances
peptide transporter activity 43492 15197
F ATPase activity coupled to
movement of substances
channel or pore class
transporter activity
43492 15267
F ATPase activity coupled to
movement of substances
alcohol transporter activity 43492 15665
F nucleobase nucleoside nucleotide
and nucleic acid transporter activity
nucleobase nucleoside
nucleotide and nucleic acid
transporter activity
15932 15932
F lyase activity nucleobase nucleoside
nucleotide and nucleic acid
transporter activity
16829 15932
C intracellular organelle membrane 43229 16020
C immature spore membrane 42763 16020
C pyruvate dehydrogenase complex membrane 45254 16020
C external encapsulating structure membrane 30312 16020
C non-membrane-bound organelle membrane 43228 16020
C membrane-bound organelle membrane 43227 16020
P cellular physiological process cell growth 50875 16049
C eukaryotic 48S initiation complex eukaryotic 43S preinitiation
complex
16283 16282
C eukaryotic 43S preinitiation
complex
eukaryotic 43S preinitiation
complex
16282 16282
C non-membrane-bound organelle eukaryotic 43S preinitiation
complex
43228 16282
C non-membrane-bound organelle eukaryotic 48S initiation
complex
43228 16283
C intracellular organelle hydrogen-translocating V-
type ATPase complex
43229 16471
F ion binding oxidoreductase activity 43167 16491
78
TYPE GO term 1 GO term 2 GO ID1 GO ID2
F transferase activity oxidoreductase activity 16740 16491
C RNA polymerase complex DNA-directed RNA
polymerase II holoenzyme
30880 16591
F ion binding nucleotide binding 43167 166
F receptor signaling protein activity nucleotide binding 5057 166
F carrier activity nucleotide binding 5386 166
F electron transporter activity nucleotide binding 5489 166
F protein binding nucleotide binding 5515 166
F ATPase activity coupled to
movement of substances
nucleotide binding 43492 166
F ion transporter activity nucleotide binding 15075 166
F transferase activity nucleotide binding 16740 166
F cyclase activity nucleotide binding 9975 166
F GTPase regulator activity transferase activity 30695 16740
F ligase activity transferase activity 16874 16740
F ion binding transferase activity 43167 16740
F lyase activity transferase activity 16829 16740
F hydrolase activity transferase activity 16787 16740
F ATPase activity coupled to
movement of substances
transferase activity 43492 16740
F ion binding hydrolase activity 43167 16787
F ATPase activity coupled to
movement of substances
hydrolase activity 43492 16787
F hydrolase activity hydrolase activity 16787 16787
F GTPase regulator activity lyase activity 30695 16829
F vitamin binding lyase activity 19842 16829
F ion binding ligase activity 43167 16874
C intracellular organelle exosome (RNase complex) 43229 178
C intracellular exosome (RNase complex) 5622 178
P regulation of physiological process sexual reproduction 50791 19953
P cellular physiological process sexual reproduction 50875 19953
P negative regulation of biological
process
sexual reproduction 48519 19953
P regulation of cellular process sexual reproduction 50794 19953
P reproductive physiological process sexual reproduction 50876 19953
P non-developmental growth sexual reproduction 48590 19953
P regulation of cellular process asexual reproduction 50794 19954
P localization asexual reproduction 51179 19954
P asexual reproduction asexual reproduction 19954 19954
P cell differentiation asexual reproduction 30154 19954
P reproductive physiological process asexual reproduction 50876 19954
P regulation of physiological process asexual reproduction 50791 19954
P cellular physiological process asexual reproduction 50875 19954
P non-developmental growth asexual reproduction 48590 19954
79
TYPE GO term 1 GO term 2 GO ID1 GO ID2
C membrane-bound organelle cell fraction 43227 267
C intracellular cell fraction 5622 267
C intracellular organelle cell fraction 43229 267
P reproductive physiological process cell differentiation 50876 30154
P cell differentiation cell differentiation 30154 30154
P filamentous growth cell differentiation 30447 30154
P non-developmental growth cell differentiation 48590 30154
P cellular physiological process cell differentiation 50875 30154
C intracellular organelle external encapsulating
structure
43229 30312
C membrane-bound organelle external encapsulating
structure
43227 30312
C non-membrane-bound organelle site of polarized growth 43228 30427
C intracellular organelle site of polarized growth 43229 30427
C site of polarized growth site of polarized growth 30427 30427
P reproductive physiological process filamentous growth 50876 30447
P non-developmental growth filamentous growth 48590 30447
C ribonucleoprotein complex ribonucleoprotein complex 30529 30529
C intracellular organelle ribonucleoprotein complex 43229 30529
C intracellular organelle Noc complex 43229 30689
F ion binding GTPase regulator activity 43167 30695
F ATPase activity coupled to
movement of substances
GTPase regulator activity 43492 30695
C non-membrane-bound organelle RNA polymerase complex 43228 30880
C intracellular organelle transcription export complex 43229 346
C intracellular transcription export complex 5622 346
C non-membrane-bound organelle transcription export complex 43228 346
C membrane-bound organelle transcription export complex 43227 346
F RNA polymerase II transcription
factor activity
nucleic acid binding 3702 3676
F nucleic acid binding nucleic acid binding 3676 3676
F cyclase activity nucleic acid binding 9975 3676
F protein binding nucleic acid binding 5515 3676
F hydrolase activity nucleic acid binding 16787 3676
F translation factor activity nucleic
acid binding
nucleic acid binding 8135 3676
F electron transporter activity nucleic acid binding 5489 3676
P cellular physiological process regulation of growth 50875 40008
P regulation of physiological process regulation of gene
expression epigenetic
50791 40029
P regulation of gene expression
epigenetic
regulation of gene
expression epigenetic
40029 40029
P negative regulation of biological
process
regulation of gene
expression epigenetic
48519 40029
P cellular physiological process regulation of gene 50875 40029
80
TYPE GO term 1 GO term 2 GO ID1 GO ID2
expression epigenetic
P regulation of cellular process regulation of gene
expression epigenetic
50794 40029
P regulation of cellular process homeostasis 50794 42592
P cellular physiological process homeostasis 50875 42592
P regulation of physiological process homeostasis 50791 42592
C intracellular organelle immature spore 43229 42763
C membrane-bound organelle immature spore 43227 42763
C non-membrane-bound organelle immature spore 43228 42763
C membrane-bound organelle cell projection 43227 42995
C intracellular organelle cell projection 43229 42995
F ion binding ion binding 43167 43167
F ATPase activity coupled to
movement of substances
ion binding 43492 43167
C pyruvate dehydrogenase complex membrane-bound organelle 45254 43227
C membrane-bound organelle membrane-bound organelle 43227 43227
C organelle lumen membrane-bound organelle 43233 43227
C non-membrane-bound organelle non-membrane-bound
organelle
43228 43228
C intracellular organelle non-membrane-bound
organelle
43229 43228
C organelle lumen intracellular organelle 43233 43229
C ubiquinol-cytochrome-c reductase
complex
intracellular organelle 45285 43229
C respiratory chain complex III intracellular organelle 45275 43229
C pyruvate dehydrogenase complex intracellular organelle 45254 43229
F ATPase activity coupled to
movement of substances
ATPase activity coupled to
movement of substances
43492 43492
F cyclase activity helicase activity 9975 4386
F ATPase activity coupled to
movement of substances
helicase activity 43492 4386
F ion transporter activity helicase activity 15075 4386
F transferase activity helicase activity 16740 4386
P cellular physiological process negative regulation of
biological process
50875 48519
P regulation of physiological process negative regulation of
biological process
50791 48519
P non-developmental growth negative regulation of
biological process
48590 48519
P regulation of cellular process negative regulation of
biological process
50794 48519
P regulation of enzyme activity negative regulation of
biological process
50790 48519
F receptor signaling protein activity enzyme inhibitor activity 5057 4857
P localization non-developmental growth 51179 48590
P regulation of physiological process non-developmental growth 50791 48590
81
TYPE GO term 1 GO term 2 GO ID1 GO ID2
P cellular physiological process non-developmental growth 50875 48590
P non-developmental growth non-developmental growth 48590 48590
P reproductive physiological process non-developmental growth 50876 48590
P regulation of cellular process non-developmental growth 50794 48590
F ion binding receptor activity 43167 4872
C ribonucleoprotein complex proteasome complex (sensu
Eukaryota)
30529 502
C intracellular organelle proteasome complex (sensu
Eukaryota)
43229 502
C proteasome regulatory particle
(sensu Eukaryota)
proteasome complex (sensu
Eukaryota)
5838 502
C intracellular proteasome complex (sensu
Eukaryota)
5622 502
C non-membrane-bound organelle proteasome complex (sensu
Eukaryota)
43228 502
F transferase activity receptor signaling protein
activity
16740 5057
F ion binding receptor signaling protein
activity
43167 5057
P cellular physiological process regulation of enzyme activity 50875 50790
P regulation of enzyme activity regulation of enzyme activity 50790 50790
P regulation of physiological process regulation of physiological
process
50791 50791
P localization regulation of physiological
process
51179 50791
P regulation of cellular process regulation of physiological
process
50794 50791
P regulation of cellular process regulation of cellular process 50794 50794
P localization regulation of cellular process 51179 50794
P reproductive physiological process cellular physiological process 50876 50875
P localization localization 51179 51179
F ATPase activity coupled to
movement of substances
lipid transporter activity 43492 5319
F hydrolase activity carrier activity 16787 5386
F transferase activity carrier activity 16740 5386
F ATPase activity coupled to
movement of substances
carrier activity 43492 5386
F ion transporter activity carrier activity 15075 5386
F alcohol transporter activity carrier activity 15665 5386
F channel or pore class transporter
activity
carrier activity 15267 5386
F ion transporter activity intracellular transporter
activity
15075 5478
F ATPase activity coupled to
movement of substances
intracellular transporter
activity
43492 5478
F transferase activity electron transporter activity 16740 5489
82
TYPE GO term 1 GO term 2 GO ID1 GO ID2
F ligase activity electron transporter activity 16874 5489
F ion binding electron transporter activity 43167 5489
F transferase activity protein binding 16740 5515
F cyclase activity protein binding 9975 5515
C proteasome regulatory particle
(sensu Eukaryota)
intracellular 5838 5622
C ribonucleoprotein complex intracellular 30529 5622
C ubiquinol-cytochrome-c reductase
complex
intracellular 45285 5622
C mRNA cleavage factor complex intracellular 5849 5622
C respiratory chain complex III intracellular 45275 5622
C histone methyltransferase complex intracellular 35097 5622
C mitochondrial inner membrane
presequence translocase complex
intracellular 5744 5622
C immature spore intracellular 42763 5622
C transcription factor complex intracellular 5667 5622
C pyruvate dehydrogenase complex intracellular 45254 5622
C cell projection intracellular 42995 5622
C Noc complex intracellular 30689 5622
C site of polarized growth intracellular 30427 5622
C bud intracellular 5933 5622
C eukaryotic 43S preinitiation
complex
intracellular 16282 5622
C external encapsulating structure intracellular 30312 5622
C hydrogen-translocating V-type
ATPase complex
intracellular 16471 5622
C microtubule associated complex intracellular 5875 5622
C unlocalized protein complex transcription factor complex 5941 5667
C intracellular organelle transcription factor complex 43229 5667
C immature spore transcription factor complex 42763 5667
C membrane-bound organelle transcription factor complex 43227 5667
C transcription factor complex transcription factor complex 5667 5667
C DNA-directed RNA polymerase II
holoenzyme
transcription factor complex 16591 5667
C membrane-bound organelle mitochondrial inner
membrane presequence
translocase complex
43227 5744
C intracellular organelle mitochondrial inner
membrane presequence
translocase complex
43229 5744
C membrane-bound organelle proteasome regulatory particle
(sensu Eukaryota)
43227 5838
C intracellular organelle proteasome regulatory particle
(sensu Eukaryota)
43229 5838
C intracellular organelle mRNA cleavage factor
complex
43229 5849
83
TYPE GO term 1 GO term 2 GO ID1 GO ID2
C membrane-bound organelle mRNA cleavage factor
complex
43227 5849
C intracellular organelle microtubule associated
complex
43229 5875
C site of polarized growth microtubule associated
complex
30427 5875
C membrane microtubule associated
complex
16020 5875
C membrane-bound organelle microtubule associated
complex
43227 5875
C bud microtubule associated
complex
5933 5875
C non-membrane-bound organelle microtubule associated
complex
43228 5875
C cell projection microtubule associated
complex
42995 5875
C site of polarized growth bud 30427 5933
C non-membrane-bound organelle bud 43228 5933
C bud bud 5933 5933
C intracellular organelle bud 43229 5933
P regulation of gene expression
epigenetic
response to stress 40029 6950
P asexual reproduction response to stress 19954 6950
P negative regulation of biological
process
response to stress 48519 6950
P response to abiotic stimulus response to stress 9628 6950
P non-developmental growth response to stress 48590 6950
P morphogenesis response to stress 9653 6950
P regulation of physiological process response to stress 50791 6950
P cell communication response to stress 7154 6950
P regulation of enzyme activity response to stress 50790 6950
P regulation of cellular process response to stress 50794 6950
P cellular physiological process response to stress 50875 6950
P response to endogenous stimulus response to stress 9719 6950
P negative regulation of biological
process
cell communication 48519 7154
P non-developmental growth cell communication 48590 7154
P positive regulation of biological
process
cell communication 48518 7154
P cell differentiation cell communication 30154 7154
P regulation of enzyme activity cell communication 50790 7154
P response to abiotic stimulus cell communication 9628 7154
P cellular physiological process cell communication 50875 7154
P regulation of cellular process cell communication 50794 7154
P cell communication cell communication 7154 7154
P sexual reproduction cell communication 19953 7154
84
TYPE GO term 1 GO term 2 GO ID1 GO ID2
P metabolism cell communication 8152 7154
P morphogenesis cell communication 9653 7154
P reproductive physiological process cell communication 50876 7154
P regulation of physiological process cell communication 50791 7154
P asexual reproduction cell communication 19954 7154
P aging cell communication 7568 7154
P death cell communication 16265 7154
P response to endogenous stimulus aging 9719 7568
P cellular physiological process locomotory behavior 50875 7626
F cyclase activity enzyme activator activity 9975 8047
F ligase activity translation factor activity
nucleic acid binding
16874 8135
F transferase activity translation factor activity
nucleic acid binding
16740 8135
P homeostasis metabolism 42592 8152
P asexual reproduction metabolism 19954 8152
P regulation of enzyme activity metabolism 50790 8152
P regulation of cellular process metabolism 50794 8152
P regulation of gene expression
epigenetic
metabolism 40029 8152
P regulation of physiological process metabolism 50791 8152
P response to abiotic stimulus metabolism 9628 8152
P morphogenesis metabolism 9653 8152
P negative regulation of biological
process
metabolism 48519 8152
P response to endogenous stimulus metabolism 9719 8152
P sexual reproduction metabolism 19953 8152
P reproductive physiological process metabolism 50876 8152
P non-developmental growth metabolism 48590 8152
F ion binding lipid binding 43167 8289
F ion transporter activity protein transporter activity 15075 8565
F ATPase activity coupled to
movement of substances
protein transporter activity 43492 8565
F transferase activity small protein conjugating
enzyme activity
16740 8639
P regulation of enzyme activity response to abiotic stimulus 50790 9628
P cellular physiological process response to abiotic stimulus 50875 9628
P sexual reproduction response to abiotic stimulus 19953 9628
P asexual reproduction response to abiotic stimulus 19954 9628
P response to abiotic stimulus response to abiotic stimulus 9628 9628
P reproductive physiological process response to abiotic stimulus 50876 9628
P negative regulation of biological
process
response to abiotic stimulus 48519 9628
P non-developmental growth response to abiotic stimulus 48590 9628
P cellular physiological process morphogenesis 50875 9653
85
TYPE GO term 1 GO term 2 GO ID1 GO ID2
P asexual reproduction morphogenesis 19954 9653
P non-developmental growth morphogenesis 48590 9653
P regulation of cellular process response to endogenous
stimulus
50794 9719
P regulation of physiological process response to endogenous
stimulus
50791 9719
P response to endogenous stimulus response to endogenous
stimulus
9719 9719
P death response to endogenous
stimulus
16265 9719
P asexual reproduction response to endogenous
stimulus
19954 9719
P regulation of gene expression
epigenetic
response to endogenous
stimulus
40029 9719
P negative regulation of biological
process
response to endogenous
stimulus
48519 9719
P non-developmental growth response to endogenous
stimulus
48590 9719
P cellular physiological process response to endogenous
stimulus
50875 9719
F GTPase regulator activity cyclase activity 30695 9975
F transferase activity cyclase activity 16740 9975
86
References
1 Smith JC and D Figeys Proteomics technology in systems biology Mol
Biosyst 2006 2(8) p 364-70
2 Chen J Yan Z Shen C Dawn F and Wang M A Systems Biology Case
Study of Ovarian Cancer Drug Resistance JBCB 2007
3 Pinto FR et al Local correlation of expression profiles with gene
annotations--proof of concept for a general conciliatory method
Bioinformatics 2005 21(7) p 1037-45
4 Simpson R Proteins and proteomics a laboratory manual 2003 New York
Cold Spring Harbor Laboratory Press 926
5 Lesney M Pathways to the proteome From 2DE to HPLC Modern Drug
Discovery 2001 4(10) p 32-34 36 39
6 Tyers M and M Mann From genomics to proteomics Nature 2003
422(6928) p 193-7
7 Khalsa-Moyers G and WH McDonald Developments in mass spectrometry
for the analysis of complex protein mixtures Brief Funct Genomic Proteomic
2006 5(2) p 98-111
8 Aebersold R and M Mann Mass spectrometry-based proteomics Nature
2003 422(6928) p 198-207
9 Herbert CG and RAW Johnstone Mass spectrometry basics 2003 Boca
Raton CRC Press 474 p
10 Guerrera IC and O Kleiner Application of mass spectrometry in proteomics
Biosci Rep 2005 25(1-2) p 71-93
11 Barker J DJ Ando and R Davis Mass spectrometry 2nd ed 1999 New
York John Wiley amp Sons xxii 509
12 Frohlich T and GJ Arnold Proteome research based on modern liquid
chromatography - tandem mass spectrometry separation identification and
quantification J Neural Transm 2006 113(8) p 973-94
13 Ma S and R Subramanian Detecting and characterizing reactive metabolites
by liquid chromatographytandem mass spectrometry J Mass Spectrom 2006
41(9) p 1121-39
14 Yates JR 3rd et al Method to correlate tandem mass spectra of modified
peptides to amino acid sequences in the protein database Anal Chem 1995
67(8) p 1426-36
15 Old WM et al Comparison of Label-free Methods for Quantifying Human
Proteins by Shotgun Proteomics Mol Cell Proteomics 2005 4(10) p 1487-
502
16 Keller A et al Empirical statistical model to estimate the accuracy of
peptide identifications made by MSMS and database search Anal Chem
2002 74(20) p 5383-92
17 Nesvizhskii AI et al A statistical model for identifying proteins by tandem
mass spectrometry Anal Chem 2003 75(17) p 4646-58
18 Cottrell JS Protein identification by peptide mass fingerprinting Pept Res
1994 7(3) p 115-24
87
19 Gras R and M Muller Computational aspects of protein identification by
mass spectrometry Curr Opin Mol Ther 2001 3(6) p 526-32
20 Yates JR 3rd Database searching using mass spectrometry data
Electrophoresis 1998 19(6) p 893-900
21 Yan Z et al Data Management in Expression-based Proteomics in
Database Modeling in Biology Theories and Practices To appear 2006
22 Garwood K et al PEDRo a database for storing searching and
disseminating experimental proteomics data BMC Genomics 2004 5(1) p
68
23 Taylor CF et al A systematic approach to modeling capturing and
disseminating proteomics experimental data Nat Biotechnol 2003 21(3) p
247-54
24 Garden P R Alm and J Hakkinen PROTEIOS an open source proteomics
initiative Bioinformatics 2005 21(9) p 2085-7
25 Ferry-Dumazet H et al PROTICdb a web-based application to store track
query and compare plant proteome data Proteomics 2005 5(8) p 2069-81
26 Wilke A et al Bioinformatics support for high-throughput proteomics J
Biotechnol 2003 106(2-3) p 147-56
27 Cannataro M G Cuda and P Veltri Modeling and designing a proteomics
application on PROTEUS Methods Inf Med 2005 44(2) p 221-6
28 Yanagisawa K et al Universal Proteomics tools for Protein Quantification
and Data Management -Xome amp Mass Navigator Genome Informatics 15th
INternational Conference on Genome Informatics 2004
29 Weston AD and L Hood Systems Biology Proteomics and the Future of
Health Care Toward Predictive Preventative and Personalized Medicine J
Proteome Res 2004 3(2) p 179-196
30 Gene_Ontology httpwwwgeneontologyorg
31 Lomax J Get ready to GO A biologists guide to the Gene Ontology Brief
Bioinform 2005 6(3) p 298-304
32 Beisvag V et al GeneTools - application for functional annotation and
statistical hypothesis testing BMC Bioinformatics 2006 7(1) p 470
33 Feng W et al Development of gene ontology tool for biological
interpretation of genomic and proteomic data AMIA Annu Symp Proc 2003
p 839
34 Lottaz C and R Spang Molecular decomposition of complex clinical
phenotypes using biologically structured analysis of microarray data
Bioinformatics 2005 21(9) p 1971-8
35 Khatri P and S Draghici Ontological analysis of gene expression data
current tools limitations and open problems Bioinformatics 2005 21(18) p
3587-95
36 Verducci JS et al Microarray analysis of gene expression considerations
in data mining and statistical treatment Physiol Genomics 2006 25(3) p
355-63
37 Draghici S Data Analysis Tools for DNA Microarrays Mathematical
Biology and Medicine Series 2003 Chapman amp HallCRC
88
38 Bonferroni C Teoria statistica delle classi e calcolo delle probabilit
Pubblicazioni del R Istituto Superiore di Scienze Economiche e Commerciali
di Firenze 1936(8) p 3-62
39 Benjamini Y and Y Hochberg Controlling the false discovery rate a
practical and powerful approach to multiple testing Journal of the Royal
Statistical Society Series B (Methodological) 1995 57(1) p 289-300
40 Cheverud JM A simple correction for multiple comparisons in interval
mapping genome scans Heredity 2001 87(Pt 1) p 52-8
41 Zhang B S Kirov and J Snoddy WebGestalt an integrated system for
exploring gene sets in various biological contexts Nucleic Acids Res 2005
33(Web Server issue) p W741-8
42 Castillo-Davis CI and DL Hartl GeneMerge--post-genomic analysis data
mining and hypothesis testing Bioinformatics 2003 19(7) p 891-2
43 Shah NH and NV Fedoroff CLENCH a program for calculating Cluster
ENriCHment using the Gene Ontology Bioinformatics 2004 20(7) p 1196-7
44 Zhong S et al GoSurfer a graphical interactive tool for comparative
analysis of large gene sets in Gene Ontology space Appl Bioinformatics 2004
3(4) p 261-4
45 Khatri P et al Onto-Tools an ensemble of web-accessible ontology-based
tools for the functional design and interpretation of high-throughput gene
expression experiments Nucleic Acids Res 2004 32(Web Server issue) p
W449-56
46 Martin D et al GOToolBox functional analysis of gene datasets based on
Gene Ontology Genome Biol 2004 5(12) p R101
47 Draghici S et al Onto-Tools the toolkit of the modern biologist Onto-
Express Onto-Compare Onto-Design and Onto-Translate Nucleic Acids Res
2003 31(13) p 3775-81
48 Ball CA et al Saccharomyces Genome Database provides tools to survey
gene expression and functional analysis data Nucleic Acids Res 2001 29(1)
p 80-1
49 Barabasi AL and ZN Oltvai Network biology understanding the cells
functional organization Nat Rev Genet 2004 5(2) p 101-13
50 Gavin AC et al Functional organization of the yeast proteome by
systematic analysis of protein complexes Nature 2002 415(6868) p 141-7
51 Ho Y et al Systematic identification of protein complexes in Saccharomyces
cerevisiae by mass spectrometry Nature 2002 415(6868) p 180-3
52 Ito T et al A comprehensive two-hybrid analysis to explore the yeast protein
interactome Proc Natl Acad Sci U S A 2001 98(8) p 4569-74
53 Uetz P et al A comprehensive analysis of protein-protein interactions in
Saccharomyces cerevisiae Nature 2000 403(6770) p 623-7
54 Giot L et al A protein interaction map of Drosophila melanogaster Science
2003 302(5651) p 1727-36
55 Li S et al A map of the interactome network of the metazoan C elegans
Science 2004 303(5657) p 540-3
56 Stelzl U et al A human protein-protein interaction network a resource for
annotating the proteome Cell 2005 122(6) p 957-68
89
57 Rual JF et al Towards a proteome-scale map of the human protein-protein
interaction network Nature 2005 437(7062) p 1173-8
58 Brown KR and I Jurisica Online predicted human interaction database
Bioinformatics 2005 21(9) p 2076-82
59 Benson M and R Breitling Network theory to understand microarray studies
of complex diseases Curr Mol Med 2006 6(6) p 695-701
60 Wachi S K Yoneda and R Wu Interactome-transcriptome analysis reveals
the high centrality of genes differentially expressed in lung cancer tissues
Bioinformatics 2005 21(23) p 4205-8
61 Sharan R et al Conserved patterns of protein interaction in multiple species
Proc Natl Acad Sci U S A 2005 102(6) p 1974-9
62 Christie KR et al Saccharomyces Genome Database (SGD) provides tools
to identify and analyze sequences from Saccharomyces cerevisiae and related
sequences from other organisms Nucleic Acids Res 2004 32(Database issue)
p D311-4
63 Issel-Tarver L et al Saccharomyces Genome Database Methods Enzymol
2002 350 p 329-46
64 Weng S et al Saccharomyces Genome Database (SGD) provides
biochemical and structural information for budding yeast proteins Nucleic
Acids Res 2003 31(1) p 216-8
65 Alfarano C et al The Biomolecular Interaction Network Database and
related tools 2005 update Nucleic Acids Res 2005 33(Database issue) p
D418-24
66 Bader GD D Betel and CW Hogue BIND the Biomolecular Interaction
Network Database Nucleic Acids Res 2003 31(1) p 248-50
67 Bader GD et al BIND--The Biomolecular Interaction Network Database
Nucleic Acids Res 2001 29(1) p 242-5
68 Calvano SE et al A network-based analysis of systemic inflammation in
humans Nature 2005 437(7061) p 1032-7
69 Said MR et al Global network analysis of phenotypic effects protein
networks and toxicity modulation in Saccharomyces cerevisiae Proc Natl
Acad Sci U S A 2004 101(52) p 18006-11
70 Seiden-Long IM et al Transcriptional targets of hepatocyte growth factor
signaling and Ki-ras oncogene activation in colorectal cancer Oncogene
2006 25(1) p 91-102
71 Motamed-Khorasani A et al Differentially androgen-modulated genes in
ovarian epithelial cells from BRCA mutation carriers and control patients
predict ovarian cancer survival and disease progression Oncogene 2006
72 Higgs RE et al Comprehensive label-free method for the relative
quantification of proteins from biological samples J Proteome Res 2005 4(4)
p 1442-50
73 Bolstad BM et al A comparison of normalization methods for high density
oligonucleotide array data based on variance and bias Bioinformatics 2003
19(2) p 185-93
74 Kersey PJ et al The International Protein Index an integrated database for
proteomics experiments Proteomics 2004 4(7) p 1985-8
90
75 Apweiler R A Bairoch and CH Wu Protein sequence databases Curr
Opin Chem Biol 2004 8(1) p 76-80
76 Efron B Large-scale simultaneous hypothesis testing the choice of a null
hypothesis JASA 2004 99 p 96-104
77 Chen J M Wang and C Shen An integrated computational proteomics
method to extract protein targets for Fanconi Anemia studies Proceedings of
the 21st Annual ACM Symposium on Applied Computing Dijion France In
press 2006
78 von Mering C et al STRING known and predicted protein-protein
associations integrated and transferred across organisms Nucleic Acids Res
2005 33(Database issue) p D433-7
79 Sivachenko A J Chen and C Martin ProteoLens A Visual Data Mining
Platform for Exploring Biological Networks BMC Bioinformatics 2006
80 Benjamini Y and D Yekutieli The control of the false discovery rate in
multiple testing under dependency Ann Statist 2001 29(4) p 1165ndash1188
81 Chen J C Shen and A Sivachenko An Integrated Computational
Proteomics Method to Extract Protein Targets for Fanconi Anemia Studies
Pacific Symposium on Biocomputing 2006 11 p 367-78
82 Olivero OA et al Preferential binding of cisplatin to mitochondrial DNA of
Chinese hamster ovary cells Mutat Res 1995 346(4) p 221-30
83 Chen J and J Carlis Genomic data modeling Information Systems 2003
28(4) p 287-310
84 Kishi T T Seno and F Yamao Grr1 functions in the ubiquitin pathway in
Saccharomyces cerevisiae through association with Skp1 Mol Gen Genet
1998 257(2) p 143-8
85 Skowyra D et al F-box proteins are receptors that recruit phosphorylated
substrates to the SCF ubiquitin-ligase complex Cell 1997 91(2) p 209-19
86 Spielewoy N et al Regulation and recognition of SCFGrr1 targets in the
glucose and amino acid signaling pathways Mol Cell Biol 2004 24(20) p
8994-9005
87 Willems AR et al SCF ubiquitin protein ligases and phosphorylation-
dependent proteolysis Philos Trans R Soc Lond B Biol Sci 1999 354(1389)
p 1533-50
88 Flick JS and M Johnston GRR1 of Saccharomyces cerevisiae is required for
glucose repression and encodes a protein with leucine-rich repeats Mol Cell
Biol 1991 11(10) p 5101-12
89 Blacketer MJ P Madaule and AM Myers Mutational analysis of
morphologic differentiation in Saccharomyces cerevisiae Genetics 1995
140(4) p 1259-75
90 Loeb JD et al Saccharomyces cerevisiae G1 cyclins are differentially
involved in invasive and pseudohyphal growth independent of the filamentation
mitogen-activated protein kinase pathway Genetics 1999 153(4) p 1535-46
91 Kishi T and F Yamao An essential function of Grr1 for the degradation of
Cln2 is to act as a binding core that links Cln2 to Skp1 J Cell Sci 1998 111
( Pt 24) p 3655-61
91
92 Jaquenoud M et al The Cdc42p effector Gic2p is targeted for ubiquitin-
dependent degradation by the SCFGrr1 complex Embo J 1998 17(18) p
5360-73
93 Barral Y S Jentsch and C Mann G1 cyclin turnover and nutrient uptake
are controlled by a common pathway in yeast Genes Dev 1995 9(4) p 399-
409
94 Kahana JA et al The yeast dynactin complex is involved in partitioning the
mitotic spindle between mother and daughter cells during anaphase B Mol
Biol Cell 1998 9(7) p 1741-56
95 Eckert-Boulet N B Regenberg and J Nielsen Grr1p is required for
transcriptional induction of amino acid permease genes and proper
transcriptional regulation of genes in carbon metabolism of Saccharomyces
cerevisiae Curr Genet 2005 47(3) p 139-49
96 Westergaard SL et al Elucidation of the role of Grr1p in glucose sensing by
Saccharomyces cerevisiae through genome-wide transcription analysis FEMS
Yeast Res 2004 5(3) p 193-204
92
Zhong Yan
E-Mail ohzhongyahoocom
Education
(1) SAS trainings (Session I SAS programming essentials Session II SAS data
manipulation) in SAS School Indianapolis
(2) MS in Bioinformatics Indiana University School of Informatics (GPA 3940)
(3) National Center for Biotech Information Regional Workshop
(4) Microarray data analysis workshop (in Chicago)
(5) MS in Cellular Biology from Academy of Military Medical Sciences Beijing
China
(6) BS in Physiology from Nanjing University Jiangsu Province China
Professional Experience
Apr 2006 ~ current Business Information Analyst HSBC
(1) Database administrator for Access databases database management automation
processes
(2) Application developer using VBA and VBScript
(3) Data auditor
(4) Reports generator using VBA SAS HTML and software tools
Sep 2005 ~ April 2006 Research assistant Discovery Informatics and
Computing Group at Indiana University School of Informatics
(1) Oracle databases development
(2) Proteomics data analysis and systems biology analysis in SQL et al
(3) Programming in Perl and PHP
Dec 2004 ~ Aug 2005 Research technician Pediatrics Hematology
Oncology Indiana University School of Medicine
(1) Database designer and administrator for Access database
(2) Clinical data analysis in SQL
(3) Microarray data analysis
(4) Programming in VBA Java C++ and Matlab
March 2000 ~ June 2001 Research technician Urology Department
Indiana University School of Medicine Research area Adenovirus gene
therapy for prostate cancer Cell culturing virus amplification and purification
plasmid and cosmid construction numerous assays
93
August 1994 ~ August 1999 Assistant Professor Institute of Pharmacology
and Toxicology Academy of Military Medical Sciences Beijing China
Supervise two technicians Research area Preclinical trial
psychopharmacological research new drug screening and evaluation Awarded
twice by the Institute for excellent work
August 1988 ~ August 1991 Assistant lecturer Traditional Chinese
Medicine College Jiangxi Province China
Computer Science Skills Familiar with object-oriented programming concept and programming languages
C C++ Java SAS Perl PHP JavaScript Matlab HTML XML UnixLinux
Excel programming JCL
Familiar with database design Oracle Access MySQL database management
systems SQL language
Familiar with many tools
Database related tools ErWin Toad for Oracle Aqua Data Studio Crystal
Reports Case Studio MYSQL-Front
Application development tools Eclipse XML Spy Komodo
Multimedia related tools Dreamweaver Flash Fireworks Illustrator
Adobe Photoshop Adobe Primere Pro (video editing tool) Adobe Encore
(DVD editing tool) SoundForge (sound editing tool) n-Track studio (sound
mixing tool) Logo design studio
Other tools Office (Excel Access PowerPoint Publisher) Lotus Notes
EndNotes SSH
Microarray data analysis (cDNA array and Affymetrix array) and gene
annotations
Knowledge for major biological databases such as NCBI OWL Swiss-Prot PIR
IPI SGD GeneOntology
Data mining techniques such as classification and clustering analysis association
rule extraction
Familiar with many bioinformatics tools
Hands-on Experience in Biological Research Primary neural cell culturing Cell line culturing (293 cells LnCap C4-2 cells
PC3 cells et al) Cell activity assay by MTT assay and Crystal violet assay X-Gal
staining Adenovirus amplification and purification Plaque assay for the virus
Protein concentration measurementWestern blot and Northern blot Making
competent bacteria and transformation Plasmid and Cosmid construction transfection
PCR and real-time PCR Plasmid DNA MiniPrep MidiPrep MaxiPrepDNA
extraction from tissue DNA recovery from gelRadio-labeled ligand receptor binding
assay saturation inhibition and kinetic assay Second messenger measurement RNA
microinjection of Xenopus Oocytes Animal models of depression (rat or mouse
forced swimming test tail suspension test olfactory bulbectomy for rats et al)
Projects
Lookup database management automation (In VBScript)
94
Reports automation processes (in VBA script and VBScript)
Pediatric leukemia database design implementation and management (in Access)
Customized designing an oracle database to store several high-throughput
experimental datasets
Designing and implementing an oracle database to integrate the data downloaded
from several public databases (Oracle)
Lab Ordering Database Design implementation and management
Forest Experiment Project Database Design and implementation (in MS Access)
Student course registration system (in both C and C++) Grocery Distributor
System (in C++) Building an AVL tree to generate a word histogram (in C++)
Graph for course schedules and shortest time schedule finding (in C++) Thread
and Synchronization in Nachos Operating System (in C++) Scheduling in
Nachos Operating System (in C++) Memory management in Nachos Operating
System (in C++)
Decision Tree and Neural Network Classification analysis to distinguish 9
different speakers based on 12 Japanese vowel pronunciations (Matlab neural
network toolbox and C45)
Clustering analysis of microarray data (Matlab)
Game character Name game Calculator (Java projects)
Moving fairy (in JavaScript)
Fun web site (in Flash)
Publications 1) Jake Chen Zhong Yan Changyu Shen et al A Systems Biology Case Study of Ovarian
Cancer Drug Resistance (Accepted for 2007 publication) 2) Zhong Yan Jake Chen et al Data Management in Expression-based Proteomics In
Database Modeling in Biology Practices and Challenges (to be published by Springer in 2006)
3) Susanne Ragg Marc Rosenman Eve Doucette Zhong Yan Julie Haydon Jada Paine
Nadine Lee Terry Vik Ketan Mane Katy Borner
Data visualization of Multiparameter Information in Acute Lymphoblastic Leukemia Expands the
Ability to Explore Prognostic Factors (Abstract 554689) 47th
ASH Annual Meeting Aug 2005
4)Zhong Yan Xiaozhuang Hong et al The effect of a new anticholinergic drug 3H]tricyclopinate
on human fetal cerebral cortex muscarinic receptors Bull Acad Mil Med Sci 1999 23(1) 35 ~
7 (Chinese)
5)Zhong Yan Yuhua Chen et al Effect of MO on animal models of depression China journal of
Chinese meteria medica 1999 suppl 81 ~ 2 (Chinese)
6)Zhong Yan Zhenghua Gong et al Effects of aqueous extracts of detoxified cotton seeds
(AEDCS) on the level of mouse spleen lymphocytes cyclic AMP Bull Acad Mil Med Sci
1999 23(2)136 (Chinese)
7)Zhong Yan Zhipu Luo et al The effect of equilinol on rat cerebral cortex GABAA receptors
Bull Acad Mil Med Sci 1998 22(3) 217 (Chinese)
8)Zhong Yan Xiaozhuang Hong et al The effect of a new cholinolytic-[3H]Tricyclopinate on
human brain muscarinic receptors Acta Pharmaceutica Sinica 1997 32(7) 506~10 (Chinese)
9)Zhong Yan Zhipu Luo Experimental methods of antidepressants In Modern experimental
methods in pharmacology ( I II ) Chief editor Juntian Zhang Beijing Medical University and
Peking Union Medical College associated press 1997 1061 ~ 71 ( Chinese)
10)Zhong Yan Zhenghua Gong et al Effect of oligosaccharide extracted from Morinda officinalis
How on corticosterone endangered primary cultured hippocampal neurons Bull Acad Mil Med
Sci (accepted before I came to USA)
11)Zhong Yan Zhenghua Gong et al A new potential anxiolytic its effects on mitochondrial
DBI receptors and on rat elevated plus maze model (waiting for patent application before I came
to USA))

ii
Accepted by the Graduate Faculty Indiana University in partial
fulfillment of the requirements for the degree of Master of Science
_________________________________
Dr Jake Yue Chen PhD Chair
__________________________________
Dr Mark Goebl PhD
Master‟s Thesis
Committee
__________________________________
DrChangyu Shen PhD
iii
Acknowledgements
I would like to express my sincere gratitude to everyone who went along with me
during this journey and who contributed to this research
Special thanks to
My thesis advisor Dr Jake Chen
It is hard to find the right words to express my gratitude to this special and impressive
person His expertise in bioinformatics science wide knowledge and logical way of
thinking improved my research skills and prepared me for future challenges I would like
to thank Jake for his advice and especially for his excellent scientific guidance and
encouragement
Systems biology studies rely heavily on interdisciplinary collaborations Our studies
involved collaborations among the biology group statistics group and informatics group
I would like to thank Dr Changyu Shen for his contributions in the statistical testings in
my case studies Dr Shen programmed in R-scripts for the statistical testings I would
like to thank him for his support and advice Dr Mark Goebl provided me support and
encouragement during my thesis study His advice has been invaluable for my thesis
study I would also like to express my deep gratitude to his contributions to the yeast
Grr1 case study I would like to express my warm and sincere thanks to Dr Mu Wang for
his support contributions excellent advice and detailed review in the human ovarian
cancer case study
I would like to extend my sincere thanks to Josh Heyen for his contributions in the
yeast Grr1 knock-out case study Josh Heyen provided the proteomics experimental
dataset and part of the biological interpretation for my analysis results I would also like
to thank Dawn Fitzpatrick for providing human ovarian cancer proteomics experimental
dataset
iv
There are countless people to thank team members colleagues friends and my
family who supported me during the years I am using this space to present my thanks to
them
Ample thanks to
Molly Mary Todd and Kimberly for their timely support and patience during my
research work
SudhaRani Pranav Harini and Lavanya for the joy we shared along with my
research work and for the support I got from them
My deepest gratitude to the three most special persons in my life my husband
Baoguang for his encouragement and support especially during the most challenging
moments and my sons Linsu and Jason who fill my life with joy for their understanding
and support
v
ABSTRACT
Zhong Yan
ONTOLOGY-DRIVEN AND NTEWORKndashENABLE
SYSTEMS BIOLOGY CASE STUDIES
With the progress in high-throughput technologies and bioinformatics in recent years
it is possible to determine to what extent genetic or environmental manipulation of a
biological system affects the expression of thousands of genes and proteins This study
requires a shift from the conventional pure hypothesis-driven approach to an integrated
approach--systems biology method Systems biology studies the relationships and
interactions between various parts of a biological system It allows individual genes or
proteins to be placed in a global context of cellular functions This analysis can answer
the question of how networks of genesproteins differentially regulated respond to
genetic or environmental modification are placed in the global context of the protein
interaction map In this project we establish a protein interaction network-based systems
biology approach and use the method for two case studies
In particular our systems biology studies consist of the following parts (1) Analysis
of mass-spectrometry derived proteomics experimental data to identify differentially
expressed proteins in different genetic or environmental conditions (2) Integration of
genomics and proteomics data with experimental results the molecular context of
protein-protein interaction networks and gene functional categories (3) Visual
interpretation of molecular networks Our approach has been validated in two case
studies by comparing our discoveries with existing findings We also obtained new
insights In the first case study the proteomes of cisplatin-sensitive and cisplatin-resistant
ovarian cancer cells were compared and we observed that cellular physiological process
is significantly activated in cisplatin-resistant cell lines and this response arises from
endogenous abiotic and stress-related signals We found that cisplatin-resistant cell lines
demonstrated unusually high level of protein-binding activities and a broad spectrum of
across-the-board drug-binding and nucleotide-binding mechanisms are all activated In
vi
the second case study we found that the significantly enriched GO categories included
genes that are related to Grr1 perturbation induced morphological phenotype change are
highly connected in the GO sub-network which implies that Grr1 could be affecting this
process by affecting a small core group of proteins These biological discoveries support
the significance of developing a common framework of evaluating functional genomics
and proteomics data using networks and systems approaches
vii
TABLE OF CONTENTS
List of Tableshelliphelliphelliphelliphelliphelliphelliphelliphelliphelliphelliphelliphelliphelliphelliphelliphelliphelliphelliphelliphelliphelliphelliphelliphellipix
List of Figures helliphelliphelliphelliphelliphelliphelliphelliphelliphelliphelliphelliphelliphelliphelliphelliphelliphelliphelliphelliphelliphelliphelliphellipx
1 Introduction helliphelliphelliphelliphelliphelliphelliphelliphelliphelliphelliphelliphelliphelliphelliphelliphelliphelliphelliphelliphelliphelliphelliphelliphellip1
2 Backgroundhelliphelliphelliphelliphelliphelliphelliphelliphelliphelliphelliphelliphelliphelliphelliphelliphelliphelliphelliphelliphelliphelliphelliphelliphellip4
21 Mass spectrometry-based proteomics helliphelliphelliphelliphelliphelliphelliphelliphelliphelliphelliphelliphellip4
211 Mass spectrometryhelliphelliphelliphelliphelliphelliphelliphelliphelliphelliphelliphelliphelliphelliphelliphellip4
212 Proteomics data analysishelliphelliphelliphelliphelliphelliphelliphelliphelliphelliphelliphelliphelliphellip6
213 Proteomics data management toolshelliphelliphelliphelliphelliphelliphelliphelliphelliphellip7
22 Ontology-based gene annotation and network-enabled analysishelliphelliphellip9
221 Proteomics and systems biologyhelliphelliphelliphelliphelliphelliphelliphelliphelliphellip9
222 Ontology-based gene annotationhelliphelliphelliphelliphelliphelliphelliphelliphelliphelliphellip11
223 Proteomics interaction network-based analysishelliphelliphelliphelliphellip14
3 Methodshelliphelliphelliphelliphelliphelliphelliphelliphelliphelliphelliphelliphelliphelliphelliphelliphelliphelliphelliphelliphelliphelliphelliphelliphelliphellip19
31 Proteomics methodshelliphelliphelliphelliphelliphelliphelliphelliphelliphelliphelliphelliphelliphelliphelliphelliphelliphelliphelliphellip19
311 Ovarian cancer drug resistance proteomics methodhelliphelliphellip19
312 Yeast Grr1 knock-out proteomics methodhelliphelliphelliphelliphelliphelliphellip 20
32 Preparation of datasetshelliphelliphelliphelliphelliphelliphelliphelliphelliphelliphelliphelliphelliphelliphelliphelliphelliphellip23
321 Proteins in differentially expressed cisplatin-resistant
vs cisplatin-sensitive ovarian cancer cellshelliphelliphelliphelliphelliphelliphellip23
322 Differentially expressed proteins identified from Grr1
Knock -out yeast vs wild-type yeast helliphelliphelliphelliphelliphelliphelliphelliphellip24
323 Protein interactome datahelliphelliphelliphelliphelliphelliphelliphelliphelliphelliphelliphelliphelliphellip25
324 Noise-introduced human protein interactome Data helliphelliphellip27
325 Gene annotation datahelliphelliphelliphelliphelliphelliphelliphelliphelliphelliphelliphelliphelliphelliphellip27
326 Interacting protein categorical annotation datahelliphelliphelliphelliphellip28
33 Protein-protein interaction scoring modelhelliphelliphelliphelliphelliphelliphelliphelliphelliphelliphellip29
34 Network expansionhelliphelliphelliphelliphelliphelliphelliphelliphelliphelliphelliphelliphelliphelliphelliphelliphelliphelliphelliphellip33
35 Network visualizationhelliphelliphelliphelliphelliphelliphelliphelliphelliphelliphelliphelliphelliphelliphelliphelliphelliphelliphellip33
36 Network statistical examinationhelliphelliphelliphelliphelliphelliphelliphelliphelliphelliphelliphelliphelliphelliphellip34
37 Significance of testing of GO categories and GO-GO categories helliphellip34
38 Validation of under-represented GO categorieshelliphelliphelliphelliphelliphelliphelliphellip36
39 Drill-down of significant categories helliphelliphelliphelliphelliphelliphelliphelliphelliphelliphelliphelliphellip37
310 Scoring of Significant Proteins in the Sub-Networkhelliphelliphelliphelliphelliphelliphellip38
4 Resultshelliphelliphelliphelliphelliphelliphelliphelliphelliphelliphelliphelliphelliphelliphelliphelliphelliphelliphelliphelliphelliphelliphelliphelliphelliphelliphellip40
Case study 1 Ovarian cancer drug resistance case studyhelliphelliphelliphelliphelliphellip40
viii
41 Activated protein interaction sub-network propertieshelliphelliphelliphelliphelliphelliphellip40
42 Analysis of activated protein functional distributionhelliphelliphelliphelliphelliphelliphellip42
43 Functional category cross-talkshelliphelliphelliphelliphelliphelliphelliphelliphelliphelliphelliphelliphelliphelliphellip46
44 Visualization of the activated interaction functional sub-networkhelliphellip48
Case study 2 Yeast Grr1 knock-out case studyhelliphelliphelliphelliphelliphelliphelliphelliphelliphellip51
45 Activated protein interaction sub-network propertieshelliphelliphelliphelliphelliphellip51
46 Analysis of activated protein functional category distributions hellip52
47 Functional category cross-talkshelliphelliphelliphelliphelliphelliphelliphelliphelliphelliphelliphelliphelliphelliphellip56
48 Scoring of significant proteins in the sub-networkhelliphelliphelliphelliphelliphelliphelliphellip58
5 Conclusionshelliphelliphelliphelliphelliphelliphelliphelliphelliphelliphelliphelliphelliphelliphelliphelliphelliphelliphelliphelliphelliphelliphelliphelliphellip62
6 Discussionshelliphelliphelliphelliphelliphelliphelliphelliphelliphelliphelliphelliphelliphelliphelliphelliphelliphelliphelliphelliphelliphelliphelliphelliphellip64
7 Appendiceshelliphelliphelliphelliphelliphelliphelliphelliphelliphelliphelliphelliphelliphelliphelliphelliphelliphelliphelliphelliphelliphelliphelliphelliphellip68
Appendix 1 ERD diagram for Oracle schema Sysbiohelliphelliphelliphelliphelliphelliphelliphellip68
Appendix 2 Uniprot ID mappings for 119 differentially expressed
seed proteins in ovarian cancer drug resistance studyhelliphelliphellip69
Appendix 3 ORFs for 184 differentially expressed seed proteins in
Grr1 knock-out case studyhelliphelliphelliphelliphelliphelliphelliphelliphelliphelliphelliphelliphelliphellip72
Appendix 4 Significantly overunder- represented GO cross-talk pairs
for Grr1 knock-out case studyhelliphelliphelliphelliphelliphelliphelliphelliphelliphelliphelliphellip77
Referenceshelliphelliphelliphelliphelliphelliphelliphelliphelliphelliphelliphelliphelliphelliphelliphelliphelliphelliphelliphelliphelliphelliphelliphelliphelliphelliphellip82
Curriculum Vitae
ix
LIST OF TABLES
Table 21Gene Ontology analysis tools helliphelliphelliphelliphelliphelliphelliphelliphelliphelliphelliphelliphelliphelliphelliphelliphellip13
Table 22 Leading protein interaction databases helliphelliphelliphelliphelliphelliphelliphelliphelliphelliphelliphelliphelliphellip15
Table 31 Metadata for experimental methods helliphelliphelliphelliphelliphelliphelliphelliphelliphelliphelliphelliphelliphelliphellip31
Table 32 Experimental methods for interacting pairs stored in SGD helliphellip31
Table 33 Experimental methods for interacting pairs stored in BIND helliphelliphelliphelliphellip32
Table 41 Enriched GO categories in the sub-network context helliphelliphelliphelliphelliphelliphelliphelliphelliphellip43
Table 42 Re-examination of under-represented seed protein functional categories 44
Table 43 Drill down of significant GO-GO functional category cross-talk helliphelliphelliphellip47
Table 44 Overunder ndash represented GO categories among the seed proteins52
Table 45 Overunder ndash represented GO categories among the subnet proteins helliphellip54
Table 46 Ranking analysis of the significant proteins helliphelliphelliphelliphelliphelliphelliphelliphelliphelliphelliphellip59
x
LIST OF FIGURES
Figure 11 Framework of the novel systems biology approachhelliphelliphelliphelliphelliphelliphellip2
Figure 21 Proteomics data analysis pipelinehelliphelliphelliphelliphelliphelliphelliphelliphelliphelliphelliphelliphelliphelliphellip7
Figure 22 Major elements of our systems biology approach helliphelliphelliphelliphelliphelliphelliphellip10
Figure 31 Yeast Interactome data source from SGD and BINDhelliphelliphellip helliphelliphellip25
Figure 32 Interactome data integration flow charthelliphelliphelliphelliphelliphelliphelliphellip helliphelliphelliphellip26
Figure 33 Yeast annotation database stored in Oracle 10g helliphelliphelliphelliphelliphelliphelliphelliphellip28
Figure 34 Protein interaction reliability score calculation algorithm
and formulas helliphelliphelliphelliphelliphelliphelliphelliphelliphelliphelliphelliphelliphelliphelliphelliphelliphelliphelliphelliphelliphelliphellip30
Figure 35 Illustration showing the overlap of 9959 OPHID proteins
and 4333 proteins detected by MS experiments helliphelliphelliphelliphelliphelliphelliphelliphelliphellip36
Figure 36 Application for the yeast subnet construction helliphelliphelliphellip38
Figure 41 Node degree distribution of the sub-networks (core or full)
in comparison with the human protein interaction network helliphelliphelliphellip41
Figure 42 Significantly over-represented GO-GO interaction categories
in seeded subnetworkhelliphelliphelliphelliphelliphelliphelliphelliphelliphelliphelliphelliphelliphelliphelliphelliphelliphelliphellip46
Figure 43 Activated biological process network in cisplatin-resistant
ovarian cancer cells helliphelliphelliphelliphelliphelliphelliphelliphelliphelliphelliphelliphelliphelliphelliphelliphelliphelliphellip49
Figure 44 Node degree distribution of the sub-networks (core or full)
in comparison with the yeast protein interaction networkhelliphelliphelliphelliphelliphellip51
Figure 45 Enriched GO categories (partial listing) and yeast bud
morphological phenotype helliphelliphelliphelliphelliphelliphelliphelliphelliphelliphelliphelliphelliphelliphelliphelliphelliphellip56
Figure 46 Visualization of significantly over-represented GO cross ndash talk
partial sub-networks for biological process (top) and cellular
component (bottom)helliphelliphelliphelliphelliphelliphelliphelliphelliphelliphelliphelliphelliphelliphelliphelliphelliphelliphelliphelliphellip57
Figure 47 Protein interaction sub-network seeded by Grr1 Dyn1 and Nip100helliphellip59
1
1 INTRODUCTION
Over the past two centuries life science research has been rooted in the assumption
that complex problems may be solvable by dividing them into smaller simpler and
thus more manageable units While the human body is considered to be an integrated
system with a company of components the natural tendency of medicine is to separate
the single factor that is most responsible for the consequence It is undeniable that this
approach has been a success for years However it leaves little room for contextual
information The need to make sense of complex interactions has led some researchers
to shift from a component-level to system-level perspective With the progress in high-
throughput technologies and bioinformatics (for example many bioinformatics
databases are available to the public) in recent years it is possible to determine to
what extent genetic or environmental manipulation of a biological system affects the
expression of thousands of genes and proteins This form of study requires a shift from
a conventional individual approach (divide-and-conquer approach) towards an
integrated approach The integrated approach leads to an emerging field called
systems biology[1] Systems biology takes into account complex interactions of genes
proteins and cell elements By studying the relationships and interactions between
various parts of a biological system it is hoped that researchers might build a system-
level understanding of biological systems and gain novel insights towards discoveries
In this project we have developed a novel systems biology approach to study
proteomics experimental data Using this approach we have performed case studies on
two proteomics datasets (1) human ovarian cancer drug resistance (2) yeast Grr1
knock-out Our systems biology studies consist of the following parts (see figure 11)
(1) Analyzing mass-spectrometry derived proteomics experimental data to identify
differentially expressed proteins in cisplatin-sensitive vs cisplatin-resistant ovarian
cell line samples and yeast Grr1 knock-out vs wild-type samples (2) Integrating
genomics and functional genomics data with experimental results and the molecular
context of protein-protein interaction networks and gene functional categories we use
OPHID (Online Predicted Human Interaction Database) for our ovarian cancer study
2
and an in-house developed yeast protein-protein interaction database (SBG) for our
yeast study The integration involves identifying protein interaction partners for the
differentially-expressed protein set (seed proteins) as well as identifying the gene
ontology cross-talk partners in the context of the protein-protein interaction network
(3) Visual interpretation of molecular networks[2]
Figure 11 Framework of novel systems biology approach
3
Unlike conventional methods which lack functional integration of data and
effective analysis tools to derive functional relationships between heterogeneous while
related data our studies have the following significance First we have developed a
novel systems biology approach which can identify ldquosignificantly interacting protein
categoriesrdquo This is distinct from the recent approach of using GO annotations for
differentially expressed gene classifications resulting from microarray analysis[3] Our
method can be generalized to enable other similar systems biology studies in which
statistically significant experimental ldquoomicsrdquo results public protein interactome data
and genomeproteome annotation database are integrated into an easy-to-interpret two-
dimensional visualization matrix[2] Second to integrate yeast protein-protein
interaction data from different sources we have created our own metadata for
experimental methods that are used to detect interacting protein pairs (see section 32
in paragraph ldquoProtein Interactome Datardquo) Third we have developed our unique
scoring model (see section 33) to calculate reliability scores for the interacting protein
pairs We applied our scoring model to the combined protein-protein interaction
dataset to calculate a reliability score for each unique interacting pair This enables our
significant protein ranking analysis (see section 310) Fourth we applied a unique
molecular network visual representation scheme to the significant biological process
categories and significant between-category interactions (see section 35 and section 4
for two case studies) Our new approach based analysis will help the life science
researchers validate their discoveries and generate new hypotheses
4
2 BACKGROUND
21 Mass Spectrometry - based Proteomics
Proteomics refers to the branch of discovery science focusing on large scale
analysis of proteins Initially the term proteomics was used to describe the study of
expressed proteins of a genome using a combination of two-dimensional (2D) gel
electrophoresis to separate proteins and mass spectrometry (MS) to identify them
This approach is now referred to as ldquoexpressionrdquo or ldquoglobal profilingrdquo proteomics
However the scope of proteomics has now broadened to include the study of ldquoprotein-
proteinrdquo interactions (protein complexes) referred to as cell-mapping proteomics [4
5] Proteomics complements other functional genomics including microarray
expression profiling systematic phenotypic profiling systematic genetics and small-
molecule-based arrays [6] Compared with genomics proteomics is much more
complicated While the genome is rather stable the proteome differs from cell to cell
and is constantly changing through its biochemical interactions with the genome and
the environment
Mass spectrometry-based proteomics has a distinct application in unraveling the
levels of protein abundance post-translational modifications (eg glycosylation
acetylation phosphorylation and myristoylation) as well as protein-protein
interactions which are the formative drive in a cell Changes in these parameters are
not revealed by measuring mRNA levels Mass spectrometry-based proteomics
provides opportunities to identify target proteins that are differentially regulated under
different conditions It helps biologists elucidate the dynamics of important signaling
and regulatory networks in biological process
211 Mass spectrometry
Mass spectrometry is the method for determining the molecular weight of chemical
compounds by separating molecular ions according to their mass-to-charge ratio (mz)
Mass spectrometers are powerful devices used for this purpose Mass spectrometric
measurements are carried out in the gas phase on ionized analytes A mass
5
spectrometer consists of an ionization source for ion-generation a mass analyzer that
measures the mass-to-charge ratio (mz) of the ionized analytes and a detector that
registers the number of ions at each mz value The ionization source transfers
molecules from solution or solid phase into gas-phase ions that can then be
manipulated within electric or magnetic fields Ionization techniques are critical for
determining what types of samples can be analyzed by mass spectrometry The two
most frequently used ionization techniques are ESI (Electrospray Ionization) and
MALDI (Matrix-Assisted Laser DesorptionIonization) ESI ionizes the analytes out
of a solution and is therefore readily coupled to liquid-based separation tools such as
HPLC MALDI sublimates and ionizes the samples out of a fry crystalline matrix via
laser pulses MALDI-MS is normally used to analyze relatively simple peptide
mixtures whereas integrated liquid-chromatography ESI-MS systems (LC-MS) are
preferred for the analysis of complex samples [7 8]
The mass-analyzer is used to separate gas-phase ions based on their mass-to-charge
(mz) ratios and is central to the technology In the context of proteomics its key
parameters are sensitivity resolution mass accuracy and its ability to generate
information-rich ion mass spectra from peptide fragments (tandem mass or MS-MS
spectra) There are four basic types of mass analyzers currently used in proteomics
research These are the ion trap time-of-flight (TOF) quadrupole and Fourier
Transform ion cyclotron (FT-ICR-MS) analyzers They are very different in design
and performance and each has its own strength and weakness These analyzers can be
stand alone or in some cases put in tandem to take advantage of the strengths of each
[8-11]
Both MALDI and ESI are soft ionization techniques in that ions are created with
low internal energy and thus undergo little fragmentation Mass-to-charge ratios can
be readily and accurately measured for intact ions but this information does not
provide data on the covalent structure of the ion For peptides and proteins in
particular data related to the amino acid sequence of the molecule are desired To
generate this information new configurations of mass spectrometers have been
6
developed to isolate ions fragment them and then measure the mass-to-charge ratio of
the fragments These devices are collectively called tandem mass spectrometers A
tandem mass spectrometer is a mass spectrometer that has more than one analyzer in
practice usually two The two analyzers are separated by a collision cell into which an
inert gas (eg argon henium) is admitted to collide with the selected sample ions and
bring about their fragmentation (collision-induced dissociation or CID) The analyzers
can be of the same or different types the most combinations being quadrupole-
quadrupole magnetic sector-quadrupole and quadrupole-TOF [12 13]
The first analyzer of a tandem mass spectrometer is used to select user-specific
peptide ions from peptide mixtures These chosen ions then pass into the collision cell
and are bombarded by the gas molecules into fragment ions which are then analyzed
The original mass to charge ratio of each ion as well its specific fragment spectrum are
used to search a database of theoretical peptide fragmentation spectra often resulting
in unambiguous peptide identification The data from each of these methodologies is
represented as output peak list files adherent to a specific file format that is dependent
on the instrument used for analysis Programs such as SEQUEST [14] and MASCOT
(httpwwwmatrixsciencecom) correlate the experimentally acquired MSMS spectra
to the computer generated MSMS spectra and produce various scores used to assess
the validity of this correlation Each correlation program uses a different algorithm to
assign peptides and thus each program produces overlapping but variable outputs
Various laboratories have used different approaches to exploit the advantages of both
software algorithms [15] and to validate more thoroughly the results of these
algorithms individually [16 17] It is apparent that no single analysis system has been
universally accepted to date
212 Proteomics data analysis
In a typical mass spectrometry based experiment protein samples are digested by a
protease (usually trypsin) and the resulting peptides can be further separated by liquid
chromatography before directly introduced into MS The peptide fragment masses are
determined by MS which provides a fingerprint of the protein of interest The masses
7
are compared to the predicted proteolytic peptides from sequence databases taking into
account user specified parameters such as the number of missed cleavage sites If
however database searching leads to ambiguous results then further MS analyses
involving the usage of tandem mass spectrometry (MSMS) are undertaken
sequentially on each peptide in the mixture to generate a sequence or partial sequence
known as a sequence tag for these peptides This is frequently achieved by using ESI-
MSMS Further database searching with both the molecular mass of the peptide and
the sequence tag information should lead to unambiguous protein identification[18-20]
Finally the instrument generates an output peak list file in a specific file format
depending on the type of instrument used and an analysis pipeline (Figure 21) can be
used to take the peak list file as input and generate a series of output files
Figure 21 Proteomics data analysis pipeline
213 Proteomics data management tools
The scale and complexity of proteomics data require software tools to facilitate
data management Compared with microarray data management tools there are few
tools available for mass spectrometry proteomics studies Below we summarize most
of the proteomics data management tools This work is based on my previous
publication [21]
PEDRo database tool (httppedromanacuk ) is an open source tool for
proteomics data entry and modeling However it is not a comprehensive query and
analysis tool The PEDRo tool implements the PEDRo data model (Refer to section 3)
which was released early in 2003 The schema of the PEDRo data model is available
8
at the website PEDRo supports an ontology service It stores the XML directly in an
open-source XML storage system Xindice The data are presented to the users by
gathering web pages from the stored XML using XSLT[22 23]
SBEAMS-Proteomics (httpwwwsbeamsorgProteomics ) is one of the modules of
SBEAMS integrated platform developed by ISB that is used for proteomics
experimental data storage and retrieval These experiments can be correlated later
under the same framework The integrated open source system SBEAMS adopts a
relational database management system backend and a web interface front end
Information about the quality of identification can be stored with the data peptides
which could not be properly identified from mass spectra can be flagged and
reanalyzed with additional searches The database schema for SBEAMS-Proteomics is
available at the website (httpwwwsbeamsorgProteomics )
ProteinScape is a commercial client-server platform for proteomics data
management (httpwwwbdalcomproteinscapehtml) It organizes data such as gel
data mass spectra process parameters and search results It can manage gel-based or
LC-based workflows as well as quantitative proteomics ProteinScape also enables
automated analysis through interactions with database search engines such as Mascot
Phenux and Profound ProteinScape‟s relational database system can be Microsoft
SQL or Oracle 91
PROTEIOS (httpwwwproteiosorg) is an mzData-compliant open source client-
server application that implements mass spectrometry data storage organization and
annotation The server is a relational database that can be MySQL Oracle as well as
utilize other alternatives The client side runs as a Java application One of the main
objectives of Proteios is to provide a GUI enabling queries based on experiment data
and annotation data The schematic diagram is available at the website Currently the
input data files must be in XML format It is working on imports of tab-separated files
[24]
9
PROTICdb is a web-based proteomics data management tool used for plant
proteomics data storage and analysis The data can come from 2D-GEL and MS The
data stored can also be in the form of quantitative measurements To support data
interpretation PROTICdb allows the integration of information from the user‟s own
expertise and other sources into a knowledge base It also provides links to external
databases [25]
ProDB is an open source proteomics data management tool
(httpwwwcebitecuni-bielefelddegroupsbrfsoftwareprodb_infoindexhtml) that
can handle data conversion between different mass spectrometer software automate
data analysis and allow the annotation of MS spectra (ie assigning gene names or
storing data on protein modifications) The system is based on an extensive relational
database to store the mass spectra together with the experimental setup [26] The first
release will be available to the public soon
There are several other proteomics data management tools not described here such
as PROTEUS [27] Proteomics Rims (developed by Bruker BioSciences) Xome and
Mass Navigator [28]
22 Ontology-based Gene Annotation and Network-enabled Analysis
221 Proteomics and Systems Biology
The goal of proteomics research is to understand the expression and function of
proteins on a global level It strives to characterize protein structure and function
protein-protein protein-nucleic acid protein-lipid and enzyme-substrate interactions
post-translational modifications protein processing and folding protein activation
cellular and sub-cellular localization protein turnover and synthesis rates and even
alternative isoforms caused by differential splicing and promoter usage In addition
the ability to capture and compare all of this information between two cellular states is
essential for understanding cellular responses Achieving the goals of proteomics is
10
not trivial Adding to the complexity of this field is the need to integrate proteomics
data with other information to fully understand how systems work
Systems biology is a newly emerging field that seeks to analyze the relationships
among elements in a system in response to genetic or environmental perturbations
with the goal of understanding the system or the properties of the system[29]
Therefore systems biology is a holistic approach that seeks to integrate biological data
as an attempt to understand how biological systems function thus being distinct from
a pure omics - based or other bioinformatics methods The present thesis is an attempt
in this direction We captured the proteome difference between cellular states and
integrate this information with information from gene ontology as well as protein
interaction database Thus for the first time it provides an in-depth interpretation at
the molecular signaling network level
In particular our systems biology approach consists of the following three major
elements [2] (1) Omics analyzing mass-spectrometry derived proteomics
experimental data to identify differentially expressed proteins in different genetic or
environmental conditions (2) Ontology annotating the proteomics data based on gene
ontology functional categories (3) Network mapping the proteomic data into protein-
protein interaction network and translating the protein-protein interaction network into
a gene ontology cross-talk network
Figure 22 Major elements of our systems biology approach The lines represent
the tight connections of the elements
Proteomics
(see 211 ~
213)
Gene
Ontology
(see 222)
Protein - Protein
Interaction Network
(see 223 and 32)
11
Figure 22 shows the three major elements of our systems biological approach In
this approach the data from omics experimental results is analyzed against gene
functional categories and gene functional category network It is the first time that the
gene ontology concept has been brought to the molecular context of protein-protein
interaction networks which has been used to interpret the proteomics experimental
result
222 Ontology ndash based gene annotations
From the point of view of systems biology the interpretation of differentially
expressed protein lists identified from proteomics experiments is not a trivial task
Given a set of differentially expressed genes proteins or a set of genes proteins in a
cluster one would often wish to know whether these genes proteins share a common
function subcellular localization metabolic or regulatory pathway In addition to
characterizing the geneprotein set this type of analysis may also reveal information
on new and previously unknown genes in the set This type of work often requires the
mapping of the genesproteins into gene ontology (GO) terms The introduction of
Gene Ontology (GO) as a standardized vocabulary for describing genes gene products
and their biological functions represents an important milestone in the possibilities to
handle and include biological background information in functional genomics and
proteomics analyses
The gene ontology is represented as a network or a bdquodirected acyclic graph‟ (DAG)
in which terms may have multiple parents and multiple relationships to their parents
The controlled vocabularies are structured in levels so that attributes can be assigned
to a gene product at different levels of description depending on how much is known
about this gene product[30] There are three different sets of vocabularies for gene
ontology (1) Molecular function describes the activity of a gene product at the
molecular level It does not provide information about the compounds or locations of
the activity Example of molecular function at level 2 can be binding and at level 3 can
be protein binding The more specific term at level 4 can be transcription factor
binding (2) Biological process describes recognized series of events or molecular
12
functions A biological process is not equivalent to a pathway though some GO terms
do describe pathways Examples of biological process are death at level 3 and cell
death at level 4 (3) Cellular component refers to the location in the cell in which a
gene product exerts its activity Examples are nucleolus organelle and polarisome
Many databases today provide GO annotations for a variety of organisms including
humans yeast and other species
Annotation of genes with GO terms creates a biological knowledge profile in three
layers (biological process molecular function or cellular component) Three common
methods are used to query GO categories by individual gene by gene function and
by using a list of genes [31] Translation of the differentially expressed geneprotein
list into a functional profile helps biologist get insight into the cellular mechanisms
relevant to a given condition Therefore it has been widely used in the analysis of
functional genomics and proteomics studies [32-36]
The ontological analysis of gene expression or proteomics data usually follows the
following steps (1) Prepare the gene or protein list of interest (2) Prepare reference
gene or protein list which is used to calculate P-values against (3) Map both lists
(interested list and reference list) to GO categories (4) Select statistical model The
gene ontology analysis can be performed with a number of statistical models including
hypergeometric binomial Fisher‟s exact test and chi-square These tests are
discussed in detail in [37] (5) Find significantly enriched GO categories in your list of
interest using the selected statistical model (6) Perform corrections for multiple
comparisons When many genesproteins are analyzed at the same time some
significance will happen by chance The multiple comparison corrections control the
overall probability of making a Type I error Many different statistical methods have
been published to perform this kind of correction for example Bonferroni correction
[38] FDR [39] and permutation correction [40] Each method has its unique feature
(7) Interpret the result in terms of the biological significance
13
The statistical evaluation of enriched GO categories enables to highlight the most
significant biological characteristics of a gene or protein set therefore allows us to
mine knowledge from data In recent years many tools have been developed to
automate the gene ontology analysis Table 21 lists some popular GO analysis tools
the statistical models the tools used multiple comparison correction methods
implemented and the GO visualization view
Table 21 Gene Ontology analysis tools
Tool Statistical model Multiple comparison
corrections
GO
visualization
WebGestalt[41] Hypergeometric test
Fisher‟s exact test
NA Tree bar chart
DAG
GeneMerge[42] Hypergeometric Bonferroni No tree view
CLENCH[43] Chi-square test Binomial
Hypergeometric
NA DAG
GOSurfer[44] Chi-square test FDR Tree
Onto-
Express[45]
Chi-square test Binomial
Hypergeometric Fisher‟s
exact test
Bonferroni Holm
Sidak
Tree
GOToolBox[46] Binomial Hypergeometric
Fisher‟s exact test
Bonferroni
HolmFDR Hochberg
Hommel
NA
Onto-
Express[45 47]
Binomial Hypergeometric
Chi-square test
Bonferroni Holm
Sidak FDR
Tree bar chart
GO Term
Finder[48]
Binomial NA Tree
The ontology-based omics data analysis approach enables researchers to find out
enriched functional categories involved in the experimental conditions While
biological systems contain large number of different genes and proteins that are
14
interacted with each other it is necessary to develop an approach to bring the
ontology-based omics data analysis to the interaction network This integrated
approach will definitely benefit the biologists to obtain more insight for biological
phenomena
223 Protein interaction network- based analysis
A discrete biological function is rarely attributable to an individual protein [49]
Instead most biological characteristics arise from complex interactions between the
cell‟s numerous constituents such as proteins DNA RNA and small molecules In
particular the network of protein-protein interactions also referred to as interactome
forms a backbone of signaling pathways metabolic pathways and cellular processes
for normal cell function Protein interaction network analysis provides an effective
way to understand the relationships between genes It places the genes identified in
functional genomics and proteomics experiments in a broader biological context
thereby facilitating the understanding of the structure and function of a living cell
The network-based analysis has been enabled by the recent elucidation of large-
scale protein interaction networks in different species including S cerevisiae
(yeast)[50-53] D melanogaster (fly)[54] C elegans (worm)[55] and H sapiens
(human)[56 57] )[56 57] Collections of these protein interactions representing a
subset of the whole interactome are stored in various data repositories as the Database
of Interacting Proteins (DIP) (ref) the Biomolecular Interaction Database (BIND)
The Molecular INTeraction Database (MINT) InAct the human Protein Reference
Database (HPRD) and the Online Predicted Human Interaction Database (OPHID)
[58] The protein network-based analysis has been utilized for the analysis of
functional genomics experiments recently [59 60]
The most comprehensive database for a human protein network is the Online
Predicted Human Interaction Database (OPHID) [58] OPHID is a web-based database
of predicted interactions between human proteins It combines the literature-derived
human protein-protein interactions from BIND (Biomolecular Interaction Network
15
Database) HPRD (Human Protein Reference Database) and MINT (Molecular
Interactions Database) with predictions made from Saccharomyces
cerevisiae
Caenorhabditis elegans Drosophila melanogaster
and Mus musculus OPHID
catalogs 16034 known human PPIs obtained from BIND MINT and HPRD and
makes predictions for 23889 additional interactions[58]
It is designed to be both a
resource for the laboratory scientist to explore known and predicted protein-protein
interactions and to facilitate bioinformatics initiatives exploring protein interaction
networks It should be noted that OPHID predicted human interaction are hypothetical
and are likely to have some false positives as well as missing protein interactions
However it was claimed that approximately half of the predicted interactions using
interlogs between microorganisms can be experimentally validated [61]
Table 22 Leading protein interaction databases
Name Description
Online Predicted Human Interaction Information about known human PPIs from Database
(OPHID) httpophidutorontocaophid BIND MINT and HPRD as well as large
number of predicted human PPIs
Human Protein Reference Database Manually curated and extracted from literature
(HPRD) httpwwwhprdorg for human PPIs
Saccharomyces Genome Database Comprehensive database that contains genetic
(SGD) httpwwwyeastgenomeorg and physical interactions for yeast proteins
More than 90 interactions come from GRID
General Repository for Interaction Genetic and physical interactions for yeast fly
Datasets (GRID) and worm proteins Interactions data comes from
httpbiodatamshrioncagrid literature BIND and MIPS including several
genomeproteome-wide studies
Biomolecular Interaction Network Physical biochemical genetic interactions and
Database (BIND) interactions between DNA RNA proteins small
httpwwwiscorgindexplswbind molecules including interactions from human yeast
mouse rat and many other species
Human Annotated Protein Protein Database that contains protein interactions from
Interaction (HAPPI) String OPHID and HPRD
httpbioinformaticsiupuieduHAPPIindexstm
16
On the other hand SGD (Saccharomyces Genome Database) is a scientific
database of the molecular biology and genetics of the yeast Saccharomyces cerevisiae
which is commonly known as Bakers or budding yeast Besides protein-protein
interaction datasets SGD also contains genes and proteins sequence information
descriptions and classifications of their biological roles molecular functions and
subcellular localizations and links to literature information (see table 22) [62-64]
More than 90 of the interactions stored in SGD come from GRID BIND
(Biomolecular Interaction Network Database) is the database that stores the
interactions between DNA RNA proteins and small molecules for many species
including yeast [65-67] Table 22 lists the information for the leading protein
interaction databases
The protein network-based analysis has been considered as one of the most
important elements of the systems biology approach Protein network analysis place
the genes identified in microarray experiments or differentially expressed proteins
detected in mass-spectrometry experiments in a global biological context Protein-
protein interaction networks reflect the functional grouping of these coordinated
genesproteins It enables the study of the roles of subsets of genesproteins
A few papers published recently reported mapping the differentially expressed
protein lists identified through microarray or proteomics experiments into protein-
protein interaction database such as OPHID Using the network-based analysis Wachi
et al found that the genes differentially elevated in cancer as obtained from
microarray profiling data are well connected[60] In this study genes in the array
were mapped onto OPHID using gene symbols and protein sequences Connectivity
analysis was performed for the protein network constructed Then k-core analysis was
conducted where less connected nodes were removed in an iterative way This
resulted in a series of subgraphs that gradually revealed the globally central region of
the original network Using k-core analysis the authors measured how differentially
expressed genes were close to the topological center of the protein network Centrality
17
of the genes is associated with the essential functions of the genes in the yeast The
analysis concluded that squamous cell lung cancer genes share similar topological
features for essential proteins
Calvano et al recently performed a network analysis of systematic inflammation in
humans [68] Gene expression patterns in human leukocytes receiving an
inflammatory stimulus were first analyzed using genome-wide microarray analysis
Genes significantly perturbed after stimulus were identified using significance analysis
of microarray method which controls the false discovery rate to less than 01 To
identify significant pathways in a biological process the differentially expressed genes
were overlaid onto the interactome the Ingenuity Pathways Knowledge Base (KB)
which is the largest curated database of previously published findings on mammalian
biology from the public literature Target genes were identified as the subset having
direct interactions with other genes in the database The specificity of connections for
each target gene was calculated by the percentage of its connections to other
significant genes Pathways of highly connected genes were identified by likelihood
Using this strategy the authors demonstrated that upon acute systematic inflammation
the human blood leukocyte response includes widespread suppression at the
transcriptional level of mitochondria energy production and protein synthesis
machinery
Said et al [69] used protein interaction networks to analyze the phenotypic effects
in yeast Toxicity-modulation non-phenotypic classifications and high-throughput
genomic phenotyping were conducted Networks that represented a phenotypically
annotated interactome of essential toxicity-modulating and no-phenotype proteins
were constructed The analysis showed interesting results For example
toxicologically important protein complexes pathways and modules were identified
which have potential implications for understanding toxicity-modulating processes
relevant to human diseases
18
In other studies Seiden-Long et al integrated the microarray datasets with OPHID
and found six of the target genes by HGFMetRAS signaling belong to a hypothetical
network of function at the protein level [70] Motamed-Khorasani et al found that six
of the total of 17 androgen-regulated genes could be mapped into OPHID database
Five of the six genes are networked within two interacting partners [71]
The current project will integrate the three elements proteomics ontology and
network and perform ontology-driven and network-enabled systems biology case
studies The following sections will describe the details of our methods and results
19
3 METHODS
All methods related to ovarian cancer study in this section were based on the
published methods and private communications with Dr Chen Dr Shen and Dr
Wang I am one of the primary contributing members (Chen J Yan Y Shen C
Fitzpatrick D Wang M A Systems Biology Case Study of Ovarian Cancer Drug
Resistance JBCB 2007[2]) Method in 322 was kindly provided by Dr Shen who
developed a statistical model to identify differentially expressed proteins as one of the
inputs of my case study 2 Ovarian cancer proteomics experimental methods in
section 311 were kindly provided by Dr Mu Wang Yeast proteomics experimental
methods in section 312 were kindly provided by Josh Heyen Tables 31 ~ 33 were
based on discussion with Dr Goebl and Josh Heyen where I am one of the
contributors The use of the materials was granted with the permission from
participating contributors
31 Proteomics Method
311 Ovarian cancer drug resistance proteomics method
A2780 and 2008 cisplatin-sensitive human ovarian cancer cell lines and their
resistant counterparts A2780CP and 2008C13525 were used in the ovarian cancer
drug resistant study Proteins were prepared and subjected to LCMSMS analysis as
described in [72] There were two groups (two different parent cell lines) six samples
per cell line and two HPLC injections per sample Samples were run on a Surveyor
HPLC (ThermoFinnigan) with a C18 microbore column (Zorbax 300SB-C18 1mm x
5cm) All tryptic peptides (100 L or 20 g) were injected onto the column in random
order Peptides were eluted with a linear gradient from 5 to 45 acetonitrile
developed over 120 min at a flow rate of 50 Lmin Fluant was introduced into a
ThermoFinnigan LTQ linear ion-trap mass spectrometer The data were collected in
the ldquotriple-playrdquo mode (MS scan Zoom scan and MSMS scan) The acquired data
were filtered by proprietary software and Database searching against International
Protein Index (IPI) database NR-Homo Sapiens database was carried out using both
SEQUEST and XTandem algorithms Protein quantification was carried out using the
20
LCMS-based label-free proprietary protein quantification software licensed from Eli
Lilly and Company [72] Briefly once raw files are acquired from the LTQ all
extracted ion chromatogram (XIC) is aligned by retention time Each aligned peak
should match parent ion charge state daughter ions (MSMS data) and retention time
(within a one-minute window) If any of these parameters were not matched the peak
will be disqualified from the quantification analysis The area-under-the-curve (AUC)
from individually aligned peak was measured normalized and compared for their
relative abundance All peak intensities were transformed to a log2 scale before
quantile normalization [73] If multiple peptides have the same protein identification
then their quantile normalized log2 intensities were averaged to obtain log2 protein
intensities The log2 protein intensity is the final quantity that is fit by a separate
ANOVA statistical model for each protein log2 (Intensity) = overall mean + group
effect (fixed) + sample effect (random) + replicate effect (random) Group effect refers
to the effect caused by the experimental conditions or treatments being evaluated
Sample effect is caused by random effects from individual biological samples It also
includes random effects from sample preparation The replicate effect refers to the
random effects from replicate injections of the same sample All of the injections were
in random order and the instrument was operated by the same operator The inverse
log2 of each sample mean was determined to resolve the fold change between samples
312 Yeast Grr1 knock-out proteomics method
For the yeast Grr1 knock-out study a customized SILAC approach was used to
perform mass labeling Scerevisiae strain DBY2059 (Mat α leu2-3) was cultured
overnight to stationary phase in two replicate 10ml batches of modified SD media
consisting of 2 glucose 5 glutamine and 05 mgml C613
leucine (Cambridge
Isotope Laboratories Inc Andover MA USA) Concurrently strain JH001 (Mat A
grr1ΔNat) was also cultured overnight to stationary phase in two replicate 10ml
batches of the same media supplemented with C612
leucine Each 10ml culture was
then used to inoculate a 500ml culture of the same media and cells were grown for
nine population doublings to mid-log phase (~5x10⁶ cellsml) Cell density was
determined by cell counting using a hemacytometer (Reichert BuffaloNY USA)
21
Cells were harvested by centrifugation in a Beckman JA-14 rotor at 4000 X G for 10
minutes washed three times in ice cold water and immediately re-suspended in 5ml
of extraction buffer [8M Urea 01M Ammonium Bicarbonate] Cells were then
immediately flash frozen in liquid nitrogen and stored at -80C overnight Protein
extract was prepared the following day by manual bead beating using 300 um acid
washed glass beads (Sigma StLouis MO) Specifically samples were subjected to 10
cycles consisting of 30 seconds on ice and 30 seconds of vortexing in the presence of
glass beads Glass beads and cellular debris were then spun down at 2000 X G and the
supernatant was placed in 15ml conical tubes Protein concentrations were determined
using the Bradford protein assay and protein samples were mixed in a 11 ratio
(DBY2059 C613
leucine JH001 C612
leucine) producing two replicate protein mixes
from four independently grown batch cultures Each protein mixture was diluted with
100mM Ammonium Bicarbonate to a final Urea concentration of 4M Protein
disulfide bond reduction was carried out by adding a 40 fold molar excess of
Dithiothreitol (DTT) to each protein mixture followed by a three hour incubation at
36C Reduced protein mixtures were then alkylated using a 180 molar ratio of protein
to iodoacetamide (IAM) followed by incubation on ice in complete darkness for 2
hours The reduced and alkylated protein mixture was then diluted to 2M Urea using
an equal volume of 100mM ammonium bicarbonate and subjected to trypsin digestion
using 2 (weightweight) of TPCK-treated trypsin Digestion was carried out at 37C
for twenty four hours Peptide samples were then dried down in a speed-vac and
resuspended in a buffer consisting of 5 Acetonitrile 95 EMD water 0025
Formic Acid and 00025 HFBA
The two replicate peptide mixtures were analyzed 3 times each through an
automated de-salt2DLCMS system Peptide De-salting and separation were
performed in tandem using the Paradigm MG4 HPLC System (Michrom Biosciences
Inc) Initially approximately 150ug of the tryptic peptide mixture was loaded directly
onto a C-18 microtrap (Michrom Biosciences Inc) and desalted by flushing the trap
with 20 column volumes of mobile phase A (2 Acetonitrile 98 Water 0025
Formic Acid) at a flow rate of 50 ulmin Peptides were then eluted onto an SCX
22
microtrap (Michrom Biosciences Inc) using 20 volumes of mobile phase B (98
Acetonitrile 2 Water 0025 Formic Acid 0001 HFBA) Peptides were then
bumped off the SCX microtrap in a stepwise fashion using increasing concentrations
of Ammonium Formate Ten steps were used in our analysis of 0 4 8 12 15 18 21
25 50 and 100 mM Ammonium Formate followed by two identical steps of 1M
Ammonium Formate Each population of peptides were eluted off the SCX micro-trap
onto a C8 nano-trap (Michrom Biosciences Inc) coupled directly to a hand packed
C18 column with a hand pulled tip A home made high pressure bomb was used to
pack 15 cm of 5um-100 angstrom Magic C18 resin (Michrom Biosciences Inc)
Peptides were then eluted off this column at 500nlmin using an Acetonitrile gradient
from 5-50 and analyzed by an LTQ Mass Spectrometer (Thermo Electron
Corporation) on the fly
The LTQ-MS was set for data dependent MSMS acquisition with a total ion count
threshold of 1000 Dynamic exclusion was used to only collect two MSMS spectra on
a single parent ion every 45 seconds Two types of data collection were performed in
this analysis termed gas phase fractionation and full scan analysis Typically the
LTQ-MS is set to scan across an mz range from 500-2000 throughout the course of
the analysis This type of analysis was done in replicate for both replicate peptide
mixtures culminating in four 12 step full scan analyses Each of the peptide mixtures
was also subjected to a single gas phase fractionation analysis This analysis is
essentially equivalent to three full scan analyses but the mass spectrometer is set to
scan 13 of the mz scan range This allows for greater mz resolution and increased
peptide detection sensitivity due to the fact MSMS spectra are being collected for a
smaller fraction of the peptide population eluting from the column However this
process is time consuming given that three separate analyses must be performed to
acquire data across the whole scan range and thus we only conducted a single gas
phase analysis for each peptide mixture The scan ranges for gas phase fractionation
were 500-1000 mz 900-1500 mz and 1400-2000 mz In all each of the two
replicate peptide mixes were loaded and analyzed five times through the 2D-LC-MS
system for a total of ten different runs
23
Peptide assignments for experimental MSMS spectra were made using the
SEQUEST program (Thermo Electron Corporation) The 12 raw files generated for
each run are run individually through the SEQUEST software Peptide assignments
were then analyzed for validity using a suite of software available from the Institute
for Systems Biology termed the Trans-Proteomic Pipeline This analysis toolkit
provides computational tools that validate peptide assignments (Peptide Prophet)
protein assignments (Protein Prophet) and quantify relative peptide and protein
abundance ratios (ASAPRatio) It is important to note that prior to analysis through
the TPP the 12 raw files are combined into a single mzXML using the TPP This
mzXML file captures raw parent MS spectra for use in quantification by the program
ASAPratio The SEQUEST output files are converted to summaryhtml files that are
readable by the programs Peptide Prophet and Protein Prophet All the individual raw
files and SEQUEST out files for a given analysis are analyzed together through the
TPP to calculate the most accurate peptide probabilities protein probabilities and
ratios for a given analysis
32 Preparation of Datasets
321 Proteins in differentially expressed cisplatin-resistant vs cisplatin-sensitive
ovarian cancer cells
The protein quantification data was stored in Oracle schema Sysbio (see appendix
1) 574 differentially expressed proteins with q-value (false discovery rate) lt=010
both up- and down-regulation values or 141 proteins (with q-value lt=005) were
generated by mass spectrometry based proteomics experiment Proteins were mapped
into IPI database IDs These IPI identifiers were converted into UniProt IDs in order to
integrate this data set with all other annotated public data 119 of the 141 proteins
(005 q-value threshold) were successfully mapped and converted (see appendix 2)
using the International Protein Index (IPI) database[74] downloaded in February 2006
the UniProt database downloaded in November 2005[75] and additional internally
curated public database mapping tables Similarly 451 out of the 574 proteins with the
less strict threshold (q-value lt=010) were mapped from IPI IDs to UniProt IDs
24
322 Differentially expressed proteins identified from Grr1 knock-out yeast vs
wild-type yeast
For each protein identified in mass spectrometry experiment there are two
measures (i) the probability that the identification is correct (output from
ProteinProphet) and (ii) the relative abundance ratio and its standard error (output
from ASAPratio)
Since some proteins might be identified by more than one experiment one can
improve the reliability and accuracy of the two measures by combining the estimates
from each experiment If a protein is identified by k experiments labeled r1 r2hellip rk
then the summarized probability is calculated as
1
1 (1 )i
k
id r
i
P P
Where ir
P is the probability measure from experimentir
To summarize the estimate of the relative abundance ratio we use a linear
combination of the estimate at the log10 scale from each experiment The weight is
determined so that the summarized estimate has the lowest standard error among all
possible linear combinations Then the z-score is calculated by dividing the
summarized estimate by its standard error for each protein The local false discovery
rate approach proposed by Effron[76] is applied to the z-scores to calculate the
probability that the relative abundance ratio is different from 1 (ratioP ) Finally we take
id ratioP P P as the final confidence measure that a protein is differentially expressed
between the two samples In other words to be claimed as ldquodifferentially expressedrdquo
a protein needs to have high confidence in its identification and high confidence in its
differential abundance 184 proteins were selected (Combined Probabilitygt=08) from
Grr1 knock-out vs wild-type yeast mass spectrometry experiment (see appendix 3)
25
323 Protein interactome data
The primary source of human data comes from the Online Predicted Human
Interaction Database (OPHID) [58] which were downloaded in February 2006 It
contains more than 47213 human protein interactions among 10577 proteins
identified by UniProt accession numbers After mapping the proteins in OPHID to
UniProt IDs we recorded 46556 unique protein interactions among 9959 proteins
Note that even though more than half of OPHID entries are interacting protein pairs
inferred from available lower organisms onto their human orthologous protein pair
counterparts the statistical significance of these predicted human interactions was
confirmed by additional evidences according to OPHID and partially cross-validated
according to our previous experience [77] We assigned a heuristic interaction
confidence score to each protein interaction based on the type and source protein
recorded in OPHID according to a method described in [77] We call this data set PiD0
49
12
39BIND ONLY
SGD ONLY
BIND AND SGDOVERLAPPINGS
Figure 31 Yeast interactome data source from BIND and SGD The percentages
show the proportion of the non-redundant interacting pairs of each category among the
combined non-redundant interacting pairs from BIND and SGD
The source of yeast interactome data was the Saccharomyces Genome Database
(SGD) [58] Biomolecular Interaction Network Database (BIND) and a small set of
in-house manually curated data by our biology group (Goebl) The data from SGD and
26
BIND were downloaded in February 2006 Figure 31 summarized the percentage of
overlappings of the interactome data from SGD and BIND A total of 25418 non-
redundant interactions were obtained after combining the 3 interactome datasets and
the intensive processing (see Figure 32 for the data processing flow chart) We call
this interactome dataset SBG Non-redundant interactions are defined as the
interactions that only contain unique interacting pairs The same interaction detected
by different methods or published in different papers is counted as one unique pair
For each interacting pair in SBG we calculated a reliability score based on the scoring
model developed (see section 33)
Figure 32 Interactome data integration flow chart
27
324 Noise-introduced human protein interactome data
To test how robust the final computational results would hold up against noise
which is commonly believed to exist in large portions of the public protein interaction
data set we generated two additional human protein interaction data sets PiD-a20 and
PiD-r20
For PiD-a20 we add ldquoprotein interaction noiserdquo by randomly connecting protein
pairs from the set of 9959 unique proteins for as many times as necessary to
eventually generate 120 46556= 55869 unique interactions Therefore we
generate 20 new and unique ldquonoisyrdquo interactions in the PiD-a20 data set
For PiD-r20 we eliminate ldquoprotein interaction noiserdquo by randomly removing
protein interaction pairs from the total 45556 initial pairs of protein interactions in
PiD0 to eventually reduce the total number of protein interactions down to (1-20)
46556= 37243 Therefore 80 of original interactions are kept intact in the PiD-r20
data set
325 Gene annotation data
The human gene annotation database was downloaded from
httpwwwgenmapporg in January 2006 The whole annotation database (in MS
Access) was then migrated to Oracle 10g Human proteome GO annotation was
performed based on human gene GO annotation and human gene ID to protein
UniProt ID mappings
The yeast gene annotation database was downloaded from wwwgenmapporg in
January 2006 This database (in MS Access) was migrated to Oracle 10g We also
downloaded additional annotation datasets from other websites such as
httpwwwyeastgenomeorg in January and February Based on these datasets we
designed and implemented our yeast gene annotation database (see Figure 33) Yeast
28
proteome GO annotation was performed based on yeast gene GO annotation and yeast
gene ID to ORFs mappings curated internally
Figure 33 ERD diagram of yeast annotation database stored in Oracle 10g
326 Interacting protein categorical annotation data
Each GO term from the human or yeast protein annotation data was annotated with
its minimal GO level number in the GO term hierarchy Each GO term‟s higher-level
parent GO terms (multiple parent GO terms are possible) up to GO level 1 (three GO
terms at this level molecular function cellular components and biological processes)
29
are also traced and recorded in an internally curated GO annotation table When
calculating interacting protein GO category information we use this internally curated
GO term table to map all the low-level GO term IDs (original GO Term ID) used to
annotate each protein to all the GO term IDs‟ high-level GO term IDs (folded GO
Term ID) For this study we designate that all the folded GO term ID should be at GO
term hierarchy Level = 3 Note that our method allows for multiple GO annotation
Term IDs (original or folded) generated for each protein ID on purpose Therefore it
is possible for a protein or a protein interaction pair to appear in more than one folded
GO term category or more than one folded GO term interacting category pairs
33 Protein-Protein Interaction Scoring Model
The reliability score of a pair of interaction can be assigned based on what
experimental methods detected the interaction how many different methods were used
and how many different papers have published the same interaction
Our scoring model was developed in 3 steps
First we mapped the interaction methods stored in SGD (see table 31) or BIND
(see table 32) into certain codes for SGD the code begins with ldquosrdquo for BIND the
code begins with ldquobrdquo Then we created our metadata (see table 33) to unify the
experimental methods for interacted pairs stored in SGD and BIND We created the
code for the unified method which begins with ldquoGrdquo For each unified term a
reliability score was assigned based on the characteristics of the experimental method
Generally interactions identified from low throughput experiments are more reliable
than from high throughput experiments for example the method ldquoTwo Hybridrdquo was
assigned the lowest score ldquo01rdquo Based on this an interaction pair j identified by
experimental method i can be assigned a base score of S0ji
(2) For interaction pair j a specified experimental method i can associate with certain
number (Cji) of unique PubMed IDs A maximum number of publications can be
calculated among all methods for the same pair of interaction The adjusted rate ji
30
for experimental method i of a certain interacted pair j can be calculated as (see figure
34)
110
max(max 1 1)
Cjiji
Cji
(Where j denotes the jth unique interaction pair i denotes the ith experimental method)
The adjusted score for experimental method i of a specified interaction pair j can be
calculated as (see figure 34)
S ji = S0ji ( 1+ ji)
Figure 34 Protein interaction reliability score calculation algorithm and
formulas PMID stands for PubMed ID
(3) Similar to [78] we combine Sj1 Sj2 hellip Sji hellip Sjn and calculate a final score Sj
for the specified interaction pair j (see figure 34)
31
1
1 (1 )n
j ji
i
S S
Table 31 Experimental methods for interacting pairs stored in SGD
SGD Method Code SGD Method
s1 Affinity Capture-MS
s2 Affinity Chromatography
s3 Affinity Precipitation
s4 Biochemical Assay
s5 Dosage Lethality
s6 e-map
s7 Purified Complex
s8 Reconstituted Complex
s9 Synthetic Growth Defect
s10 Synthetic Lethality
s11 Synthetic Rescue
s12 Two-hybrid
Table 32 Experimental methods for interacting pairs stored in BIND
BIND Method Code BIND Method
b1 (Blank)
b2 affinity-chromatography
b3 autoradiography
b4 colocalization
b5 competition-binding
b6 cross-linking
b7 deuterium-hydrogen-exchange
b8 electron-microscopy
b9 electron-spin-resonance
b10 elisa
b11 equilibrium-dialysis
b12 far-western
b13 fluorescence-anisotropy
b14 footprinting
b15 gel-filtration-chromatography
b16 gel-retardation-assays
32
b17 hybridization
b18 immunoblotting
b19 immunoprecipitation
b20 immunostaining
b21 interaction-adhesion-assay
b22 light-scattering
b23 mass-spectrometry
b24 membrane-filtration
b25 monoclonal-antibody-blockade
b26 not-specified
b27 other
b28 phage-display
b29 resonance-energy-transfer
b30 sucrose-gradient-sedimentation
b31 surface-plasmon-resonance-chip
b32 three-dimensional-structure
b33 transient-coexpression
b34 two-hybrid-test
Table 33 Metadata for experimental methods
SGD and BIND
Method Code Code Unified Term Reliability Score
b2 s1 s2 s3 b19 G1 Affinity_Purification 08
b6 G2 Cross_Linking 05
b10 G3 Elisa 07
b28 G4 Phage_Display 01
b29 G5 Resonance_Energy_Transfer 04
b34 s12 G6 Two_Hybrid 01
s6 G7 E_Map 08
s9 s10 G8 Synthetic_Growth_Defect 08
s11 G9 Synthetic_Rescue 08
s7 G10 Purified_Complex 08
s5 G11 Dosage_Lethality 08
s4 G12 Biochemical_Assay 08
s8 G13 Reconstituted_Complex 06
33
b3 b4 ~ b9 G99 Other 01
b11 b12 ~ b18 G99 Other 01
b20 b21 ~ b27 G99 Other 01
b1 b30 ~ b33 G99 Other 01
34 Network Expansion
We derive differentially expressed protein interaction sub-network using a nearest-
neighbor expansion method described in [77] We call the original list of differentially
expressed proteins (119 proteins in ovarian cancer study or 184 proteins in yeast Grr1
knock-out study) seed (S) proteins and all the protein interactions within the seed
interactions (or S-S type interactions) After expansion we call the collection of seed
proteins and expanded non-seed (N) proteins sub-network proteins (including both S
and N proteins) we call the collection of seed interactions and expanded seed-to-non-
seed interactions (or S-N type interactions) sub-network protein interactions (including
both S-S type and S-N type interactions) Note that we do not include non-seed-to-
non-seed protein interactions (or ldquoN-Nrdquo type interactions) in our definition of the sub-
network primarily because the N-N type of protein interactions often outnumbered
total S-S and S-N types of protein interaction by several folds with molecular network
context often not tightly related to the initial seed proteins and seed interactions The
only occasion to consider the N-N type interactions is when we calculate sub-network
properties such as node degrees for proteins in the sub-network
35 Network Visualization
We use Spotfire DecisionSite Browser 72 to implement the 2-dimensional
functional categorical crosstalk matrix for human ovarian cancer drug resistance study
To perform interaction network visualization we used ProteoLens[79] ProteoLens
has native built-in support for relational database access and manipulations It allows
expert users to browse database schemas and tables query relational data using SQL
and customize data fields to be visualized as graphical annotations in the visualized
network
34
36 Network Statistical Examination
Since the seed proteins are those that are found to display different abundance level
between two different cell lines via mass spectrometry one would expect that the
network ldquoinducedrdquo by them to be more ldquoconnectedrdquo in the sense that they are to a
certain extent related to the same biological process(es) To gauge network
ldquoconnectivityrdquo we introduced several basic concepts We define a path between two
proteins A and B as a set of proteins P1 P2hellip Pn such that A interacts with P1 P1
interacts with P2 hellip and Pn interacts with B Note that if A directly interacts with B
then the path is the empty set We define the largest connected component of a
network as the largest subset of proteins such that there is at least one path between
any pair of proteins in the network We define the index of aggregation of a network
as the ratio of the size of the largest connected component of the network to the size of
the network by protein counts Therefore the higher the index of aggregation the
more ldquoconnectedrdquo the network should be Lastly we define the index of expansion of
a sub-network as the ratio of S-S type interactions among seed proteins over all seed
and expanded sub-network interactions (S-S and S-N types) The higher the index of
expansion the more relevant roles seed proteins plays in the network
To examine the statistical significance of observed index of aggregation and index
of expansion in expanded protein networks we measure the likelihood of the topology
of the observed sub-network under random selection of seed proteins This is done by
randomly selecting 119 proteins (in ovarian cancer study) or 184 proteins (in yeast
Grr1 knock-out study) identifying the sub-network inducedexpanded and calculating
sub-network indexes accordingly The same procedure is repeated n=1000 times to
generate the distribution of the indexes under random sampling with which the
observed values are compared to obtain significance levels (for details refer to [77])
37 Significance of Testing of GO Categories and GO-GO Categories
To assess how significantly the seed proteins (119 in human study and 184 in yeast
study) in the subnetwork are distributed across their specific GO function categories
35
we hypothesize the task as observing the outcome of a random draw of the same
number of proteins from the pool of proteins in the whole interacting network (9959
proteins in human study and 5240 in yeast study) Then the count in a certain GO
category follows a hypergeometric distribution A p-value is calculated based on the
hypergeometric distribution to evaluate the likelihood that we observe an outcome
under random selection of a subset of proteins (119 in human and 184 in yeast) that is
at least as ldquoextremerdquo as what we have observed Note ldquoextremerdquo either implies an
unusually large (over-representation) or usually small (under- representation) number
Let x be the count of the seed proteins that falls in a function category in the
subnetwork n is the sample size (119 in human study or 184 in yeast study) N is the
population size (9959 in human study or 5240 in yeast study) and k=corresponding
count in OPHID then the p-value for overunder-representation of the observed count
can be calculated as
Over representation
Under representation
We also expand the protein list from the 184 seed proteins to 1251 sub-network
proteins in yeast study and calculate a p-value for randomly drawing of 1251 proteins
from the pool of 5240 proteins in SBG based on its hypergeometric distribution
Similarly we can use the above formula to assess how significantly the protein
interactions from the seeded subnetwork are distributed across specific GO-GO
functional interaction categories For a GO-GO functional interaction category we
refer to a pair of GO categories which are derived by aggregating all the protein-
protein interaction pairs with the same pairing of GO annotation categories for the
0
Pr[ | ] x
i
k N k Np X x n N k
i n i n
min( )
Pr[ | ] n k
i x
k N k Np X x n N k
i n i n
36
interacting proteins For example if 3 protein interactions share annotation category A
in one side of the interaction and annotation category B in the other side of the
interaction we say that A-B is a functional interaction category with an observed
count of 3 To identify significant GO-GO functional interaction category in the
seeded subnetwork we hypothesize the task as the observing the outcome of a random
draw of 1723 pairs from the pool of 46556 pairs in OPHID in human study (or
random draw of 1698 pairs from the pool of 25418 pairs in SBG in yeast study)
Then the count of a certain GO-GO function interaction category follows a
hypergeometric distribution A p-value for overunder-representation of the observed
count can be calculated similarly based on the hypergeometric distribution Since tests
of overunder representation of various categories are correlated with one another
(over representation of one category could imply under representation of other
categories) we also control the false discovery rate (FDR) using method developed by
Benjamini and Yekutieli[80]
38 Validation of Under-Represented GO Categories
Figure 35 Illustration showing the overlap of 9959 OPHID proteins and 4333
proteins detected by MS experiments 119 seed proteins is a high-confidence subset
of the overlapped proteins
Proteomics techniques are generally known for problems with false positives and
false negatives primarily for reasons such as complex digested peptide samples noisy
un-separated peptide peaks and computationally intensive proteinpeptide
9959 OPHID proteins
3690 proteins in both
OPHID and MS
4333 proteins detected
by MS
119
seed
proteins
37
identifications that cannot afford to take all post-translational modifications into
account Since we control false positives by choosing 119 high-confidence seed
proteins in this study false negatives instead of false positives are a potential concern
Therefore when we interpret over-under- representation of proteins in GO functional
categories or GO-GO functional interaction categories over-representation results are
likely under-exaggerated and will remain true but under-representation results are
likely over-exaggerated and needs additional validation or some adjustment
We take 4333 of all reported proteins which includes proteins identified with both
high and low confidence from the MS search software and overlap this set with all
the 9959 proteins found in OPHID Out of 4333 raw UniProt IDs 3690 of which can
be further mapped to OPHID interaction human database The 3690 is then assumed
to be the upper limit of instrumentsoftware detectable proteins When re-examining
over-under- representation GO functional categories we let n=3690 N=9959
k=corresponding count in OPHID and use the same formula introduced in section 26
to calculate significant protein overunder- representation This relationship is
illustrated in Figure 35
39 Drill-Down of Significant Categories
Once certain GO functional categories or GO-GO functional interaction categories
are determined to be significant they become candidates for subsequent ldquodrill-downrdquo
examinations For drill-down of GO functional categories we refer to exploration of
the next-level GO functional annotation by tracing down the GO structure and re-
calculating the significance value based on each protein‟s new next-level GO
functional annotation labels using methods described in section 26 For drill-down of
GO-GO functional categories we refer to exploring the next-level GO-GO functional
annotations by tracing both proteins of the interaction pair down the GO structure and
re-calculating the significance value The new next-level GO-GO functional
annotation categories consist of all paired combinations of sub GO functional
categories The use of drill-down allows us to zoom in our attention to detailed
biologically interesting categories to obtain further insights in enriched molecular
38
functions and biological processes without incurring a huge computational cost at the
very beginning of the exploration
310 Scoring of Significant Proteins in the Sub-Network
Protein ranking analysis was performed in MS Access front-end database which
connects to the Oracle back-end database First 184 differentially expressed proteins
were imported (with replacement) into linked Oracle table from the application
interface (see Figure 36 ) after correct login information was verified then the
application automatically create the sub-network data by querying the linked Oracle
SBG interactome dataset We calculated ranking scores for the significant proteins in
the sub-network using the heuristic relevance scoring formula[81]
1
2 ( ) ( )i
i
k
i ij
j
R LOG S LOG k
Where Ri is the ith seed protein ranking score Ki denotes its connectivity and Sij
denotes its interaction reliability score with the jth partner
Figure 36 Application for the yeast subnet construction
39
Our ranking analysis was built on the hypothesis the significance of a protein‟s
contribution in the network depends on its ability to connect to other proteins in the
network and the reliability of the detected interactions The higher the connectivity
and reliability the higher the ranking score should be
40
4 RESULTS
Case Study 1 Ovarian Cancer Drug Resistance Case Study
This part was written based on the published result[2] where I am one of the
primary contributing members The use of the material was granted with the
permission from participating contributors
41 Activated Protein Interaction Sub-Network Properties
The network topology for the protein interaction sub-network expanded from seed
proteins was examined The resulting protein interaction sub-network (core sub-
network) consists of 1230 seed and non-seed proteins in 1723 sub-network
interactions (including 17 S-S type interactions and 1706 S-N type protein
interactions) The node degree frequency distributions were plotted in Figure 41
where the whole human protein interaction network from OPHID (labeled ldquonetworkrdquo)
is also shown As expected both the network and the sub-network (full) display good
ldquoscale-freerdquo property These results also show that the cisplatin resistant activated sub-
network (full) contains more ldquohubsrdquo than ldquoperipheralrdquo proteins to form a cohesive
functional sub-network The core sub-network while perhaps limited in size shows
ldquoscale-free likerdquo distribution although hubs in the sub-network (core) are more
distinctively identifiable than overly abundant peripheral nodes by high node degree
counts
Other network features for the core sub-network are also examined The largest
connected component (defined in the Method section ibid) of the sub-network
consists of 1193 proteins The index of aggregation is 11931230=970 The index of
expansion as the percentage of S-S type interactions (17) over the core sub-network
interactions (1723) ie 171723=096 The index of aggregation has a p-value of
less than 0001 (upper tail) and the index of expansion is 006 (upper tail) A significant
and high network index of aggregation suggests that the core sub-network has
connectivity structures that are not random by nature This correlates well with the
41
node degree distribution in Figure 41 where an exceptionally large number of hubs
are shown to exist
1
10
100
1000
10000
1 10 100 1000
node degree in sub-network
co
un
t
Sub-Network (core)
Subnetwork (Full)
Network
Figure 41 Node degree distribution of the sub-networks (core or full) in
comparison with the human protein interaction network
42
42 Analysis of Activated Protein Functional Category Distributions
Although GO-based functional category analysis can be done routinely using many
existing bioinformatics methods [3] the inclusion of protein interaction network
context has not been previously described In this analysis we are more interested in
enriched protein categories in the cisplatin-response functional process This includes
both up-regulated and down-regulated proteins Therefore we transformed protein-
protein interaction sub-network to GO cross-talk sub-network Enriched protein
functional categories were discovered among differentially expressed seed proteins
and its immediate protein interaction sub-network nearest interaction partners
Table 41 shows significantly enriched GO categories in the sub-network 17 GO
categories were filtered from 70 GO categories (data not shown) The filter criteria are
1) the P-value over- or under- representation must be within 005 and 2) the total
category count of GO in the whole network is greater than 10 In GO_TERM column
we have listed three types of information level 3 GO terms GO term category type
(bdquoC‟ for cellular component bdquoF‟ for molecular function and bdquoP‟ for biological process
in parenthesis preceding the dash) and GO identifier (seven digit number following
the dash in parenthesis) In the ENRICHMENT column we listed two types of
counts of proteins with GO annotation levels falling in the corresponding category
within core sub-network and whole network (in parenthesis) In the PVALUE column
we have listed two numbers the p-value from the significance test of whether there is
an over- or an under- representation (two numbers separated by a bdquo‟) of an observed
GO term category count in the sub-network In the last CONCLUSION column bdquo++‟
suggests significant over-representation when the false discovery rate (FDR) is
controlled at 005 bdquo--‟ suggests significant under-representation when FDR controlled
at 005 bdquo+‟ to suggest insignificant over-representation when FDR controlled at 005
but significant overrepresentation at native p-value=005 bdquo-‟ to suggest insignificant
over-representation when FDR controlled at 005 but significant overrepresentation at
native p-value=005
43
Table 41 Enriched GO categories in the sub-network Context An asterisk
indicates adjustment may be needed for further interpretation
We also tested how robust the network is by introducing noise in protein
interaction data sets Two experiments were performed (for a description of the
methods see section 311) ldquoadd20rdquo in which we added 20 new randomly-selected
GO_TERM ENRICHMENT
PVALULE
(OVERUNDER) CONCLUSION
membrane (C-0016020) 7 (2034) 10 --
proton-transporting two-sector
ATPase complex (C-0016469) 2 (12) 0091 +
non-membrane-bound
organelle (C-0043228) 19 (834) 0059980 +
organelle lumen (C-0043233) 2 (13) 01019996 +
proton-transporting ATP
synthase complex (C-0045259) 2 (17) 01719990 +
proton-transporting ATP
synthase complex catalytic
core (C-0045261) 1 (1) 00121 +
proton-transporting ATP
synthase catalytic core
(C-0045267) 1 (1) 00121 +
protein binding (F-0005515) 26 (1387) 0129937 +
drug binding (F-0008144) 2 (12) 00091 +
isomerase activity (F-0016853) 7 (69) 01 ++
nucleotide binding (F-0000166) 23 (1205) 01489923 +
receptor activity (F-0004872) 2 (642) 99680149 -
receptor binding (F-0005102) 1 (422) 99440354 -
oxidoreductase activity
(F-0016491) 12 (271) 01 ++
Kinase
regulator activity (F-0019207) 3 (50) 002209970 +
metabolism (P-0008152) 67 (4634) 002009875 +
response to biotic stimulus
(P-0009607) 1 (711) 100014 -
regulation of physiological
process (P-0050791) 17 (2129) 98170328 -
regulation of cellular process
(P-0050794) 15 (2182) 99680066 -
44
connections between OPHID proteins to create a new OPHID proteins data set PiD-
a20 and ldquoremove20rdquo in which we removed 20 existing randomly-selected
connections between OPHID proteins to create a new OPHID proteins data set PiD-
r20 Surprisingly although the individual category counts fluctuate all conclusions
made through the above-described threshold values of p-value and FDR remain the
same (this conclusion also remains true for high-level GO-GO category enrichment
experiments in next section results not shown) This suggests the significance of our
discovery is robust against reasonable noise inherent in the protein interaction
databases
After the above analysis we then re-examined all ldquounder-represented categoriesrdquo
under a new false-negative controlled experiment to see if these under-representations
have been ldquoexaggeratedrdquo due to bias of the MS experimental methods Therefore we
set up an experiment to observe the inherent bias (either over- or under- representation)
in all detectable MS proteins overlapped with OPHID data sets (also described in
section 316)
Table 42 Re-examination of under-represented seed protein functional
categories
GO_TERM
P-VALUE OVER-
REPRESENTED
(seedbackground)
P-VALUE
UNDER-
REPRESENTED
(seedbackground)
CONCLU-
SION
Membrane (C-0016020) 10000 (00000) 00001 (10000) --
receptor activity (F-0004872) 99681 (00002) 01489 (99998) --
receptor binding (F-0005102) 99439 (99937) 03550 (00092)
response to biotic stimulus
(P-0009607) 99986 (10000) 00144 (00000)
regulation of physiological
process
(P-0050791) 98169 (00000) 03276 (10000) --
regulation of cellular process
(P-0050794) 99685 (00000) 00664 (10000) --
45
Table 42 lists the results Here seed experiment refers to the earlier experiment
which we examined the enrichment (in this case all under-representations) of 119
seed proteins background experiment refers to the re-examination experiment which
we examined the enrichment bias of 3690 MS detectable proteins also found in
OPHID data set When we observe significant over-representation of certain GO
functional categories in the background we make the conclusion that the category is
indeed under-represented in the seed (marked as ldquo--ldquo)When we observe significant
under-representation of certain GO functional categories in the background we make
the conclusion that the category is not necessarily under-represented (or likely over-
represented) in the seed (marked as ldquoldquo for inclusive)
From the above comprehensive analysis we can obtain the following biological
insights First proton-transporting ATP synthase activity is related to the cell cisplatin
resistance function (see table 5 for the enriched GO categories) which may imply
higher oxidative energy production capability among cancerous functions in cisplatin
resistant cell lines over cisplatin sensitive cell lines This is consistent with the existing
findings mitochondria -- ldquoATP factoryrdquo was considered to be a major target of
cisplatin leading to mitochondrial loss of energy production[82] Second although the
protein interaction network in general is inherently enriched with proteins with
ldquoprotein bindingrdquo capabilities (note 1412 proteins in the category from the whole
network) the cisplatin-resistant cell line demonstrated an unusually high level of
protein-binding activities in addition a broad spectrum of across-the-board drug-
binding and nucleotide-binding mechanisms are all activated to fight again cisplatin-
induced DNA damage in cancer cells This suggests that many intracellular signaling
cascades are intensely mobilized with cisplatin-resistance Third the data suggest that
the location of the biological activities of cisplatin resistant response take place in
cytoplasm or nucleus rather than on ldquomembranerdquo This correlates well with the
previous hypothesis that transporters that are responsible for assisting with cisplatin
import into the cell seem to become blocked in drug-resistant cells This analysis gives
essential clues to the overall picture of molecular signaling events for cisplatin
46
GOT2
cell communication
cellular physiological process
localization
locomotory behavior
metabolism
organ development
organismal physiological process
regulation of cellular process
regulation of development
regulation of physiological process
regulation of viral life cycle
response to abiotic stimulus
response to biotic stimulus
response to endogenous stimulus
response to external stimulus
response to stress
resistant cell lines We also obtained categorical enrichment data at lower GO levels
than are shown in this section using the drill-down method (for method refer to
section 317 results not shown) to obtain detailed views of biological process
molecular function and cellular components
43 Functional Category Cross-Talks
We developed a two-dimensional visualization matrix (extended from our
technique described in [83]) to show significant cross-talk between GO categories in
Figure 42 (only biological processes at level=3 are shown due to space constraints)
Figure 42 Significantly over-represented GO-GO interaction categories in seeded
subnetwork (only biological processes at level=3 are shown due to space constraints)
47
Table 43 Drill down of significant GO-GO functional category cross-talk
ldquoCellular Physiological Processrdquo vs ldquoCellular Physiological Processrdquo at GO term level
4 Note only p-value lt005 for over-representation are shown (FDRlt005 cases are
also in bold)
GO TERM 1 GO TERM 2 ENRICHMENT
P-
VALUE
cell homeostasis (P-
0019725) transport (P-0006810) 18 (120) 0
transport (P-0006810) transport (P-0006810) 75 (1377) 00006
regulation of cellular
physiological process (P-
0051244) transport (P-0006810) 130 (2045) 0
cell cycle (P-0007049) transport (P-0006810) 68 (708) 0
cell death (P-0008219) transport (P-0006810) 45 (694) 00002
cell proliferation (P-
0008283) transport (P-0006810) 22 (238) 00001
cellular metabolism (P-
0044237) transport (P-0006810) 359 (6041) 0
cellular metabolism (P-
0044237) cell cycle (P-0007049) 253 (4439) 0
cellular metabolism (P-
0044237)
cell proliferation (P-
0008283) 85 (1412) 0
cell homeostasis (P-
0019725)
cell organization and
biogenesis
(P-0016043) 11 (73) 00001
cellular metabolism (P-
0044237)
cell homeostasis (P-
0019725) 25 (279) 0
cellular metabolism (P-
0044237)
cellular metabolism (P-
0044237) 764 (17604) 0
cell homeostasis (P-
0019725) cell cycle (P-0007049) 5 (43) 00207
regulation of cellular
physiological process (P-
0051244) cell cycle (P-0007049) 130 (2655) 00007
cell cycle (P-0007049) cell cycle (P-0007049) 39 (702) 00084
cell organization and
biogenesis
(P-0016043) cell cycle (P-0007049) 53 (936) 00017
cell homeostasis (P-
0019725)
chromosome
segregation
(P-0007059) 1 (1) 0037
regulation of cellular
physiological process (P-
0051244)
cell homeostasis (P-
0019725) 13 (149) 00037
48
The size of each node is inversely proportional to the p-value of interacting categories
The color legends are red (dark) for interacting categories that are significant when
FDR controlled at 005 and gray (light) for interacting categories that are not
significant when FDR controlled at 005 The figure 42 reveals additional interesting
findings First cellular physiological processes are significantly activated in drug-
resistant cell lines (the largest and reddest dot at the bottom left corner) This could
lead to further drill-down of protein interaction in the interacting category for
biological validations (see Table 43 for an example) Second these cellular
physiological processes seem to be quite selective rather than comprehensive For
example when looking at significant regulation of cellular response categories
significant cross-talk functional patterns strongly suggest the cellular and
physiological responses arise from endogenous abiotic and stress-related signals
(internalized cisplatin causing DNA damage and inducing cell stress) Using a cross-
talk matrix such as this cancer biologists can quickly filter out other insignificant
secondary responses (such as cell growth cell development shown) to establish a new
prioritized hypothesis to test
44 Visualization of the Activated Interaction Functional Sub-Network
In Figure 43 we show a visualization of the activated biological process functional
network using a recently developed software tool ldquoProteoLensrdquo[79] ProteoLens is a
biological network data mining and annotation platform which supports standard
GML files and relational data in the Oracle Database Management System (for
additional details visit httpbioinformaticsiupuieduproteolens) In the figure 43
in contrast with regular protein interaction network we encode nodes as significantly
over-under- represented protein functional categories and edges as significantly
interacting protein functional categories Several additional information types are also
represented The original abundance (by count) of each functional category is encoded
in the node size The p-values of activated protein category significance in the sub-
network is encode as node color intensity on a scale from light yellow (less significant)
to dark red (more significant)
49
Figure 43 Activated biological process network in cisplatin-resistant ovarian
cancer cells Red-colored lines stand for ldquosignificantrdquo while blue-colored lines stand
for ldquonot significantrdquo (FDR=005)
50
From this figure 43 we can see that cisplatin-resistant ovarian cancer cells
demonstrated significant cellular physiological changes which are related to cancer
cell‟s native response to stimulus that is endogenous abiotic and stress-related
Interestingly we also observed that the regulation of viral life cycle also plays very
significant roles in the entire drug resistant process This previously unknown
observation may be further examined at protein levels to formulate hypothesis about
acquired cisplatin resistance in ovarian cancer
51
Case Study 2 Yeast Grr1 Knock-Out Case Study
Case study 2 is the collaborative work among the biology group (Dr Goebl and
Josh) biostatistics group (Dr Shen) and Informatics group (Dr Chen and I) The
manuscript is in preparation
45 Activated Protein Interaction Sub-Network Properties
Figure 44 Node degree distribution of the sub-networks (core or full) in
comparison with the yeast protein interaction network
52
The resulting protein interaction sub-network consists of 1251 seed and non-seed
proteins in 1698 sub-network interactions (including 54 S-S type interactions and
1644 S-N type protein interactions) This protein interaction sub-network is called a
ldquocore sub-networkrdquo The ldquofull sub-networkrdquo includes all N-N type protein interactions
in addition to the S-S type and S-N type interactions We plot their node degree
frequency distributions in Figure 44 where the whole yeast protein interaction
network from SBG (labeled ldquonetworkrdquo) is also shown As expected both the network
and the sub-network (full) display good ldquoscale-freerdquo property (some nodes act as
highly connected hubs although most nodes are of low degree) The core sub-
network while perhaps limited in size begins to show ldquoscale-free likerdquo distribution
although hubs in the sub-network (core) are more distinctively identifiable than overly
abundant peripheral nodes by high node degree counts
We also examined other network features for the core sub-network The largest
connected component of the sub-network consists of 1163 proteins with 1637
interactions The index of aggregation is 11631251=930 The index of expansion
as the percentage of S-S type interactions (54) over the core sub-network interactions
(1698) is 541698=318 The high network index of aggregation here suggests that
the core sub-network has high connectivity
46 Analysis of Activated Protein Functional Category Distributions
We first analyzed significantly enriched GO categories among 184 seed proteins
We limited our analysis to level 3 GO categories as previously described Our result
revealed 11 significantly enriched GO biological process functional categories and
cellular components in response to Grr1 perturbation After filtering out the general
GO categories that have more than 200 ORFs from the whole yeast PPI have been
annotated to only 3 significantly enriched GO categories are left (see table 44) The
table column header definition is the same as previously defined in the human case
study
53
Table 44 Overunder ndash represented GO categories among the seed proteins
GO_TERM ENRICHMENT
(OVERUNDER
)
CONCLUSIO
N
eukaryotic 43S preinitiation
complex (C-0016282) 5 (55) 004270988 +
lipid transporter activity (F-
0005319) 2 (8) 0029909979 +
oxidoreductase activity (F-
0016491) 16 (184) 0000709998 +
The analysis result from the above apparently provides limited information Thus a
simple ontology-based annotation for global proteomics data offers no significant
further understanding of Grr1 function This is partially due to the fact that the current
proteomics techniques are not sensitive enough to capture the whole proteome
especially those proteins with low-abundance eg Grr1 However we expect to find
many abundant proteins whose expression levels are directly or indirectly regulated by
Grr1 These proteins may look disparate or isolated in their GO-annotation but may
interact with other proteins and impact the cellular components or functions
We expanded our protein list by mapping our differentially expressed proteins onto
protein interaction networks and including the immediate partners in our analysis The
expanded sub-network included 1251 proteins (184 seeds and 1067 immediate
partners) We then mapped these proteins into GO categories and re-analyzed the
enriched GO categories using statistical methods previously described We discovered
53 enriched GO categories including both over- and under-represented GO categories
We applied the same filtering criteria to the 53 GO categories to remove generalized
GO categories that contain 200 or more annotations and obtained 40 enriched GO
categories with 15 terms categorized as component terms 15 categorized as process
terms and 10 categorized as function terms (see table 10) The table column header
definition is the same as previously defined in the human case study Therefore the
application of the GO analysis to the sub-network leads to the extraction of more GO
terms overall and more specific GO terms
54
Table 45 Overunder ndash represented GO categories among the subnet proteins
GO_TERM
ENRICH-
MENT (OVERUNDER)
CONCLU
-SION
transcription export complex (C-0000346) 4 (4) 000321 +
proteasome complex (sensu Eukaryota) (C-
0000502) 25 (37) 01 ++
transcription factor complex (C-0005667) 43 (106) 000011 ++
mitochondrial inner membrane presequence
translocase complex (C-0005744) 3 (4) 0044609968 +
proteasome regulatory particle (sensu
Eukaryota) (C-0005838) 8 (9) 000011 ++
microtubule associated complex (C-0005875) 14 (29) 000350999 +
bud (C-0005933) 48 (107) 01 ++
eukaryotic 43S preinitiation complex (C-
0016282) 19 (55) 004790975 +
chromatin remodeling complex (C-0016585) 30 (71) 0000409998 ++
DNA-directed RNA polymerase II
holoenzyme (C-0016591) 32 (66) 01 ++
external encapsulating structure (C-0030312) 14 (102) 0996400077 -
site of polarized growth (C-0030427) 50 (109) 01 ++
replisome (C-0030894) 12 (27) 001490995 +
cell projection (C-0042995) 19 (36) 000021 ++
pyruvate dehydrogenase complex (C-
0045254) 3 (4) 0044609968 +
RNA polymerase II transcription factor
activity (F-0003702) 42 (93) 01 ++
receptor signaling protein activity (F-
0005057) 8 (13) 0004109993 +
amine transporter activity (F-0005275) 1 (33) 0999900014 -
organic acid transporter activity (F-0005342) 2 (39) 099970002 -
carrier activity (F-0005386) 24 (158) 0997600046 -
enzyme activator activity (F-0008047) 20 (56) 0030409848 +
lipid binding (F-0008289) 11 (15) 000011 ++
protein transporter activity (F-0008565) 11 (25) 0021109928 +
carbohydrate transporter activity (F-0015144) 3 (31) 098820041 -
GTPase regulator activity (F-0030695) 26 (63) 0001609994 ++
aging (P-0007568) 15 (29) 000109997 ++
55
morphogenesis (P-0009653) 46 (103) 01 ++
response to endogenous stimulus (P-0009719) 64 (172) 01 ++
cell growth (P-0016049) 3 (4) 0044609968 +
death (P-0016265) 15 (39) 0029509871 +
sexual reproduction (P-0019953) 41 (93) 01 ++
asexual reproduction (P-0019954) 39 (75) 01 ++
cell differentiation (P-0030154) 39 (100) 0000509998 ++
Filamentous growth (P-0030447) 23 (54) 0001809993 ++
regulation of growth (P-0040008) 3 (3) 001361 +
regulation of gene expression epigenetic (P-
0040029) 25 (76) 0045909737 +
negative regulation of biological process (P-
0048519) 53 (155) 0002109988 ++
non-developmental growth (P-0048590) 14 (28) 0002309994 ++
regulation of enzyme activity (P-0050790) 13 (25) 0002109995 ++
reproductive physiological process (P-
0050876) 27 (65) 0001209995 ++
To assess the validity of our analysis we first determined whether the expanded
GO annotation was supported by known Grr1 functions from previous publications
Grr1 affects many different cellular processes in Saccharomyces cerevisiae through
its role as a receptor for the SCF ubiquitin ligase[84-86] In conjugation with this
multimeric protein complex Grr1 serves to target protein substrates for ubiquitylation
an event that ultimately results in the substrates degradation by the 26S proteasome
Currently there are ten proteins that are thought to be ubiquitylated by the SCFGrr1
ubiquitin ligase each of these proteins playing distinct roles in multiple cellular
processes[86] The cells lacking Grr1 exhibit multiple abnormalities including cell
elongation slow growth on glucose increased sensitivity to osmotic stress and
nitrogen starvation decreased divalent cation transport enhanced filamentous growth
defects in sporulation and slow growth or invariability when combined with amino
acid biosynthesis mutants[84 87-90] We expect our ontology-driven network enabled
approach would capture some of the GO functions through extracting the enriched GO
terms directly associated with Grr1 or with the targets of Grr1
56
Intriguingly among the 40 enriched GO categories 14 GO categories are directly
ascribed to Grr1 or at least one of its targets 10 categories over-represented and 4
under-represented In figure 45 the 10 over-represented GO categories that are
directly related to Grr1 or related to targets of Grr1 are shown The Grr1 protein is
known to participate in regulating bud emergence and growth through its role in
targeting the Cdc42 effectors Gic1 and Gic2 as well as the cyclins Cln1 and Cln2 for
degradation by the 26S proteasome [85 90-93] The GO categories ldquopolarized
growthrdquo ldquobudrdquo ldquomorphogenesisrdquo ldquoasexual reproductionrdquo and ldquocell projectionrdquo are
all involved in the elongated bud morphological phenotype of Grr1 knock-out cells
The elongated bud morphology resembles invasive growth for Grr1 knock-out yeast
Therefore based on the existing evidence from previous publications the ontology-
driven network-enabled analysis approach proves to be not only valid but also have
the potential to drive the generation of the novel hypothesis for future investigations
57
Figure 45 Enriched GO categories (partial listing) and yeast bud morphological
phenotype This figure was modified based on Josh‟s original figure
47 Functional Category Cross-Talks
Figure 46 Visualization of significantly over-represented GO cross ndash talk sub-
networks related to Grr1 induced morphological change The partial sub-networks
were constructed by seeding the significantly enriched GO cross-talk sub-network by
ldquobudrdquo ldquocell projectionrdquo ldquosite of polarized growthrdquo ldquoasexual reproductionrdquo and
ldquomorphogenesis The top one is for biological process and the bottom one is for
58
cellular component The numbers and the thickness both denote the enrichment of the
GO cross-talk pairs in the protein-protein interaction sub-network The larger the
number or the thicker the line the more enriched the GO pair is
To investigate how these Grr1-deletion enriched GO categories are functionally
associated with each other we subsequently performed functional category cross-talk
analysis (for detailed method see method section 37) and identified 287 significant
overunder-represented GO-GO cross-talks (see appendix 4)
In particular the significantly enriched GO categories discovered previously ie
ldquobudrdquo ldquocell projectionrdquo ldquosite of polarized growthrdquo ldquoasexual reproductionrdquo and
ldquomorphogenesis are also involved in the significantly enriched GO-GO cross-talk
pairs These cross-talk GO categories are functionally related to the yeast bud
morphological phenotype change induced by Grr1 knock-out perturbation
Importantly some of the GO-GO pairs are highly connected and form the GO-GO
interaction subnet for Grr1 (Figure 46) implying that Grr1 perturbation may affect
some specific biological processes or cellular components through a small core group
of proteins Further more we also observe that microtube associated complex is highly
connected to other GO categories in the GO cross-talk sub-network that are related to
Grr1 induced morphological change This intrigues us since there is no previously
known role for Grr1 in microtubule related processes
Drill-down analysis of the group of proteins involved in the GO cross-talk sub-
network might help biologists discover the proteins that significantly contribute to the
Grr1 perturbed morphological phenotype change
48 Scoring of Significant Proteins in the Sub-Network
We further performed significant proteins ranking analysis with the hope of
isolating important proteins that contribute to Grr1s possible new function that we
discovered earlier by our ontology-driven network-enabled approach
59
Based on the connectivity and the confidence of the protein-protein interactions we
ranked significant seed proteins (for detail of the method see section 310) Table 46
shows the top-ranked 20 proteins among 184 seed proteins
Table 46 Ranking analysis of the significant proteins Only 20 top-ranked proteins
were listed here due to the space
Rank Score ORF Gene Symbol Fold Change (Grr1 vs wt)
1 41826 YGL167C PMR1 0250
2 39453 YPR141C KAR3 5970
3 38658 YNL298W CLA4 0202
4 30236 YPL174C NIP100 0111
5 28646 YOR261C RPN8 033
6 28301 YNL233W BNI4 531
7 2784 YML008C ERG6 0129
8 27606 YDR155C CPR1 0524
9 26697 YNL244C SUI1 4224
10 26495 YKL173W SNU114 0409
11 26329 YKR054C DYN1 39224
12 26311 YMR309C NIP1 13115
13 26219 YJL148W RPA34 0129
14 25001 YGL055W OLE1 6486
15 23706 YBL047C EDE1 0343
16 23508 YBR152W SPP381 4658
17 2328 YDL006W PTC1 0229
18 23236 YGL112C TAF6 04029
19 23079 YLR087C CSF1 64511
20 22101 YOR290C SNF2 01812
Later we isolated the actual proteins from the top ranked protein list that mapped
to the GO component term microtubule associated complex The analysis revealed that
two of the most highly connected proteins Nip100 and Dyn1 Both proteins also
represented most extensively changed proteins in the network Dyn1 protein levels
were observed to increase in the Grr1 mutant ~ 40 fold while Nip100 protein levels
were observed to decrease ~10 fold in the analysis Nip100 is part of the dynactin
complex[94] where it is thought to act as a tether for Dynein encoded by Dyn1 Thus
we probed the relationship between Grr1 and Nip100 Figure 47 shows protein
interaction sub-network seeded by Grr1 Dyn1 and Nip100 where Grr1 connects to
60
Nip100 through Bzz1 and Tub3 Grr1 connects to Dyn1 through Cdc12 and Pac10
We hypothesized that Grr1‟s influence on the GO component microtubule associated
complex could be possibly through one or more of these bridge proteins such as Bzz1
The biological experiments are being conducted by our biology group to validate this
hypothesis
Figure 47 Protein interaction sub-network seeded by Grr1 Dyn1 and Nip100
Node colors Red = protein level gt 2 fold Bright blue = -2gt= protein level lt=2 Grey
= no detection Green = protein level lt-2 Line colors Red = Synthetic Lethality Pink
= Synthetic Growth Defect Light Blue = Two Hybrid or Affinity Capture MS Dark
Blue = Reconstituted Complex or Affinity Capture Western Green = Synthetic
Rescue Purple = Dosage Rescue Orange = Phenotypic Suppression Yellow =
Phenotypic Enhancement This figure was provided by Josh Heyen
61
Through ranking analysis we also further validated our ontology-driven network-
enabled approach Kar3 a kinesin-like nuclear fusion protein is ranked at the second
place in the table It belongs to gene ontology categories ldquosexual reproductionrdquo (level
3 biological process) and ldquointracellularrdquo (level 3 cellular component) The third top-
ranked protein Cla4 a protein kinase can be mapped to GO categories ldquoasexual
reproductionrdquo at level 4 biological process and ldquobudding cell apical bud growthrdquo
ldquocell communicationrdquo ldquometabolismrdquo and ldquomorphogenesisrdquo at level 3 biological
process All of the GO categories mapped by these proteins have been shown to be
important in Grr1 perturbation induced morphological changes through our ontology-
driven and network-enabled approach based analysis
62
5 CONCLUSIONS
In the current study we developed a systems biology approach to analyze the
proteomics data We applied this novel approach to two case studies human ovarian
cancer drug resistance study and yeast Grr1 knock-out study
The identified differentially expressed proteins formed basic dataset ndash seed proteins
of our case studies We used the seed proteins to construct our protein-protein sub-
network Then we analyzed the core protein-protein interaction sub-network feature
Both human ovarian cancer drug resistance related and yeast Grr1 knock-out sub-
networks showed high connectivity feature After we mapped the proteins and protein-
protein interactions to GO annotations and constructed GOndashGO cross-talk sub-
networks we performed statistical testing to find significantly enriched over under-
represented GO categories and GO-GO cross-talk categories The visualization tools
ldquoSpotfirerdquo and ldquoProteolenserdquo were used to aid in the analysis
Our approach has been validated in the two case studies by comparing our
discoveries with existing findings Some new insights were obtained
In the first case study we observed that cellular physiological process is
significantly activated in drug-resistant cell lines and this response arises from
endogenous abiotic and stress-related signals Our studies also showed that cisplatin
resistant cell line demonstrated unusually high level of protein-binding activities and
a broad spectrum of cross-the-board drug-binding and nucleotide-binding mechanisms
are all activated
In the second case study we observed that a subset of significantly over-
represented enriched GO categories is highly connected in the GO sub-network which
implies that Grr1 induced morphological phenotype change might be resulted from a
small core group of proteins We hypothesized Grr1s new role in microtubule related
processes based on the high connectivity of microtubule associated complex with
63
other GO categories for Grr1s known functions We further performed ranking
analysis of the significant seed proteins based on their connectivities and reliabilities
of the interactions in the sub-network The ranking analysis further validated our
findings revealed by the ontology-driven network-enabled approach These biological
discoveries support the significance of developing a common framework of evaluating
functional genomics and proteomics data using networks and systems approaches
64
6 DISCUSSIONS
Molecular biology focuses the mechanistic study of biological phenomena One of
its strengths is to concentrate on the actions of a small number of genes without being
distracted by the complex biological milieu in which they are found However in
terms of a series of binary interactions or when pathways become complex and many
genes work together using molecular biology to model function shows its weakness
In this case more network-level understanding is required In this study we showed
that the key to interpreting omics data is a systems biology approach which is both
hypothesis-driven and data-driven with the ultimate goal of integrating multi-
dimensional biological signals at molecular signaling network levels It is important
to note that systems biology approach and the traditional molecular biology approach
should complement each other in order to achieve a deep understanding of the
molecular mechanisms The systems biology approach is not a replacement of the
traditional approach
In the present study we described a novel systems biology approach to integrate
omics data with both GO annotation and protein interaction networks and its
application in two proteomic case studies The whole proteome of two cellular
conditions of yeast or human cells were interrogated using LC-MSMS A
differentially expressed protein lists were obtained by statistical analyses controlling
false discovery rate We obtained 114 and 184 significantly over- or under-expressed
proteins for our two case studies respectively The mass spectrometer-based
proteomics analysis is one of the major techniques recently developed to examine
thousands of proteins simultaneously Since it directly analyzes the protein level and
protein modifications the mass spectrometer- based proteomics provides more direct
explanations for cellular processes involving multiple protein components However
the current proteomics analysis was unable to detect and quantify an entire proteome
and has low sensitivity to the low-abundant proteins such as Grr1 which may play
critical roles in many important biological processes
65
The large volume of differentially expressed proteins derived from the proteomics
and microarray studies provide us the opportunity for investigating the biological
function at the systems level However the protein lists themselves offers very limited
clues to our understanding of the biological processes that underlie cisplatin resistance
of human ovarian cancer cells or abnormal phenotype that is associated with Grr1
deletion Most of the identified significant differentially regulated proteins are not
obviously related to the known function of Grr1 or drug resistance As our first
attempt to understand the function of our protein list we performed ontology-based
analysis which is now widely used in data mining of functional genomic data as well
as proteomics data Gene ontology annotation is an important milestone on
possibilities to handle and link biological knowledge with gene profiles identified in
functional genomics and proteomics analysis
Nevertheless mapping differentially expressed protein list onto ontology provided
only limited information to our understanding of the biological processes associated
with cellular conditions For example our GO annotation analysis of Grr1-deletion
affected protein list leads to identification of three enriched GO terms after applying
certain filter eukaryotic 43S preinitiation complex lipid transporter activity
oxidoreductase activity none seems to be clearly associated with known function of
Grr1 Thus although GO-based analysis proved to be useful in interpretation of the
gene profiling experiments using microarray[95 96] this technique on its own provide
only limited information for our understanding of biological function at the systems
level
Another important approach for interpretation of omics data is network-based
analysis Since most biological characteristics arise from complex interactions
between the cellular constitutes such as proteins mapping changed proteins identified
onto protein network will place these proteins in a broader biological context thereby
facilitating the understanding of the structure and function of living cells In our yeast
case study we mapped our 184 proteins into protein interaction database and ranked
the importance of these proteins according to the number of their immediate
66
connectivity and the reliability score calculated using a formula We hypothesized that
the most highly connected proteins in the sub-network may represent proteins that
may be mostly directly affected by Grr1 gene deletion Intriguingly two of the 20 top-
ranked proteins Nip100 and Dyn1 are genetically and physically connected with each
other (Figure 47) The physical association of Grr1 with Nip100 is through Bzz1
which appears in our extended protein ranking list As Nip100 and Dyn1 are a part of
the microtubule components Grr1 may exert its function though its influence on its
immediate target Bzz1 This hypothesis warrants a detailed study in the future
One of the distinct features of our systems biology approach is to bring the gene
ontology category concept into the context of protein-protein interaction network and
use it for omics data analysis We hypothesized that the limited number of changed
proteins identified through proteomics may actually be connected within Grr1 sub-
network These changed proteins may exert their function by influencing the protein
networks that they are involved in We thus expand our interest of proteins to include
those proteins that directly interact with our changed proteins To understand the
biological function of these expanded protein list we then mapped the protein list onto
gene ontology terms and identified significantly enriched GO terms Through this
approach we found about 40 significantly enriched GO terms by applying a certain
filter Strikingly 10 of the enriched GO-terms could be ascribed to Grr1 or its target
proteins (Figure 45) according to previous publications Thus our ontology-driven
and protein network-enabled approach can not only be used to validate existing
knowledge but also have the potential to generate the hypothesis for future
investigation
In our approach we also explored GO-GO cross-talks and identified Grr1-deletion
associated GO-GO cross talks This information further extends our understanding of
the connection of multiple processes induced by gene deletion or other stress
conditions We also demonstrated that functional 2-dimensional matrix and protein
interaction network visualization tool may significantly facilitate the biologists to form
their hypotheses
67
Our systems biology approach provides a framework for further improvement in
the future First our analysis is currently based on proteomics data only The method
described here is readily applicable to microarray data analysis We expect to gain
more in-depth understanding of the Grr1 function by incorporation of published Grr1
microarray data into our analysis Because the relationship between transcription and
translation is likely to vary based on the individual geneprotein it may not be realistic
to expect a high degree of correlation between protein and RNA levels when
attempting to correlate dynamic change in RNA with a static picture of proteins
Combination of genomics and proteomics data requires further development of current
approach Second our network-based analysis focuses on the functional significance
of changed proteins through protein-protein interaction analysis We made no attempt
to understand how the changed proteins are regulated by genetic or environmental
stress One of the future directions is to incorporate gene regulatory network analysis
in order to identify regulatory relationships among large numbers of genes that form a
network representation of the underlying regulatory processes Finally our current
model needs fine adjustment to provide elegant interpretation of omics data For
example the validity of ranking model needs further investigation Drill-down of GO
categories analysis may provide further details for interpretation of biological
consequences induced by genetic or environmental stresses
In summary our ontology-driven network-enabled systems biology approach
provides in-depth understanding of cellular functions and creates a robust concept
framework for further improvement in the future
68
7 Appendices
Appendix 1 ERD diagram for Oracle schema Sysbio For details see [21]
69
Appendix 2 Uniprot ID mappings for 119 differentially expressed seed proteins
in ovarian cancer drug resistance study
UNIPROTID
ANKS1_HUMAN
1433T_HUMAN
1433Z_HUMAN
1433E_HUMAN
1433F_HUMAN
ACTN1_HUMAN
AL3A1_HUMAN
AL3A1_HUMAN
AKAP9_HUMAN
AL1A1_HUMAN
CBX3_HUMAN
DEST_HUMAN
CENPE_HUMAN
CNN2_HUMAN
CRIP2_HUMAN
CRTC_HUMAN
E41L1_HUMAN
FKBP4_HUMAN
6PGD_HUMAN
ABCG1_HUM AN
ACADM_HUMAN
DOCK4_HUMAN
ANXA3_HUMAN
B2MG_HUMAN
DHCA_HUMAN
CAP1_HUMAN
ATPA_HUMAN
ATPB_HUMAN
CU059_HUMAN
CYBP_HUMAN
FA49B_HUMAN
MDHC_HUMAN
KCRU_HUMAN
LPPRC_HUMAN
GALT3_HUMAN
HS70L_HUMAN
HSP76_HUMAN
GANAB_HUMAN
IF4H_HUMAN
HSBP1_HUMAN
70
HS90B_HUMAN
KAP0_HUMAN
ETFA_HUMAN
PHS3_HUMAN
PP2CG_HUMAN
PPIA_HUMAN
PGK1_HUMAN
PPIB_HUMAN
PDIA1_HUMAN
PDIA6_HUMAN
PARP3_HUMAN
PADI3_HUMAN
RS14_HUMAN
SERA_HUMAN
SODC_HUMAN
SFRS2_HUMAN
SFRS3_HUMAN
INSI1_HUMAN
MYLK_HUMAN
PSB3_HUMAN
PUR6_HUMAN
MYH13_HUMAN
MYL6_HUMAN
MYL6_HUMAN
MYL6_HUMAN
NDK8_HUMAN
PDCD6_HUMAN
O2T35_HUMAN
NDKB_HUMAN
PCNA_HUMAN
PLSI_HUMAN
RL15_HUMAN
TYSY_HUMAN
VINC_HUMAN
UGDH_HUMAN
S10A1_HUMAN
ST1A2_HUMAN
TBA1_HUMAN
TBA3_HUMAN
TCP4_HUMAN
THIL_HUMAN
THIO_HUMAN
SMCA5_HUMAN
71
TPIS_HUMAN
TBA8_HUMAN
TBAK_HUMAN
STMN1_HUMAN
RPA5_HUMAN
Q12803_HUMAN
O75935_HUMAN
O60486_HUMAN
O14950_HUMAN
Q6IQ55_HUMAN
Q6MZM0_HUMAN
Q6ZSF4_HUMAN
Q5HYM0_HUMAN
Q5VVN3_HUMAN
Q5S007_HUMAN
Q5VU19_HUMAN
Q7Z4V5_HUMAN
Q86XQ2_HUMAN
Q86WH0_HUMAN
Q75MT3_HUMAN
Q9P2M8_HUMAN
Q9NVS0_HUMAN
Q9NZI8_HUMAN
Q9Y2K3_HUMAN
Q9UPT8_HUMAN
Q8TBR1_HUMAN
Q8WU10_HUMAN
ALDOA_HUMAN
CH60_HUMAN
PDIA3_HUMAN
SEC5_HUMAN
PSA6_HUMAN
TBA6_HUMAN
STMN2_HUMAN
RL12_HUMAN
Q96D18_HUMAN
72
Appendix 3 ORFs for 184 differentially expressed seed proteins in Grr1 knock-
out case study
ORF Fold Change
Q0255 415793714718904
YAL038W 0545852252758714
YAR009C 605360443593325
YBL015W 0328014440120407
YBL016W 814232901955471
YBL030C 428248520447998
YBL047C 034267736598115
YBL088C 249526272717271
YBL092W 0483721610343309
YBR021W 0157116451158551
YBR078W 023105360448864
YBR115C 2225185704536
YBR136W 419593345669184
YBR148W 186570263971014
YBR149W 025000000018879
YBR152W 465804066570279
YBR169C 603512014781145
YBR214W 0203327171879698
YBR218C 831792976604813E-02
YBR225W 426987061012334
YBR231C 954316594964094E-02
YBR233W 128927911263819
YBR241C 213537469763711
YBR263W 0147874306878216
YBR272C 231265108764462
YBR275C 496736103277175
YBR286W 296785473982758
YCL011C 259830512475747
YCR065W 0101522842755918
YDL006W 0228887134956306
YDL019C 93956486699021
YDL058W 98820593963859
YDL075W 226719154500437
YDL127W 534195933395087
YDL131W 201603150013112
YDL154W 566956521767448
YDL176W 0346494762223967
YDL239C 0295748613985256
YDR035W 0419114082837675
YDR058C 417638479544648
73
ORF Fold Change
YDR081C 0175600739297833
YDR116C 301369863012484
YDR138W 244157937145452
YDR155C 0523771152122715
YDR168W 0194085027742803
YDR171W 426062846561671
YDR177W 0166358595066621
YDR226W 331896375814804
YDR247W 368435004836908
YDR351W 211090573011355
YDR379W 0191304347619674
YDR450W 197524910005861
YDR464W 203099999997752
YDR469W 0331450044758495
YDR483W 0240000000159372
YER026C 584103511998871
YER042W 630314232922456
YER158C 191551565055894
YER166W 0273972603027691
YER176W 012628255728794
YER178W 210660620275169
YFL003C 0470655774025158
YFL007W 573796369408722
YFR034C 219983883943257
YGL003C 0110667072598724
YGL055W 648573742222094
YGL103W 207971802652271
YGL112C 0402900886532899
YGL131C 0370668815315337
YGL148W 0277264325355963
YGL151W 0203327171879698
YGL156W 259468170831708
YGL167C 0249798549363811
YGR004W 125138632168835
YGR027C 178132111635026
YGR087C 0228887134956306
YGR132C 0360000000192903
YGR175C 0129390018511791
YGR189C 029008863801562
YGR203W 98383973630905
YGR235C 369863013665815
YGR275W 688539741255251
YGR284C 0304990757780443
74
ORF Fold Change
YGR288W 141988950288631
YHL011C 273300000004619
YHL033C 245951318287733
YHR104W 914445109656317
YHR114W 639305445942334
YHR179W 263093435531901
YHR198C 646253021778323
YIL019W 012628255728794
YIL031W 501739130432334
YIL041W 231952362986739
YIL053W 0345265042503515
YIL112W 250699522170334
YIL143C 891870560378892
YIL159W 0265416928466571
YIR006C 886321626617145
YJL005W 32126713688849
YJL016W 238517324759968
YJL051W 283078162776328
YJL148W 0129390018511791
YJL190C 231551734904835
YJL216C 752310536012055
YJL218W 0175600739297833
YJR045C 181916371834376
YJR061W 596954314750328
YJR066W 230050761405552
YKL014C 0434430958041895
YKL088W 0306204673567028
YKL173W 040890152098861
YKL180W 19170591930552
YKL195W 0394842869081812
YKL209C 81319796956819
YKR018C 0173638516204436
YKR054C 392236598928196
YKR057W 0308407642817507
YKR064W 0258780037223804
YKR096W 0177276389876017
YLL007C 364222401278672
YLL045C 245951318287733
YLL046C 220789685726298
YLL057C 459352801929727
YLR004C 308622078989969
YLR028C 413321763210272
YLR080W 0173638516204436
75
ORF Fold Change
YLR087C 645107160556459
YLR148W 431103948406353
YLR179C 125138632168835
YLR191W 0203045685201405
YLR276C 705175600764816
YLR376C 0286506469458886
YLR422W 0380221832832661
YLR450W 529578856112268
YML008C 0129390018511791
YML023C 844670050774818
YMR038C 0234289452235187
YMR068W 0378726832817958
YMR079W 0339999999966919
YMR096W 0323475046523754
YMR108W 0522342689654229
YMR133W 0249537892567939
YMR145C 306832708199654
YMR231W 0320883101002656
YMR295C 031423290183668
YMR309C 131146025881953
YMR313C 0217566478816452
YNL073W 41095890411034
YNL079C 0303703534315121
YNL121C 0175600739297833
YNL160W 84011090582411
YNL218W 0464296173029536
YNL221C 235702717777939
YNL233W 531000000022657
YNL241C 0304990757780443
YNL244C 422365988910108
YNL298W 0201450443110585
YNL313C 144269870612683
YNR031C 890355330013963
YOL056W 257856567271875
YOL059W 297340854177039
YOL060C 3528963333553
YOL081W 0438552809930963
YOL127W 046438538789387
YOR048C 443190975024723
YOR129C 311039484306185
YOR136W 0160000000126762
YOR172W 0145044319229564
YOR187W 0110905730058634
76
ORF Fold Change
YOR191W 102233502548427
YOR261C 0330000000092788
YOR290C 0181206660197459
YPL007C 277043478253533
YPL113C 707182320476699
YPL174C 0110497237621271
YPL231W 0444474029156303
YPL239W 499999999958532
YPL248C 0149960536676909
YPL255W 123475046219541
YPR004C 0323475046523754
YPR117W 122912449348497
YPR134W 055600322290172
YPR141C 597042513829489
YPR186C 290894439963127
77
Appendix 4 Significantly overunder-represented GO cross-talk pairs for Grr1
knock-out case study
TYPE GO term 1 GO term 2 GO ID1 GO ID2
F channel or pore class transporter
activity
ion transporter activity 15267 15075
F ATPase activity coupled to
movement of substances
ion transporter activity 43492 15075
F ion binding ion transporter activity 43167 15075
F hydrolase activity ion transporter activity 16787 15075
F transferase activity ion transporter activity 16740 15075
F alcohol transporter activity ion transporter activity 15665 15075
F peptide transporter activity ion transporter activity 15197 15075
F ion transporter activity ion transporter activity 15075 15075
C intracellular organelle ubiquitin ligase complex 43229 151
C intracellular ubiquitin ligase complex 5622 151
C membrane-bound organelle ubiquitin ligase complex 43227 151
F ATPase activity coupled to
movement of substances
peptide transporter activity 43492 15197
F ATPase activity coupled to
movement of substances
channel or pore class
transporter activity
43492 15267
F ATPase activity coupled to
movement of substances
alcohol transporter activity 43492 15665
F nucleobase nucleoside nucleotide
and nucleic acid transporter activity
nucleobase nucleoside
nucleotide and nucleic acid
transporter activity
15932 15932
F lyase activity nucleobase nucleoside
nucleotide and nucleic acid
transporter activity
16829 15932
C intracellular organelle membrane 43229 16020
C immature spore membrane 42763 16020
C pyruvate dehydrogenase complex membrane 45254 16020
C external encapsulating structure membrane 30312 16020
C non-membrane-bound organelle membrane 43228 16020
C membrane-bound organelle membrane 43227 16020
P cellular physiological process cell growth 50875 16049
C eukaryotic 48S initiation complex eukaryotic 43S preinitiation
complex
16283 16282
C eukaryotic 43S preinitiation
complex
eukaryotic 43S preinitiation
complex
16282 16282
C non-membrane-bound organelle eukaryotic 43S preinitiation
complex
43228 16282
C non-membrane-bound organelle eukaryotic 48S initiation
complex
43228 16283
C intracellular organelle hydrogen-translocating V-
type ATPase complex
43229 16471
F ion binding oxidoreductase activity 43167 16491
78
TYPE GO term 1 GO term 2 GO ID1 GO ID2
F transferase activity oxidoreductase activity 16740 16491
C RNA polymerase complex DNA-directed RNA
polymerase II holoenzyme
30880 16591
F ion binding nucleotide binding 43167 166
F receptor signaling protein activity nucleotide binding 5057 166
F carrier activity nucleotide binding 5386 166
F electron transporter activity nucleotide binding 5489 166
F protein binding nucleotide binding 5515 166
F ATPase activity coupled to
movement of substances
nucleotide binding 43492 166
F ion transporter activity nucleotide binding 15075 166
F transferase activity nucleotide binding 16740 166
F cyclase activity nucleotide binding 9975 166
F GTPase regulator activity transferase activity 30695 16740
F ligase activity transferase activity 16874 16740
F ion binding transferase activity 43167 16740
F lyase activity transferase activity 16829 16740
F hydrolase activity transferase activity 16787 16740
F ATPase activity coupled to
movement of substances
transferase activity 43492 16740
F ion binding hydrolase activity 43167 16787
F ATPase activity coupled to
movement of substances
hydrolase activity 43492 16787
F hydrolase activity hydrolase activity 16787 16787
F GTPase regulator activity lyase activity 30695 16829
F vitamin binding lyase activity 19842 16829
F ion binding ligase activity 43167 16874
C intracellular organelle exosome (RNase complex) 43229 178
C intracellular exosome (RNase complex) 5622 178
P regulation of physiological process sexual reproduction 50791 19953
P cellular physiological process sexual reproduction 50875 19953
P negative regulation of biological
process
sexual reproduction 48519 19953
P regulation of cellular process sexual reproduction 50794 19953
P reproductive physiological process sexual reproduction 50876 19953
P non-developmental growth sexual reproduction 48590 19953
P regulation of cellular process asexual reproduction 50794 19954
P localization asexual reproduction 51179 19954
P asexual reproduction asexual reproduction 19954 19954
P cell differentiation asexual reproduction 30154 19954
P reproductive physiological process asexual reproduction 50876 19954
P regulation of physiological process asexual reproduction 50791 19954
P cellular physiological process asexual reproduction 50875 19954
P non-developmental growth asexual reproduction 48590 19954
79
TYPE GO term 1 GO term 2 GO ID1 GO ID2
C membrane-bound organelle cell fraction 43227 267
C intracellular cell fraction 5622 267
C intracellular organelle cell fraction 43229 267
P reproductive physiological process cell differentiation 50876 30154
P cell differentiation cell differentiation 30154 30154
P filamentous growth cell differentiation 30447 30154
P non-developmental growth cell differentiation 48590 30154
P cellular physiological process cell differentiation 50875 30154
C intracellular organelle external encapsulating
structure
43229 30312
C membrane-bound organelle external encapsulating
structure
43227 30312
C non-membrane-bound organelle site of polarized growth 43228 30427
C intracellular organelle site of polarized growth 43229 30427
C site of polarized growth site of polarized growth 30427 30427
P reproductive physiological process filamentous growth 50876 30447
P non-developmental growth filamentous growth 48590 30447
C ribonucleoprotein complex ribonucleoprotein complex 30529 30529
C intracellular organelle ribonucleoprotein complex 43229 30529
C intracellular organelle Noc complex 43229 30689
F ion binding GTPase regulator activity 43167 30695
F ATPase activity coupled to
movement of substances
GTPase regulator activity 43492 30695
C non-membrane-bound organelle RNA polymerase complex 43228 30880
C intracellular organelle transcription export complex 43229 346
C intracellular transcription export complex 5622 346
C non-membrane-bound organelle transcription export complex 43228 346
C membrane-bound organelle transcription export complex 43227 346
F RNA polymerase II transcription
factor activity
nucleic acid binding 3702 3676
F nucleic acid binding nucleic acid binding 3676 3676
F cyclase activity nucleic acid binding 9975 3676
F protein binding nucleic acid binding 5515 3676
F hydrolase activity nucleic acid binding 16787 3676
F translation factor activity nucleic
acid binding
nucleic acid binding 8135 3676
F electron transporter activity nucleic acid binding 5489 3676
P cellular physiological process regulation of growth 50875 40008
P regulation of physiological process regulation of gene
expression epigenetic
50791 40029
P regulation of gene expression
epigenetic
regulation of gene
expression epigenetic
40029 40029
P negative regulation of biological
process
regulation of gene
expression epigenetic
48519 40029
P cellular physiological process regulation of gene 50875 40029
80
TYPE GO term 1 GO term 2 GO ID1 GO ID2
expression epigenetic
P regulation of cellular process regulation of gene
expression epigenetic
50794 40029
P regulation of cellular process homeostasis 50794 42592
P cellular physiological process homeostasis 50875 42592
P regulation of physiological process homeostasis 50791 42592
C intracellular organelle immature spore 43229 42763
C membrane-bound organelle immature spore 43227 42763
C non-membrane-bound organelle immature spore 43228 42763
C membrane-bound organelle cell projection 43227 42995
C intracellular organelle cell projection 43229 42995
F ion binding ion binding 43167 43167
F ATPase activity coupled to
movement of substances
ion binding 43492 43167
C pyruvate dehydrogenase complex membrane-bound organelle 45254 43227
C membrane-bound organelle membrane-bound organelle 43227 43227
C organelle lumen membrane-bound organelle 43233 43227
C non-membrane-bound organelle non-membrane-bound
organelle
43228 43228
C intracellular organelle non-membrane-bound
organelle
43229 43228
C organelle lumen intracellular organelle 43233 43229
C ubiquinol-cytochrome-c reductase
complex
intracellular organelle 45285 43229
C respiratory chain complex III intracellular organelle 45275 43229
C pyruvate dehydrogenase complex intracellular organelle 45254 43229
F ATPase activity coupled to
movement of substances
ATPase activity coupled to
movement of substances
43492 43492
F cyclase activity helicase activity 9975 4386
F ATPase activity coupled to
movement of substances
helicase activity 43492 4386
F ion transporter activity helicase activity 15075 4386
F transferase activity helicase activity 16740 4386
P cellular physiological process negative regulation of
biological process
50875 48519
P regulation of physiological process negative regulation of
biological process
50791 48519
P non-developmental growth negative regulation of
biological process
48590 48519
P regulation of cellular process negative regulation of
biological process
50794 48519
P regulation of enzyme activity negative regulation of
biological process
50790 48519
F receptor signaling protein activity enzyme inhibitor activity 5057 4857
P localization non-developmental growth 51179 48590
P regulation of physiological process non-developmental growth 50791 48590
81
TYPE GO term 1 GO term 2 GO ID1 GO ID2
P cellular physiological process non-developmental growth 50875 48590
P non-developmental growth non-developmental growth 48590 48590
P reproductive physiological process non-developmental growth 50876 48590
P regulation of cellular process non-developmental growth 50794 48590
F ion binding receptor activity 43167 4872
C ribonucleoprotein complex proteasome complex (sensu
Eukaryota)
30529 502
C intracellular organelle proteasome complex (sensu
Eukaryota)
43229 502
C proteasome regulatory particle
(sensu Eukaryota)
proteasome complex (sensu
Eukaryota)
5838 502
C intracellular proteasome complex (sensu
Eukaryota)
5622 502
C non-membrane-bound organelle proteasome complex (sensu
Eukaryota)
43228 502
F transferase activity receptor signaling protein
activity
16740 5057
F ion binding receptor signaling protein
activity
43167 5057
P cellular physiological process regulation of enzyme activity 50875 50790
P regulation of enzyme activity regulation of enzyme activity 50790 50790
P regulation of physiological process regulation of physiological
process
50791 50791
P localization regulation of physiological
process
51179 50791
P regulation of cellular process regulation of physiological
process
50794 50791
P regulation of cellular process regulation of cellular process 50794 50794
P localization regulation of cellular process 51179 50794
P reproductive physiological process cellular physiological process 50876 50875
P localization localization 51179 51179
F ATPase activity coupled to
movement of substances
lipid transporter activity 43492 5319
F hydrolase activity carrier activity 16787 5386
F transferase activity carrier activity 16740 5386
F ATPase activity coupled to
movement of substances
carrier activity 43492 5386
F ion transporter activity carrier activity 15075 5386
F alcohol transporter activity carrier activity 15665 5386
F channel or pore class transporter
activity
carrier activity 15267 5386
F ion transporter activity intracellular transporter
activity
15075 5478
F ATPase activity coupled to
movement of substances
intracellular transporter
activity
43492 5478
F transferase activity electron transporter activity 16740 5489
82
TYPE GO term 1 GO term 2 GO ID1 GO ID2
F ligase activity electron transporter activity 16874 5489
F ion binding electron transporter activity 43167 5489
F transferase activity protein binding 16740 5515
F cyclase activity protein binding 9975 5515
C proteasome regulatory particle
(sensu Eukaryota)
intracellular 5838 5622
C ribonucleoprotein complex intracellular 30529 5622
C ubiquinol-cytochrome-c reductase
complex
intracellular 45285 5622
C mRNA cleavage factor complex intracellular 5849 5622
C respiratory chain complex III intracellular 45275 5622
C histone methyltransferase complex intracellular 35097 5622
C mitochondrial inner membrane
presequence translocase complex
intracellular 5744 5622
C immature spore intracellular 42763 5622
C transcription factor complex intracellular 5667 5622
C pyruvate dehydrogenase complex intracellular 45254 5622
C cell projection intracellular 42995 5622
C Noc complex intracellular 30689 5622
C site of polarized growth intracellular 30427 5622
C bud intracellular 5933 5622
C eukaryotic 43S preinitiation
complex
intracellular 16282 5622
C external encapsulating structure intracellular 30312 5622
C hydrogen-translocating V-type
ATPase complex
intracellular 16471 5622
C microtubule associated complex intracellular 5875 5622
C unlocalized protein complex transcription factor complex 5941 5667
C intracellular organelle transcription factor complex 43229 5667
C immature spore transcription factor complex 42763 5667
C membrane-bound organelle transcription factor complex 43227 5667
C transcription factor complex transcription factor complex 5667 5667
C DNA-directed RNA polymerase II
holoenzyme
transcription factor complex 16591 5667
C membrane-bound organelle mitochondrial inner
membrane presequence
translocase complex
43227 5744
C intracellular organelle mitochondrial inner
membrane presequence
translocase complex
43229 5744
C membrane-bound organelle proteasome regulatory particle
(sensu Eukaryota)
43227 5838
C intracellular organelle proteasome regulatory particle
(sensu Eukaryota)
43229 5838
C intracellular organelle mRNA cleavage factor
complex
43229 5849
83
TYPE GO term 1 GO term 2 GO ID1 GO ID2
C membrane-bound organelle mRNA cleavage factor
complex
43227 5849
C intracellular organelle microtubule associated
complex
43229 5875
C site of polarized growth microtubule associated
complex
30427 5875
C membrane microtubule associated
complex
16020 5875
C membrane-bound organelle microtubule associated
complex
43227 5875
C bud microtubule associated
complex
5933 5875
C non-membrane-bound organelle microtubule associated
complex
43228 5875
C cell projection microtubule associated
complex
42995 5875
C site of polarized growth bud 30427 5933
C non-membrane-bound organelle bud 43228 5933
C bud bud 5933 5933
C intracellular organelle bud 43229 5933
P regulation of gene expression
epigenetic
response to stress 40029 6950
P asexual reproduction response to stress 19954 6950
P negative regulation of biological
process
response to stress 48519 6950
P response to abiotic stimulus response to stress 9628 6950
P non-developmental growth response to stress 48590 6950
P morphogenesis response to stress 9653 6950
P regulation of physiological process response to stress 50791 6950
P cell communication response to stress 7154 6950
P regulation of enzyme activity response to stress 50790 6950
P regulation of cellular process response to stress 50794 6950
P cellular physiological process response to stress 50875 6950
P response to endogenous stimulus response to stress 9719 6950
P negative regulation of biological
process
cell communication 48519 7154
P non-developmental growth cell communication 48590 7154
P positive regulation of biological
process
cell communication 48518 7154
P cell differentiation cell communication 30154 7154
P regulation of enzyme activity cell communication 50790 7154
P response to abiotic stimulus cell communication 9628 7154
P cellular physiological process cell communication 50875 7154
P regulation of cellular process cell communication 50794 7154
P cell communication cell communication 7154 7154
P sexual reproduction cell communication 19953 7154
84
TYPE GO term 1 GO term 2 GO ID1 GO ID2
P metabolism cell communication 8152 7154
P morphogenesis cell communication 9653 7154
P reproductive physiological process cell communication 50876 7154
P regulation of physiological process cell communication 50791 7154
P asexual reproduction cell communication 19954 7154
P aging cell communication 7568 7154
P death cell communication 16265 7154
P response to endogenous stimulus aging 9719 7568
P cellular physiological process locomotory behavior 50875 7626
F cyclase activity enzyme activator activity 9975 8047
F ligase activity translation factor activity
nucleic acid binding
16874 8135
F transferase activity translation factor activity
nucleic acid binding
16740 8135
P homeostasis metabolism 42592 8152
P asexual reproduction metabolism 19954 8152
P regulation of enzyme activity metabolism 50790 8152
P regulation of cellular process metabolism 50794 8152
P regulation of gene expression
epigenetic
metabolism 40029 8152
P regulation of physiological process metabolism 50791 8152
P response to abiotic stimulus metabolism 9628 8152
P morphogenesis metabolism 9653 8152
P negative regulation of biological
process
metabolism 48519 8152
P response to endogenous stimulus metabolism 9719 8152
P sexual reproduction metabolism 19953 8152
P reproductive physiological process metabolism 50876 8152
P non-developmental growth metabolism 48590 8152
F ion binding lipid binding 43167 8289
F ion transporter activity protein transporter activity 15075 8565
F ATPase activity coupled to
movement of substances
protein transporter activity 43492 8565
F transferase activity small protein conjugating
enzyme activity
16740 8639
P regulation of enzyme activity response to abiotic stimulus 50790 9628
P cellular physiological process response to abiotic stimulus 50875 9628
P sexual reproduction response to abiotic stimulus 19953 9628
P asexual reproduction response to abiotic stimulus 19954 9628
P response to abiotic stimulus response to abiotic stimulus 9628 9628
P reproductive physiological process response to abiotic stimulus 50876 9628
P negative regulation of biological
process
response to abiotic stimulus 48519 9628
P non-developmental growth response to abiotic stimulus 48590 9628
P cellular physiological process morphogenesis 50875 9653
85
TYPE GO term 1 GO term 2 GO ID1 GO ID2
P asexual reproduction morphogenesis 19954 9653
P non-developmental growth morphogenesis 48590 9653
P regulation of cellular process response to endogenous
stimulus
50794 9719
P regulation of physiological process response to endogenous
stimulus
50791 9719
P response to endogenous stimulus response to endogenous
stimulus
9719 9719
P death response to endogenous
stimulus
16265 9719
P asexual reproduction response to endogenous
stimulus
19954 9719
P regulation of gene expression
epigenetic
response to endogenous
stimulus
40029 9719
P negative regulation of biological
process
response to endogenous
stimulus
48519 9719
P non-developmental growth response to endogenous
stimulus
48590 9719
P cellular physiological process response to endogenous
stimulus
50875 9719
F GTPase regulator activity cyclase activity 30695 9975
F transferase activity cyclase activity 16740 9975
86
References
1 Smith JC and D Figeys Proteomics technology in systems biology Mol
Biosyst 2006 2(8) p 364-70
2 Chen J Yan Z Shen C Dawn F and Wang M A Systems Biology Case
Study of Ovarian Cancer Drug Resistance JBCB 2007
3 Pinto FR et al Local correlation of expression profiles with gene
annotations--proof of concept for a general conciliatory method
Bioinformatics 2005 21(7) p 1037-45
4 Simpson R Proteins and proteomics a laboratory manual 2003 New York
Cold Spring Harbor Laboratory Press 926
5 Lesney M Pathways to the proteome From 2DE to HPLC Modern Drug
Discovery 2001 4(10) p 32-34 36 39
6 Tyers M and M Mann From genomics to proteomics Nature 2003
422(6928) p 193-7
7 Khalsa-Moyers G and WH McDonald Developments in mass spectrometry
for the analysis of complex protein mixtures Brief Funct Genomic Proteomic
2006 5(2) p 98-111
8 Aebersold R and M Mann Mass spectrometry-based proteomics Nature
2003 422(6928) p 198-207
9 Herbert CG and RAW Johnstone Mass spectrometry basics 2003 Boca
Raton CRC Press 474 p
10 Guerrera IC and O Kleiner Application of mass spectrometry in proteomics
Biosci Rep 2005 25(1-2) p 71-93
11 Barker J DJ Ando and R Davis Mass spectrometry 2nd ed 1999 New
York John Wiley amp Sons xxii 509
12 Frohlich T and GJ Arnold Proteome research based on modern liquid
chromatography - tandem mass spectrometry separation identification and
quantification J Neural Transm 2006 113(8) p 973-94
13 Ma S and R Subramanian Detecting and characterizing reactive metabolites
by liquid chromatographytandem mass spectrometry J Mass Spectrom 2006
41(9) p 1121-39
14 Yates JR 3rd et al Method to correlate tandem mass spectra of modified
peptides to amino acid sequences in the protein database Anal Chem 1995
67(8) p 1426-36
15 Old WM et al Comparison of Label-free Methods for Quantifying Human
Proteins by Shotgun Proteomics Mol Cell Proteomics 2005 4(10) p 1487-
502
16 Keller A et al Empirical statistical model to estimate the accuracy of
peptide identifications made by MSMS and database search Anal Chem
2002 74(20) p 5383-92
17 Nesvizhskii AI et al A statistical model for identifying proteins by tandem
mass spectrometry Anal Chem 2003 75(17) p 4646-58
18 Cottrell JS Protein identification by peptide mass fingerprinting Pept Res
1994 7(3) p 115-24
87
19 Gras R and M Muller Computational aspects of protein identification by
mass spectrometry Curr Opin Mol Ther 2001 3(6) p 526-32
20 Yates JR 3rd Database searching using mass spectrometry data
Electrophoresis 1998 19(6) p 893-900
21 Yan Z et al Data Management in Expression-based Proteomics in
Database Modeling in Biology Theories and Practices To appear 2006
22 Garwood K et al PEDRo a database for storing searching and
disseminating experimental proteomics data BMC Genomics 2004 5(1) p
68
23 Taylor CF et al A systematic approach to modeling capturing and
disseminating proteomics experimental data Nat Biotechnol 2003 21(3) p
247-54
24 Garden P R Alm and J Hakkinen PROTEIOS an open source proteomics
initiative Bioinformatics 2005 21(9) p 2085-7
25 Ferry-Dumazet H et al PROTICdb a web-based application to store track
query and compare plant proteome data Proteomics 2005 5(8) p 2069-81
26 Wilke A et al Bioinformatics support for high-throughput proteomics J
Biotechnol 2003 106(2-3) p 147-56
27 Cannataro M G Cuda and P Veltri Modeling and designing a proteomics
application on PROTEUS Methods Inf Med 2005 44(2) p 221-6
28 Yanagisawa K et al Universal Proteomics tools for Protein Quantification
and Data Management -Xome amp Mass Navigator Genome Informatics 15th
INternational Conference on Genome Informatics 2004
29 Weston AD and L Hood Systems Biology Proteomics and the Future of
Health Care Toward Predictive Preventative and Personalized Medicine J
Proteome Res 2004 3(2) p 179-196
30 Gene_Ontology httpwwwgeneontologyorg
31 Lomax J Get ready to GO A biologists guide to the Gene Ontology Brief
Bioinform 2005 6(3) p 298-304
32 Beisvag V et al GeneTools - application for functional annotation and
statistical hypothesis testing BMC Bioinformatics 2006 7(1) p 470
33 Feng W et al Development of gene ontology tool for biological
interpretation of genomic and proteomic data AMIA Annu Symp Proc 2003
p 839
34 Lottaz C and R Spang Molecular decomposition of complex clinical
phenotypes using biologically structured analysis of microarray data
Bioinformatics 2005 21(9) p 1971-8
35 Khatri P and S Draghici Ontological analysis of gene expression data
current tools limitations and open problems Bioinformatics 2005 21(18) p
3587-95
36 Verducci JS et al Microarray analysis of gene expression considerations
in data mining and statistical treatment Physiol Genomics 2006 25(3) p
355-63
37 Draghici S Data Analysis Tools for DNA Microarrays Mathematical
Biology and Medicine Series 2003 Chapman amp HallCRC
88
38 Bonferroni C Teoria statistica delle classi e calcolo delle probabilit
Pubblicazioni del R Istituto Superiore di Scienze Economiche e Commerciali
di Firenze 1936(8) p 3-62
39 Benjamini Y and Y Hochberg Controlling the false discovery rate a
practical and powerful approach to multiple testing Journal of the Royal
Statistical Society Series B (Methodological) 1995 57(1) p 289-300
40 Cheverud JM A simple correction for multiple comparisons in interval
mapping genome scans Heredity 2001 87(Pt 1) p 52-8
41 Zhang B S Kirov and J Snoddy WebGestalt an integrated system for
exploring gene sets in various biological contexts Nucleic Acids Res 2005
33(Web Server issue) p W741-8
42 Castillo-Davis CI and DL Hartl GeneMerge--post-genomic analysis data
mining and hypothesis testing Bioinformatics 2003 19(7) p 891-2
43 Shah NH and NV Fedoroff CLENCH a program for calculating Cluster
ENriCHment using the Gene Ontology Bioinformatics 2004 20(7) p 1196-7
44 Zhong S et al GoSurfer a graphical interactive tool for comparative
analysis of large gene sets in Gene Ontology space Appl Bioinformatics 2004
3(4) p 261-4
45 Khatri P et al Onto-Tools an ensemble of web-accessible ontology-based
tools for the functional design and interpretation of high-throughput gene
expression experiments Nucleic Acids Res 2004 32(Web Server issue) p
W449-56
46 Martin D et al GOToolBox functional analysis of gene datasets based on
Gene Ontology Genome Biol 2004 5(12) p R101
47 Draghici S et al Onto-Tools the toolkit of the modern biologist Onto-
Express Onto-Compare Onto-Design and Onto-Translate Nucleic Acids Res
2003 31(13) p 3775-81
48 Ball CA et al Saccharomyces Genome Database provides tools to survey
gene expression and functional analysis data Nucleic Acids Res 2001 29(1)
p 80-1
49 Barabasi AL and ZN Oltvai Network biology understanding the cells
functional organization Nat Rev Genet 2004 5(2) p 101-13
50 Gavin AC et al Functional organization of the yeast proteome by
systematic analysis of protein complexes Nature 2002 415(6868) p 141-7
51 Ho Y et al Systematic identification of protein complexes in Saccharomyces
cerevisiae by mass spectrometry Nature 2002 415(6868) p 180-3
52 Ito T et al A comprehensive two-hybrid analysis to explore the yeast protein
interactome Proc Natl Acad Sci U S A 2001 98(8) p 4569-74
53 Uetz P et al A comprehensive analysis of protein-protein interactions in
Saccharomyces cerevisiae Nature 2000 403(6770) p 623-7
54 Giot L et al A protein interaction map of Drosophila melanogaster Science
2003 302(5651) p 1727-36
55 Li S et al A map of the interactome network of the metazoan C elegans
Science 2004 303(5657) p 540-3
56 Stelzl U et al A human protein-protein interaction network a resource for
annotating the proteome Cell 2005 122(6) p 957-68
89
57 Rual JF et al Towards a proteome-scale map of the human protein-protein
interaction network Nature 2005 437(7062) p 1173-8
58 Brown KR and I Jurisica Online predicted human interaction database
Bioinformatics 2005 21(9) p 2076-82
59 Benson M and R Breitling Network theory to understand microarray studies
of complex diseases Curr Mol Med 2006 6(6) p 695-701
60 Wachi S K Yoneda and R Wu Interactome-transcriptome analysis reveals
the high centrality of genes differentially expressed in lung cancer tissues
Bioinformatics 2005 21(23) p 4205-8
61 Sharan R et al Conserved patterns of protein interaction in multiple species
Proc Natl Acad Sci U S A 2005 102(6) p 1974-9
62 Christie KR et al Saccharomyces Genome Database (SGD) provides tools
to identify and analyze sequences from Saccharomyces cerevisiae and related
sequences from other organisms Nucleic Acids Res 2004 32(Database issue)
p D311-4
63 Issel-Tarver L et al Saccharomyces Genome Database Methods Enzymol
2002 350 p 329-46
64 Weng S et al Saccharomyces Genome Database (SGD) provides
biochemical and structural information for budding yeast proteins Nucleic
Acids Res 2003 31(1) p 216-8
65 Alfarano C et al The Biomolecular Interaction Network Database and
related tools 2005 update Nucleic Acids Res 2005 33(Database issue) p
D418-24
66 Bader GD D Betel and CW Hogue BIND the Biomolecular Interaction
Network Database Nucleic Acids Res 2003 31(1) p 248-50
67 Bader GD et al BIND--The Biomolecular Interaction Network Database
Nucleic Acids Res 2001 29(1) p 242-5
68 Calvano SE et al A network-based analysis of systemic inflammation in
humans Nature 2005 437(7061) p 1032-7
69 Said MR et al Global network analysis of phenotypic effects protein
networks and toxicity modulation in Saccharomyces cerevisiae Proc Natl
Acad Sci U S A 2004 101(52) p 18006-11
70 Seiden-Long IM et al Transcriptional targets of hepatocyte growth factor
signaling and Ki-ras oncogene activation in colorectal cancer Oncogene
2006 25(1) p 91-102
71 Motamed-Khorasani A et al Differentially androgen-modulated genes in
ovarian epithelial cells from BRCA mutation carriers and control patients
predict ovarian cancer survival and disease progression Oncogene 2006
72 Higgs RE et al Comprehensive label-free method for the relative
quantification of proteins from biological samples J Proteome Res 2005 4(4)
p 1442-50
73 Bolstad BM et al A comparison of normalization methods for high density
oligonucleotide array data based on variance and bias Bioinformatics 2003
19(2) p 185-93
74 Kersey PJ et al The International Protein Index an integrated database for
proteomics experiments Proteomics 2004 4(7) p 1985-8
90
75 Apweiler R A Bairoch and CH Wu Protein sequence databases Curr
Opin Chem Biol 2004 8(1) p 76-80
76 Efron B Large-scale simultaneous hypothesis testing the choice of a null
hypothesis JASA 2004 99 p 96-104
77 Chen J M Wang and C Shen An integrated computational proteomics
method to extract protein targets for Fanconi Anemia studies Proceedings of
the 21st Annual ACM Symposium on Applied Computing Dijion France In
press 2006
78 von Mering C et al STRING known and predicted protein-protein
associations integrated and transferred across organisms Nucleic Acids Res
2005 33(Database issue) p D433-7
79 Sivachenko A J Chen and C Martin ProteoLens A Visual Data Mining
Platform for Exploring Biological Networks BMC Bioinformatics 2006
80 Benjamini Y and D Yekutieli The control of the false discovery rate in
multiple testing under dependency Ann Statist 2001 29(4) p 1165ndash1188
81 Chen J C Shen and A Sivachenko An Integrated Computational
Proteomics Method to Extract Protein Targets for Fanconi Anemia Studies
Pacific Symposium on Biocomputing 2006 11 p 367-78
82 Olivero OA et al Preferential binding of cisplatin to mitochondrial DNA of
Chinese hamster ovary cells Mutat Res 1995 346(4) p 221-30
83 Chen J and J Carlis Genomic data modeling Information Systems 2003
28(4) p 287-310
84 Kishi T T Seno and F Yamao Grr1 functions in the ubiquitin pathway in
Saccharomyces cerevisiae through association with Skp1 Mol Gen Genet
1998 257(2) p 143-8
85 Skowyra D et al F-box proteins are receptors that recruit phosphorylated
substrates to the SCF ubiquitin-ligase complex Cell 1997 91(2) p 209-19
86 Spielewoy N et al Regulation and recognition of SCFGrr1 targets in the
glucose and amino acid signaling pathways Mol Cell Biol 2004 24(20) p
8994-9005
87 Willems AR et al SCF ubiquitin protein ligases and phosphorylation-
dependent proteolysis Philos Trans R Soc Lond B Biol Sci 1999 354(1389)
p 1533-50
88 Flick JS and M Johnston GRR1 of Saccharomyces cerevisiae is required for
glucose repression and encodes a protein with leucine-rich repeats Mol Cell
Biol 1991 11(10) p 5101-12
89 Blacketer MJ P Madaule and AM Myers Mutational analysis of
morphologic differentiation in Saccharomyces cerevisiae Genetics 1995
140(4) p 1259-75
90 Loeb JD et al Saccharomyces cerevisiae G1 cyclins are differentially
involved in invasive and pseudohyphal growth independent of the filamentation
mitogen-activated protein kinase pathway Genetics 1999 153(4) p 1535-46
91 Kishi T and F Yamao An essential function of Grr1 for the degradation of
Cln2 is to act as a binding core that links Cln2 to Skp1 J Cell Sci 1998 111
( Pt 24) p 3655-61
91
92 Jaquenoud M et al The Cdc42p effector Gic2p is targeted for ubiquitin-
dependent degradation by the SCFGrr1 complex Embo J 1998 17(18) p
5360-73
93 Barral Y S Jentsch and C Mann G1 cyclin turnover and nutrient uptake
are controlled by a common pathway in yeast Genes Dev 1995 9(4) p 399-
409
94 Kahana JA et al The yeast dynactin complex is involved in partitioning the
mitotic spindle between mother and daughter cells during anaphase B Mol
Biol Cell 1998 9(7) p 1741-56
95 Eckert-Boulet N B Regenberg and J Nielsen Grr1p is required for
transcriptional induction of amino acid permease genes and proper
transcriptional regulation of genes in carbon metabolism of Saccharomyces
cerevisiae Curr Genet 2005 47(3) p 139-49
96 Westergaard SL et al Elucidation of the role of Grr1p in glucose sensing by
Saccharomyces cerevisiae through genome-wide transcription analysis FEMS
Yeast Res 2004 5(3) p 193-204
92
Zhong Yan
E-Mail ohzhongyahoocom
Education
(1) SAS trainings (Session I SAS programming essentials Session II SAS data
manipulation) in SAS School Indianapolis
(2) MS in Bioinformatics Indiana University School of Informatics (GPA 3940)
(3) National Center for Biotech Information Regional Workshop
(4) Microarray data analysis workshop (in Chicago)
(5) MS in Cellular Biology from Academy of Military Medical Sciences Beijing
China
(6) BS in Physiology from Nanjing University Jiangsu Province China
Professional Experience
Apr 2006 ~ current Business Information Analyst HSBC
(1) Database administrator for Access databases database management automation
processes
(2) Application developer using VBA and VBScript
(3) Data auditor
(4) Reports generator using VBA SAS HTML and software tools
Sep 2005 ~ April 2006 Research assistant Discovery Informatics and
Computing Group at Indiana University School of Informatics
(1) Oracle databases development
(2) Proteomics data analysis and systems biology analysis in SQL et al
(3) Programming in Perl and PHP
Dec 2004 ~ Aug 2005 Research technician Pediatrics Hematology
Oncology Indiana University School of Medicine
(1) Database designer and administrator for Access database
(2) Clinical data analysis in SQL
(3) Microarray data analysis
(4) Programming in VBA Java C++ and Matlab
March 2000 ~ June 2001 Research technician Urology Department
Indiana University School of Medicine Research area Adenovirus gene
therapy for prostate cancer Cell culturing virus amplification and purification
plasmid and cosmid construction numerous assays
93
August 1994 ~ August 1999 Assistant Professor Institute of Pharmacology
and Toxicology Academy of Military Medical Sciences Beijing China
Supervise two technicians Research area Preclinical trial
psychopharmacological research new drug screening and evaluation Awarded
twice by the Institute for excellent work
August 1988 ~ August 1991 Assistant lecturer Traditional Chinese
Medicine College Jiangxi Province China
Computer Science Skills Familiar with object-oriented programming concept and programming languages
C C++ Java SAS Perl PHP JavaScript Matlab HTML XML UnixLinux
Excel programming JCL
Familiar with database design Oracle Access MySQL database management
systems SQL language
Familiar with many tools
Database related tools ErWin Toad for Oracle Aqua Data Studio Crystal
Reports Case Studio MYSQL-Front
Application development tools Eclipse XML Spy Komodo
Multimedia related tools Dreamweaver Flash Fireworks Illustrator
Adobe Photoshop Adobe Primere Pro (video editing tool) Adobe Encore
(DVD editing tool) SoundForge (sound editing tool) n-Track studio (sound
mixing tool) Logo design studio
Other tools Office (Excel Access PowerPoint Publisher) Lotus Notes
EndNotes SSH
Microarray data analysis (cDNA array and Affymetrix array) and gene
annotations
Knowledge for major biological databases such as NCBI OWL Swiss-Prot PIR
IPI SGD GeneOntology
Data mining techniques such as classification and clustering analysis association
rule extraction
Familiar with many bioinformatics tools
Hands-on Experience in Biological Research Primary neural cell culturing Cell line culturing (293 cells LnCap C4-2 cells
PC3 cells et al) Cell activity assay by MTT assay and Crystal violet assay X-Gal
staining Adenovirus amplification and purification Plaque assay for the virus
Protein concentration measurementWestern blot and Northern blot Making
competent bacteria and transformation Plasmid and Cosmid construction transfection
PCR and real-time PCR Plasmid DNA MiniPrep MidiPrep MaxiPrepDNA
extraction from tissue DNA recovery from gelRadio-labeled ligand receptor binding
assay saturation inhibition and kinetic assay Second messenger measurement RNA
microinjection of Xenopus Oocytes Animal models of depression (rat or mouse
forced swimming test tail suspension test olfactory bulbectomy for rats et al)
Projects
Lookup database management automation (In VBScript)
94
Reports automation processes (in VBA script and VBScript)
Pediatric leukemia database design implementation and management (in Access)
Customized designing an oracle database to store several high-throughput
experimental datasets
Designing and implementing an oracle database to integrate the data downloaded
from several public databases (Oracle)
Lab Ordering Database Design implementation and management
Forest Experiment Project Database Design and implementation (in MS Access)
Student course registration system (in both C and C++) Grocery Distributor
System (in C++) Building an AVL tree to generate a word histogram (in C++)
Graph for course schedules and shortest time schedule finding (in C++) Thread
and Synchronization in Nachos Operating System (in C++) Scheduling in
Nachos Operating System (in C++) Memory management in Nachos Operating
System (in C++)
Decision Tree and Neural Network Classification analysis to distinguish 9
different speakers based on 12 Japanese vowel pronunciations (Matlab neural
network toolbox and C45)
Clustering analysis of microarray data (Matlab)
Game character Name game Calculator (Java projects)
Moving fairy (in JavaScript)
Fun web site (in Flash)
Publications 1) Jake Chen Zhong Yan Changyu Shen et al A Systems Biology Case Study of Ovarian
Cancer Drug Resistance (Accepted for 2007 publication) 2) Zhong Yan Jake Chen et al Data Management in Expression-based Proteomics In
Database Modeling in Biology Practices and Challenges (to be published by Springer in 2006)
3) Susanne Ragg Marc Rosenman Eve Doucette Zhong Yan Julie Haydon Jada Paine
Nadine Lee Terry Vik Ketan Mane Katy Borner
Data visualization of Multiparameter Information in Acute Lymphoblastic Leukemia Expands the
Ability to Explore Prognostic Factors (Abstract 554689) 47th
ASH Annual Meeting Aug 2005
4)Zhong Yan Xiaozhuang Hong et al The effect of a new anticholinergic drug 3H]tricyclopinate
on human fetal cerebral cortex muscarinic receptors Bull Acad Mil Med Sci 1999 23(1) 35 ~
7 (Chinese)
5)Zhong Yan Yuhua Chen et al Effect of MO on animal models of depression China journal of
Chinese meteria medica 1999 suppl 81 ~ 2 (Chinese)
6)Zhong Yan Zhenghua Gong et al Effects of aqueous extracts of detoxified cotton seeds
(AEDCS) on the level of mouse spleen lymphocytes cyclic AMP Bull Acad Mil Med Sci
1999 23(2)136 (Chinese)
7)Zhong Yan Zhipu Luo et al The effect of equilinol on rat cerebral cortex GABAA receptors
Bull Acad Mil Med Sci 1998 22(3) 217 (Chinese)
8)Zhong Yan Xiaozhuang Hong et al The effect of a new cholinolytic-[3H]Tricyclopinate on
human brain muscarinic receptors Acta Pharmaceutica Sinica 1997 32(7) 506~10 (Chinese)
9)Zhong Yan Zhipu Luo Experimental methods of antidepressants In Modern experimental
methods in pharmacology ( I II ) Chief editor Juntian Zhang Beijing Medical University and
Peking Union Medical College associated press 1997 1061 ~ 71 ( Chinese)
10)Zhong Yan Zhenghua Gong et al Effect of oligosaccharide extracted from Morinda officinalis
How on corticosterone endangered primary cultured hippocampal neurons Bull Acad Mil Med
Sci (accepted before I came to USA)
11)Zhong Yan Zhenghua Gong et al A new potential anxiolytic its effects on mitochondrial
DBI receptors and on rat elevated plus maze model (waiting for patent application before I came
to USA))

1
1 INTRODUCTION
Over the past two centuries life science research has been rooted in the assumption
that complex problems may be solvable by dividing them into smaller simpler and
thus more manageable units While the human body is considered to be an integrated
system with a company of components the natural tendency of medicine is to separate
the single factor that is most responsible for the consequence It is undeniable that this
approach has been a success for years However it leaves little room for contextual
information The need to make sense of complex interactions has led some researchers
to shift from a component-level to system-level perspective With the progress in high-
throughput technologies and bioinformatics (for example many bioinformatics
databases are available to the public) in recent years it is possible to determine to
what extent genetic or environmental manipulation of a biological system affects the
expression of thousands of genes and proteins This form of study requires a shift from
a conventional individual approach (divide-and-conquer approach) towards an
integrated approach The integrated approach leads to an emerging field called
systems biology[1] Systems biology takes into account complex interactions of genes
proteins and cell elements By studying the relationships and interactions between
various parts of a biological system it is hoped that researchers might build a system-
level understanding of biological systems and gain novel insights towards discoveries
In this project we have developed a novel systems biology approach to study
proteomics experimental data Using this approach we have performed case studies on
two proteomics datasets (1) human ovarian cancer drug resistance (2) yeast Grr1
knock-out Our systems biology studies consist of the following parts (see figure 11)
(1) Analyzing mass-spectrometry derived proteomics experimental data to identify
differentially expressed proteins in cisplatin-sensitive vs cisplatin-resistant ovarian
cell line samples and yeast Grr1 knock-out vs wild-type samples (2) Integrating
genomics and functional genomics data with experimental results and the molecular
context of protein-protein interaction networks and gene functional categories we use
OPHID (Online Predicted Human Interaction Database) for our ovarian cancer study
2
and an in-house developed yeast protein-protein interaction database (SBG) for our
yeast study The integration involves identifying protein interaction partners for the
differentially-expressed protein set (seed proteins) as well as identifying the gene
ontology cross-talk partners in the context of the protein-protein interaction network
(3) Visual interpretation of molecular networks[2]
Figure 11 Framework of novel systems biology approach
3
Unlike conventional methods which lack functional integration of data and
effective analysis tools to derive functional relationships between heterogeneous while
related data our studies have the following significance First we have developed a
novel systems biology approach which can identify ldquosignificantly interacting protein
categoriesrdquo This is distinct from the recent approach of using GO annotations for
differentially expressed gene classifications resulting from microarray analysis[3] Our
method can be generalized to enable other similar systems biology studies in which
statistically significant experimental ldquoomicsrdquo results public protein interactome data
and genomeproteome annotation database are integrated into an easy-to-interpret two-
dimensional visualization matrix[2] Second to integrate yeast protein-protein
interaction data from different sources we have created our own metadata for
experimental methods that are used to detect interacting protein pairs (see section 32
in paragraph ldquoProtein Interactome Datardquo) Third we have developed our unique
scoring model (see section 33) to calculate reliability scores for the interacting protein
pairs We applied our scoring model to the combined protein-protein interaction
dataset to calculate a reliability score for each unique interacting pair This enables our
significant protein ranking analysis (see section 310) Fourth we applied a unique
molecular network visual representation scheme to the significant biological process
categories and significant between-category interactions (see section 35 and section 4
for two case studies) Our new approach based analysis will help the life science
researchers validate their discoveries and generate new hypotheses
4
2 BACKGROUND
21 Mass Spectrometry - based Proteomics
Proteomics refers to the branch of discovery science focusing on large scale
analysis of proteins Initially the term proteomics was used to describe the study of
expressed proteins of a genome using a combination of two-dimensional (2D) gel
electrophoresis to separate proteins and mass spectrometry (MS) to identify them
This approach is now referred to as ldquoexpressionrdquo or ldquoglobal profilingrdquo proteomics
However the scope of proteomics has now broadened to include the study of ldquoprotein-
proteinrdquo interactions (protein complexes) referred to as cell-mapping proteomics [4
5] Proteomics complements other functional genomics including microarray
expression profiling systematic phenotypic profiling systematic genetics and small-
molecule-based arrays [6] Compared with genomics proteomics is much more
complicated While the genome is rather stable the proteome differs from cell to cell
and is constantly changing through its biochemical interactions with the genome and
the environment
Mass spectrometry-based proteomics has a distinct application in unraveling the
levels of protein abundance post-translational modifications (eg glycosylation
acetylation phosphorylation and myristoylation) as well as protein-protein
interactions which are the formative drive in a cell Changes in these parameters are
not revealed by measuring mRNA levels Mass spectrometry-based proteomics
provides opportunities to identify target proteins that are differentially regulated under
different conditions It helps biologists elucidate the dynamics of important signaling
and regulatory networks in biological process
211 Mass spectrometry
Mass spectrometry is the method for determining the molecular weight of chemical
compounds by separating molecular ions according to their mass-to-charge ratio (mz)
Mass spectrometers are powerful devices used for this purpose Mass spectrometric
measurements are carried out in the gas phase on ionized analytes A mass
5
spectrometer consists of an ionization source for ion-generation a mass analyzer that
measures the mass-to-charge ratio (mz) of the ionized analytes and a detector that
registers the number of ions at each mz value The ionization source transfers
molecules from solution or solid phase into gas-phase ions that can then be
manipulated within electric or magnetic fields Ionization techniques are critical for
determining what types of samples can be analyzed by mass spectrometry The two
most frequently used ionization techniques are ESI (Electrospray Ionization) and
MALDI (Matrix-Assisted Laser DesorptionIonization) ESI ionizes the analytes out
of a solution and is therefore readily coupled to liquid-based separation tools such as
HPLC MALDI sublimates and ionizes the samples out of a fry crystalline matrix via
laser pulses MALDI-MS is normally used to analyze relatively simple peptide
mixtures whereas integrated liquid-chromatography ESI-MS systems (LC-MS) are
preferred for the analysis of complex samples [7 8]
The mass-analyzer is used to separate gas-phase ions based on their mass-to-charge
(mz) ratios and is central to the technology In the context of proteomics its key
parameters are sensitivity resolution mass accuracy and its ability to generate
information-rich ion mass spectra from peptide fragments (tandem mass or MS-MS
spectra) There are four basic types of mass analyzers currently used in proteomics
research These are the ion trap time-of-flight (TOF) quadrupole and Fourier
Transform ion cyclotron (FT-ICR-MS) analyzers They are very different in design
and performance and each has its own strength and weakness These analyzers can be
stand alone or in some cases put in tandem to take advantage of the strengths of each
[8-11]
Both MALDI and ESI are soft ionization techniques in that ions are created with
low internal energy and thus undergo little fragmentation Mass-to-charge ratios can
be readily and accurately measured for intact ions but this information does not
provide data on the covalent structure of the ion For peptides and proteins in
particular data related to the amino acid sequence of the molecule are desired To
generate this information new configurations of mass spectrometers have been
6
developed to isolate ions fragment them and then measure the mass-to-charge ratio of
the fragments These devices are collectively called tandem mass spectrometers A
tandem mass spectrometer is a mass spectrometer that has more than one analyzer in
practice usually two The two analyzers are separated by a collision cell into which an
inert gas (eg argon henium) is admitted to collide with the selected sample ions and
bring about their fragmentation (collision-induced dissociation or CID) The analyzers
can be of the same or different types the most combinations being quadrupole-
quadrupole magnetic sector-quadrupole and quadrupole-TOF [12 13]
The first analyzer of a tandem mass spectrometer is used to select user-specific
peptide ions from peptide mixtures These chosen ions then pass into the collision cell
and are bombarded by the gas molecules into fragment ions which are then analyzed
The original mass to charge ratio of each ion as well its specific fragment spectrum are
used to search a database of theoretical peptide fragmentation spectra often resulting
in unambiguous peptide identification The data from each of these methodologies is
represented as output peak list files adherent to a specific file format that is dependent
on the instrument used for analysis Programs such as SEQUEST [14] and MASCOT
(httpwwwmatrixsciencecom) correlate the experimentally acquired MSMS spectra
to the computer generated MSMS spectra and produce various scores used to assess
the validity of this correlation Each correlation program uses a different algorithm to
assign peptides and thus each program produces overlapping but variable outputs
Various laboratories have used different approaches to exploit the advantages of both
software algorithms [15] and to validate more thoroughly the results of these
algorithms individually [16 17] It is apparent that no single analysis system has been
universally accepted to date
212 Proteomics data analysis
In a typical mass spectrometry based experiment protein samples are digested by a
protease (usually trypsin) and the resulting peptides can be further separated by liquid
chromatography before directly introduced into MS The peptide fragment masses are
determined by MS which provides a fingerprint of the protein of interest The masses
7
are compared to the predicted proteolytic peptides from sequence databases taking into
account user specified parameters such as the number of missed cleavage sites If
however database searching leads to ambiguous results then further MS analyses
involving the usage of tandem mass spectrometry (MSMS) are undertaken
sequentially on each peptide in the mixture to generate a sequence or partial sequence
known as a sequence tag for these peptides This is frequently achieved by using ESI-
MSMS Further database searching with both the molecular mass of the peptide and
the sequence tag information should lead to unambiguous protein identification[18-20]
Finally the instrument generates an output peak list file in a specific file format
depending on the type of instrument used and an analysis pipeline (Figure 21) can be
used to take the peak list file as input and generate a series of output files
Figure 21 Proteomics data analysis pipeline
213 Proteomics data management tools
The scale and complexity of proteomics data require software tools to facilitate
data management Compared with microarray data management tools there are few
tools available for mass spectrometry proteomics studies Below we summarize most
of the proteomics data management tools This work is based on my previous
publication [21]
PEDRo database tool (httppedromanacuk ) is an open source tool for
proteomics data entry and modeling However it is not a comprehensive query and
analysis tool The PEDRo tool implements the PEDRo data model (Refer to section 3)
which was released early in 2003 The schema of the PEDRo data model is available
8
at the website PEDRo supports an ontology service It stores the XML directly in an
open-source XML storage system Xindice The data are presented to the users by
gathering web pages from the stored XML using XSLT[22 23]
SBEAMS-Proteomics (httpwwwsbeamsorgProteomics ) is one of the modules of
SBEAMS integrated platform developed by ISB that is used for proteomics
experimental data storage and retrieval These experiments can be correlated later
under the same framework The integrated open source system SBEAMS adopts a
relational database management system backend and a web interface front end
Information about the quality of identification can be stored with the data peptides
which could not be properly identified from mass spectra can be flagged and
reanalyzed with additional searches The database schema for SBEAMS-Proteomics is
available at the website (httpwwwsbeamsorgProteomics )
ProteinScape is a commercial client-server platform for proteomics data
management (httpwwwbdalcomproteinscapehtml) It organizes data such as gel
data mass spectra process parameters and search results It can manage gel-based or
LC-based workflows as well as quantitative proteomics ProteinScape also enables
automated analysis through interactions with database search engines such as Mascot
Phenux and Profound ProteinScape‟s relational database system can be Microsoft
SQL or Oracle 91
PROTEIOS (httpwwwproteiosorg) is an mzData-compliant open source client-
server application that implements mass spectrometry data storage organization and
annotation The server is a relational database that can be MySQL Oracle as well as
utilize other alternatives The client side runs as a Java application One of the main
objectives of Proteios is to provide a GUI enabling queries based on experiment data
and annotation data The schematic diagram is available at the website Currently the
input data files must be in XML format It is working on imports of tab-separated files
[24]
9
PROTICdb is a web-based proteomics data management tool used for plant
proteomics data storage and analysis The data can come from 2D-GEL and MS The
data stored can also be in the form of quantitative measurements To support data
interpretation PROTICdb allows the integration of information from the user‟s own
expertise and other sources into a knowledge base It also provides links to external
databases [25]
ProDB is an open source proteomics data management tool
(httpwwwcebitecuni-bielefelddegroupsbrfsoftwareprodb_infoindexhtml) that
can handle data conversion between different mass spectrometer software automate
data analysis and allow the annotation of MS spectra (ie assigning gene names or
storing data on protein modifications) The system is based on an extensive relational
database to store the mass spectra together with the experimental setup [26] The first
release will be available to the public soon
There are several other proteomics data management tools not described here such
as PROTEUS [27] Proteomics Rims (developed by Bruker BioSciences) Xome and
Mass Navigator [28]
22 Ontology-based Gene Annotation and Network-enabled Analysis
221 Proteomics and Systems Biology
The goal of proteomics research is to understand the expression and function of
proteins on a global level It strives to characterize protein structure and function
protein-protein protein-nucleic acid protein-lipid and enzyme-substrate interactions
post-translational modifications protein processing and folding protein activation
cellular and sub-cellular localization protein turnover and synthesis rates and even
alternative isoforms caused by differential splicing and promoter usage In addition
the ability to capture and compare all of this information between two cellular states is
essential for understanding cellular responses Achieving the goals of proteomics is
10
not trivial Adding to the complexity of this field is the need to integrate proteomics
data with other information to fully understand how systems work
Systems biology is a newly emerging field that seeks to analyze the relationships
among elements in a system in response to genetic or environmental perturbations
with the goal of understanding the system or the properties of the system[29]
Therefore systems biology is a holistic approach that seeks to integrate biological data
as an attempt to understand how biological systems function thus being distinct from
a pure omics - based or other bioinformatics methods The present thesis is an attempt
in this direction We captured the proteome difference between cellular states and
integrate this information with information from gene ontology as well as protein
interaction database Thus for the first time it provides an in-depth interpretation at
the molecular signaling network level
In particular our systems biology approach consists of the following three major
elements [2] (1) Omics analyzing mass-spectrometry derived proteomics
experimental data to identify differentially expressed proteins in different genetic or
environmental conditions (2) Ontology annotating the proteomics data based on gene
ontology functional categories (3) Network mapping the proteomic data into protein-
protein interaction network and translating the protein-protein interaction network into
a gene ontology cross-talk network
Figure 22 Major elements of our systems biology approach The lines represent
the tight connections of the elements
Proteomics
(see 211 ~
213)
Gene
Ontology
(see 222)
Protein - Protein
Interaction Network
(see 223 and 32)
11
Figure 22 shows the three major elements of our systems biological approach In
this approach the data from omics experimental results is analyzed against gene
functional categories and gene functional category network It is the first time that the
gene ontology concept has been brought to the molecular context of protein-protein
interaction networks which has been used to interpret the proteomics experimental
result
222 Ontology ndash based gene annotations
From the point of view of systems biology the interpretation of differentially
expressed protein lists identified from proteomics experiments is not a trivial task
Given a set of differentially expressed genes proteins or a set of genes proteins in a
cluster one would often wish to know whether these genes proteins share a common
function subcellular localization metabolic or regulatory pathway In addition to
characterizing the geneprotein set this type of analysis may also reveal information
on new and previously unknown genes in the set This type of work often requires the
mapping of the genesproteins into gene ontology (GO) terms The introduction of
Gene Ontology (GO) as a standardized vocabulary for describing genes gene products
and their biological functions represents an important milestone in the possibilities to
handle and include biological background information in functional genomics and
proteomics analyses
The gene ontology is represented as a network or a bdquodirected acyclic graph‟ (DAG)
in which terms may have multiple parents and multiple relationships to their parents
The controlled vocabularies are structured in levels so that attributes can be assigned
to a gene product at different levels of description depending on how much is known
about this gene product[30] There are three different sets of vocabularies for gene
ontology (1) Molecular function describes the activity of a gene product at the
molecular level It does not provide information about the compounds or locations of
the activity Example of molecular function at level 2 can be binding and at level 3 can
be protein binding The more specific term at level 4 can be transcription factor
binding (2) Biological process describes recognized series of events or molecular
12
functions A biological process is not equivalent to a pathway though some GO terms
do describe pathways Examples of biological process are death at level 3 and cell
death at level 4 (3) Cellular component refers to the location in the cell in which a
gene product exerts its activity Examples are nucleolus organelle and polarisome
Many databases today provide GO annotations for a variety of organisms including
humans yeast and other species
Annotation of genes with GO terms creates a biological knowledge profile in three
layers (biological process molecular function or cellular component) Three common
methods are used to query GO categories by individual gene by gene function and
by using a list of genes [31] Translation of the differentially expressed geneprotein
list into a functional profile helps biologist get insight into the cellular mechanisms
relevant to a given condition Therefore it has been widely used in the analysis of
functional genomics and proteomics studies [32-36]
The ontological analysis of gene expression or proteomics data usually follows the
following steps (1) Prepare the gene or protein list of interest (2) Prepare reference
gene or protein list which is used to calculate P-values against (3) Map both lists
(interested list and reference list) to GO categories (4) Select statistical model The
gene ontology analysis can be performed with a number of statistical models including
hypergeometric binomial Fisher‟s exact test and chi-square These tests are
discussed in detail in [37] (5) Find significantly enriched GO categories in your list of
interest using the selected statistical model (6) Perform corrections for multiple
comparisons When many genesproteins are analyzed at the same time some
significance will happen by chance The multiple comparison corrections control the
overall probability of making a Type I error Many different statistical methods have
been published to perform this kind of correction for example Bonferroni correction
[38] FDR [39] and permutation correction [40] Each method has its unique feature
(7) Interpret the result in terms of the biological significance
13
The statistical evaluation of enriched GO categories enables to highlight the most
significant biological characteristics of a gene or protein set therefore allows us to
mine knowledge from data In recent years many tools have been developed to
automate the gene ontology analysis Table 21 lists some popular GO analysis tools
the statistical models the tools used multiple comparison correction methods
implemented and the GO visualization view
Table 21 Gene Ontology analysis tools
Tool Statistical model Multiple comparison
corrections
GO
visualization
WebGestalt[41] Hypergeometric test
Fisher‟s exact test
NA Tree bar chart
DAG
GeneMerge[42] Hypergeometric Bonferroni No tree view
CLENCH[43] Chi-square test Binomial
Hypergeometric
NA DAG
GOSurfer[44] Chi-square test FDR Tree
Onto-
Express[45]
Chi-square test Binomial
Hypergeometric Fisher‟s
exact test
Bonferroni Holm
Sidak
Tree
GOToolBox[46] Binomial Hypergeometric
Fisher‟s exact test
Bonferroni
HolmFDR Hochberg
Hommel
NA
Onto-
Express[45 47]
Binomial Hypergeometric
Chi-square test
Bonferroni Holm
Sidak FDR
Tree bar chart
GO Term
Finder[48]
Binomial NA Tree
The ontology-based omics data analysis approach enables researchers to find out
enriched functional categories involved in the experimental conditions While
biological systems contain large number of different genes and proteins that are
14
interacted with each other it is necessary to develop an approach to bring the
ontology-based omics data analysis to the interaction network This integrated
approach will definitely benefit the biologists to obtain more insight for biological
phenomena
223 Protein interaction network- based analysis
A discrete biological function is rarely attributable to an individual protein [49]
Instead most biological characteristics arise from complex interactions between the
cell‟s numerous constituents such as proteins DNA RNA and small molecules In
particular the network of protein-protein interactions also referred to as interactome
forms a backbone of signaling pathways metabolic pathways and cellular processes
for normal cell function Protein interaction network analysis provides an effective
way to understand the relationships between genes It places the genes identified in
functional genomics and proteomics experiments in a broader biological context
thereby facilitating the understanding of the structure and function of a living cell
The network-based analysis has been enabled by the recent elucidation of large-
scale protein interaction networks in different species including S cerevisiae
(yeast)[50-53] D melanogaster (fly)[54] C elegans (worm)[55] and H sapiens
(human)[56 57] )[56 57] Collections of these protein interactions representing a
subset of the whole interactome are stored in various data repositories as the Database
of Interacting Proteins (DIP) (ref) the Biomolecular Interaction Database (BIND)
The Molecular INTeraction Database (MINT) InAct the human Protein Reference
Database (HPRD) and the Online Predicted Human Interaction Database (OPHID)
[58] The protein network-based analysis has been utilized for the analysis of
functional genomics experiments recently [59 60]
The most comprehensive database for a human protein network is the Online
Predicted Human Interaction Database (OPHID) [58] OPHID is a web-based database
of predicted interactions between human proteins It combines the literature-derived
human protein-protein interactions from BIND (Biomolecular Interaction Network
15
Database) HPRD (Human Protein Reference Database) and MINT (Molecular
Interactions Database) with predictions made from Saccharomyces
cerevisiae
Caenorhabditis elegans Drosophila melanogaster
and Mus musculus OPHID
catalogs 16034 known human PPIs obtained from BIND MINT and HPRD and
makes predictions for 23889 additional interactions[58]
It is designed to be both a
resource for the laboratory scientist to explore known and predicted protein-protein
interactions and to facilitate bioinformatics initiatives exploring protein interaction
networks It should be noted that OPHID predicted human interaction are hypothetical
and are likely to have some false positives as well as missing protein interactions
However it was claimed that approximately half of the predicted interactions using
interlogs between microorganisms can be experimentally validated [61]
Table 22 Leading protein interaction databases
Name Description
Online Predicted Human Interaction Information about known human PPIs from Database
(OPHID) httpophidutorontocaophid BIND MINT and HPRD as well as large
number of predicted human PPIs
Human Protein Reference Database Manually curated and extracted from literature
(HPRD) httpwwwhprdorg for human PPIs
Saccharomyces Genome Database Comprehensive database that contains genetic
(SGD) httpwwwyeastgenomeorg and physical interactions for yeast proteins
More than 90 interactions come from GRID
General Repository for Interaction Genetic and physical interactions for yeast fly
Datasets (GRID) and worm proteins Interactions data comes from
httpbiodatamshrioncagrid literature BIND and MIPS including several
genomeproteome-wide studies
Biomolecular Interaction Network Physical biochemical genetic interactions and
Database (BIND) interactions between DNA RNA proteins small
httpwwwiscorgindexplswbind molecules including interactions from human yeast
mouse rat and many other species
Human Annotated Protein Protein Database that contains protein interactions from
Interaction (HAPPI) String OPHID and HPRD
httpbioinformaticsiupuieduHAPPIindexstm
16
On the other hand SGD (Saccharomyces Genome Database) is a scientific
database of the molecular biology and genetics of the yeast Saccharomyces cerevisiae
which is commonly known as Bakers or budding yeast Besides protein-protein
interaction datasets SGD also contains genes and proteins sequence information
descriptions and classifications of their biological roles molecular functions and
subcellular localizations and links to literature information (see table 22) [62-64]
More than 90 of the interactions stored in SGD come from GRID BIND
(Biomolecular Interaction Network Database) is the database that stores the
interactions between DNA RNA proteins and small molecules for many species
including yeast [65-67] Table 22 lists the information for the leading protein
interaction databases
The protein network-based analysis has been considered as one of the most
important elements of the systems biology approach Protein network analysis place
the genes identified in microarray experiments or differentially expressed proteins
detected in mass-spectrometry experiments in a global biological context Protein-
protein interaction networks reflect the functional grouping of these coordinated
genesproteins It enables the study of the roles of subsets of genesproteins
A few papers published recently reported mapping the differentially expressed
protein lists identified through microarray or proteomics experiments into protein-
protein interaction database such as OPHID Using the network-based analysis Wachi
et al found that the genes differentially elevated in cancer as obtained from
microarray profiling data are well connected[60] In this study genes in the array
were mapped onto OPHID using gene symbols and protein sequences Connectivity
analysis was performed for the protein network constructed Then k-core analysis was
conducted where less connected nodes were removed in an iterative way This
resulted in a series of subgraphs that gradually revealed the globally central region of
the original network Using k-core analysis the authors measured how differentially
expressed genes were close to the topological center of the protein network Centrality
17
of the genes is associated with the essential functions of the genes in the yeast The
analysis concluded that squamous cell lung cancer genes share similar topological
features for essential proteins
Calvano et al recently performed a network analysis of systematic inflammation in
humans [68] Gene expression patterns in human leukocytes receiving an
inflammatory stimulus were first analyzed using genome-wide microarray analysis
Genes significantly perturbed after stimulus were identified using significance analysis
of microarray method which controls the false discovery rate to less than 01 To
identify significant pathways in a biological process the differentially expressed genes
were overlaid onto the interactome the Ingenuity Pathways Knowledge Base (KB)
which is the largest curated database of previously published findings on mammalian
biology from the public literature Target genes were identified as the subset having
direct interactions with other genes in the database The specificity of connections for
each target gene was calculated by the percentage of its connections to other
significant genes Pathways of highly connected genes were identified by likelihood
Using this strategy the authors demonstrated that upon acute systematic inflammation
the human blood leukocyte response includes widespread suppression at the
transcriptional level of mitochondria energy production and protein synthesis
machinery
Said et al [69] used protein interaction networks to analyze the phenotypic effects
in yeast Toxicity-modulation non-phenotypic classifications and high-throughput
genomic phenotyping were conducted Networks that represented a phenotypically
annotated interactome of essential toxicity-modulating and no-phenotype proteins
were constructed The analysis showed interesting results For example
toxicologically important protein complexes pathways and modules were identified
which have potential implications for understanding toxicity-modulating processes
relevant to human diseases
18
In other studies Seiden-Long et al integrated the microarray datasets with OPHID
and found six of the target genes by HGFMetRAS signaling belong to a hypothetical
network of function at the protein level [70] Motamed-Khorasani et al found that six
of the total of 17 androgen-regulated genes could be mapped into OPHID database
Five of the six genes are networked within two interacting partners [71]
The current project will integrate the three elements proteomics ontology and
network and perform ontology-driven and network-enabled systems biology case
studies The following sections will describe the details of our methods and results
19
3 METHODS
All methods related to ovarian cancer study in this section were based on the
published methods and private communications with Dr Chen Dr Shen and Dr
Wang I am one of the primary contributing members (Chen J Yan Y Shen C
Fitzpatrick D Wang M A Systems Biology Case Study of Ovarian Cancer Drug
Resistance JBCB 2007[2]) Method in 322 was kindly provided by Dr Shen who
developed a statistical model to identify differentially expressed proteins as one of the
inputs of my case study 2 Ovarian cancer proteomics experimental methods in
section 311 were kindly provided by Dr Mu Wang Yeast proteomics experimental
methods in section 312 were kindly provided by Josh Heyen Tables 31 ~ 33 were
based on discussion with Dr Goebl and Josh Heyen where I am one of the
contributors The use of the materials was granted with the permission from
participating contributors
31 Proteomics Method
311 Ovarian cancer drug resistance proteomics method
A2780 and 2008 cisplatin-sensitive human ovarian cancer cell lines and their
resistant counterparts A2780CP and 2008C13525 were used in the ovarian cancer
drug resistant study Proteins were prepared and subjected to LCMSMS analysis as
described in [72] There were two groups (two different parent cell lines) six samples
per cell line and two HPLC injections per sample Samples were run on a Surveyor
HPLC (ThermoFinnigan) with a C18 microbore column (Zorbax 300SB-C18 1mm x
5cm) All tryptic peptides (100 L or 20 g) were injected onto the column in random
order Peptides were eluted with a linear gradient from 5 to 45 acetonitrile
developed over 120 min at a flow rate of 50 Lmin Fluant was introduced into a
ThermoFinnigan LTQ linear ion-trap mass spectrometer The data were collected in
the ldquotriple-playrdquo mode (MS scan Zoom scan and MSMS scan) The acquired data
were filtered by proprietary software and Database searching against International
Protein Index (IPI) database NR-Homo Sapiens database was carried out using both
SEQUEST and XTandem algorithms Protein quantification was carried out using the
20
LCMS-based label-free proprietary protein quantification software licensed from Eli
Lilly and Company [72] Briefly once raw files are acquired from the LTQ all
extracted ion chromatogram (XIC) is aligned by retention time Each aligned peak
should match parent ion charge state daughter ions (MSMS data) and retention time
(within a one-minute window) If any of these parameters were not matched the peak
will be disqualified from the quantification analysis The area-under-the-curve (AUC)
from individually aligned peak was measured normalized and compared for their
relative abundance All peak intensities were transformed to a log2 scale before
quantile normalization [73] If multiple peptides have the same protein identification
then their quantile normalized log2 intensities were averaged to obtain log2 protein
intensities The log2 protein intensity is the final quantity that is fit by a separate
ANOVA statistical model for each protein log2 (Intensity) = overall mean + group
effect (fixed) + sample effect (random) + replicate effect (random) Group effect refers
to the effect caused by the experimental conditions or treatments being evaluated
Sample effect is caused by random effects from individual biological samples It also
includes random effects from sample preparation The replicate effect refers to the
random effects from replicate injections of the same sample All of the injections were
in random order and the instrument was operated by the same operator The inverse
log2 of each sample mean was determined to resolve the fold change between samples
312 Yeast Grr1 knock-out proteomics method
For the yeast Grr1 knock-out study a customized SILAC approach was used to
perform mass labeling Scerevisiae strain DBY2059 (Mat α leu2-3) was cultured
overnight to stationary phase in two replicate 10ml batches of modified SD media
consisting of 2 glucose 5 glutamine and 05 mgml C613
leucine (Cambridge
Isotope Laboratories Inc Andover MA USA) Concurrently strain JH001 (Mat A
grr1ΔNat) was also cultured overnight to stationary phase in two replicate 10ml
batches of the same media supplemented with C612
leucine Each 10ml culture was
then used to inoculate a 500ml culture of the same media and cells were grown for
nine population doublings to mid-log phase (~5x10⁶ cellsml) Cell density was
determined by cell counting using a hemacytometer (Reichert BuffaloNY USA)
21
Cells were harvested by centrifugation in a Beckman JA-14 rotor at 4000 X G for 10
minutes washed three times in ice cold water and immediately re-suspended in 5ml
of extraction buffer [8M Urea 01M Ammonium Bicarbonate] Cells were then
immediately flash frozen in liquid nitrogen and stored at -80C overnight Protein
extract was prepared the following day by manual bead beating using 300 um acid
washed glass beads (Sigma StLouis MO) Specifically samples were subjected to 10
cycles consisting of 30 seconds on ice and 30 seconds of vortexing in the presence of
glass beads Glass beads and cellular debris were then spun down at 2000 X G and the
supernatant was placed in 15ml conical tubes Protein concentrations were determined
using the Bradford protein assay and protein samples were mixed in a 11 ratio
(DBY2059 C613
leucine JH001 C612
leucine) producing two replicate protein mixes
from four independently grown batch cultures Each protein mixture was diluted with
100mM Ammonium Bicarbonate to a final Urea concentration of 4M Protein
disulfide bond reduction was carried out by adding a 40 fold molar excess of
Dithiothreitol (DTT) to each protein mixture followed by a three hour incubation at
36C Reduced protein mixtures were then alkylated using a 180 molar ratio of protein
to iodoacetamide (IAM) followed by incubation on ice in complete darkness for 2
hours The reduced and alkylated protein mixture was then diluted to 2M Urea using
an equal volume of 100mM ammonium bicarbonate and subjected to trypsin digestion
using 2 (weightweight) of TPCK-treated trypsin Digestion was carried out at 37C
for twenty four hours Peptide samples were then dried down in a speed-vac and
resuspended in a buffer consisting of 5 Acetonitrile 95 EMD water 0025
Formic Acid and 00025 HFBA
The two replicate peptide mixtures were analyzed 3 times each through an
automated de-salt2DLCMS system Peptide De-salting and separation were
performed in tandem using the Paradigm MG4 HPLC System (Michrom Biosciences
Inc) Initially approximately 150ug of the tryptic peptide mixture was loaded directly
onto a C-18 microtrap (Michrom Biosciences Inc) and desalted by flushing the trap
with 20 column volumes of mobile phase A (2 Acetonitrile 98 Water 0025
Formic Acid) at a flow rate of 50 ulmin Peptides were then eluted onto an SCX
22
microtrap (Michrom Biosciences Inc) using 20 volumes of mobile phase B (98
Acetonitrile 2 Water 0025 Formic Acid 0001 HFBA) Peptides were then
bumped off the SCX microtrap in a stepwise fashion using increasing concentrations
of Ammonium Formate Ten steps were used in our analysis of 0 4 8 12 15 18 21
25 50 and 100 mM Ammonium Formate followed by two identical steps of 1M
Ammonium Formate Each population of peptides were eluted off the SCX micro-trap
onto a C8 nano-trap (Michrom Biosciences Inc) coupled directly to a hand packed
C18 column with a hand pulled tip A home made high pressure bomb was used to
pack 15 cm of 5um-100 angstrom Magic C18 resin (Michrom Biosciences Inc)
Peptides were then eluted off this column at 500nlmin using an Acetonitrile gradient
from 5-50 and analyzed by an LTQ Mass Spectrometer (Thermo Electron
Corporation) on the fly
The LTQ-MS was set for data dependent MSMS acquisition with a total ion count
threshold of 1000 Dynamic exclusion was used to only collect two MSMS spectra on
a single parent ion every 45 seconds Two types of data collection were performed in
this analysis termed gas phase fractionation and full scan analysis Typically the
LTQ-MS is set to scan across an mz range from 500-2000 throughout the course of
the analysis This type of analysis was done in replicate for both replicate peptide
mixtures culminating in four 12 step full scan analyses Each of the peptide mixtures
was also subjected to a single gas phase fractionation analysis This analysis is
essentially equivalent to three full scan analyses but the mass spectrometer is set to
scan 13 of the mz scan range This allows for greater mz resolution and increased
peptide detection sensitivity due to the fact MSMS spectra are being collected for a
smaller fraction of the peptide population eluting from the column However this
process is time consuming given that three separate analyses must be performed to
acquire data across the whole scan range and thus we only conducted a single gas
phase analysis for each peptide mixture The scan ranges for gas phase fractionation
were 500-1000 mz 900-1500 mz and 1400-2000 mz In all each of the two
replicate peptide mixes were loaded and analyzed five times through the 2D-LC-MS
system for a total of ten different runs
23
Peptide assignments for experimental MSMS spectra were made using the
SEQUEST program (Thermo Electron Corporation) The 12 raw files generated for
each run are run individually through the SEQUEST software Peptide assignments
were then analyzed for validity using a suite of software available from the Institute
for Systems Biology termed the Trans-Proteomic Pipeline This analysis toolkit
provides computational tools that validate peptide assignments (Peptide Prophet)
protein assignments (Protein Prophet) and quantify relative peptide and protein
abundance ratios (ASAPRatio) It is important to note that prior to analysis through
the TPP the 12 raw files are combined into a single mzXML using the TPP This
mzXML file captures raw parent MS spectra for use in quantification by the program
ASAPratio The SEQUEST output files are converted to summaryhtml files that are
readable by the programs Peptide Prophet and Protein Prophet All the individual raw
files and SEQUEST out files for a given analysis are analyzed together through the
TPP to calculate the most accurate peptide probabilities protein probabilities and
ratios for a given analysis
32 Preparation of Datasets
321 Proteins in differentially expressed cisplatin-resistant vs cisplatin-sensitive
ovarian cancer cells
The protein quantification data was stored in Oracle schema Sysbio (see appendix
1) 574 differentially expressed proteins with q-value (false discovery rate) lt=010
both up- and down-regulation values or 141 proteins (with q-value lt=005) were
generated by mass spectrometry based proteomics experiment Proteins were mapped
into IPI database IDs These IPI identifiers were converted into UniProt IDs in order to
integrate this data set with all other annotated public data 119 of the 141 proteins
(005 q-value threshold) were successfully mapped and converted (see appendix 2)
using the International Protein Index (IPI) database[74] downloaded in February 2006
the UniProt database downloaded in November 2005[75] and additional internally
curated public database mapping tables Similarly 451 out of the 574 proteins with the
less strict threshold (q-value lt=010) were mapped from IPI IDs to UniProt IDs
24
322 Differentially expressed proteins identified from Grr1 knock-out yeast vs
wild-type yeast
For each protein identified in mass spectrometry experiment there are two
measures (i) the probability that the identification is correct (output from
ProteinProphet) and (ii) the relative abundance ratio and its standard error (output
from ASAPratio)
Since some proteins might be identified by more than one experiment one can
improve the reliability and accuracy of the two measures by combining the estimates
from each experiment If a protein is identified by k experiments labeled r1 r2hellip rk
then the summarized probability is calculated as
1
1 (1 )i
k
id r
i
P P
Where ir
P is the probability measure from experimentir
To summarize the estimate of the relative abundance ratio we use a linear
combination of the estimate at the log10 scale from each experiment The weight is
determined so that the summarized estimate has the lowest standard error among all
possible linear combinations Then the z-score is calculated by dividing the
summarized estimate by its standard error for each protein The local false discovery
rate approach proposed by Effron[76] is applied to the z-scores to calculate the
probability that the relative abundance ratio is different from 1 (ratioP ) Finally we take
id ratioP P P as the final confidence measure that a protein is differentially expressed
between the two samples In other words to be claimed as ldquodifferentially expressedrdquo
a protein needs to have high confidence in its identification and high confidence in its
differential abundance 184 proteins were selected (Combined Probabilitygt=08) from
Grr1 knock-out vs wild-type yeast mass spectrometry experiment (see appendix 3)
25
323 Protein interactome data
The primary source of human data comes from the Online Predicted Human
Interaction Database (OPHID) [58] which were downloaded in February 2006 It
contains more than 47213 human protein interactions among 10577 proteins
identified by UniProt accession numbers After mapping the proteins in OPHID to
UniProt IDs we recorded 46556 unique protein interactions among 9959 proteins
Note that even though more than half of OPHID entries are interacting protein pairs
inferred from available lower organisms onto their human orthologous protein pair
counterparts the statistical significance of these predicted human interactions was
confirmed by additional evidences according to OPHID and partially cross-validated
according to our previous experience [77] We assigned a heuristic interaction
confidence score to each protein interaction based on the type and source protein
recorded in OPHID according to a method described in [77] We call this data set PiD0
49
12
39BIND ONLY
SGD ONLY
BIND AND SGDOVERLAPPINGS
Figure 31 Yeast interactome data source from BIND and SGD The percentages
show the proportion of the non-redundant interacting pairs of each category among the
combined non-redundant interacting pairs from BIND and SGD
The source of yeast interactome data was the Saccharomyces Genome Database
(SGD) [58] Biomolecular Interaction Network Database (BIND) and a small set of
in-house manually curated data by our biology group (Goebl) The data from SGD and
26
BIND were downloaded in February 2006 Figure 31 summarized the percentage of
overlappings of the interactome data from SGD and BIND A total of 25418 non-
redundant interactions were obtained after combining the 3 interactome datasets and
the intensive processing (see Figure 32 for the data processing flow chart) We call
this interactome dataset SBG Non-redundant interactions are defined as the
interactions that only contain unique interacting pairs The same interaction detected
by different methods or published in different papers is counted as one unique pair
For each interacting pair in SBG we calculated a reliability score based on the scoring
model developed (see section 33)
Figure 32 Interactome data integration flow chart
27
324 Noise-introduced human protein interactome data
To test how robust the final computational results would hold up against noise
which is commonly believed to exist in large portions of the public protein interaction
data set we generated two additional human protein interaction data sets PiD-a20 and
PiD-r20
For PiD-a20 we add ldquoprotein interaction noiserdquo by randomly connecting protein
pairs from the set of 9959 unique proteins for as many times as necessary to
eventually generate 120 46556= 55869 unique interactions Therefore we
generate 20 new and unique ldquonoisyrdquo interactions in the PiD-a20 data set
For PiD-r20 we eliminate ldquoprotein interaction noiserdquo by randomly removing
protein interaction pairs from the total 45556 initial pairs of protein interactions in
PiD0 to eventually reduce the total number of protein interactions down to (1-20)
46556= 37243 Therefore 80 of original interactions are kept intact in the PiD-r20
data set
325 Gene annotation data
The human gene annotation database was downloaded from
httpwwwgenmapporg in January 2006 The whole annotation database (in MS
Access) was then migrated to Oracle 10g Human proteome GO annotation was
performed based on human gene GO annotation and human gene ID to protein
UniProt ID mappings
The yeast gene annotation database was downloaded from wwwgenmapporg in
January 2006 This database (in MS Access) was migrated to Oracle 10g We also
downloaded additional annotation datasets from other websites such as
httpwwwyeastgenomeorg in January and February Based on these datasets we
designed and implemented our yeast gene annotation database (see Figure 33) Yeast
28
proteome GO annotation was performed based on yeast gene GO annotation and yeast
gene ID to ORFs mappings curated internally
Figure 33 ERD diagram of yeast annotation database stored in Oracle 10g
326 Interacting protein categorical annotation data
Each GO term from the human or yeast protein annotation data was annotated with
its minimal GO level number in the GO term hierarchy Each GO term‟s higher-level
parent GO terms (multiple parent GO terms are possible) up to GO level 1 (three GO
terms at this level molecular function cellular components and biological processes)
29
are also traced and recorded in an internally curated GO annotation table When
calculating interacting protein GO category information we use this internally curated
GO term table to map all the low-level GO term IDs (original GO Term ID) used to
annotate each protein to all the GO term IDs‟ high-level GO term IDs (folded GO
Term ID) For this study we designate that all the folded GO term ID should be at GO
term hierarchy Level = 3 Note that our method allows for multiple GO annotation
Term IDs (original or folded) generated for each protein ID on purpose Therefore it
is possible for a protein or a protein interaction pair to appear in more than one folded
GO term category or more than one folded GO term interacting category pairs
33 Protein-Protein Interaction Scoring Model
The reliability score of a pair of interaction can be assigned based on what
experimental methods detected the interaction how many different methods were used
and how many different papers have published the same interaction
Our scoring model was developed in 3 steps
First we mapped the interaction methods stored in SGD (see table 31) or BIND
(see table 32) into certain codes for SGD the code begins with ldquosrdquo for BIND the
code begins with ldquobrdquo Then we created our metadata (see table 33) to unify the
experimental methods for interacted pairs stored in SGD and BIND We created the
code for the unified method which begins with ldquoGrdquo For each unified term a
reliability score was assigned based on the characteristics of the experimental method
Generally interactions identified from low throughput experiments are more reliable
than from high throughput experiments for example the method ldquoTwo Hybridrdquo was
assigned the lowest score ldquo01rdquo Based on this an interaction pair j identified by
experimental method i can be assigned a base score of S0ji
(2) For interaction pair j a specified experimental method i can associate with certain
number (Cji) of unique PubMed IDs A maximum number of publications can be
calculated among all methods for the same pair of interaction The adjusted rate ji
30
for experimental method i of a certain interacted pair j can be calculated as (see figure
34)
110
max(max 1 1)
Cjiji
Cji
(Where j denotes the jth unique interaction pair i denotes the ith experimental method)
The adjusted score for experimental method i of a specified interaction pair j can be
calculated as (see figure 34)
S ji = S0ji ( 1+ ji)
Figure 34 Protein interaction reliability score calculation algorithm and
formulas PMID stands for PubMed ID
(3) Similar to [78] we combine Sj1 Sj2 hellip Sji hellip Sjn and calculate a final score Sj
for the specified interaction pair j (see figure 34)
31
1
1 (1 )n
j ji
i
S S
Table 31 Experimental methods for interacting pairs stored in SGD
SGD Method Code SGD Method
s1 Affinity Capture-MS
s2 Affinity Chromatography
s3 Affinity Precipitation
s4 Biochemical Assay
s5 Dosage Lethality
s6 e-map
s7 Purified Complex
s8 Reconstituted Complex
s9 Synthetic Growth Defect
s10 Synthetic Lethality
s11 Synthetic Rescue
s12 Two-hybrid
Table 32 Experimental methods for interacting pairs stored in BIND
BIND Method Code BIND Method
b1 (Blank)
b2 affinity-chromatography
b3 autoradiography
b4 colocalization
b5 competition-binding
b6 cross-linking
b7 deuterium-hydrogen-exchange
b8 electron-microscopy
b9 electron-spin-resonance
b10 elisa
b11 equilibrium-dialysis
b12 far-western
b13 fluorescence-anisotropy
b14 footprinting
b15 gel-filtration-chromatography
b16 gel-retardation-assays
32
b17 hybridization
b18 immunoblotting
b19 immunoprecipitation
b20 immunostaining
b21 interaction-adhesion-assay
b22 light-scattering
b23 mass-spectrometry
b24 membrane-filtration
b25 monoclonal-antibody-blockade
b26 not-specified
b27 other
b28 phage-display
b29 resonance-energy-transfer
b30 sucrose-gradient-sedimentation
b31 surface-plasmon-resonance-chip
b32 three-dimensional-structure
b33 transient-coexpression
b34 two-hybrid-test
Table 33 Metadata for experimental methods
SGD and BIND
Method Code Code Unified Term Reliability Score
b2 s1 s2 s3 b19 G1 Affinity_Purification 08
b6 G2 Cross_Linking 05
b10 G3 Elisa 07
b28 G4 Phage_Display 01
b29 G5 Resonance_Energy_Transfer 04
b34 s12 G6 Two_Hybrid 01
s6 G7 E_Map 08
s9 s10 G8 Synthetic_Growth_Defect 08
s11 G9 Synthetic_Rescue 08
s7 G10 Purified_Complex 08
s5 G11 Dosage_Lethality 08
s4 G12 Biochemical_Assay 08
s8 G13 Reconstituted_Complex 06
33
b3 b4 ~ b9 G99 Other 01
b11 b12 ~ b18 G99 Other 01
b20 b21 ~ b27 G99 Other 01
b1 b30 ~ b33 G99 Other 01
34 Network Expansion
We derive differentially expressed protein interaction sub-network using a nearest-
neighbor expansion method described in [77] We call the original list of differentially
expressed proteins (119 proteins in ovarian cancer study or 184 proteins in yeast Grr1
knock-out study) seed (S) proteins and all the protein interactions within the seed
interactions (or S-S type interactions) After expansion we call the collection of seed
proteins and expanded non-seed (N) proteins sub-network proteins (including both S
and N proteins) we call the collection of seed interactions and expanded seed-to-non-
seed interactions (or S-N type interactions) sub-network protein interactions (including
both S-S type and S-N type interactions) Note that we do not include non-seed-to-
non-seed protein interactions (or ldquoN-Nrdquo type interactions) in our definition of the sub-
network primarily because the N-N type of protein interactions often outnumbered
total S-S and S-N types of protein interaction by several folds with molecular network
context often not tightly related to the initial seed proteins and seed interactions The
only occasion to consider the N-N type interactions is when we calculate sub-network
properties such as node degrees for proteins in the sub-network
35 Network Visualization
We use Spotfire DecisionSite Browser 72 to implement the 2-dimensional
functional categorical crosstalk matrix for human ovarian cancer drug resistance study
To perform interaction network visualization we used ProteoLens[79] ProteoLens
has native built-in support for relational database access and manipulations It allows
expert users to browse database schemas and tables query relational data using SQL
and customize data fields to be visualized as graphical annotations in the visualized
network
34
36 Network Statistical Examination
Since the seed proteins are those that are found to display different abundance level
between two different cell lines via mass spectrometry one would expect that the
network ldquoinducedrdquo by them to be more ldquoconnectedrdquo in the sense that they are to a
certain extent related to the same biological process(es) To gauge network
ldquoconnectivityrdquo we introduced several basic concepts We define a path between two
proteins A and B as a set of proteins P1 P2hellip Pn such that A interacts with P1 P1
interacts with P2 hellip and Pn interacts with B Note that if A directly interacts with B
then the path is the empty set We define the largest connected component of a
network as the largest subset of proteins such that there is at least one path between
any pair of proteins in the network We define the index of aggregation of a network
as the ratio of the size of the largest connected component of the network to the size of
the network by protein counts Therefore the higher the index of aggregation the
more ldquoconnectedrdquo the network should be Lastly we define the index of expansion of
a sub-network as the ratio of S-S type interactions among seed proteins over all seed
and expanded sub-network interactions (S-S and S-N types) The higher the index of
expansion the more relevant roles seed proteins plays in the network
To examine the statistical significance of observed index of aggregation and index
of expansion in expanded protein networks we measure the likelihood of the topology
of the observed sub-network under random selection of seed proteins This is done by
randomly selecting 119 proteins (in ovarian cancer study) or 184 proteins (in yeast
Grr1 knock-out study) identifying the sub-network inducedexpanded and calculating
sub-network indexes accordingly The same procedure is repeated n=1000 times to
generate the distribution of the indexes under random sampling with which the
observed values are compared to obtain significance levels (for details refer to [77])
37 Significance of Testing of GO Categories and GO-GO Categories
To assess how significantly the seed proteins (119 in human study and 184 in yeast
study) in the subnetwork are distributed across their specific GO function categories
35
we hypothesize the task as observing the outcome of a random draw of the same
number of proteins from the pool of proteins in the whole interacting network (9959
proteins in human study and 5240 in yeast study) Then the count in a certain GO
category follows a hypergeometric distribution A p-value is calculated based on the
hypergeometric distribution to evaluate the likelihood that we observe an outcome
under random selection of a subset of proteins (119 in human and 184 in yeast) that is
at least as ldquoextremerdquo as what we have observed Note ldquoextremerdquo either implies an
unusually large (over-representation) or usually small (under- representation) number
Let x be the count of the seed proteins that falls in a function category in the
subnetwork n is the sample size (119 in human study or 184 in yeast study) N is the
population size (9959 in human study or 5240 in yeast study) and k=corresponding
count in OPHID then the p-value for overunder-representation of the observed count
can be calculated as
Over representation
Under representation
We also expand the protein list from the 184 seed proteins to 1251 sub-network
proteins in yeast study and calculate a p-value for randomly drawing of 1251 proteins
from the pool of 5240 proteins in SBG based on its hypergeometric distribution
Similarly we can use the above formula to assess how significantly the protein
interactions from the seeded subnetwork are distributed across specific GO-GO
functional interaction categories For a GO-GO functional interaction category we
refer to a pair of GO categories which are derived by aggregating all the protein-
protein interaction pairs with the same pairing of GO annotation categories for the
0
Pr[ | ] x
i
k N k Np X x n N k
i n i n
min( )
Pr[ | ] n k
i x
k N k Np X x n N k
i n i n
36
interacting proteins For example if 3 protein interactions share annotation category A
in one side of the interaction and annotation category B in the other side of the
interaction we say that A-B is a functional interaction category with an observed
count of 3 To identify significant GO-GO functional interaction category in the
seeded subnetwork we hypothesize the task as the observing the outcome of a random
draw of 1723 pairs from the pool of 46556 pairs in OPHID in human study (or
random draw of 1698 pairs from the pool of 25418 pairs in SBG in yeast study)
Then the count of a certain GO-GO function interaction category follows a
hypergeometric distribution A p-value for overunder-representation of the observed
count can be calculated similarly based on the hypergeometric distribution Since tests
of overunder representation of various categories are correlated with one another
(over representation of one category could imply under representation of other
categories) we also control the false discovery rate (FDR) using method developed by
Benjamini and Yekutieli[80]
38 Validation of Under-Represented GO Categories
Figure 35 Illustration showing the overlap of 9959 OPHID proteins and 4333
proteins detected by MS experiments 119 seed proteins is a high-confidence subset
of the overlapped proteins
Proteomics techniques are generally known for problems with false positives and
false negatives primarily for reasons such as complex digested peptide samples noisy
un-separated peptide peaks and computationally intensive proteinpeptide
9959 OPHID proteins
3690 proteins in both
OPHID and MS
4333 proteins detected
by MS
119
seed
proteins
37
identifications that cannot afford to take all post-translational modifications into
account Since we control false positives by choosing 119 high-confidence seed
proteins in this study false negatives instead of false positives are a potential concern
Therefore when we interpret over-under- representation of proteins in GO functional
categories or GO-GO functional interaction categories over-representation results are
likely under-exaggerated and will remain true but under-representation results are
likely over-exaggerated and needs additional validation or some adjustment
We take 4333 of all reported proteins which includes proteins identified with both
high and low confidence from the MS search software and overlap this set with all
the 9959 proteins found in OPHID Out of 4333 raw UniProt IDs 3690 of which can
be further mapped to OPHID interaction human database The 3690 is then assumed
to be the upper limit of instrumentsoftware detectable proteins When re-examining
over-under- representation GO functional categories we let n=3690 N=9959
k=corresponding count in OPHID and use the same formula introduced in section 26
to calculate significant protein overunder- representation This relationship is
illustrated in Figure 35
39 Drill-Down of Significant Categories
Once certain GO functional categories or GO-GO functional interaction categories
are determined to be significant they become candidates for subsequent ldquodrill-downrdquo
examinations For drill-down of GO functional categories we refer to exploration of
the next-level GO functional annotation by tracing down the GO structure and re-
calculating the significance value based on each protein‟s new next-level GO
functional annotation labels using methods described in section 26 For drill-down of
GO-GO functional categories we refer to exploring the next-level GO-GO functional
annotations by tracing both proteins of the interaction pair down the GO structure and
re-calculating the significance value The new next-level GO-GO functional
annotation categories consist of all paired combinations of sub GO functional
categories The use of drill-down allows us to zoom in our attention to detailed
biologically interesting categories to obtain further insights in enriched molecular
38
functions and biological processes without incurring a huge computational cost at the
very beginning of the exploration
310 Scoring of Significant Proteins in the Sub-Network
Protein ranking analysis was performed in MS Access front-end database which
connects to the Oracle back-end database First 184 differentially expressed proteins
were imported (with replacement) into linked Oracle table from the application
interface (see Figure 36 ) after correct login information was verified then the
application automatically create the sub-network data by querying the linked Oracle
SBG interactome dataset We calculated ranking scores for the significant proteins in
the sub-network using the heuristic relevance scoring formula[81]
1
2 ( ) ( )i
i
k
i ij
j
R LOG S LOG k
Where Ri is the ith seed protein ranking score Ki denotes its connectivity and Sij
denotes its interaction reliability score with the jth partner
Figure 36 Application for the yeast subnet construction
39
Our ranking analysis was built on the hypothesis the significance of a protein‟s
contribution in the network depends on its ability to connect to other proteins in the
network and the reliability of the detected interactions The higher the connectivity
and reliability the higher the ranking score should be
40
4 RESULTS
Case Study 1 Ovarian Cancer Drug Resistance Case Study
This part was written based on the published result[2] where I am one of the
primary contributing members The use of the material was granted with the
permission from participating contributors
41 Activated Protein Interaction Sub-Network Properties
The network topology for the protein interaction sub-network expanded from seed
proteins was examined The resulting protein interaction sub-network (core sub-
network) consists of 1230 seed and non-seed proteins in 1723 sub-network
interactions (including 17 S-S type interactions and 1706 S-N type protein
interactions) The node degree frequency distributions were plotted in Figure 41
where the whole human protein interaction network from OPHID (labeled ldquonetworkrdquo)
is also shown As expected both the network and the sub-network (full) display good
ldquoscale-freerdquo property These results also show that the cisplatin resistant activated sub-
network (full) contains more ldquohubsrdquo than ldquoperipheralrdquo proteins to form a cohesive
functional sub-network The core sub-network while perhaps limited in size shows
ldquoscale-free likerdquo distribution although hubs in the sub-network (core) are more
distinctively identifiable than overly abundant peripheral nodes by high node degree
counts
Other network features for the core sub-network are also examined The largest
connected component (defined in the Method section ibid) of the sub-network
consists of 1193 proteins The index of aggregation is 11931230=970 The index of
expansion as the percentage of S-S type interactions (17) over the core sub-network
interactions (1723) ie 171723=096 The index of aggregation has a p-value of
less than 0001 (upper tail) and the index of expansion is 006 (upper tail) A significant
and high network index of aggregation suggests that the core sub-network has
connectivity structures that are not random by nature This correlates well with the
41
node degree distribution in Figure 41 where an exceptionally large number of hubs
are shown to exist
1
10
100
1000
10000
1 10 100 1000
node degree in sub-network
co
un
t
Sub-Network (core)
Subnetwork (Full)
Network
Figure 41 Node degree distribution of the sub-networks (core or full) in
comparison with the human protein interaction network
42
42 Analysis of Activated Protein Functional Category Distributions
Although GO-based functional category analysis can be done routinely using many
existing bioinformatics methods [3] the inclusion of protein interaction network
context has not been previously described In this analysis we are more interested in
enriched protein categories in the cisplatin-response functional process This includes
both up-regulated and down-regulated proteins Therefore we transformed protein-
protein interaction sub-network to GO cross-talk sub-network Enriched protein
functional categories were discovered among differentially expressed seed proteins
and its immediate protein interaction sub-network nearest interaction partners
Table 41 shows significantly enriched GO categories in the sub-network 17 GO
categories were filtered from 70 GO categories (data not shown) The filter criteria are
1) the P-value over- or under- representation must be within 005 and 2) the total
category count of GO in the whole network is greater than 10 In GO_TERM column
we have listed three types of information level 3 GO terms GO term category type
(bdquoC‟ for cellular component bdquoF‟ for molecular function and bdquoP‟ for biological process
in parenthesis preceding the dash) and GO identifier (seven digit number following
the dash in parenthesis) In the ENRICHMENT column we listed two types of
counts of proteins with GO annotation levels falling in the corresponding category
within core sub-network and whole network (in parenthesis) In the PVALUE column
we have listed two numbers the p-value from the significance test of whether there is
an over- or an under- representation (two numbers separated by a bdquo‟) of an observed
GO term category count in the sub-network In the last CONCLUSION column bdquo++‟
suggests significant over-representation when the false discovery rate (FDR) is
controlled at 005 bdquo--‟ suggests significant under-representation when FDR controlled
at 005 bdquo+‟ to suggest insignificant over-representation when FDR controlled at 005
but significant overrepresentation at native p-value=005 bdquo-‟ to suggest insignificant
over-representation when FDR controlled at 005 but significant overrepresentation at
native p-value=005
43
Table 41 Enriched GO categories in the sub-network Context An asterisk
indicates adjustment may be needed for further interpretation
We also tested how robust the network is by introducing noise in protein
interaction data sets Two experiments were performed (for a description of the
methods see section 311) ldquoadd20rdquo in which we added 20 new randomly-selected
GO_TERM ENRICHMENT
PVALULE
(OVERUNDER) CONCLUSION
membrane (C-0016020) 7 (2034) 10 --
proton-transporting two-sector
ATPase complex (C-0016469) 2 (12) 0091 +
non-membrane-bound
organelle (C-0043228) 19 (834) 0059980 +
organelle lumen (C-0043233) 2 (13) 01019996 +
proton-transporting ATP
synthase complex (C-0045259) 2 (17) 01719990 +
proton-transporting ATP
synthase complex catalytic
core (C-0045261) 1 (1) 00121 +
proton-transporting ATP
synthase catalytic core
(C-0045267) 1 (1) 00121 +
protein binding (F-0005515) 26 (1387) 0129937 +
drug binding (F-0008144) 2 (12) 00091 +
isomerase activity (F-0016853) 7 (69) 01 ++
nucleotide binding (F-0000166) 23 (1205) 01489923 +
receptor activity (F-0004872) 2 (642) 99680149 -
receptor binding (F-0005102) 1 (422) 99440354 -
oxidoreductase activity
(F-0016491) 12 (271) 01 ++
Kinase
regulator activity (F-0019207) 3 (50) 002209970 +
metabolism (P-0008152) 67 (4634) 002009875 +
response to biotic stimulus
(P-0009607) 1 (711) 100014 -
regulation of physiological
process (P-0050791) 17 (2129) 98170328 -
regulation of cellular process
(P-0050794) 15 (2182) 99680066 -
44
connections between OPHID proteins to create a new OPHID proteins data set PiD-
a20 and ldquoremove20rdquo in which we removed 20 existing randomly-selected
connections between OPHID proteins to create a new OPHID proteins data set PiD-
r20 Surprisingly although the individual category counts fluctuate all conclusions
made through the above-described threshold values of p-value and FDR remain the
same (this conclusion also remains true for high-level GO-GO category enrichment
experiments in next section results not shown) This suggests the significance of our
discovery is robust against reasonable noise inherent in the protein interaction
databases
After the above analysis we then re-examined all ldquounder-represented categoriesrdquo
under a new false-negative controlled experiment to see if these under-representations
have been ldquoexaggeratedrdquo due to bias of the MS experimental methods Therefore we
set up an experiment to observe the inherent bias (either over- or under- representation)
in all detectable MS proteins overlapped with OPHID data sets (also described in
section 316)
Table 42 Re-examination of under-represented seed protein functional
categories
GO_TERM
P-VALUE OVER-
REPRESENTED
(seedbackground)
P-VALUE
UNDER-
REPRESENTED
(seedbackground)
CONCLU-
SION
Membrane (C-0016020) 10000 (00000) 00001 (10000) --
receptor activity (F-0004872) 99681 (00002) 01489 (99998) --
receptor binding (F-0005102) 99439 (99937) 03550 (00092)
response to biotic stimulus
(P-0009607) 99986 (10000) 00144 (00000)
regulation of physiological
process
(P-0050791) 98169 (00000) 03276 (10000) --
regulation of cellular process
(P-0050794) 99685 (00000) 00664 (10000) --
45
Table 42 lists the results Here seed experiment refers to the earlier experiment
which we examined the enrichment (in this case all under-representations) of 119
seed proteins background experiment refers to the re-examination experiment which
we examined the enrichment bias of 3690 MS detectable proteins also found in
OPHID data set When we observe significant over-representation of certain GO
functional categories in the background we make the conclusion that the category is
indeed under-represented in the seed (marked as ldquo--ldquo)When we observe significant
under-representation of certain GO functional categories in the background we make
the conclusion that the category is not necessarily under-represented (or likely over-
represented) in the seed (marked as ldquoldquo for inclusive)
From the above comprehensive analysis we can obtain the following biological
insights First proton-transporting ATP synthase activity is related to the cell cisplatin
resistance function (see table 5 for the enriched GO categories) which may imply
higher oxidative energy production capability among cancerous functions in cisplatin
resistant cell lines over cisplatin sensitive cell lines This is consistent with the existing
findings mitochondria -- ldquoATP factoryrdquo was considered to be a major target of
cisplatin leading to mitochondrial loss of energy production[82] Second although the
protein interaction network in general is inherently enriched with proteins with
ldquoprotein bindingrdquo capabilities (note 1412 proteins in the category from the whole
network) the cisplatin-resistant cell line demonstrated an unusually high level of
protein-binding activities in addition a broad spectrum of across-the-board drug-
binding and nucleotide-binding mechanisms are all activated to fight again cisplatin-
induced DNA damage in cancer cells This suggests that many intracellular signaling
cascades are intensely mobilized with cisplatin-resistance Third the data suggest that
the location of the biological activities of cisplatin resistant response take place in
cytoplasm or nucleus rather than on ldquomembranerdquo This correlates well with the
previous hypothesis that transporters that are responsible for assisting with cisplatin
import into the cell seem to become blocked in drug-resistant cells This analysis gives
essential clues to the overall picture of molecular signaling events for cisplatin
46
GOT2
cell communication
cellular physiological process
localization
locomotory behavior
metabolism
organ development
organismal physiological process
regulation of cellular process
regulation of development
regulation of physiological process
regulation of viral life cycle
response to abiotic stimulus
response to biotic stimulus
response to endogenous stimulus
response to external stimulus
response to stress
resistant cell lines We also obtained categorical enrichment data at lower GO levels
than are shown in this section using the drill-down method (for method refer to
section 317 results not shown) to obtain detailed views of biological process
molecular function and cellular components
43 Functional Category Cross-Talks
We developed a two-dimensional visualization matrix (extended from our
technique described in [83]) to show significant cross-talk between GO categories in
Figure 42 (only biological processes at level=3 are shown due to space constraints)
Figure 42 Significantly over-represented GO-GO interaction categories in seeded
subnetwork (only biological processes at level=3 are shown due to space constraints)
47
Table 43 Drill down of significant GO-GO functional category cross-talk
ldquoCellular Physiological Processrdquo vs ldquoCellular Physiological Processrdquo at GO term level
4 Note only p-value lt005 for over-representation are shown (FDRlt005 cases are
also in bold)
GO TERM 1 GO TERM 2 ENRICHMENT
P-
VALUE
cell homeostasis (P-
0019725) transport (P-0006810) 18 (120) 0
transport (P-0006810) transport (P-0006810) 75 (1377) 00006
regulation of cellular
physiological process (P-
0051244) transport (P-0006810) 130 (2045) 0
cell cycle (P-0007049) transport (P-0006810) 68 (708) 0
cell death (P-0008219) transport (P-0006810) 45 (694) 00002
cell proliferation (P-
0008283) transport (P-0006810) 22 (238) 00001
cellular metabolism (P-
0044237) transport (P-0006810) 359 (6041) 0
cellular metabolism (P-
0044237) cell cycle (P-0007049) 253 (4439) 0
cellular metabolism (P-
0044237)
cell proliferation (P-
0008283) 85 (1412) 0
cell homeostasis (P-
0019725)
cell organization and
biogenesis
(P-0016043) 11 (73) 00001
cellular metabolism (P-
0044237)
cell homeostasis (P-
0019725) 25 (279) 0
cellular metabolism (P-
0044237)
cellular metabolism (P-
0044237) 764 (17604) 0
cell homeostasis (P-
0019725) cell cycle (P-0007049) 5 (43) 00207
regulation of cellular
physiological process (P-
0051244) cell cycle (P-0007049) 130 (2655) 00007
cell cycle (P-0007049) cell cycle (P-0007049) 39 (702) 00084
cell organization and
biogenesis
(P-0016043) cell cycle (P-0007049) 53 (936) 00017
cell homeostasis (P-
0019725)
chromosome
segregation
(P-0007059) 1 (1) 0037
regulation of cellular
physiological process (P-
0051244)
cell homeostasis (P-
0019725) 13 (149) 00037
48
The size of each node is inversely proportional to the p-value of interacting categories
The color legends are red (dark) for interacting categories that are significant when
FDR controlled at 005 and gray (light) for interacting categories that are not
significant when FDR controlled at 005 The figure 42 reveals additional interesting
findings First cellular physiological processes are significantly activated in drug-
resistant cell lines (the largest and reddest dot at the bottom left corner) This could
lead to further drill-down of protein interaction in the interacting category for
biological validations (see Table 43 for an example) Second these cellular
physiological processes seem to be quite selective rather than comprehensive For
example when looking at significant regulation of cellular response categories
significant cross-talk functional patterns strongly suggest the cellular and
physiological responses arise from endogenous abiotic and stress-related signals
(internalized cisplatin causing DNA damage and inducing cell stress) Using a cross-
talk matrix such as this cancer biologists can quickly filter out other insignificant
secondary responses (such as cell growth cell development shown) to establish a new
prioritized hypothesis to test
44 Visualization of the Activated Interaction Functional Sub-Network
In Figure 43 we show a visualization of the activated biological process functional
network using a recently developed software tool ldquoProteoLensrdquo[79] ProteoLens is a
biological network data mining and annotation platform which supports standard
GML files and relational data in the Oracle Database Management System (for
additional details visit httpbioinformaticsiupuieduproteolens) In the figure 43
in contrast with regular protein interaction network we encode nodes as significantly
over-under- represented protein functional categories and edges as significantly
interacting protein functional categories Several additional information types are also
represented The original abundance (by count) of each functional category is encoded
in the node size The p-values of activated protein category significance in the sub-
network is encode as node color intensity on a scale from light yellow (less significant)
to dark red (more significant)
49
Figure 43 Activated biological process network in cisplatin-resistant ovarian
cancer cells Red-colored lines stand for ldquosignificantrdquo while blue-colored lines stand
for ldquonot significantrdquo (FDR=005)
50
From this figure 43 we can see that cisplatin-resistant ovarian cancer cells
demonstrated significant cellular physiological changes which are related to cancer
cell‟s native response to stimulus that is endogenous abiotic and stress-related
Interestingly we also observed that the regulation of viral life cycle also plays very
significant roles in the entire drug resistant process This previously unknown
observation may be further examined at protein levels to formulate hypothesis about
acquired cisplatin resistance in ovarian cancer
51
Case Study 2 Yeast Grr1 Knock-Out Case Study
Case study 2 is the collaborative work among the biology group (Dr Goebl and
Josh) biostatistics group (Dr Shen) and Informatics group (Dr Chen and I) The
manuscript is in preparation
45 Activated Protein Interaction Sub-Network Properties
Figure 44 Node degree distribution of the sub-networks (core or full) in
comparison with the yeast protein interaction network
52
The resulting protein interaction sub-network consists of 1251 seed and non-seed
proteins in 1698 sub-network interactions (including 54 S-S type interactions and
1644 S-N type protein interactions) This protein interaction sub-network is called a
ldquocore sub-networkrdquo The ldquofull sub-networkrdquo includes all N-N type protein interactions
in addition to the S-S type and S-N type interactions We plot their node degree
frequency distributions in Figure 44 where the whole yeast protein interaction
network from SBG (labeled ldquonetworkrdquo) is also shown As expected both the network
and the sub-network (full) display good ldquoscale-freerdquo property (some nodes act as
highly connected hubs although most nodes are of low degree) The core sub-
network while perhaps limited in size begins to show ldquoscale-free likerdquo distribution
although hubs in the sub-network (core) are more distinctively identifiable than overly
abundant peripheral nodes by high node degree counts
We also examined other network features for the core sub-network The largest
connected component of the sub-network consists of 1163 proteins with 1637
interactions The index of aggregation is 11631251=930 The index of expansion
as the percentage of S-S type interactions (54) over the core sub-network interactions
(1698) is 541698=318 The high network index of aggregation here suggests that
the core sub-network has high connectivity
46 Analysis of Activated Protein Functional Category Distributions
We first analyzed significantly enriched GO categories among 184 seed proteins
We limited our analysis to level 3 GO categories as previously described Our result
revealed 11 significantly enriched GO biological process functional categories and
cellular components in response to Grr1 perturbation After filtering out the general
GO categories that have more than 200 ORFs from the whole yeast PPI have been
annotated to only 3 significantly enriched GO categories are left (see table 44) The
table column header definition is the same as previously defined in the human case
study
53
Table 44 Overunder ndash represented GO categories among the seed proteins
GO_TERM ENRICHMENT
(OVERUNDER
)
CONCLUSIO
N
eukaryotic 43S preinitiation
complex (C-0016282) 5 (55) 004270988 +
lipid transporter activity (F-
0005319) 2 (8) 0029909979 +
oxidoreductase activity (F-
0016491) 16 (184) 0000709998 +
The analysis result from the above apparently provides limited information Thus a
simple ontology-based annotation for global proteomics data offers no significant
further understanding of Grr1 function This is partially due to the fact that the current
proteomics techniques are not sensitive enough to capture the whole proteome
especially those proteins with low-abundance eg Grr1 However we expect to find
many abundant proteins whose expression levels are directly or indirectly regulated by
Grr1 These proteins may look disparate or isolated in their GO-annotation but may
interact with other proteins and impact the cellular components or functions
We expanded our protein list by mapping our differentially expressed proteins onto
protein interaction networks and including the immediate partners in our analysis The
expanded sub-network included 1251 proteins (184 seeds and 1067 immediate
partners) We then mapped these proteins into GO categories and re-analyzed the
enriched GO categories using statistical methods previously described We discovered
53 enriched GO categories including both over- and under-represented GO categories
We applied the same filtering criteria to the 53 GO categories to remove generalized
GO categories that contain 200 or more annotations and obtained 40 enriched GO
categories with 15 terms categorized as component terms 15 categorized as process
terms and 10 categorized as function terms (see table 10) The table column header
definition is the same as previously defined in the human case study Therefore the
application of the GO analysis to the sub-network leads to the extraction of more GO
terms overall and more specific GO terms
54
Table 45 Overunder ndash represented GO categories among the subnet proteins
GO_TERM
ENRICH-
MENT (OVERUNDER)
CONCLU
-SION
transcription export complex (C-0000346) 4 (4) 000321 +
proteasome complex (sensu Eukaryota) (C-
0000502) 25 (37) 01 ++
transcription factor complex (C-0005667) 43 (106) 000011 ++
mitochondrial inner membrane presequence
translocase complex (C-0005744) 3 (4) 0044609968 +
proteasome regulatory particle (sensu
Eukaryota) (C-0005838) 8 (9) 000011 ++
microtubule associated complex (C-0005875) 14 (29) 000350999 +
bud (C-0005933) 48 (107) 01 ++
eukaryotic 43S preinitiation complex (C-
0016282) 19 (55) 004790975 +
chromatin remodeling complex (C-0016585) 30 (71) 0000409998 ++
DNA-directed RNA polymerase II
holoenzyme (C-0016591) 32 (66) 01 ++
external encapsulating structure (C-0030312) 14 (102) 0996400077 -
site of polarized growth (C-0030427) 50 (109) 01 ++
replisome (C-0030894) 12 (27) 001490995 +
cell projection (C-0042995) 19 (36) 000021 ++
pyruvate dehydrogenase complex (C-
0045254) 3 (4) 0044609968 +
RNA polymerase II transcription factor
activity (F-0003702) 42 (93) 01 ++
receptor signaling protein activity (F-
0005057) 8 (13) 0004109993 +
amine transporter activity (F-0005275) 1 (33) 0999900014 -
organic acid transporter activity (F-0005342) 2 (39) 099970002 -
carrier activity (F-0005386) 24 (158) 0997600046 -
enzyme activator activity (F-0008047) 20 (56) 0030409848 +
lipid binding (F-0008289) 11 (15) 000011 ++
protein transporter activity (F-0008565) 11 (25) 0021109928 +
carbohydrate transporter activity (F-0015144) 3 (31) 098820041 -
GTPase regulator activity (F-0030695) 26 (63) 0001609994 ++
aging (P-0007568) 15 (29) 000109997 ++
55
morphogenesis (P-0009653) 46 (103) 01 ++
response to endogenous stimulus (P-0009719) 64 (172) 01 ++
cell growth (P-0016049) 3 (4) 0044609968 +
death (P-0016265) 15 (39) 0029509871 +
sexual reproduction (P-0019953) 41 (93) 01 ++
asexual reproduction (P-0019954) 39 (75) 01 ++
cell differentiation (P-0030154) 39 (100) 0000509998 ++
Filamentous growth (P-0030447) 23 (54) 0001809993 ++
regulation of growth (P-0040008) 3 (3) 001361 +
regulation of gene expression epigenetic (P-
0040029) 25 (76) 0045909737 +
negative regulation of biological process (P-
0048519) 53 (155) 0002109988 ++
non-developmental growth (P-0048590) 14 (28) 0002309994 ++
regulation of enzyme activity (P-0050790) 13 (25) 0002109995 ++
reproductive physiological process (P-
0050876) 27 (65) 0001209995 ++
To assess the validity of our analysis we first determined whether the expanded
GO annotation was supported by known Grr1 functions from previous publications
Grr1 affects many different cellular processes in Saccharomyces cerevisiae through
its role as a receptor for the SCF ubiquitin ligase[84-86] In conjugation with this
multimeric protein complex Grr1 serves to target protein substrates for ubiquitylation
an event that ultimately results in the substrates degradation by the 26S proteasome
Currently there are ten proteins that are thought to be ubiquitylated by the SCFGrr1
ubiquitin ligase each of these proteins playing distinct roles in multiple cellular
processes[86] The cells lacking Grr1 exhibit multiple abnormalities including cell
elongation slow growth on glucose increased sensitivity to osmotic stress and
nitrogen starvation decreased divalent cation transport enhanced filamentous growth
defects in sporulation and slow growth or invariability when combined with amino
acid biosynthesis mutants[84 87-90] We expect our ontology-driven network enabled
approach would capture some of the GO functions through extracting the enriched GO
terms directly associated with Grr1 or with the targets of Grr1
56
Intriguingly among the 40 enriched GO categories 14 GO categories are directly
ascribed to Grr1 or at least one of its targets 10 categories over-represented and 4
under-represented In figure 45 the 10 over-represented GO categories that are
directly related to Grr1 or related to targets of Grr1 are shown The Grr1 protein is
known to participate in regulating bud emergence and growth through its role in
targeting the Cdc42 effectors Gic1 and Gic2 as well as the cyclins Cln1 and Cln2 for
degradation by the 26S proteasome [85 90-93] The GO categories ldquopolarized
growthrdquo ldquobudrdquo ldquomorphogenesisrdquo ldquoasexual reproductionrdquo and ldquocell projectionrdquo are
all involved in the elongated bud morphological phenotype of Grr1 knock-out cells
The elongated bud morphology resembles invasive growth for Grr1 knock-out yeast
Therefore based on the existing evidence from previous publications the ontology-
driven network-enabled analysis approach proves to be not only valid but also have
the potential to drive the generation of the novel hypothesis for future investigations
57
Figure 45 Enriched GO categories (partial listing) and yeast bud morphological
phenotype This figure was modified based on Josh‟s original figure
47 Functional Category Cross-Talks
Figure 46 Visualization of significantly over-represented GO cross ndash talk sub-
networks related to Grr1 induced morphological change The partial sub-networks
were constructed by seeding the significantly enriched GO cross-talk sub-network by
ldquobudrdquo ldquocell projectionrdquo ldquosite of polarized growthrdquo ldquoasexual reproductionrdquo and
ldquomorphogenesis The top one is for biological process and the bottom one is for
58
cellular component The numbers and the thickness both denote the enrichment of the
GO cross-talk pairs in the protein-protein interaction sub-network The larger the
number or the thicker the line the more enriched the GO pair is
To investigate how these Grr1-deletion enriched GO categories are functionally
associated with each other we subsequently performed functional category cross-talk
analysis (for detailed method see method section 37) and identified 287 significant
overunder-represented GO-GO cross-talks (see appendix 4)
In particular the significantly enriched GO categories discovered previously ie
ldquobudrdquo ldquocell projectionrdquo ldquosite of polarized growthrdquo ldquoasexual reproductionrdquo and
ldquomorphogenesis are also involved in the significantly enriched GO-GO cross-talk
pairs These cross-talk GO categories are functionally related to the yeast bud
morphological phenotype change induced by Grr1 knock-out perturbation
Importantly some of the GO-GO pairs are highly connected and form the GO-GO
interaction subnet for Grr1 (Figure 46) implying that Grr1 perturbation may affect
some specific biological processes or cellular components through a small core group
of proteins Further more we also observe that microtube associated complex is highly
connected to other GO categories in the GO cross-talk sub-network that are related to
Grr1 induced morphological change This intrigues us since there is no previously
known role for Grr1 in microtubule related processes
Drill-down analysis of the group of proteins involved in the GO cross-talk sub-
network might help biologists discover the proteins that significantly contribute to the
Grr1 perturbed morphological phenotype change
48 Scoring of Significant Proteins in the Sub-Network
We further performed significant proteins ranking analysis with the hope of
isolating important proteins that contribute to Grr1s possible new function that we
discovered earlier by our ontology-driven network-enabled approach
59
Based on the connectivity and the confidence of the protein-protein interactions we
ranked significant seed proteins (for detail of the method see section 310) Table 46
shows the top-ranked 20 proteins among 184 seed proteins
Table 46 Ranking analysis of the significant proteins Only 20 top-ranked proteins
were listed here due to the space
Rank Score ORF Gene Symbol Fold Change (Grr1 vs wt)
1 41826 YGL167C PMR1 0250
2 39453 YPR141C KAR3 5970
3 38658 YNL298W CLA4 0202
4 30236 YPL174C NIP100 0111
5 28646 YOR261C RPN8 033
6 28301 YNL233W BNI4 531
7 2784 YML008C ERG6 0129
8 27606 YDR155C CPR1 0524
9 26697 YNL244C SUI1 4224
10 26495 YKL173W SNU114 0409
11 26329 YKR054C DYN1 39224
12 26311 YMR309C NIP1 13115
13 26219 YJL148W RPA34 0129
14 25001 YGL055W OLE1 6486
15 23706 YBL047C EDE1 0343
16 23508 YBR152W SPP381 4658
17 2328 YDL006W PTC1 0229
18 23236 YGL112C TAF6 04029
19 23079 YLR087C CSF1 64511
20 22101 YOR290C SNF2 01812
Later we isolated the actual proteins from the top ranked protein list that mapped
to the GO component term microtubule associated complex The analysis revealed that
two of the most highly connected proteins Nip100 and Dyn1 Both proteins also
represented most extensively changed proteins in the network Dyn1 protein levels
were observed to increase in the Grr1 mutant ~ 40 fold while Nip100 protein levels
were observed to decrease ~10 fold in the analysis Nip100 is part of the dynactin
complex[94] where it is thought to act as a tether for Dynein encoded by Dyn1 Thus
we probed the relationship between Grr1 and Nip100 Figure 47 shows protein
interaction sub-network seeded by Grr1 Dyn1 and Nip100 where Grr1 connects to
60
Nip100 through Bzz1 and Tub3 Grr1 connects to Dyn1 through Cdc12 and Pac10
We hypothesized that Grr1‟s influence on the GO component microtubule associated
complex could be possibly through one or more of these bridge proteins such as Bzz1
The biological experiments are being conducted by our biology group to validate this
hypothesis
Figure 47 Protein interaction sub-network seeded by Grr1 Dyn1 and Nip100
Node colors Red = protein level gt 2 fold Bright blue = -2gt= protein level lt=2 Grey
= no detection Green = protein level lt-2 Line colors Red = Synthetic Lethality Pink
= Synthetic Growth Defect Light Blue = Two Hybrid or Affinity Capture MS Dark
Blue = Reconstituted Complex or Affinity Capture Western Green = Synthetic
Rescue Purple = Dosage Rescue Orange = Phenotypic Suppression Yellow =
Phenotypic Enhancement This figure was provided by Josh Heyen
61
Through ranking analysis we also further validated our ontology-driven network-
enabled approach Kar3 a kinesin-like nuclear fusion protein is ranked at the second
place in the table It belongs to gene ontology categories ldquosexual reproductionrdquo (level
3 biological process) and ldquointracellularrdquo (level 3 cellular component) The third top-
ranked protein Cla4 a protein kinase can be mapped to GO categories ldquoasexual
reproductionrdquo at level 4 biological process and ldquobudding cell apical bud growthrdquo
ldquocell communicationrdquo ldquometabolismrdquo and ldquomorphogenesisrdquo at level 3 biological
process All of the GO categories mapped by these proteins have been shown to be
important in Grr1 perturbation induced morphological changes through our ontology-
driven and network-enabled approach based analysis
62
5 CONCLUSIONS
In the current study we developed a systems biology approach to analyze the
proteomics data We applied this novel approach to two case studies human ovarian
cancer drug resistance study and yeast Grr1 knock-out study
The identified differentially expressed proteins formed basic dataset ndash seed proteins
of our case studies We used the seed proteins to construct our protein-protein sub-
network Then we analyzed the core protein-protein interaction sub-network feature
Both human ovarian cancer drug resistance related and yeast Grr1 knock-out sub-
networks showed high connectivity feature After we mapped the proteins and protein-
protein interactions to GO annotations and constructed GOndashGO cross-talk sub-
networks we performed statistical testing to find significantly enriched over under-
represented GO categories and GO-GO cross-talk categories The visualization tools
ldquoSpotfirerdquo and ldquoProteolenserdquo were used to aid in the analysis
Our approach has been validated in the two case studies by comparing our
discoveries with existing findings Some new insights were obtained
In the first case study we observed that cellular physiological process is
significantly activated in drug-resistant cell lines and this response arises from
endogenous abiotic and stress-related signals Our studies also showed that cisplatin
resistant cell line demonstrated unusually high level of protein-binding activities and
a broad spectrum of cross-the-board drug-binding and nucleotide-binding mechanisms
are all activated
In the second case study we observed that a subset of significantly over-
represented enriched GO categories is highly connected in the GO sub-network which
implies that Grr1 induced morphological phenotype change might be resulted from a
small core group of proteins We hypothesized Grr1s new role in microtubule related
processes based on the high connectivity of microtubule associated complex with
63
other GO categories for Grr1s known functions We further performed ranking
analysis of the significant seed proteins based on their connectivities and reliabilities
of the interactions in the sub-network The ranking analysis further validated our
findings revealed by the ontology-driven network-enabled approach These biological
discoveries support the significance of developing a common framework of evaluating
functional genomics and proteomics data using networks and systems approaches
64
6 DISCUSSIONS
Molecular biology focuses the mechanistic study of biological phenomena One of
its strengths is to concentrate on the actions of a small number of genes without being
distracted by the complex biological milieu in which they are found However in
terms of a series of binary interactions or when pathways become complex and many
genes work together using molecular biology to model function shows its weakness
In this case more network-level understanding is required In this study we showed
that the key to interpreting omics data is a systems biology approach which is both
hypothesis-driven and data-driven with the ultimate goal of integrating multi-
dimensional biological signals at molecular signaling network levels It is important
to note that systems biology approach and the traditional molecular biology approach
should complement each other in order to achieve a deep understanding of the
molecular mechanisms The systems biology approach is not a replacement of the
traditional approach
In the present study we described a novel systems biology approach to integrate
omics data with both GO annotation and protein interaction networks and its
application in two proteomic case studies The whole proteome of two cellular
conditions of yeast or human cells were interrogated using LC-MSMS A
differentially expressed protein lists were obtained by statistical analyses controlling
false discovery rate We obtained 114 and 184 significantly over- or under-expressed
proteins for our two case studies respectively The mass spectrometer-based
proteomics analysis is one of the major techniques recently developed to examine
thousands of proteins simultaneously Since it directly analyzes the protein level and
protein modifications the mass spectrometer- based proteomics provides more direct
explanations for cellular processes involving multiple protein components However
the current proteomics analysis was unable to detect and quantify an entire proteome
and has low sensitivity to the low-abundant proteins such as Grr1 which may play
critical roles in many important biological processes
65
The large volume of differentially expressed proteins derived from the proteomics
and microarray studies provide us the opportunity for investigating the biological
function at the systems level However the protein lists themselves offers very limited
clues to our understanding of the biological processes that underlie cisplatin resistance
of human ovarian cancer cells or abnormal phenotype that is associated with Grr1
deletion Most of the identified significant differentially regulated proteins are not
obviously related to the known function of Grr1 or drug resistance As our first
attempt to understand the function of our protein list we performed ontology-based
analysis which is now widely used in data mining of functional genomic data as well
as proteomics data Gene ontology annotation is an important milestone on
possibilities to handle and link biological knowledge with gene profiles identified in
functional genomics and proteomics analysis
Nevertheless mapping differentially expressed protein list onto ontology provided
only limited information to our understanding of the biological processes associated
with cellular conditions For example our GO annotation analysis of Grr1-deletion
affected protein list leads to identification of three enriched GO terms after applying
certain filter eukaryotic 43S preinitiation complex lipid transporter activity
oxidoreductase activity none seems to be clearly associated with known function of
Grr1 Thus although GO-based analysis proved to be useful in interpretation of the
gene profiling experiments using microarray[95 96] this technique on its own provide
only limited information for our understanding of biological function at the systems
level
Another important approach for interpretation of omics data is network-based
analysis Since most biological characteristics arise from complex interactions
between the cellular constitutes such as proteins mapping changed proteins identified
onto protein network will place these proteins in a broader biological context thereby
facilitating the understanding of the structure and function of living cells In our yeast
case study we mapped our 184 proteins into protein interaction database and ranked
the importance of these proteins according to the number of their immediate
66
connectivity and the reliability score calculated using a formula We hypothesized that
the most highly connected proteins in the sub-network may represent proteins that
may be mostly directly affected by Grr1 gene deletion Intriguingly two of the 20 top-
ranked proteins Nip100 and Dyn1 are genetically and physically connected with each
other (Figure 47) The physical association of Grr1 with Nip100 is through Bzz1
which appears in our extended protein ranking list As Nip100 and Dyn1 are a part of
the microtubule components Grr1 may exert its function though its influence on its
immediate target Bzz1 This hypothesis warrants a detailed study in the future
One of the distinct features of our systems biology approach is to bring the gene
ontology category concept into the context of protein-protein interaction network and
use it for omics data analysis We hypothesized that the limited number of changed
proteins identified through proteomics may actually be connected within Grr1 sub-
network These changed proteins may exert their function by influencing the protein
networks that they are involved in We thus expand our interest of proteins to include
those proteins that directly interact with our changed proteins To understand the
biological function of these expanded protein list we then mapped the protein list onto
gene ontology terms and identified significantly enriched GO terms Through this
approach we found about 40 significantly enriched GO terms by applying a certain
filter Strikingly 10 of the enriched GO-terms could be ascribed to Grr1 or its target
proteins (Figure 45) according to previous publications Thus our ontology-driven
and protein network-enabled approach can not only be used to validate existing
knowledge but also have the potential to generate the hypothesis for future
investigation
In our approach we also explored GO-GO cross-talks and identified Grr1-deletion
associated GO-GO cross talks This information further extends our understanding of
the connection of multiple processes induced by gene deletion or other stress
conditions We also demonstrated that functional 2-dimensional matrix and protein
interaction network visualization tool may significantly facilitate the biologists to form
their hypotheses
67
Our systems biology approach provides a framework for further improvement in
the future First our analysis is currently based on proteomics data only The method
described here is readily applicable to microarray data analysis We expect to gain
more in-depth understanding of the Grr1 function by incorporation of published Grr1
microarray data into our analysis Because the relationship between transcription and
translation is likely to vary based on the individual geneprotein it may not be realistic
to expect a high degree of correlation between protein and RNA levels when
attempting to correlate dynamic change in RNA with a static picture of proteins
Combination of genomics and proteomics data requires further development of current
approach Second our network-based analysis focuses on the functional significance
of changed proteins through protein-protein interaction analysis We made no attempt
to understand how the changed proteins are regulated by genetic or environmental
stress One of the future directions is to incorporate gene regulatory network analysis
in order to identify regulatory relationships among large numbers of genes that form a
network representation of the underlying regulatory processes Finally our current
model needs fine adjustment to provide elegant interpretation of omics data For
example the validity of ranking model needs further investigation Drill-down of GO
categories analysis may provide further details for interpretation of biological
consequences induced by genetic or environmental stresses
In summary our ontology-driven network-enabled systems biology approach
provides in-depth understanding of cellular functions and creates a robust concept
framework for further improvement in the future
68
7 Appendices
Appendix 1 ERD diagram for Oracle schema Sysbio For details see [21]
69
Appendix 2 Uniprot ID mappings for 119 differentially expressed seed proteins
in ovarian cancer drug resistance study
UNIPROTID
ANKS1_HUMAN
1433T_HUMAN
1433Z_HUMAN
1433E_HUMAN
1433F_HUMAN
ACTN1_HUMAN
AL3A1_HUMAN
AL3A1_HUMAN
AKAP9_HUMAN
AL1A1_HUMAN
CBX3_HUMAN
DEST_HUMAN
CENPE_HUMAN
CNN2_HUMAN
CRIP2_HUMAN
CRTC_HUMAN
E41L1_HUMAN
FKBP4_HUMAN
6PGD_HUMAN
ABCG1_HUM AN
ACADM_HUMAN
DOCK4_HUMAN
ANXA3_HUMAN
B2MG_HUMAN
DHCA_HUMAN
CAP1_HUMAN
ATPA_HUMAN
ATPB_HUMAN
CU059_HUMAN
CYBP_HUMAN
FA49B_HUMAN
MDHC_HUMAN
KCRU_HUMAN
LPPRC_HUMAN
GALT3_HUMAN
HS70L_HUMAN
HSP76_HUMAN
GANAB_HUMAN
IF4H_HUMAN
HSBP1_HUMAN
70
HS90B_HUMAN
KAP0_HUMAN
ETFA_HUMAN
PHS3_HUMAN
PP2CG_HUMAN
PPIA_HUMAN
PGK1_HUMAN
PPIB_HUMAN
PDIA1_HUMAN
PDIA6_HUMAN
PARP3_HUMAN
PADI3_HUMAN
RS14_HUMAN
SERA_HUMAN
SODC_HUMAN
SFRS2_HUMAN
SFRS3_HUMAN
INSI1_HUMAN
MYLK_HUMAN
PSB3_HUMAN
PUR6_HUMAN
MYH13_HUMAN
MYL6_HUMAN
MYL6_HUMAN
MYL6_HUMAN
NDK8_HUMAN
PDCD6_HUMAN
O2T35_HUMAN
NDKB_HUMAN
PCNA_HUMAN
PLSI_HUMAN
RL15_HUMAN
TYSY_HUMAN
VINC_HUMAN
UGDH_HUMAN
S10A1_HUMAN
ST1A2_HUMAN
TBA1_HUMAN
TBA3_HUMAN
TCP4_HUMAN
THIL_HUMAN
THIO_HUMAN
SMCA5_HUMAN
71
TPIS_HUMAN
TBA8_HUMAN
TBAK_HUMAN
STMN1_HUMAN
RPA5_HUMAN
Q12803_HUMAN
O75935_HUMAN
O60486_HUMAN
O14950_HUMAN
Q6IQ55_HUMAN
Q6MZM0_HUMAN
Q6ZSF4_HUMAN
Q5HYM0_HUMAN
Q5VVN3_HUMAN
Q5S007_HUMAN
Q5VU19_HUMAN
Q7Z4V5_HUMAN
Q86XQ2_HUMAN
Q86WH0_HUMAN
Q75MT3_HUMAN
Q9P2M8_HUMAN
Q9NVS0_HUMAN
Q9NZI8_HUMAN
Q9Y2K3_HUMAN
Q9UPT8_HUMAN
Q8TBR1_HUMAN
Q8WU10_HUMAN
ALDOA_HUMAN
CH60_HUMAN
PDIA3_HUMAN
SEC5_HUMAN
PSA6_HUMAN
TBA6_HUMAN
STMN2_HUMAN
RL12_HUMAN
Q96D18_HUMAN
72
Appendix 3 ORFs for 184 differentially expressed seed proteins in Grr1 knock-
out case study
ORF Fold Change
Q0255 415793714718904
YAL038W 0545852252758714
YAR009C 605360443593325
YBL015W 0328014440120407
YBL016W 814232901955471
YBL030C 428248520447998
YBL047C 034267736598115
YBL088C 249526272717271
YBL092W 0483721610343309
YBR021W 0157116451158551
YBR078W 023105360448864
YBR115C 2225185704536
YBR136W 419593345669184
YBR148W 186570263971014
YBR149W 025000000018879
YBR152W 465804066570279
YBR169C 603512014781145
YBR214W 0203327171879698
YBR218C 831792976604813E-02
YBR225W 426987061012334
YBR231C 954316594964094E-02
YBR233W 128927911263819
YBR241C 213537469763711
YBR263W 0147874306878216
YBR272C 231265108764462
YBR275C 496736103277175
YBR286W 296785473982758
YCL011C 259830512475747
YCR065W 0101522842755918
YDL006W 0228887134956306
YDL019C 93956486699021
YDL058W 98820593963859
YDL075W 226719154500437
YDL127W 534195933395087
YDL131W 201603150013112
YDL154W 566956521767448
YDL176W 0346494762223967
YDL239C 0295748613985256
YDR035W 0419114082837675
YDR058C 417638479544648
73
ORF Fold Change
YDR081C 0175600739297833
YDR116C 301369863012484
YDR138W 244157937145452
YDR155C 0523771152122715
YDR168W 0194085027742803
YDR171W 426062846561671
YDR177W 0166358595066621
YDR226W 331896375814804
YDR247W 368435004836908
YDR351W 211090573011355
YDR379W 0191304347619674
YDR450W 197524910005861
YDR464W 203099999997752
YDR469W 0331450044758495
YDR483W 0240000000159372
YER026C 584103511998871
YER042W 630314232922456
YER158C 191551565055894
YER166W 0273972603027691
YER176W 012628255728794
YER178W 210660620275169
YFL003C 0470655774025158
YFL007W 573796369408722
YFR034C 219983883943257
YGL003C 0110667072598724
YGL055W 648573742222094
YGL103W 207971802652271
YGL112C 0402900886532899
YGL131C 0370668815315337
YGL148W 0277264325355963
YGL151W 0203327171879698
YGL156W 259468170831708
YGL167C 0249798549363811
YGR004W 125138632168835
YGR027C 178132111635026
YGR087C 0228887134956306
YGR132C 0360000000192903
YGR175C 0129390018511791
YGR189C 029008863801562
YGR203W 98383973630905
YGR235C 369863013665815
YGR275W 688539741255251
YGR284C 0304990757780443
74
ORF Fold Change
YGR288W 141988950288631
YHL011C 273300000004619
YHL033C 245951318287733
YHR104W 914445109656317
YHR114W 639305445942334
YHR179W 263093435531901
YHR198C 646253021778323
YIL019W 012628255728794
YIL031W 501739130432334
YIL041W 231952362986739
YIL053W 0345265042503515
YIL112W 250699522170334
YIL143C 891870560378892
YIL159W 0265416928466571
YIR006C 886321626617145
YJL005W 32126713688849
YJL016W 238517324759968
YJL051W 283078162776328
YJL148W 0129390018511791
YJL190C 231551734904835
YJL216C 752310536012055
YJL218W 0175600739297833
YJR045C 181916371834376
YJR061W 596954314750328
YJR066W 230050761405552
YKL014C 0434430958041895
YKL088W 0306204673567028
YKL173W 040890152098861
YKL180W 19170591930552
YKL195W 0394842869081812
YKL209C 81319796956819
YKR018C 0173638516204436
YKR054C 392236598928196
YKR057W 0308407642817507
YKR064W 0258780037223804
YKR096W 0177276389876017
YLL007C 364222401278672
YLL045C 245951318287733
YLL046C 220789685726298
YLL057C 459352801929727
YLR004C 308622078989969
YLR028C 413321763210272
YLR080W 0173638516204436
75
ORF Fold Change
YLR087C 645107160556459
YLR148W 431103948406353
YLR179C 125138632168835
YLR191W 0203045685201405
YLR276C 705175600764816
YLR376C 0286506469458886
YLR422W 0380221832832661
YLR450W 529578856112268
YML008C 0129390018511791
YML023C 844670050774818
YMR038C 0234289452235187
YMR068W 0378726832817958
YMR079W 0339999999966919
YMR096W 0323475046523754
YMR108W 0522342689654229
YMR133W 0249537892567939
YMR145C 306832708199654
YMR231W 0320883101002656
YMR295C 031423290183668
YMR309C 131146025881953
YMR313C 0217566478816452
YNL073W 41095890411034
YNL079C 0303703534315121
YNL121C 0175600739297833
YNL160W 84011090582411
YNL218W 0464296173029536
YNL221C 235702717777939
YNL233W 531000000022657
YNL241C 0304990757780443
YNL244C 422365988910108
YNL298W 0201450443110585
YNL313C 144269870612683
YNR031C 890355330013963
YOL056W 257856567271875
YOL059W 297340854177039
YOL060C 3528963333553
YOL081W 0438552809930963
YOL127W 046438538789387
YOR048C 443190975024723
YOR129C 311039484306185
YOR136W 0160000000126762
YOR172W 0145044319229564
YOR187W 0110905730058634
76
ORF Fold Change
YOR191W 102233502548427
YOR261C 0330000000092788
YOR290C 0181206660197459
YPL007C 277043478253533
YPL113C 707182320476699
YPL174C 0110497237621271
YPL231W 0444474029156303
YPL239W 499999999958532
YPL248C 0149960536676909
YPL255W 123475046219541
YPR004C 0323475046523754
YPR117W 122912449348497
YPR134W 055600322290172
YPR141C 597042513829489
YPR186C 290894439963127
77
Appendix 4 Significantly overunder-represented GO cross-talk pairs for Grr1
knock-out case study
TYPE GO term 1 GO term 2 GO ID1 GO ID2
F channel or pore class transporter
activity
ion transporter activity 15267 15075
F ATPase activity coupled to
movement of substances
ion transporter activity 43492 15075
F ion binding ion transporter activity 43167 15075
F hydrolase activity ion transporter activity 16787 15075
F transferase activity ion transporter activity 16740 15075
F alcohol transporter activity ion transporter activity 15665 15075
F peptide transporter activity ion transporter activity 15197 15075
F ion transporter activity ion transporter activity 15075 15075
C intracellular organelle ubiquitin ligase complex 43229 151
C intracellular ubiquitin ligase complex 5622 151
C membrane-bound organelle ubiquitin ligase complex 43227 151
F ATPase activity coupled to
movement of substances
peptide transporter activity 43492 15197
F ATPase activity coupled to
movement of substances
channel or pore class
transporter activity
43492 15267
F ATPase activity coupled to
movement of substances
alcohol transporter activity 43492 15665
F nucleobase nucleoside nucleotide
and nucleic acid transporter activity
nucleobase nucleoside
nucleotide and nucleic acid
transporter activity
15932 15932
F lyase activity nucleobase nucleoside
nucleotide and nucleic acid
transporter activity
16829 15932
C intracellular organelle membrane 43229 16020
C immature spore membrane 42763 16020
C pyruvate dehydrogenase complex membrane 45254 16020
C external encapsulating structure membrane 30312 16020
C non-membrane-bound organelle membrane 43228 16020
C membrane-bound organelle membrane 43227 16020
P cellular physiological process cell growth 50875 16049
C eukaryotic 48S initiation complex eukaryotic 43S preinitiation
complex
16283 16282
C eukaryotic 43S preinitiation
complex
eukaryotic 43S preinitiation
complex
16282 16282
C non-membrane-bound organelle eukaryotic 43S preinitiation
complex
43228 16282
C non-membrane-bound organelle eukaryotic 48S initiation
complex
43228 16283
C intracellular organelle hydrogen-translocating V-
type ATPase complex
43229 16471
F ion binding oxidoreductase activity 43167 16491
78
TYPE GO term 1 GO term 2 GO ID1 GO ID2
F transferase activity oxidoreductase activity 16740 16491
C RNA polymerase complex DNA-directed RNA
polymerase II holoenzyme
30880 16591
F ion binding nucleotide binding 43167 166
F receptor signaling protein activity nucleotide binding 5057 166
F carrier activity nucleotide binding 5386 166
F electron transporter activity nucleotide binding 5489 166
F protein binding nucleotide binding 5515 166
F ATPase activity coupled to
movement of substances
nucleotide binding 43492 166
F ion transporter activity nucleotide binding 15075 166
F transferase activity nucleotide binding 16740 166
F cyclase activity nucleotide binding 9975 166
F GTPase regulator activity transferase activity 30695 16740
F ligase activity transferase activity 16874 16740
F ion binding transferase activity 43167 16740
F lyase activity transferase activity 16829 16740
F hydrolase activity transferase activity 16787 16740
F ATPase activity coupled to
movement of substances
transferase activity 43492 16740
F ion binding hydrolase activity 43167 16787
F ATPase activity coupled to
movement of substances
hydrolase activity 43492 16787
F hydrolase activity hydrolase activity 16787 16787
F GTPase regulator activity lyase activity 30695 16829
F vitamin binding lyase activity 19842 16829
F ion binding ligase activity 43167 16874
C intracellular organelle exosome (RNase complex) 43229 178
C intracellular exosome (RNase complex) 5622 178
P regulation of physiological process sexual reproduction 50791 19953
P cellular physiological process sexual reproduction 50875 19953
P negative regulation of biological
process
sexual reproduction 48519 19953
P regulation of cellular process sexual reproduction 50794 19953
P reproductive physiological process sexual reproduction 50876 19953
P non-developmental growth sexual reproduction 48590 19953
P regulation of cellular process asexual reproduction 50794 19954
P localization asexual reproduction 51179 19954
P asexual reproduction asexual reproduction 19954 19954
P cell differentiation asexual reproduction 30154 19954
P reproductive physiological process asexual reproduction 50876 19954
P regulation of physiological process asexual reproduction 50791 19954
P cellular physiological process asexual reproduction 50875 19954
P non-developmental growth asexual reproduction 48590 19954
79
TYPE GO term 1 GO term 2 GO ID1 GO ID2
C membrane-bound organelle cell fraction 43227 267
C intracellular cell fraction 5622 267
C intracellular organelle cell fraction 43229 267
P reproductive physiological process cell differentiation 50876 30154
P cell differentiation cell differentiation 30154 30154
P filamentous growth cell differentiation 30447 30154
P non-developmental growth cell differentiation 48590 30154
P cellular physiological process cell differentiation 50875 30154
C intracellular organelle external encapsulating
structure
43229 30312
C membrane-bound organelle external encapsulating
structure
43227 30312
C non-membrane-bound organelle site of polarized growth 43228 30427
C intracellular organelle site of polarized growth 43229 30427
C site of polarized growth site of polarized growth 30427 30427
P reproductive physiological process filamentous growth 50876 30447
P non-developmental growth filamentous growth 48590 30447
C ribonucleoprotein complex ribonucleoprotein complex 30529 30529
C intracellular organelle ribonucleoprotein complex 43229 30529
C intracellular organelle Noc complex 43229 30689
F ion binding GTPase regulator activity 43167 30695
F ATPase activity coupled to
movement of substances
GTPase regulator activity 43492 30695
C non-membrane-bound organelle RNA polymerase complex 43228 30880
C intracellular organelle transcription export complex 43229 346
C intracellular transcription export complex 5622 346
C non-membrane-bound organelle transcription export complex 43228 346
C membrane-bound organelle transcription export complex 43227 346
F RNA polymerase II transcription
factor activity
nucleic acid binding 3702 3676
F nucleic acid binding nucleic acid binding 3676 3676
F cyclase activity nucleic acid binding 9975 3676
F protein binding nucleic acid binding 5515 3676
F hydrolase activity nucleic acid binding 16787 3676
F translation factor activity nucleic
acid binding
nucleic acid binding 8135 3676
F electron transporter activity nucleic acid binding 5489 3676
P cellular physiological process regulation of growth 50875 40008
P regulation of physiological process regulation of gene
expression epigenetic
50791 40029
P regulation of gene expression
epigenetic
regulation of gene
expression epigenetic
40029 40029
P negative regulation of biological
process
regulation of gene
expression epigenetic
48519 40029
P cellular physiological process regulation of gene 50875 40029
80
TYPE GO term 1 GO term 2 GO ID1 GO ID2
expression epigenetic
P regulation of cellular process regulation of gene
expression epigenetic
50794 40029
P regulation of cellular process homeostasis 50794 42592
P cellular physiological process homeostasis 50875 42592
P regulation of physiological process homeostasis 50791 42592
C intracellular organelle immature spore 43229 42763
C membrane-bound organelle immature spore 43227 42763
C non-membrane-bound organelle immature spore 43228 42763
C membrane-bound organelle cell projection 43227 42995
C intracellular organelle cell projection 43229 42995
F ion binding ion binding 43167 43167
F ATPase activity coupled to
movement of substances
ion binding 43492 43167
C pyruvate dehydrogenase complex membrane-bound organelle 45254 43227
C membrane-bound organelle membrane-bound organelle 43227 43227
C organelle lumen membrane-bound organelle 43233 43227
C non-membrane-bound organelle non-membrane-bound
organelle
43228 43228
C intracellular organelle non-membrane-bound
organelle
43229 43228
C organelle lumen intracellular organelle 43233 43229
C ubiquinol-cytochrome-c reductase
complex
intracellular organelle 45285 43229
C respiratory chain complex III intracellular organelle 45275 43229
C pyruvate dehydrogenase complex intracellular organelle 45254 43229
F ATPase activity coupled to
movement of substances
ATPase activity coupled to
movement of substances
43492 43492
F cyclase activity helicase activity 9975 4386
F ATPase activity coupled to
movement of substances
helicase activity 43492 4386
F ion transporter activity helicase activity 15075 4386
F transferase activity helicase activity 16740 4386
P cellular physiological process negative regulation of
biological process
50875 48519
P regulation of physiological process negative regulation of
biological process
50791 48519
P non-developmental growth negative regulation of
biological process
48590 48519
P regulation of cellular process negative regulation of
biological process
50794 48519
P regulation of enzyme activity negative regulation of
biological process
50790 48519
F receptor signaling protein activity enzyme inhibitor activity 5057 4857
P localization non-developmental growth 51179 48590
P regulation of physiological process non-developmental growth 50791 48590
81
TYPE GO term 1 GO term 2 GO ID1 GO ID2
P cellular physiological process non-developmental growth 50875 48590
P non-developmental growth non-developmental growth 48590 48590
P reproductive physiological process non-developmental growth 50876 48590
P regulation of cellular process non-developmental growth 50794 48590
F ion binding receptor activity 43167 4872
C ribonucleoprotein complex proteasome complex (sensu
Eukaryota)
30529 502
C intracellular organelle proteasome complex (sensu
Eukaryota)
43229 502
C proteasome regulatory particle
(sensu Eukaryota)
proteasome complex (sensu
Eukaryota)
5838 502
C intracellular proteasome complex (sensu
Eukaryota)
5622 502
C non-membrane-bound organelle proteasome complex (sensu
Eukaryota)
43228 502
F transferase activity receptor signaling protein
activity
16740 5057
F ion binding receptor signaling protein
activity
43167 5057
P cellular physiological process regulation of enzyme activity 50875 50790
P regulation of enzyme activity regulation of enzyme activity 50790 50790
P regulation of physiological process regulation of physiological
process
50791 50791
P localization regulation of physiological
process
51179 50791
P regulation of cellular process regulation of physiological
process
50794 50791
P regulation of cellular process regulation of cellular process 50794 50794
P localization regulation of cellular process 51179 50794
P reproductive physiological process cellular physiological process 50876 50875
P localization localization 51179 51179
F ATPase activity coupled to
movement of substances
lipid transporter activity 43492 5319
F hydrolase activity carrier activity 16787 5386
F transferase activity carrier activity 16740 5386
F ATPase activity coupled to
movement of substances
carrier activity 43492 5386
F ion transporter activity carrier activity 15075 5386
F alcohol transporter activity carrier activity 15665 5386
F channel or pore class transporter
activity
carrier activity 15267 5386
F ion transporter activity intracellular transporter
activity
15075 5478
F ATPase activity coupled to
movement of substances
intracellular transporter
activity
43492 5478
F transferase activity electron transporter activity 16740 5489
82
TYPE GO term 1 GO term 2 GO ID1 GO ID2
F ligase activity electron transporter activity 16874 5489
F ion binding electron transporter activity 43167 5489
F transferase activity protein binding 16740 5515
F cyclase activity protein binding 9975 5515
C proteasome regulatory particle
(sensu Eukaryota)
intracellular 5838 5622
C ribonucleoprotein complex intracellular 30529 5622
C ubiquinol-cytochrome-c reductase
complex
intracellular 45285 5622
C mRNA cleavage factor complex intracellular 5849 5622
C respiratory chain complex III intracellular 45275 5622
C histone methyltransferase complex intracellular 35097 5622
C mitochondrial inner membrane
presequence translocase complex
intracellular 5744 5622
C immature spore intracellular 42763 5622
C transcription factor complex intracellular 5667 5622
C pyruvate dehydrogenase complex intracellular 45254 5622
C cell projection intracellular 42995 5622
C Noc complex intracellular 30689 5622
C site of polarized growth intracellular 30427 5622
C bud intracellular 5933 5622
C eukaryotic 43S preinitiation
complex
intracellular 16282 5622
C external encapsulating structure intracellular 30312 5622
C hydrogen-translocating V-type
ATPase complex
intracellular 16471 5622
C microtubule associated complex intracellular 5875 5622
C unlocalized protein complex transcription factor complex 5941 5667
C intracellular organelle transcription factor complex 43229 5667
C immature spore transcription factor complex 42763 5667
C membrane-bound organelle transcription factor complex 43227 5667
C transcription factor complex transcription factor complex 5667 5667
C DNA-directed RNA polymerase II
holoenzyme
transcription factor complex 16591 5667
C membrane-bound organelle mitochondrial inner
membrane presequence
translocase complex
43227 5744
C intracellular organelle mitochondrial inner
membrane presequence
translocase complex
43229 5744
C membrane-bound organelle proteasome regulatory particle
(sensu Eukaryota)
43227 5838
C intracellular organelle proteasome regulatory particle
(sensu Eukaryota)
43229 5838
C intracellular organelle mRNA cleavage factor
complex
43229 5849
83
TYPE GO term 1 GO term 2 GO ID1 GO ID2
C membrane-bound organelle mRNA cleavage factor
complex
43227 5849
C intracellular organelle microtubule associated
complex
43229 5875
C site of polarized growth microtubule associated
complex
30427 5875
C membrane microtubule associated
complex
16020 5875
C membrane-bound organelle microtubule associated
complex
43227 5875
C bud microtubule associated
complex
5933 5875
C non-membrane-bound organelle microtubule associated
complex
43228 5875
C cell projection microtubule associated
complex
42995 5875
C site of polarized growth bud 30427 5933
C non-membrane-bound organelle bud 43228 5933
C bud bud 5933 5933
C intracellular organelle bud 43229 5933
P regulation of gene expression
epigenetic
response to stress 40029 6950
P asexual reproduction response to stress 19954 6950
P negative regulation of biological
process
response to stress 48519 6950
P response to abiotic stimulus response to stress 9628 6950
P non-developmental growth response to stress 48590 6950
P morphogenesis response to stress 9653 6950
P regulation of physiological process response to stress 50791 6950
P cell communication response to stress 7154 6950
P regulation of enzyme activity response to stress 50790 6950
P regulation of cellular process response to stress 50794 6950
P cellular physiological process response to stress 50875 6950
P response to endogenous stimulus response to stress 9719 6950
P negative regulation of biological
process
cell communication 48519 7154
P non-developmental growth cell communication 48590 7154
P positive regulation of biological
process
cell communication 48518 7154
P cell differentiation cell communication 30154 7154
P regulation of enzyme activity cell communication 50790 7154
P response to abiotic stimulus cell communication 9628 7154
P cellular physiological process cell communication 50875 7154
P regulation of cellular process cell communication 50794 7154
P cell communication cell communication 7154 7154
P sexual reproduction cell communication 19953 7154
84
TYPE GO term 1 GO term 2 GO ID1 GO ID2
P metabolism cell communication 8152 7154
P morphogenesis cell communication 9653 7154
P reproductive physiological process cell communication 50876 7154
P regulation of physiological process cell communication 50791 7154
P asexual reproduction cell communication 19954 7154
P aging cell communication 7568 7154
P death cell communication 16265 7154
P response to endogenous stimulus aging 9719 7568
P cellular physiological process locomotory behavior 50875 7626
F cyclase activity enzyme activator activity 9975 8047
F ligase activity translation factor activity
nucleic acid binding
16874 8135
F transferase activity translation factor activity
nucleic acid binding
16740 8135
P homeostasis metabolism 42592 8152
P asexual reproduction metabolism 19954 8152
P regulation of enzyme activity metabolism 50790 8152
P regulation of cellular process metabolism 50794 8152
P regulation of gene expression
epigenetic
metabolism 40029 8152
P regulation of physiological process metabolism 50791 8152
P response to abiotic stimulus metabolism 9628 8152
P morphogenesis metabolism 9653 8152
P negative regulation of biological
process
metabolism 48519 8152
P response to endogenous stimulus metabolism 9719 8152
P sexual reproduction metabolism 19953 8152
P reproductive physiological process metabolism 50876 8152
P non-developmental growth metabolism 48590 8152
F ion binding lipid binding 43167 8289
F ion transporter activity protein transporter activity 15075 8565
F ATPase activity coupled to
movement of substances
protein transporter activity 43492 8565
F transferase activity small protein conjugating
enzyme activity
16740 8639
P regulation of enzyme activity response to abiotic stimulus 50790 9628
P cellular physiological process response to abiotic stimulus 50875 9628
P sexual reproduction response to abiotic stimulus 19953 9628
P asexual reproduction response to abiotic stimulus 19954 9628
P response to abiotic stimulus response to abiotic stimulus 9628 9628
P reproductive physiological process response to abiotic stimulus 50876 9628
P negative regulation of biological
process
response to abiotic stimulus 48519 9628
P non-developmental growth response to abiotic stimulus 48590 9628
P cellular physiological process morphogenesis 50875 9653
85
TYPE GO term 1 GO term 2 GO ID1 GO ID2
P asexual reproduction morphogenesis 19954 9653
P non-developmental growth morphogenesis 48590 9653
P regulation of cellular process response to endogenous
stimulus
50794 9719
P regulation of physiological process response to endogenous
stimulus
50791 9719
P response to endogenous stimulus response to endogenous
stimulus
9719 9719
P death response to endogenous
stimulus
16265 9719
P asexual reproduction response to endogenous
stimulus
19954 9719
P regulation of gene expression
epigenetic
response to endogenous
stimulus
40029 9719
P negative regulation of biological
process
response to endogenous
stimulus
48519 9719
P non-developmental growth response to endogenous
stimulus
48590 9719
P cellular physiological process response to endogenous
stimulus
50875 9719
F GTPase regulator activity cyclase activity 30695 9975
F transferase activity cyclase activity 16740 9975
86
References
1 Smith JC and D Figeys Proteomics technology in systems biology Mol
Biosyst 2006 2(8) p 364-70
2 Chen J Yan Z Shen C Dawn F and Wang M A Systems Biology Case
Study of Ovarian Cancer Drug Resistance JBCB 2007
3 Pinto FR et al Local correlation of expression profiles with gene
annotations--proof of concept for a general conciliatory method
Bioinformatics 2005 21(7) p 1037-45
4 Simpson R Proteins and proteomics a laboratory manual 2003 New York
Cold Spring Harbor Laboratory Press 926
5 Lesney M Pathways to the proteome From 2DE to HPLC Modern Drug
Discovery 2001 4(10) p 32-34 36 39
6 Tyers M and M Mann From genomics to proteomics Nature 2003
422(6928) p 193-7
7 Khalsa-Moyers G and WH McDonald Developments in mass spectrometry
for the analysis of complex protein mixtures Brief Funct Genomic Proteomic
2006 5(2) p 98-111
8 Aebersold R and M Mann Mass spectrometry-based proteomics Nature
2003 422(6928) p 198-207
9 Herbert CG and RAW Johnstone Mass spectrometry basics 2003 Boca
Raton CRC Press 474 p
10 Guerrera IC and O Kleiner Application of mass spectrometry in proteomics
Biosci Rep 2005 25(1-2) p 71-93
11 Barker J DJ Ando and R Davis Mass spectrometry 2nd ed 1999 New
York John Wiley amp Sons xxii 509
12 Frohlich T and GJ Arnold Proteome research based on modern liquid
chromatography - tandem mass spectrometry separation identification and
quantification J Neural Transm 2006 113(8) p 973-94
13 Ma S and R Subramanian Detecting and characterizing reactive metabolites
by liquid chromatographytandem mass spectrometry J Mass Spectrom 2006
41(9) p 1121-39
14 Yates JR 3rd et al Method to correlate tandem mass spectra of modified
peptides to amino acid sequences in the protein database Anal Chem 1995
67(8) p 1426-36
15 Old WM et al Comparison of Label-free Methods for Quantifying Human
Proteins by Shotgun Proteomics Mol Cell Proteomics 2005 4(10) p 1487-
502
16 Keller A et al Empirical statistical model to estimate the accuracy of
peptide identifications made by MSMS and database search Anal Chem
2002 74(20) p 5383-92
17 Nesvizhskii AI et al A statistical model for identifying proteins by tandem
mass spectrometry Anal Chem 2003 75(17) p 4646-58
18 Cottrell JS Protein identification by peptide mass fingerprinting Pept Res
1994 7(3) p 115-24
87
19 Gras R and M Muller Computational aspects of protein identification by
mass spectrometry Curr Opin Mol Ther 2001 3(6) p 526-32
20 Yates JR 3rd Database searching using mass spectrometry data
Electrophoresis 1998 19(6) p 893-900
21 Yan Z et al Data Management in Expression-based Proteomics in
Database Modeling in Biology Theories and Practices To appear 2006
22 Garwood K et al PEDRo a database for storing searching and
disseminating experimental proteomics data BMC Genomics 2004 5(1) p
68
23 Taylor CF et al A systematic approach to modeling capturing and
disseminating proteomics experimental data Nat Biotechnol 2003 21(3) p
247-54
24 Garden P R Alm and J Hakkinen PROTEIOS an open source proteomics
initiative Bioinformatics 2005 21(9) p 2085-7
25 Ferry-Dumazet H et al PROTICdb a web-based application to store track
query and compare plant proteome data Proteomics 2005 5(8) p 2069-81
26 Wilke A et al Bioinformatics support for high-throughput proteomics J
Biotechnol 2003 106(2-3) p 147-56
27 Cannataro M G Cuda and P Veltri Modeling and designing a proteomics
application on PROTEUS Methods Inf Med 2005 44(2) p 221-6
28 Yanagisawa K et al Universal Proteomics tools for Protein Quantification
and Data Management -Xome amp Mass Navigator Genome Informatics 15th
INternational Conference on Genome Informatics 2004
29 Weston AD and L Hood Systems Biology Proteomics and the Future of
Health Care Toward Predictive Preventative and Personalized Medicine J
Proteome Res 2004 3(2) p 179-196
30 Gene_Ontology httpwwwgeneontologyorg
31 Lomax J Get ready to GO A biologists guide to the Gene Ontology Brief
Bioinform 2005 6(3) p 298-304
32 Beisvag V et al GeneTools - application for functional annotation and
statistical hypothesis testing BMC Bioinformatics 2006 7(1) p 470
33 Feng W et al Development of gene ontology tool for biological
interpretation of genomic and proteomic data AMIA Annu Symp Proc 2003
p 839
34 Lottaz C and R Spang Molecular decomposition of complex clinical
phenotypes using biologically structured analysis of microarray data
Bioinformatics 2005 21(9) p 1971-8
35 Khatri P and S Draghici Ontological analysis of gene expression data
current tools limitations and open problems Bioinformatics 2005 21(18) p
3587-95
36 Verducci JS et al Microarray analysis of gene expression considerations
in data mining and statistical treatment Physiol Genomics 2006 25(3) p
355-63
37 Draghici S Data Analysis Tools for DNA Microarrays Mathematical
Biology and Medicine Series 2003 Chapman amp HallCRC
88
38 Bonferroni C Teoria statistica delle classi e calcolo delle probabilit
Pubblicazioni del R Istituto Superiore di Scienze Economiche e Commerciali
di Firenze 1936(8) p 3-62
39 Benjamini Y and Y Hochberg Controlling the false discovery rate a
practical and powerful approach to multiple testing Journal of the Royal
Statistical Society Series B (Methodological) 1995 57(1) p 289-300
40 Cheverud JM A simple correction for multiple comparisons in interval
mapping genome scans Heredity 2001 87(Pt 1) p 52-8
41 Zhang B S Kirov and J Snoddy WebGestalt an integrated system for
exploring gene sets in various biological contexts Nucleic Acids Res 2005
33(Web Server issue) p W741-8
42 Castillo-Davis CI and DL Hartl GeneMerge--post-genomic analysis data
mining and hypothesis testing Bioinformatics 2003 19(7) p 891-2
43 Shah NH and NV Fedoroff CLENCH a program for calculating Cluster
ENriCHment using the Gene Ontology Bioinformatics 2004 20(7) p 1196-7
44 Zhong S et al GoSurfer a graphical interactive tool for comparative
analysis of large gene sets in Gene Ontology space Appl Bioinformatics 2004
3(4) p 261-4
45 Khatri P et al Onto-Tools an ensemble of web-accessible ontology-based
tools for the functional design and interpretation of high-throughput gene
expression experiments Nucleic Acids Res 2004 32(Web Server issue) p
W449-56
46 Martin D et al GOToolBox functional analysis of gene datasets based on
Gene Ontology Genome Biol 2004 5(12) p R101
47 Draghici S et al Onto-Tools the toolkit of the modern biologist Onto-
Express Onto-Compare Onto-Design and Onto-Translate Nucleic Acids Res
2003 31(13) p 3775-81
48 Ball CA et al Saccharomyces Genome Database provides tools to survey
gene expression and functional analysis data Nucleic Acids Res 2001 29(1)
p 80-1
49 Barabasi AL and ZN Oltvai Network biology understanding the cells
functional organization Nat Rev Genet 2004 5(2) p 101-13
50 Gavin AC et al Functional organization of the yeast proteome by
systematic analysis of protein complexes Nature 2002 415(6868) p 141-7
51 Ho Y et al Systematic identification of protein complexes in Saccharomyces
cerevisiae by mass spectrometry Nature 2002 415(6868) p 180-3
52 Ito T et al A comprehensive two-hybrid analysis to explore the yeast protein
interactome Proc Natl Acad Sci U S A 2001 98(8) p 4569-74
53 Uetz P et al A comprehensive analysis of protein-protein interactions in
Saccharomyces cerevisiae Nature 2000 403(6770) p 623-7
54 Giot L et al A protein interaction map of Drosophila melanogaster Science
2003 302(5651) p 1727-36
55 Li S et al A map of the interactome network of the metazoan C elegans
Science 2004 303(5657) p 540-3
56 Stelzl U et al A human protein-protein interaction network a resource for
annotating the proteome Cell 2005 122(6) p 957-68
89
57 Rual JF et al Towards a proteome-scale map of the human protein-protein
interaction network Nature 2005 437(7062) p 1173-8
58 Brown KR and I Jurisica Online predicted human interaction database
Bioinformatics 2005 21(9) p 2076-82
59 Benson M and R Breitling Network theory to understand microarray studies
of complex diseases Curr Mol Med 2006 6(6) p 695-701
60 Wachi S K Yoneda and R Wu Interactome-transcriptome analysis reveals
the high centrality of genes differentially expressed in lung cancer tissues
Bioinformatics 2005 21(23) p 4205-8
61 Sharan R et al Conserved patterns of protein interaction in multiple species
Proc Natl Acad Sci U S A 2005 102(6) p 1974-9
62 Christie KR et al Saccharomyces Genome Database (SGD) provides tools
to identify and analyze sequences from Saccharomyces cerevisiae and related
sequences from other organisms Nucleic Acids Res 2004 32(Database issue)
p D311-4
63 Issel-Tarver L et al Saccharomyces Genome Database Methods Enzymol
2002 350 p 329-46
64 Weng S et al Saccharomyces Genome Database (SGD) provides
biochemical and structural information for budding yeast proteins Nucleic
Acids Res 2003 31(1) p 216-8
65 Alfarano C et al The Biomolecular Interaction Network Database and
related tools 2005 update Nucleic Acids Res 2005 33(Database issue) p
D418-24
66 Bader GD D Betel and CW Hogue BIND the Biomolecular Interaction
Network Database Nucleic Acids Res 2003 31(1) p 248-50
67 Bader GD et al BIND--The Biomolecular Interaction Network Database
Nucleic Acids Res 2001 29(1) p 242-5
68 Calvano SE et al A network-based analysis of systemic inflammation in
humans Nature 2005 437(7061) p 1032-7
69 Said MR et al Global network analysis of phenotypic effects protein
networks and toxicity modulation in Saccharomyces cerevisiae Proc Natl
Acad Sci U S A 2004 101(52) p 18006-11
70 Seiden-Long IM et al Transcriptional targets of hepatocyte growth factor
signaling and Ki-ras oncogene activation in colorectal cancer Oncogene
2006 25(1) p 91-102
71 Motamed-Khorasani A et al Differentially androgen-modulated genes in
ovarian epithelial cells from BRCA mutation carriers and control patients
predict ovarian cancer survival and disease progression Oncogene 2006
72 Higgs RE et al Comprehensive label-free method for the relative
quantification of proteins from biological samples J Proteome Res 2005 4(4)
p 1442-50
73 Bolstad BM et al A comparison of normalization methods for high density
oligonucleotide array data based on variance and bias Bioinformatics 2003
19(2) p 185-93
74 Kersey PJ et al The International Protein Index an integrated database for
proteomics experiments Proteomics 2004 4(7) p 1985-8
90
75 Apweiler R A Bairoch and CH Wu Protein sequence databases Curr
Opin Chem Biol 2004 8(1) p 76-80
76 Efron B Large-scale simultaneous hypothesis testing the choice of a null
hypothesis JASA 2004 99 p 96-104
77 Chen J M Wang and C Shen An integrated computational proteomics
method to extract protein targets for Fanconi Anemia studies Proceedings of
the 21st Annual ACM Symposium on Applied Computing Dijion France In
press 2006
78 von Mering C et al STRING known and predicted protein-protein
associations integrated and transferred across organisms Nucleic Acids Res
2005 33(Database issue) p D433-7
79 Sivachenko A J Chen and C Martin ProteoLens A Visual Data Mining
Platform for Exploring Biological Networks BMC Bioinformatics 2006
80 Benjamini Y and D Yekutieli The control of the false discovery rate in
multiple testing under dependency Ann Statist 2001 29(4) p 1165ndash1188
81 Chen J C Shen and A Sivachenko An Integrated Computational
Proteomics Method to Extract Protein Targets for Fanconi Anemia Studies
Pacific Symposium on Biocomputing 2006 11 p 367-78
82 Olivero OA et al Preferential binding of cisplatin to mitochondrial DNA of
Chinese hamster ovary cells Mutat Res 1995 346(4) p 221-30
83 Chen J and J Carlis Genomic data modeling Information Systems 2003
28(4) p 287-310
84 Kishi T T Seno and F Yamao Grr1 functions in the ubiquitin pathway in
Saccharomyces cerevisiae through association with Skp1 Mol Gen Genet
1998 257(2) p 143-8
85 Skowyra D et al F-box proteins are receptors that recruit phosphorylated
substrates to the SCF ubiquitin-ligase complex Cell 1997 91(2) p 209-19
86 Spielewoy N et al Regulation and recognition of SCFGrr1 targets in the
glucose and amino acid signaling pathways Mol Cell Biol 2004 24(20) p
8994-9005
87 Willems AR et al SCF ubiquitin protein ligases and phosphorylation-
dependent proteolysis Philos Trans R Soc Lond B Biol Sci 1999 354(1389)
p 1533-50
88 Flick JS and M Johnston GRR1 of Saccharomyces cerevisiae is required for
glucose repression and encodes a protein with leucine-rich repeats Mol Cell
Biol 1991 11(10) p 5101-12
89 Blacketer MJ P Madaule and AM Myers Mutational analysis of
morphologic differentiation in Saccharomyces cerevisiae Genetics 1995
140(4) p 1259-75
90 Loeb JD et al Saccharomyces cerevisiae G1 cyclins are differentially
involved in invasive and pseudohyphal growth independent of the filamentation
mitogen-activated protein kinase pathway Genetics 1999 153(4) p 1535-46
91 Kishi T and F Yamao An essential function of Grr1 for the degradation of
Cln2 is to act as a binding core that links Cln2 to Skp1 J Cell Sci 1998 111
( Pt 24) p 3655-61
91
92 Jaquenoud M et al The Cdc42p effector Gic2p is targeted for ubiquitin-
dependent degradation by the SCFGrr1 complex Embo J 1998 17(18) p
5360-73
93 Barral Y S Jentsch and C Mann G1 cyclin turnover and nutrient uptake
are controlled by a common pathway in yeast Genes Dev 1995 9(4) p 399-
409
94 Kahana JA et al The yeast dynactin complex is involved in partitioning the
mitotic spindle between mother and daughter cells during anaphase B Mol
Biol Cell 1998 9(7) p 1741-56
95 Eckert-Boulet N B Regenberg and J Nielsen Grr1p is required for
transcriptional induction of amino acid permease genes and proper
transcriptional regulation of genes in carbon metabolism of Saccharomyces
cerevisiae Curr Genet 2005 47(3) p 139-49
96 Westergaard SL et al Elucidation of the role of Grr1p in glucose sensing by
Saccharomyces cerevisiae through genome-wide transcription analysis FEMS
Yeast Res 2004 5(3) p 193-204
92
Zhong Yan
E-Mail ohzhongyahoocom
Education
(1) SAS trainings (Session I SAS programming essentials Session II SAS data
manipulation) in SAS School Indianapolis
(2) MS in Bioinformatics Indiana University School of Informatics (GPA 3940)
(3) National Center for Biotech Information Regional Workshop
(4) Microarray data analysis workshop (in Chicago)
(5) MS in Cellular Biology from Academy of Military Medical Sciences Beijing
China
(6) BS in Physiology from Nanjing University Jiangsu Province China
Professional Experience
Apr 2006 ~ current Business Information Analyst HSBC
(1) Database administrator for Access databases database management automation
processes
(2) Application developer using VBA and VBScript
(3) Data auditor
(4) Reports generator using VBA SAS HTML and software tools
Sep 2005 ~ April 2006 Research assistant Discovery Informatics and
Computing Group at Indiana University School of Informatics
(1) Oracle databases development
(2) Proteomics data analysis and systems biology analysis in SQL et al
(3) Programming in Perl and PHP
Dec 2004 ~ Aug 2005 Research technician Pediatrics Hematology
Oncology Indiana University School of Medicine
(1) Database designer and administrator for Access database
(2) Clinical data analysis in SQL
(3) Microarray data analysis
(4) Programming in VBA Java C++ and Matlab
March 2000 ~ June 2001 Research technician Urology Department
Indiana University School of Medicine Research area Adenovirus gene
therapy for prostate cancer Cell culturing virus amplification and purification
plasmid and cosmid construction numerous assays
93
August 1994 ~ August 1999 Assistant Professor Institute of Pharmacology
and Toxicology Academy of Military Medical Sciences Beijing China
Supervise two technicians Research area Preclinical trial
psychopharmacological research new drug screening and evaluation Awarded
twice by the Institute for excellent work
August 1988 ~ August 1991 Assistant lecturer Traditional Chinese
Medicine College Jiangxi Province China
Computer Science Skills Familiar with object-oriented programming concept and programming languages
C C++ Java SAS Perl PHP JavaScript Matlab HTML XML UnixLinux
Excel programming JCL
Familiar with database design Oracle Access MySQL database management
systems SQL language
Familiar with many tools
Database related tools ErWin Toad for Oracle Aqua Data Studio Crystal
Reports Case Studio MYSQL-Front
Application development tools Eclipse XML Spy Komodo
Multimedia related tools Dreamweaver Flash Fireworks Illustrator
Adobe Photoshop Adobe Primere Pro (video editing tool) Adobe Encore
(DVD editing tool) SoundForge (sound editing tool) n-Track studio (sound
mixing tool) Logo design studio
Other tools Office (Excel Access PowerPoint Publisher) Lotus Notes
EndNotes SSH
Microarray data analysis (cDNA array and Affymetrix array) and gene
annotations
Knowledge for major biological databases such as NCBI OWL Swiss-Prot PIR
IPI SGD GeneOntology
Data mining techniques such as classification and clustering analysis association
rule extraction
Familiar with many bioinformatics tools
Hands-on Experience in Biological Research Primary neural cell culturing Cell line culturing (293 cells LnCap C4-2 cells
PC3 cells et al) Cell activity assay by MTT assay and Crystal violet assay X-Gal
staining Adenovirus amplification and purification Plaque assay for the virus
Protein concentration measurementWestern blot and Northern blot Making
competent bacteria and transformation Plasmid and Cosmid construction transfection
PCR and real-time PCR Plasmid DNA MiniPrep MidiPrep MaxiPrepDNA
extraction from tissue DNA recovery from gelRadio-labeled ligand receptor binding
assay saturation inhibition and kinetic assay Second messenger measurement RNA
microinjection of Xenopus Oocytes Animal models of depression (rat or mouse
forced swimming test tail suspension test olfactory bulbectomy for rats et al)
Projects
Lookup database management automation (In VBScript)
94
Reports automation processes (in VBA script and VBScript)
Pediatric leukemia database design implementation and management (in Access)
Customized designing an oracle database to store several high-throughput
experimental datasets
Designing and implementing an oracle database to integrate the data downloaded
from several public databases (Oracle)
Lab Ordering Database Design implementation and management
Forest Experiment Project Database Design and implementation (in MS Access)
Student course registration system (in both C and C++) Grocery Distributor
System (in C++) Building an AVL tree to generate a word histogram (in C++)
Graph for course schedules and shortest time schedule finding (in C++) Thread
and Synchronization in Nachos Operating System (in C++) Scheduling in
Nachos Operating System (in C++) Memory management in Nachos Operating
System (in C++)
Decision Tree and Neural Network Classification analysis to distinguish 9
different speakers based on 12 Japanese vowel pronunciations (Matlab neural
network toolbox and C45)
Clustering analysis of microarray data (Matlab)
Game character Name game Calculator (Java projects)
Moving fairy (in JavaScript)
Fun web site (in Flash)
Publications 1) Jake Chen Zhong Yan Changyu Shen et al A Systems Biology Case Study of Ovarian
Cancer Drug Resistance (Accepted for 2007 publication) 2) Zhong Yan Jake Chen et al Data Management in Expression-based Proteomics In
Database Modeling in Biology Practices and Challenges (to be published by Springer in 2006)
3) Susanne Ragg Marc Rosenman Eve Doucette Zhong Yan Julie Haydon Jada Paine
Nadine Lee Terry Vik Ketan Mane Katy Borner
Data visualization of Multiparameter Information in Acute Lymphoblastic Leukemia Expands the
Ability to Explore Prognostic Factors (Abstract 554689) 47th
ASH Annual Meeting Aug 2005
4)Zhong Yan Xiaozhuang Hong et al The effect of a new anticholinergic drug 3H]tricyclopinate
on human fetal cerebral cortex muscarinic receptors Bull Acad Mil Med Sci 1999 23(1) 35 ~
7 (Chinese)
5)Zhong Yan Yuhua Chen et al Effect of MO on animal models of depression China journal of
Chinese meteria medica 1999 suppl 81 ~ 2 (Chinese)
6)Zhong Yan Zhenghua Gong et al Effects of aqueous extracts of detoxified cotton seeds
(AEDCS) on the level of mouse spleen lymphocytes cyclic AMP Bull Acad Mil Med Sci
1999 23(2)136 (Chinese)
7)Zhong Yan Zhipu Luo et al The effect of equilinol on rat cerebral cortex GABAA receptors
Bull Acad Mil Med Sci 1998 22(3) 217 (Chinese)
8)Zhong Yan Xiaozhuang Hong et al The effect of a new cholinolytic-[3H]Tricyclopinate on
human brain muscarinic receptors Acta Pharmaceutica Sinica 1997 32(7) 506~10 (Chinese)
9)Zhong Yan Zhipu Luo Experimental methods of antidepressants In Modern experimental
methods in pharmacology ( I II ) Chief editor Juntian Zhang Beijing Medical University and
Peking Union Medical College associated press 1997 1061 ~ 71 ( Chinese)
10)Zhong Yan Zhenghua Gong et al Effect of oligosaccharide extracted from Morinda officinalis
How on corticosterone endangered primary cultured hippocampal neurons Bull Acad Mil Med
Sci (accepted before I came to USA)
11)Zhong Yan Zhenghua Gong et al A new potential anxiolytic its effects on mitochondrial
DBI receptors and on rat elevated plus maze model (waiting for patent application before I came
to USA))