Modals CERTAINITY in PRESENT FUTURE CERTAINITY in PRESENT FUTURE.

Ontario’s Present and Future
Sources, Volumes and
Distribution of Agricultural
Biomass
Ian McDonald
Field Crops Unit
Agriculture Development Branch
OMAFRA

What is the Ontario Arable Landscape?
Canada Land Inventory
Capability Classes for Agriculture
Class 1 & 2 Lands
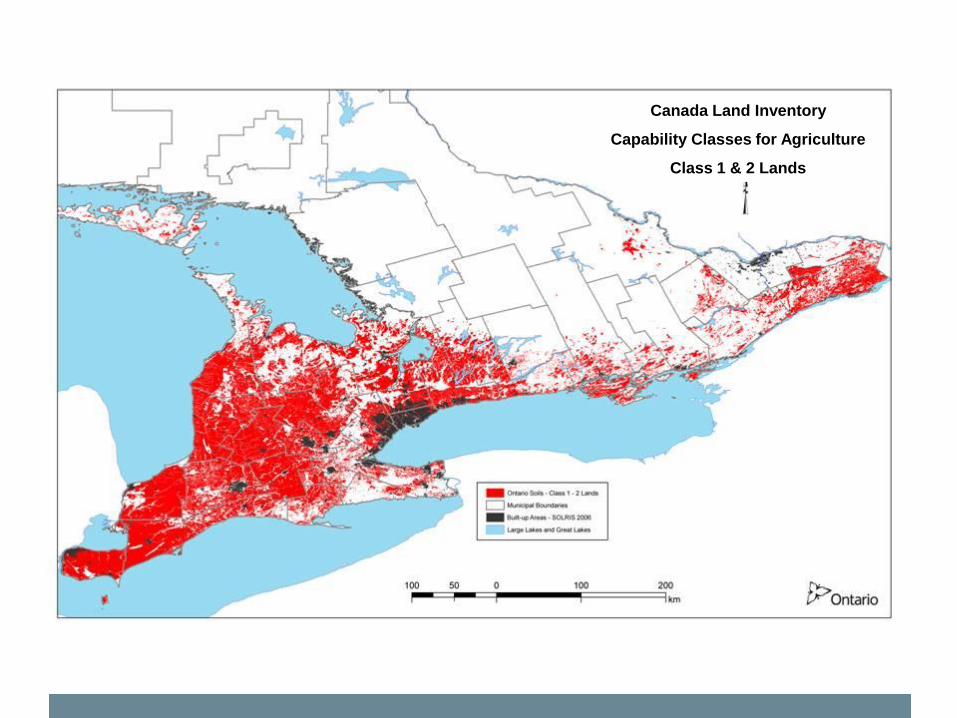
Canada Land Inventory
Capability Classes for Agriculture
Class 1 & 2 Lands

Canada Land Inventory
Capability Classes for Agriculture
Class 3 Lands

Canada Land Inventory
Capability Classes for Agriculture
Class 3 Lands

Canada Land Inventory
Capability Classes for Agriculture
Class 4 Lands

Canada Land Inventory
Capability Classes for Agriculture
Class 4 Lands

Canada Land Inventory
Capability Classes for Agriculture
Class 5 & 6 Lands

Canada Land Inventory
Capability Classes for Agriculture
Class 5 & 6 Lands
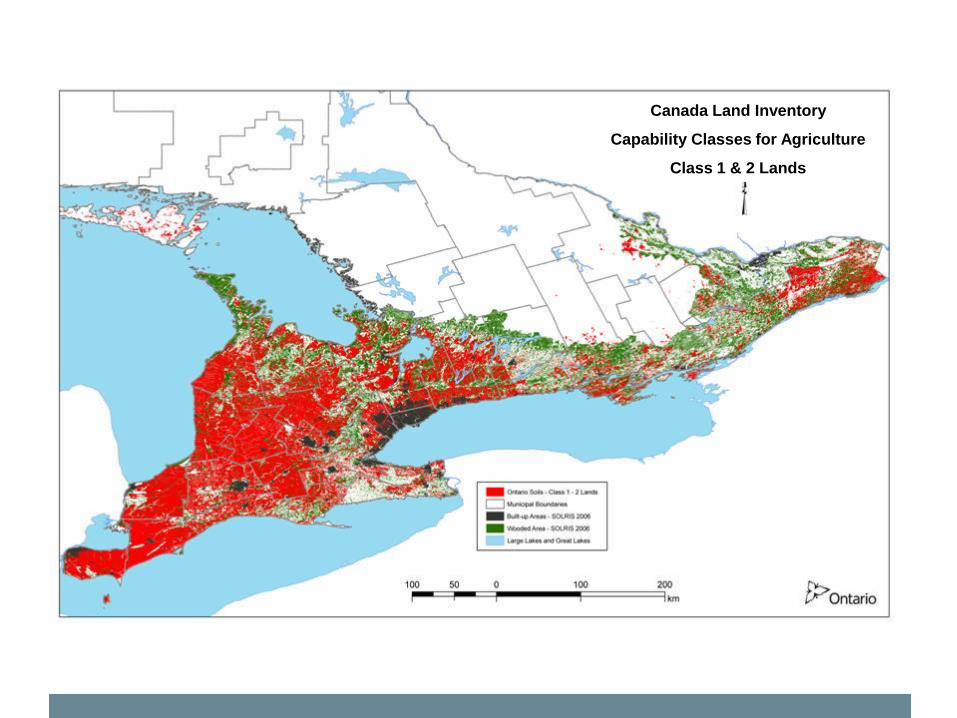
Canada Land Inventory
Capability Classes for Agriculture
Class 7 Lands

Canada Land Inventory
Capability Classes for Agriculture
Class 7 Lands

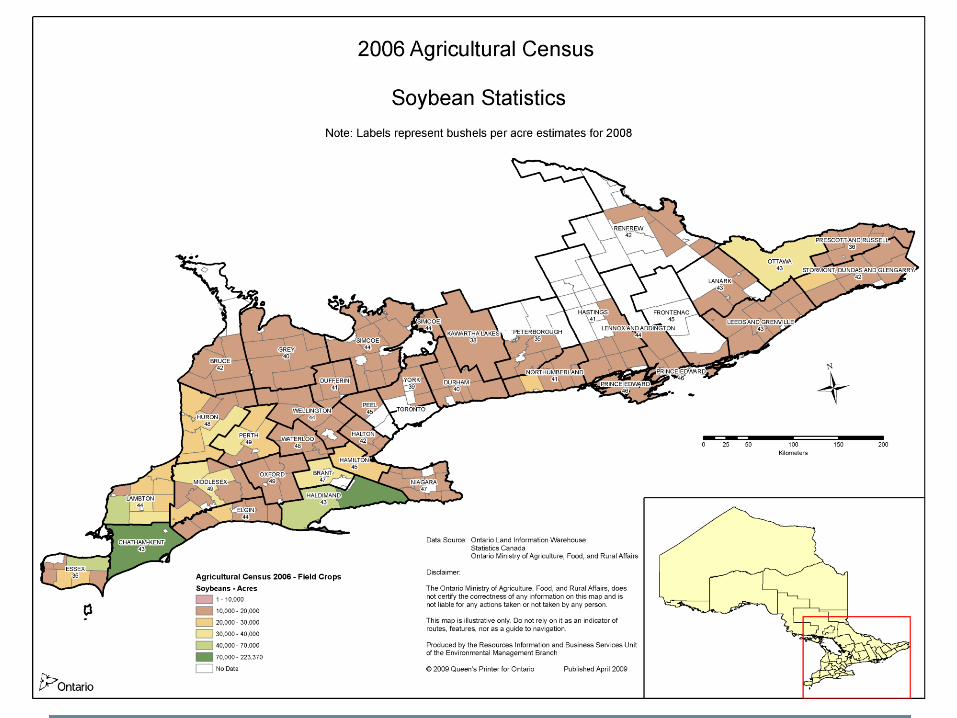
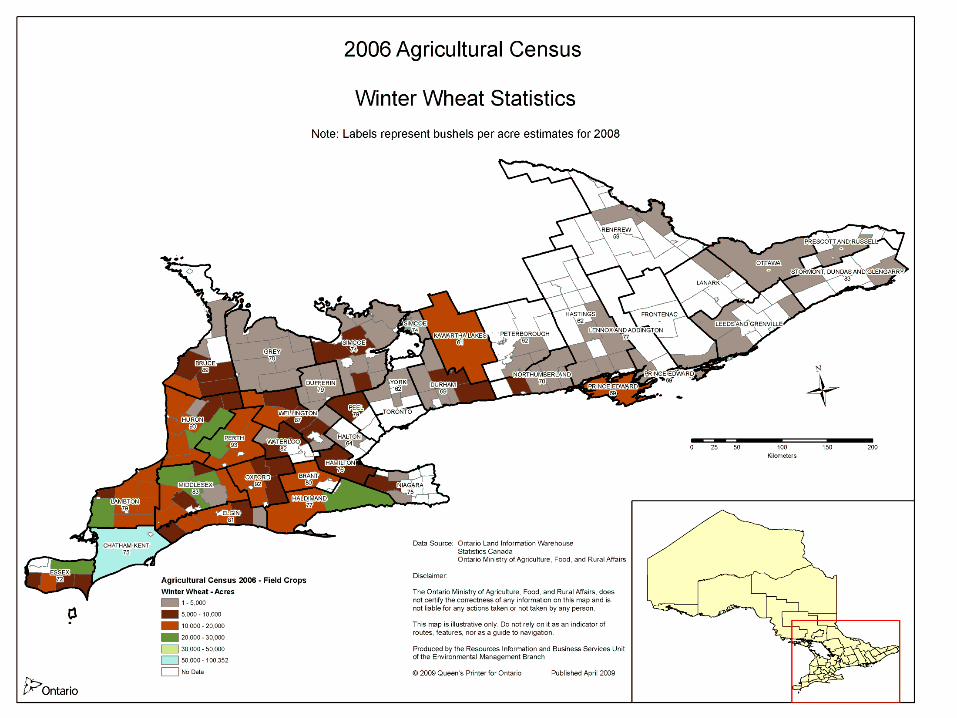
What is the Present Use of the Ontario Arable
Landscape?

Major Acreage Crops


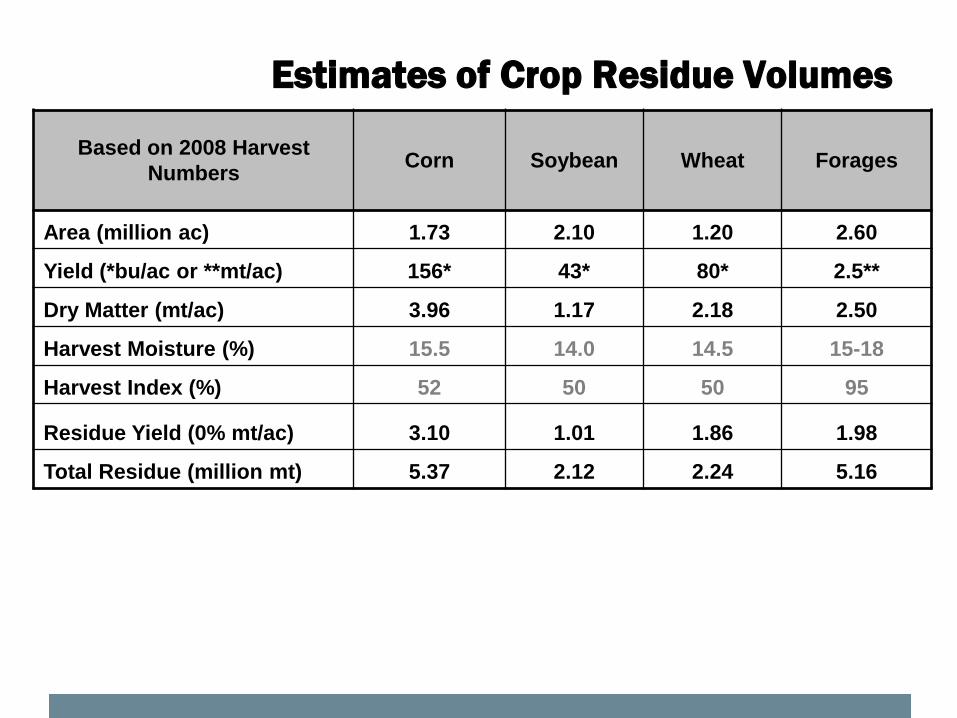
Estimates of Crop Residue Volumes
Based on 2008 Harvest
Numbers Corn Soybean Wheat Forages
Area (million ac) 1.73 2.10 1.20 2.60
Yield (*bu/ac or **mt/ac) 156* 43* 80* 2.5**
Dry Matter (mt/ac) 3.96 1.17 2.18 2.50
Harvest Moisture (%) 15.5 14.0 14.5 15-18
Harvest Index (%) 52 50 50 95
Residue Yield (0% mt/ac) 3.10 1.01 1.86 1.98
Total Residue (million mt) 5.37 2.12 2.24 5.16
5.37+2.12+2.24= 9.73 mmt + 5.16 = 14.9 mmt

Estimates of Total Energy Value in the Landscape
Based on 2008 Harvest
Numbers Corn Soybean Wheat Forages
Total Residue (million mt) 5.37 2.12 2.24 5.16
btu / lb 8100 7520 7200 7950
Total Energy Volume (btu) 9.5 x10¹³ 3.520 x10¹³ 3.56 x10¹³ 9.04 x10¹³
Total Energy Volume (GJ) 101,171,819 37,098,706 37,512,911 95,343,441

Based on 2008 Harvest
Numbers Corn Soybean Wheat Forages
Residue Yield (0% mt/ac) 3.10 1.01 1.86 1.98
Total Residue (million mt) 5.37 2.12 2.24 5.16
Practically Available (%) 50 40 66 5-10
Sustainably Available (mt) ? ? ? ?
Estimates of Accessible Residue Volumes

Estimates of Accessible Residue Volumes
Based on 2008 Harvest
Numbers Corn Soybean Wheat Forages
Residue Yield (0% mt/ac) 3.10 1.01 1.86 1.98
Total Residue (million mt) 5.37 2.12 2.24 5.16
Practically Available (%) 50 40 66 5-10
Sustainably Available (mt) ? ? ? ?
Estimates of
residue
volumes that
can be
practically
removed
How much can be sustainably
removed from the landscape?

Volumes Available Implications
Sustainably Available
• Soil Organic Matter Levels
• Soil Erosion Protection
• Cost and Depletion of Nutrients
• Long term productivity
Practically Available
• Cost And Logistics of Harvest / Storage /
Transport / Processing
• Competing Uses Of Crop Residues / Biomass

Other Crop Options For Biomass

Energy Value of Non Traditional Crops
Substrate Yield (t/ac) Type Biology
Corn stover (omafra) 2.5 - 3.5 R Ann
Soybean Straw (omafra) 0.7 – 1.3 R Ann
Wheat Straw (omafra) 1.7 – 2.2 R Ann
Hay (omafra) 1.8 – 2.5 WP Per
Sweet Sorghum (aerc) 5.5 – 6.0 WP Ann
Pearl Millet (aerc) 3 - 6 WP Ann
Hemp (ont hemp alliance) 1 - 5 WP Bie
Switch Grass (reap) 3 - 5 WP Per
Miscanthus (univ illinois) 9 - 12 WP Per
Prairie Cordgrass (scijou) 2.0 – 3.2 WP Per
Big Bluestem (ny) 2.5 WP Per
Willow (biomass energy) 2.8 – 8.0 WP WoodPer
Hybrid Poplar (biomass energy) 4.0 – 10.0 WP WoodPer
aerc = agriculture environmental renewal canada

Energy Value of Non Traditional Crops
Substrate Yield (t/ac)
jeruselum artichoke 9 – 16
giant knotweed 15
nettle 6 – 10
Rhubarb 2 - 4
US DOD numbers
Non Traditional Crops / Weeds

Food Processing Residues

Food Processing Residues
Location Type Volume
(t)
Essex/Kent Veggie and Fish 400,000
London Veggie 50,000
Niagara Region Grape Pumice 50,000
Windsor, Chatham, Sarnia,
London, Port Colborne,
Collingwood, Thunder Bay,
Aylmer
Wet Corn Milling DDG’s 600,000
GTA, Hanover, Cambridge, Port
Colborne
Wheat Bran /Shorts 400,000
GTA, KW Meat Residues 400,000
GTA Veggie from retail and
wholesale
400,000
Various Direct Air Flotation Residues 20,000
TOTAL 2.3 million
tonnes


The End!
Ian D. McDonald
Applied Research Coordinator, Field Crops Unit
OMAFRA Ag Development Branch
Rm 407 Crop Science Building
University of Guelph
Guelph, On., N1G 2W1
519.824.4120 ext. 56707