ONONDAGA LAKE PRE-DESIGN INVESTIGATION: …€¦ · ONONDAGA LAKE PRE-DESIGN INVESTIGATION: PHASE...
22
PARSONS ONONDAGA LAKE PRE-DESIGN INVESTIGATION: PHASE III WORK PLAN - ADDENDUM 6 SMU 8 SAMPLING TO MONITOR NATURAL RECOVERY Syracuse, New York Prepared For: 5000 Brittonfield Parkway East Syracuse, NY 13057 Prepared By: Parsons 290 Elwood Davis Road, Suite 312 Liverpool, New York 13088 and 1086 Morningside Ave Schenectady, NY 12309 and ANCHOR ENVIRONMENTAL, LLC OCTOBER 2007 REVISED JANUARY 2008
Transcript of ONONDAGA LAKE PRE-DESIGN INVESTIGATION: …€¦ · ONONDAGA LAKE PRE-DESIGN INVESTIGATION: PHASE...
PARSONS
ONONDAGA LAKE PRE-DESIGN INVESTIGATION:
PHASE III WORK PLAN - ADDENDUM 6
SMU 8 SAMPLING TO MONITOR NATURAL RECOVERY Syracuse, New York
Prepared For:
5000 Brittonfield Parkway East Syracuse, NY 13057
Prepared By:
Parsons
290 Elwood Davis Road, Suite 312 Liverpool, New York 13088
and
1086 Morningside Ave Schenectady, NY 12309
and
ANCHOR ENVIRONMENTAL, LLC
OCTOBER 2007
REVISED JANUARY 2008
PHASE III PDI WORK PLANADDENDUM 6
REVISED
P:\Honeywell -SYR\443583 - SMU 8\09 Reports\Phase III PDI MNR Addendum\Phase III Add 6 MNR 01-08.doc Parsons
January 16, 2008
i
TABLE OF CONTENTS
Page
1.0 INTRODUCTION .................................................................................................1
2.0 MNR STRATEGY APPROACH..........................................................................1
3.0 2007 MNR FIELD TASKS ...................................................................................1 3.1 Mobilization-Demobilization .........................................................................1 3.2 2007 MNR Surface Sediment Sampling ........................................................1
4.0 HEALTH AND SAFETY......................................................................................7
5.0 QUALITY ASSURANCE.....................................................................................7
6.0 SAMPLE AND DATA MANAGEMENT AND REPORTING...........................1
7.0 REFERENCES ......................................................................................................1
LIST OF TABLES
Table 1 Summary of MNR Monitoring and Contingency Approach for Onondaga Lake SMU 8
Table 2 Use of Monitoring and Other Information in MNR Model Refinement and Updates
Table 3 SMU 8 2007 Sediment Sampling and Analysis Summary
LIST OF FIGURES
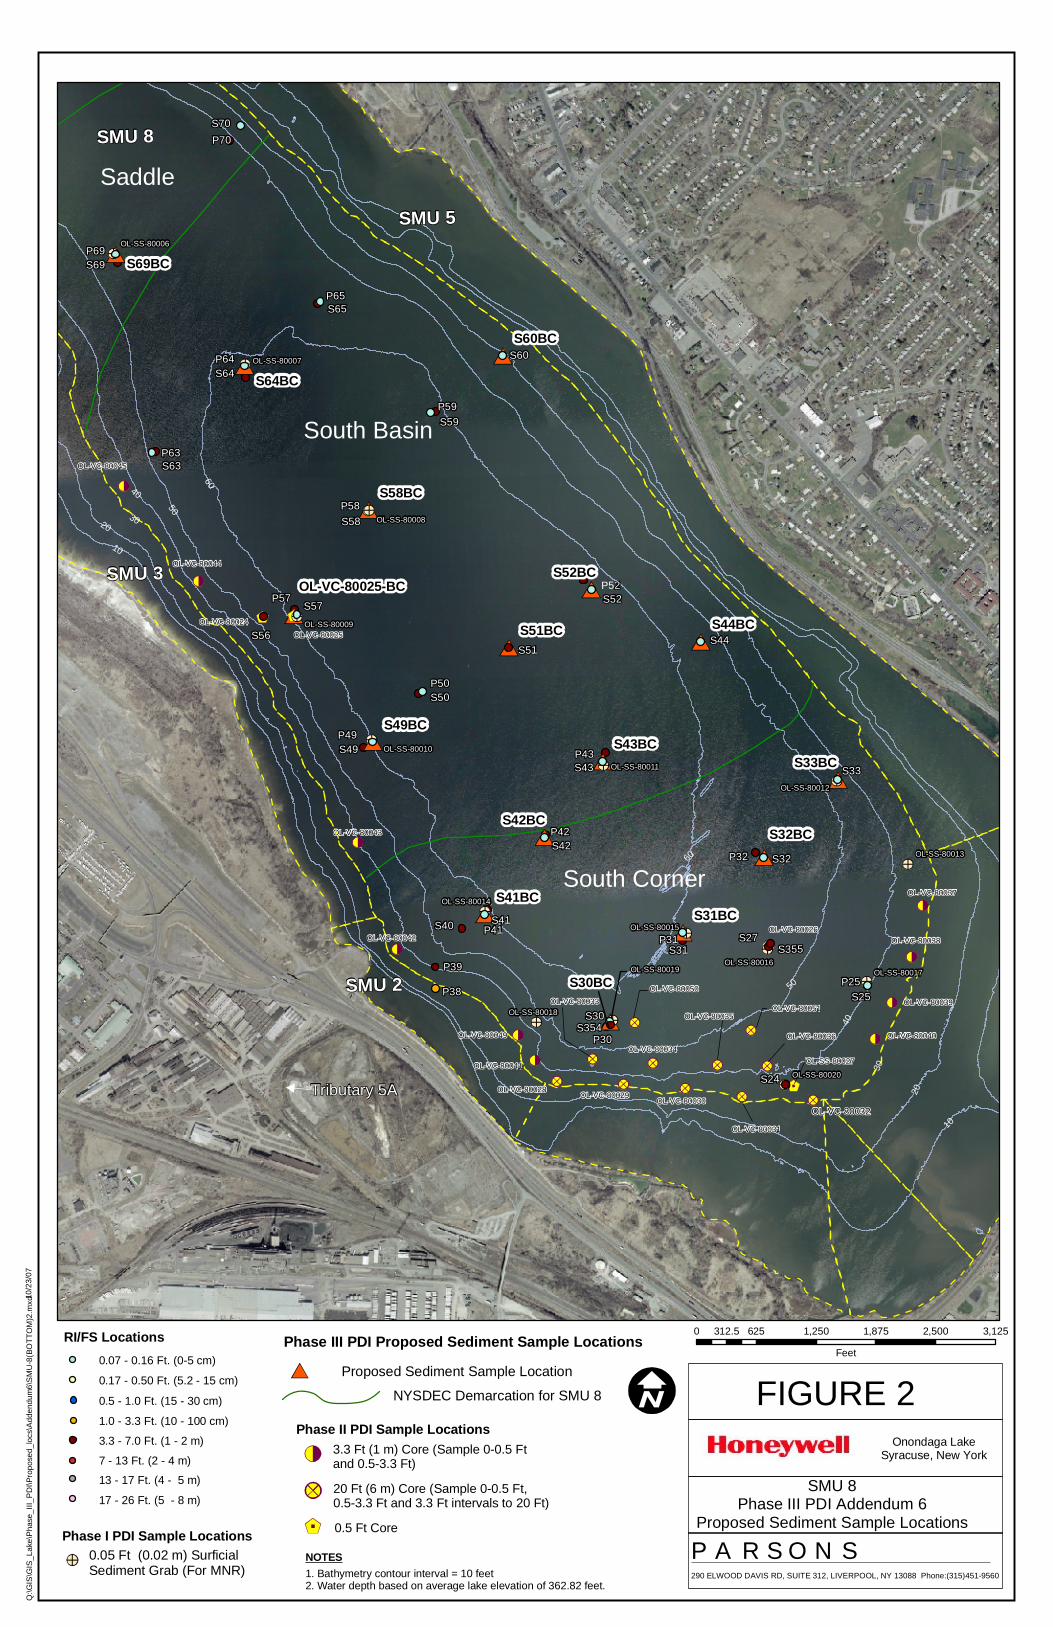
Figure 1 Proposed 2007 Sediment Sample Locations; Southern Half of SMU 8
Figure 2 Proposed 2007 Sediment Sample Locations; Northern Half of SMU 8
LIST OF APPENDICES
APPENDIX A SMU 8 SHALLOW SEDIMENT SAMPLING PROCEDURES
PHASE III PDI WORK PLANADDENDUM 6
REVISED
P:\Honeywell -SYR\443583 - SMU 8\09 Reports\Phase III PDI MNR Addendum\Phase III Add 6 MNR 01-08.doc Parsons
January 16, 2008
1
PHASE III PDI WORK PLAN ADDENDUM 6 – SMU 8 SAMPLING TO MONITOR NATURAL
RECOVERY
1.0 INTRODUCTION
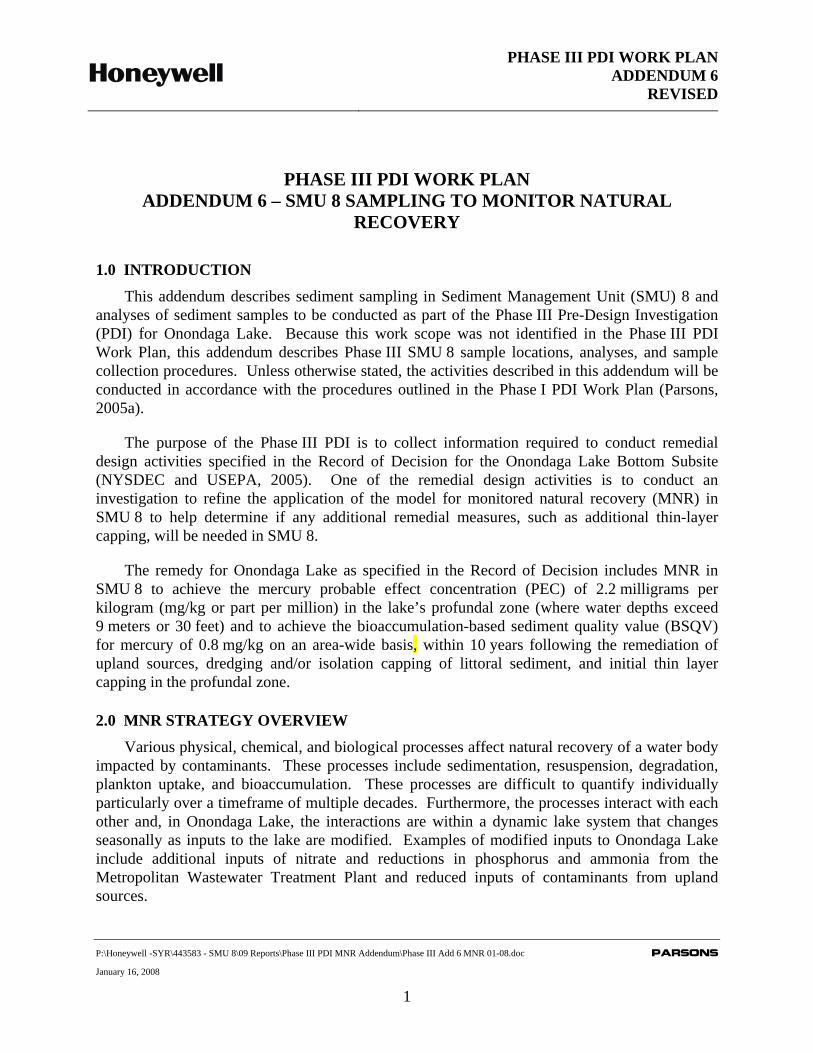
This addendum describes sediment sampling in Sediment Management Unit (SMU) 8 and analyses of sediment samples to be conducted as part of the Phase III Pre-Design Investigation (PDI) for Onondaga Lake. Because this work scope was not identified in the Phase III PDI Work Plan, this addendum describes Phase III SMU 8 sample locations, analyses, and sample collection procedures. Unless otherwise stated, the activities described in this addendum will be conducted in accordance with the procedures outlined in the Phase I PDI Work Plan (Parsons, 2005a).
The purpose of the Phase III PDI is to collect information required to conduct remedial design activities specified in the Record of Decision for the Onondaga Lake Bottom Subsite (NYSDEC and USEPA, 2005). One of the remedial design activities is to conduct an investigation to refine the application of the model for monitored natural recovery (MNR) in SMU 8 to help determine if any additional remedial measures, such as additional thin-layer capping, will be needed in SMU 8.
The remedy for Onondaga Lake as specified in the Record of Decision includes MNR in SMU 8 to achieve the mercury probable effect concentration (PEC) of 2.2 milligrams per kilogram (mg/kg or part per million) in the lake’s profundal zone (where water depths exceed 9 meters or 30 feet) and to achieve the bioaccumulation-based sediment quality value (BSQV) for mercury of 0.8 mg/kg on an area-wide basis, within 10 years following the remediation of upland sources, dredging and/or isolation capping of littoral sediment, and initial thin layer capping in the profundal zone.
2.0 MNR STRATEGY OVERVIEW
Various physical, chemical, and biological processes affect natural recovery of a water body impacted by contaminants. These processes include sedimentation, resuspension, degradation, plankton uptake, and bioaccumulation. These processes are difficult to quantify individually particularly over a timeframe of multiple decades. Furthermore, the processes interact with each other and, in Onondaga Lake, the interactions are within a dynamic lake system that changes seasonally as inputs to the lake are modified. Examples of modified inputs to Onondaga Lake include additional inputs of nitrate and reductions in phosphorus and ammonia from the Metropolitan Wastewater Treatment Plant and reduced inputs of contaminants from upland sources.
PHASE III PDI WORK PLANADDENDUM 6
REVISED
P:\Honeywell -SYR\443583 - SMU 8\09 Reports\Phase III PDI MNR Addendum\Phase III Add 6 MNR 01-08.doc Parsons
January 16, 2008
2
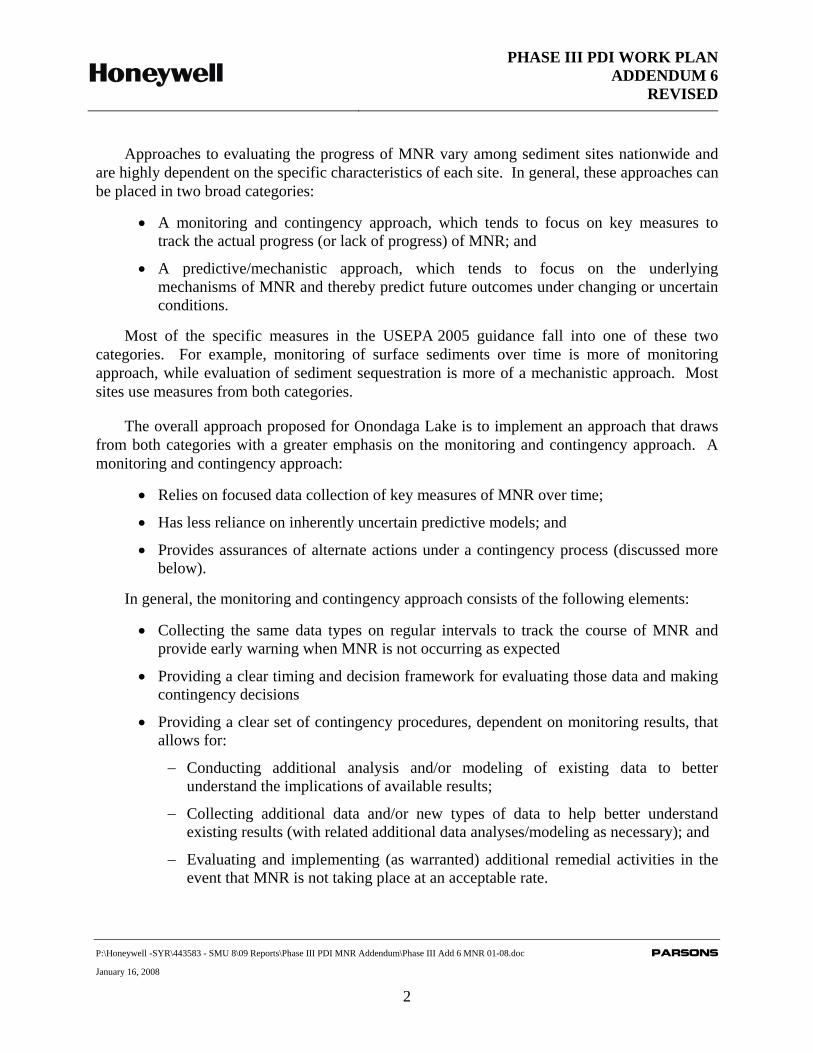
Approaches to evaluating the progress of MNR vary among sediment sites nationwide and are highly dependent on the specific characteristics of each site. In general, these approaches can be placed in two broad categories:
• A monitoring and contingency approach, which tends to focus on key measures to track the actual progress (or lack of progress) of MNR; and
• A predictive/mechanistic approach, which tends to focus on the underlying mechanisms of MNR and thereby predict future outcomes under changing or uncertain conditions.
Most of the specific measures in the USEPA 2005 guidance fall into one of these two categories. For example, monitoring of surface sediments over time is more of monitoring approach, while evaluation of sediment sequestration is more of a mechanistic approach. Most sites use measures from both categories.
The overall approach proposed for Onondaga Lake is to implement an approach that draws from both categories with a greater emphasis on the monitoring and contingency approach. A monitoring and contingency approach:
• Relies on focused data collection of key measures of MNR over time;
• Has less reliance on inherently uncertain predictive models; and
• Provides assurances of alternate actions under a contingency process (discussed more below).
In general, the monitoring and contingency approach consists of the following elements:
• Collecting the same data types on regular intervals to track the course of MNR and provide early warning when MNR is not occurring as expected
• Providing a clear timing and decision framework for evaluating those data and making contingency decisions
• Providing a clear set of contingency procedures, dependent on monitoring results, that allows for:
− Conducting additional analysis and/or modeling of existing data to better understand the implications of available results;
− Collecting additional data and/or new types of data to help better understand existing results (with related additional data analyses/modeling as necessary); and
− Evaluating and implementing (as warranted) additional remedial activities in the event that MNR is not taking place at an acceptable rate.
PHASE III PDI WORK PLANADDENDUM 6
REVISED
P:\Honeywell -SYR\443583 - SMU 8\09 Reports\Phase III PDI MNR Addendum\Phase III Add 6 MNR 01-08.doc Parsons
January 16, 2008
3
• Considering additional contingency procedures for unexpected or unknown events or circumstances (such as large storm events, unusual natural or anthropogenic discharge events, and other remedial activities affecting SMU 8 such as oxygenation).
The monitoring and contingency approach provides early warnings if MNR is not meeting its objectives and also an assurance that additional remedial actions can take place to correct that situation, if necessary. For Onondaga Lake, a key component of such a contingency process would be to conduct additional thin-layer capping in SMU 8 during remedial construction or during the MNR period, if early warning data indicate MNR will not meet its objectives.
A year-to-year summary schedule for implementing the monitoring and contingency approach is summarized in Table 1. The approach will be implemented sequentially in the following general order: monitor, model, and then act as warranted. The approach as applied to SMU 8 includes regular surface sediment sampling as a key measure tracking the status of MNR. Subsequent sampling events will return to the same stations to determine the extent to which surface sediment chemical concentrations are changing over time. For this 2007 SMU 8 sampling event, the sediment depth intervals for analyses are as follows:
• 0 to 2 centimeters – the most recently settled sediments;
• 2 to 4 centimeters – over the top 4 centimeters of sediments (in combination with the 0 to 2 centimeter interval), which is the mixed layer depth used in the MNR Model;
• 4 to 10 centimeters – over the top 10 centimeters (in combination with the intervals above), which is the assumed depth of bioturbation under lake oxidation scenarios; and
• 10 to 15 centimeters – over the top 15 centimeters (in combination with the intervals above).
During 2008, analysis of high-resolution radioisotope and mercury cores is proposed to update recent historical trends in sedimentation (and sediment chemical concentrations) obtained by similar historic cores. The primary purpose of this sampling is to determine whether the recent sediment history differs from that observed in cores taken several years ago. This includes looking at the variability of mercury concentrations in recent core history to help establish parameter input ranges for the MNR Model (use of which is discussed below). One problem with high resolution cores is that they rely on known radiological or mercury markers to establish the time span (and thereby sedimentation rate) represented by the core or portions of the core. Most of the discrete 137Cesium and mercury markers can include events that occurred until 1986, and thus, they have little use in establishing the time span in more recent (upper) sections of such cores. Similarly, 210Lead data cannot easily resolve time spans of only a few years given its half life of 22.3 years and sampling limitations on the resolution of core sample intervals (e.g., one to two centimeters).
Consequently, placing non-toxic fluorescent micro-beads or equivalent in patches across several regions of the profundal zone will help establish a more recent marker to determine
PHASE III PDI WORK PLANADDENDUM 6
REVISED
P:\Honeywell -SYR\443583 - SMU 8\09 Reports\Phase III PDI MNR Addendum\Phase III Add 6 MNR 01-08.doc Parsons
January 16, 2008
4
sedimentation rates over the next several years. These patches would be monitored as part of the overall surface sediment sampling approach noted above, but in this case an additional shallow core would be taken at each station where markers were placed and sectioned into vertical intervals. Given the approximate 0.5 centimeter typical annual sedimentation rate generally observed in the profundal zone and limitations on the resolution of sampled core intervals, it will likely take at least two years to establish a preliminary sedimentation rate based on sampling of such markers. Over 20 years of monitoring, approximately 10 centimeters of sediment are anticipated to accumulate, which could be sampled using the shallow core technique described in this work plan. The marker micro-beads would also provide a means to measure mixing due to bioturbation taking place after the beads are placed in the lake, because organisms would mix these beads into deeper sediment. Judging from the fine striations observed in historical high resolution cores and the continued anoxic conditions in the hypolimnion during summer stratification which prevents biological activity, bioturbation is not expected to take place in the profundal zone over the next few years. To the extent that bioturbation does occur, it could limit the ability to resolve sedimentation rates over time as the horizon of original marker placement becomes progressively more spread out and indistinct due to these sediment dynamics.
High-resolution coring results and micro-bead marker measures are consistent with a mechanistic/predictive approach to MNR evaluation, and these data will be primarily used to understand the mechanism of sedimentation and its dynamics. These data will be used to adjust/refine MNR Model input parameters and update model predictions.
High-resolution coring results and micro-bead marker data will be used in two primary data evaluations shown in Table 1. First, the 2008 high resolution core and micro-bead marker data will be used to quantify sedimentation rates and mixed layer depths to provide refinements to these model input parameters. Table 2 shows how monitoring data will be used in the MNR Model. The model will be used throughout the evaluation period. No changes would be made to the model code. New data would be used to update model input parameters to the most recent observed conditions and re-calibrate the model (if necessary) to be able to mimic the recent observed history of sediment chemical concentrations. New data will also allow the MNR model to be applied to different areas of the profundal zone (such as the five subareas shown in Figures 1 and 2). In addition, the surface sediment chemistry would be used to update the model in terms of the following:
• Starting mixed layer chemical concentration (based on the 0 to 4 centimeter interval data);
• Settling sediment concentrations (based on the 0 to 2 centimeter interval data); and
• Physical characteristics of mixed and buried layers (0 to 4 centimeter and 4 to 15 centimeter interval).
Part of the contingency process would be to consider the collection of additional data or different types of data if the MNR Model (or refinements of the model as discussed above)
PHASE III PDI WORK PLANADDENDUM 6
REVISED
P:\Honeywell -SYR\443583 - SMU 8\09 Reports\Phase III PDI MNR Addendum\Phase III Add 6 MNR 01-08.doc Parsons
January 16, 2008
5
cannot explain the changes that are being observed. One example of a different type of data is to consider placing and collecting sediment traps. Consideration of sediment traps will begin in 2008 once the 2007 MNR sediment analyses are available. A possible objective of sediment traps would be to supplement high-resolution core data planned to be collected during 2008.
Surface sediment data will be used to evaluate the changes in surface sediment chemistry as the primary measure of the status of MNR. This will be compared to the expected course of MNR as predicted by the MNR Model. Also, forward projections of MNR based on these results will be used to determine whether MNR is likely to continue to meet the expected goals by the end of the MNR timeframe. Forward projections will be conducted based on the refined MNR Model as well as statistical trend projections based on known past variability in sediment chemical concentrations over time.
The contingency process is summarized above. In general, the monitoring data will be used to determine whether MNR is progressing as expected. If so, little if any additional contingency data analysis, modeling, data collection, or remedial actions would be contemplated. If not, then these potential additional contingency actions will be discussed with DEC and DEC will determine what contingencies should be implemented, including the placement of additional thin-layer capping. This decision point on the need for contingency actions will be made at least after each regularly scheduled monitoring event and also when other unscheduled conditions may occur.
Honeywell will provide reports on an annual basis or as otherwise determined by the SMU 8 Technical Work Group to document the results of any sampling and/or modeling performed during the current period and to provide recommendations for activities and/or contingency actions for the next period.
3.0 2007 MNR FIELD TASKS
3.1 Mobilization and Sample Location Positioning
The boat to be used to collect the sediment samples will be a large pontoon boat that would be brought to a lake marina on a trailer in a folded-up condition. The sampling boat will be launched down a public boat ramp, unfolded, and then the mast will be raised as the boat enters the water.
The sampling boat will be configured with a three or four-point mooring system able to accommodate SMU 8 water depths up to 65 feet and a mechanized A-frame for handling a box corer or a vibratory corer.
Vessel positioning and the determination of as-cored sample locations will be accomplished utilizing a Trimble geographic positioning system (GPS) receiver (or equivalent) interfaced with a navigation and data logging system. Differential GPS coordinates and water depth will be reported for each sediment sampling location.
PHASE III PDI WORK PLANADDENDUM 6
REVISED
P:\Honeywell -SYR\443583 - SMU 8\09 Reports\Phase III PDI MNR Addendum\Phase III Add 6 MNR 01-08.doc Parsons
January 16, 2008
6
3.2 2007 MNR Sediment Sampling
A box corer or Vibracore™ sampling device will be used to collect shallow sediment samples from SMU 8. A box corer is preferred and will be used if implementable, because required sample quantities dictate that multiple short sample tubes be used to collect sediment at each location. If a box corer is not implementable during this sampling effort, Parsons will consult right away with NYSDEC to decide how to proceed.
Box corer penetration at each sample location will be to a depth at least 8 to 12 inches below the mudline. SMU 8 shallow sediments are generally very soft and fluffy. If shallow sediment samples cannot be collected to the desired depth or in a relatively undisturbed condition, the box corer will be moved approximately 10 feet to a new location where a second attempt will be made to collect a suitable sample. If the second attempt is also not successful, a third attempt will be made at a location approximately 10 feet away from the original sample location in another direction.
Box cores containing sediment will be brought up into the boat and maintained in a vertical position until polycarbonate tubes approximately two to three inches in diameter are inserted into the sediment inside the box corer. Enough tubes of sediment will be collected to meet laboratory analysis requirements. Similarly, if a Vibracore™ sampler is used, a sufficient number of cores will be collected to meet laboratory analysis requirements. Using either sampling method, the tubes will then be capped on both ends and stored vertically on the boat and on ice prior to shipment in a vertical position to the laboratory.
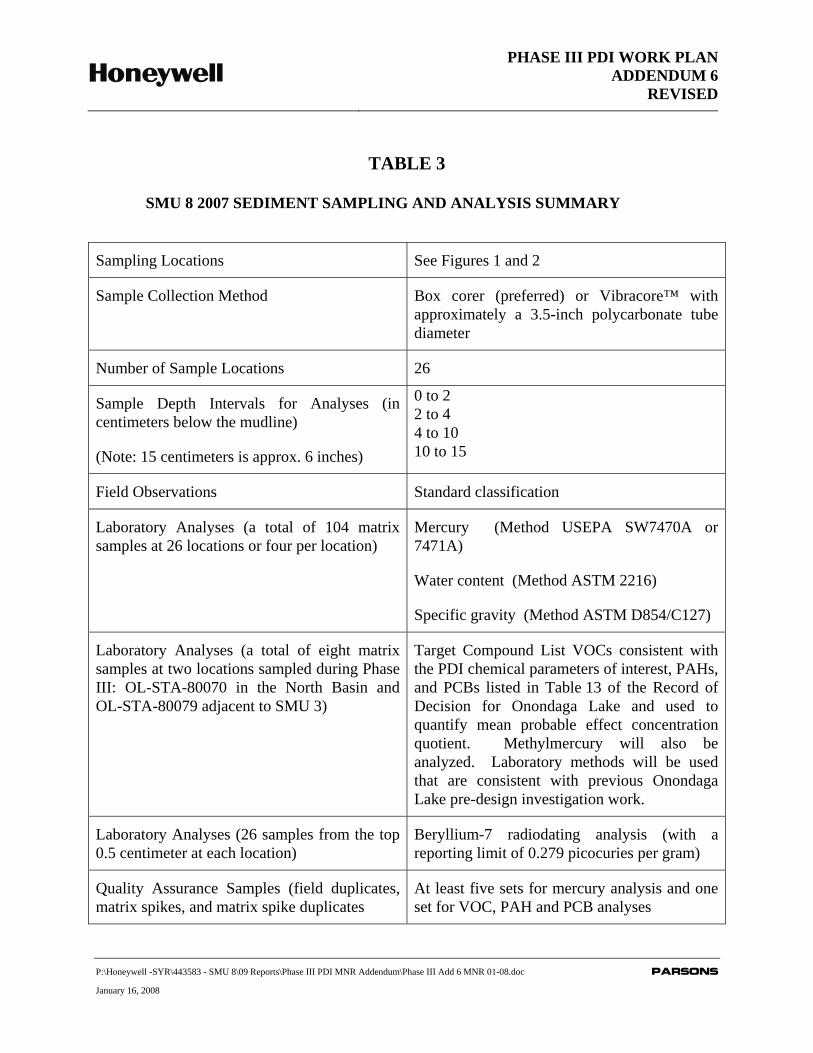
Shallow sample cores will be collected at a total of 26 locations as shown on Figures 1 and 2. These sample locations will provide widespread distribution throughout SMU 8 with more locations near the sources of chemical parameters of interest in the southern half of the lake. Each of the sample locations is co-located with previous sampling efforts conducted during 1992 or 2005. Due to limited sample volume available within small vertical sampling intervals, multiple tubes will be needed from each location to provide sufficient sample quantity for the intended laboratory analyses. Sample management, equipment decontamination, and other field procedures not specified in this work plan will follow procedures provided in the Onondaga Lake PDI Standard Operating Procedures (Parsons, 2005b). Sediment from the inner section of each core will be used for chemical analysis.
The vertical intervals for segmenting each sample tube and for conducting laboratory analyses will be 0 to 2 centimeters, 2 to 4 centimeters, 4 to 10 centimeters, and 10 to 15 centimeters as listed on Table 3. As presented in Section 2.0, these intervals were selected based on 0 to 2 centimeters representing the most recent sedimentation, 2 to 4 centimeters representing the modeled mixed layer under current conditions,, and 4 to 10 centimeters representing the assumed depth of possible bioturbation when the hypolimnion contains oxygen. The average sediment settling rate in SMU 8 is approximately 0.5 to 1.0 centimeter per year at the South Deep station based on data from the Onondaga Lake Remedial Investigation Report
PHASE III PDI WORK PLANADDENDUM 6
REVISED
P:\Honeywell -SYR\443583 - SMU 8\09 Reports\Phase III PDI MNR Addendum\Phase III Add 6 MNR 01-08.doc Parsons
January 16, 2008
7
(TAMS, 2002). The vertical interval of 10 to 15 centimeters is included so the combined depths of 0 to 15 centimeters will allow assessments to be made consistent with other sampling programs in the lake. Sediment from each vertical interval will be analyzed for total mercury, moisture content, and specific gravity. Samples from the top 0.5 centimeter at each location will also be analyzed for beryllium-7 which has a half life of approximately 53 days. Analyses will be conducted using standard USEPA and ASTM procedures employed previously within the Onondaga Lake PDI (see Table 3). The results for moisture content and specific gravity will be used to quantitatively estimate in-situ bulk density. The value of analyzing future samples for beryllium-7 at a higher efficiency will be assessed for future MNR analytical efforts beginning in 2008 following receipt of the 2007 results.
At two of the 26 locations, analyses will also be made from each of the four sediment depth intervals for Target Compound List volatile organics consistent with the PDI chemical parameters of interest, polynuclear aromatic hydrocarbons (PAHs), and polychlorinated biphenyls (PCBs) so probable effect concentration quotients can be quantified. Sediment samples from the same two locations will also be analyzed for methylmercury. These two locations are the locations in SMU 8 outside the South Corner where probable effect concentration quotients exceeding 1 were measured as part of the Remedial Investigation effort in the early 1990’s (and therefore included for remediation (i.e., thin layer capping) in the ROD), but subsequent sampling during Phase II of the PDI indicated a mean probable effect concentration quotient less than one. One of the two locations (OL-VC-80023) is in the North Basin, and the other location (OL-VC-80025) is alongside SMU 3 approximately half way between SMU 4 and SMU 2 (see Figure 2.5 in the Feasibility Study Report (Parsons, 2004)).
Specific sediment sampling and sample processing procedures to be used for this effort are presented in Appendix A.
4.0 HEALTH AND SAFETY
Parsons ranks health and safety as the highest priority. Parsons’ Project Safety Plan (Parsons, 2005a, Appendix C) and our Subcontractor’s Safety Plans prepared for previous PDI activities will be used for this investigation and will be strictly followed by all personnel. Any task outside of the current scope defined in the Project Safety Plan will have a new Job Safety Analysis completed before the task begins. Copies of the Project Safety Plan and the Subcontractor Safety Plans will be maintained at the support zone onshore and on the sampling boat.
This sampling will require personnel with 40-hour OSHA and 8-hour refresher training to operate under modified Level D personal protection.
5.0 QUALITY ASSURANCE
The support zone and facilities established during the Phase I/II PDI will be used for the Phase III PDI investigation. Decontamination and waste management activities will be
PHASE III PDI WORK PLANADDENDUM 6
REVISED
P:\Honeywell -SYR\443583 - SMU 8\09 Reports\Phase III PDI MNR Addendum\Phase III Add 6 MNR 01-08.doc Parsons
January 16, 2008
8
conducted in accordance with Phase I PDI Work Plan (Parsons, 2005a, Appendix A). Laboratory procedures will be conducted in accordance with the Phase I PDI Quality Assurance Project Plan (Parsons, 2005a, Appendix B). Field quality assurance and quality control will consist of the collection and analysis of field duplicates, and matrix spike/matrix spike duplicate samples in accordance with the Phase I PDI Work Plan (Parsons, 2005a). Since the samples will be collected from dedicated tubes/liners, rinse blanks will be collected at a rate of one per batch of dedicated sampling equipment.
6.0 SAMPLE AND DATA MANAGEMENT AND REPORTING
Sample names, QA/QC procedures, sample collection, data entry, and data validation for this portion of the work will be conducted in accordance with the Phase I PDI Work Plan (Parsons, 2005a, Appendix A and Appendix B). Any deviations from these procedures will be discussed with NYSDEC prior to execution of the work.
TestAmerica will be conducting the laboratory analyses. Test America (formerly STL) has worked successfully for Honeywell on other Onondaga Lake Pre-Design efforts having a similar work scope.
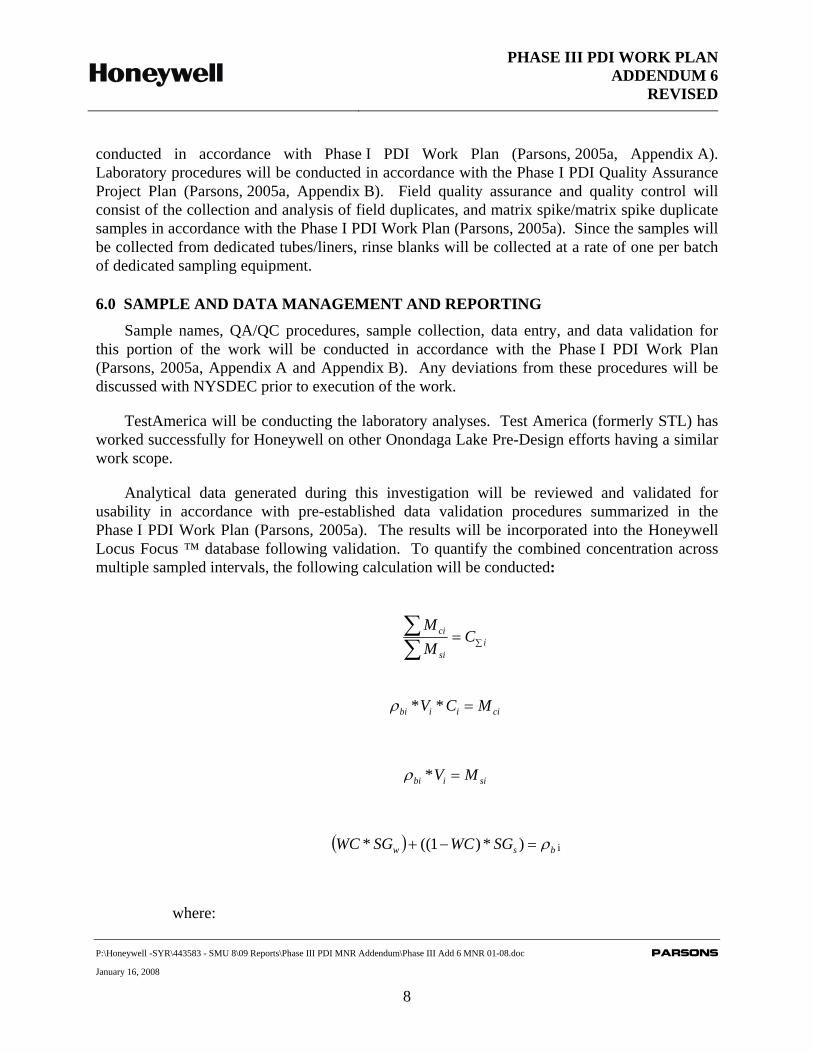
Analytical data generated during this investigation will be reviewed and validated for usability in accordance with pre-established data validation procedures summarized in the Phase I PDI Work Plan (Parsons, 2005a). The results will be incorporated into the Honeywell Locus Focus ™ database following validation. To quantify the combined concentration across multiple sampled intervals, the following calculation will be conducted:
∑=∑∑
isi
ci CMM
ciiibi MCV =**ρ
siibi MV =*ρ
( ) bsw SGWCSGWC ρ=−+ )*)1((* i
where:
PHASE III PDI WORK PLANADDENDUM 6
REVISED
P:\Honeywell -SYR\443583 - SMU 8\09 Reports\Phase III PDI MNR Addendum\Phase III Add 6 MNR 01-08.doc Parsons
January 16, 2008
9
∑ iC = concentration of chemical over combined intervals (i) in mg/g (note this can be converted to mg/kg by multiplying by 1000 (g/kg).
ciM = mass of chemical in interval i (mg)
siM = mass of sediment in interval i (g)
biρ = in-situ density of sediment in interval i (g/cm3)
iV = volume of interval i (cm3) (calculated assuming a constant surface area of 1 cm2 times the interval depth in cm)
iC = concentration of chemical measured in interval i (mg/g)
WC = water content measured in sediment (proportion)
wSG = specific gravity of water (assumed to be 1) (g/cm3)
sSG = measured specific gravity of dry sediment (g/cm3)
Parsons will submit investigation results to NYSDEC in accordance with the Consent Decree for the Lake. Once the Phase III investigation and evaluation has been completed, a data summary report will be prepared and submitted to NYSDEC that includes results from this MNR sampling effort.
Following laboratory analyses of these samples the data will be assessed to determine whether the concentrations in each subarea of the profundal zone are relatively uniform. The
PHASE III PDI WORK PLANADDENDUM 6
REVISED
P:\Honeywell -SYR\443583 - SMU 8\09 Reports\Phase III PDI MNR Addendum\Phase III Add 6 MNR 01-08.doc Parsons
January 16, 2008
10
value of additional sediment sampling and analysis in 2008 will be assessed based on analysis of results from the 2007 work.
7.0 REFERENCES
Honeywell, Parsons, and O’Brien & Gere (OBG), 2007. Honeywell Syracuse Portfolio Health and Safety Program. February 15, 2007.
NYSDEC and USEPA Region 2. 2005. Record of Decision. Onondaga Lake Bottom Subsite of the Onondaga Lake Superfund Site. July 2005.
Parsons, 2004. Feasibility Study Report for Onondaga Lake. Prepared for Honeywell. November 2004. (MNR is described in detail in Appendix N.)
Parsons. 2005a. Onondaga Lake Pre-Design Investigation: Phase I Work Plan. Prepared for Honeywell. September 2005.
Appendix A Phase I Sampling And Analysis Plan Appendix B Quality Assurance Project Plan Appendix C Project Safety Plan Updated March 2007.
Parsons. 2005b. Onondaga Lake Pre-Design Investigation: Standard Operating Procedures. Prepared for Honeywell. November 2005
Parsons. 2006. Onondaga Lake Pre-Design Investigation: Phase II Work Plan. Prepared for Honeywell. September 2006.
Parsons, 2007, Onondaga Lake Pre-Design Investigation: Phase III Work Plan. Prepared for Honeywell, Morristown, New Jersey. Syracuse, New York
TAMS Consultants and YEC, Inc., 2002. Onondaga Lake Remedial Investigation Report. Prepared for the State of New York Department of Environmental Conservation. Based on an original document prepared by Exponent for Honeywell. December 2002.
USEPA,. 2005. Contaminated Sediment Remediation Guidance for Hazardous Waste Sites. EPA-540-R-05-012. Office of Solid Waste and Emergency Response. OSWER 9355.0-85. December 2005.
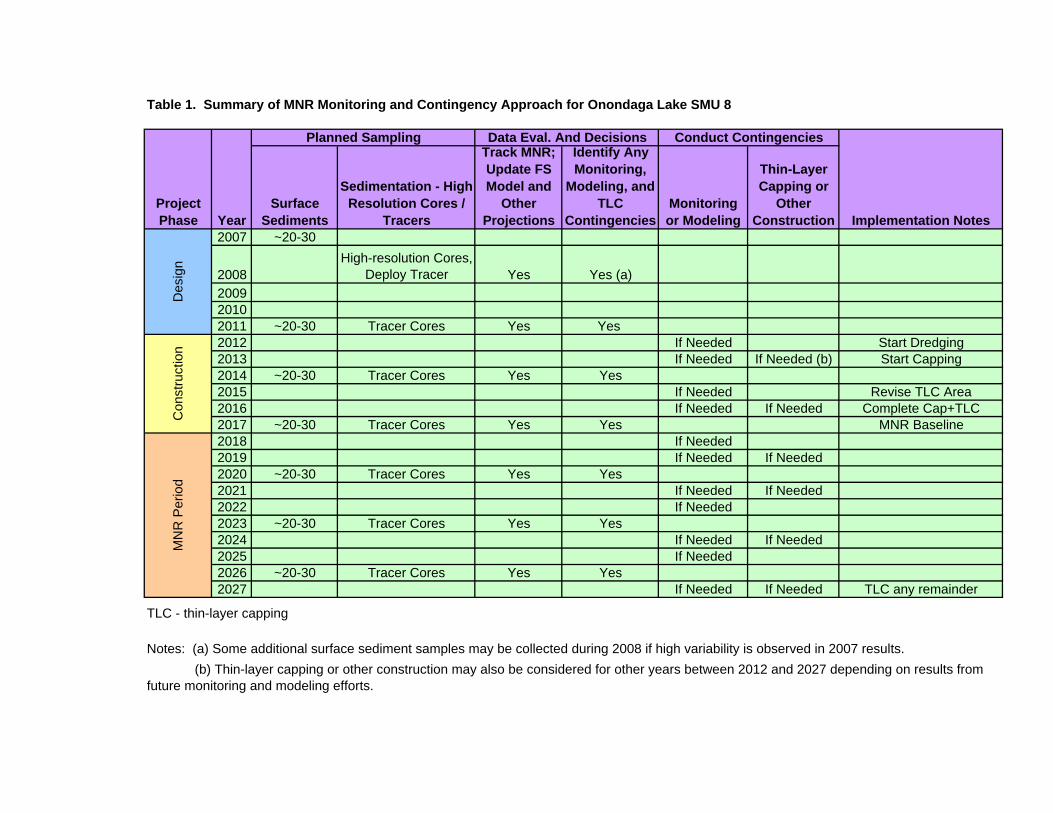
Table 1. Summary of MNR Monitoring and Contingency Approach for Onondaga Lake SMU 8
Project Phase Year
Surface Sediments
Sedimentation - High Resolution Cores /
Tracers
Track MNR; Update FS Model and
Other Projections
Identify Any Monitoring,
Modeling, and TLC
ContingenciesMonitoring or Modeling
Thin-Layer Capping or
Other Construction Implementation Notes
2007 ~20-30
2008High-resolution Cores,
Deploy Tracer Yes Yes (a)200920102011 ~20-30 Tracer Cores Yes Yes 2012 If Needed Start Dredging2013 If Needed If Needed (b) Start Capping2014 ~20-30 Tracer Cores Yes Yes2015 If Needed Revise TLC Area2016 If Needed If Needed Complete Cap+TLC2017 ~20-30 Tracer Cores Yes Yes MNR Baseline2018 If Needed2019 If Needed If Needed2020 ~20-30 Tracer Cores Yes Yes2021 If Needed If Needed2022 If Needed2023 ~20-30 Tracer Cores Yes Yes2024 If Needed If Needed2025 If Needed2026 ~20-30 Tracer Cores Yes Yes2027 If Needed If Needed TLC any remainder
TLC - thin-layer capping
Notes: (a) Some additional surface sediment samples may be collected during 2008 if high variability is observed in 2007 results. (b) Thin-layer capping or other construction may also be considered for other years between 2012 and 2027 depending on results from future monitoring and modeling efforts.
Data Eval. And Decisions Conduct Contingencies
MN
R P
erio
dD
esig
nC
onst
ruct
ion
Planned Sampling
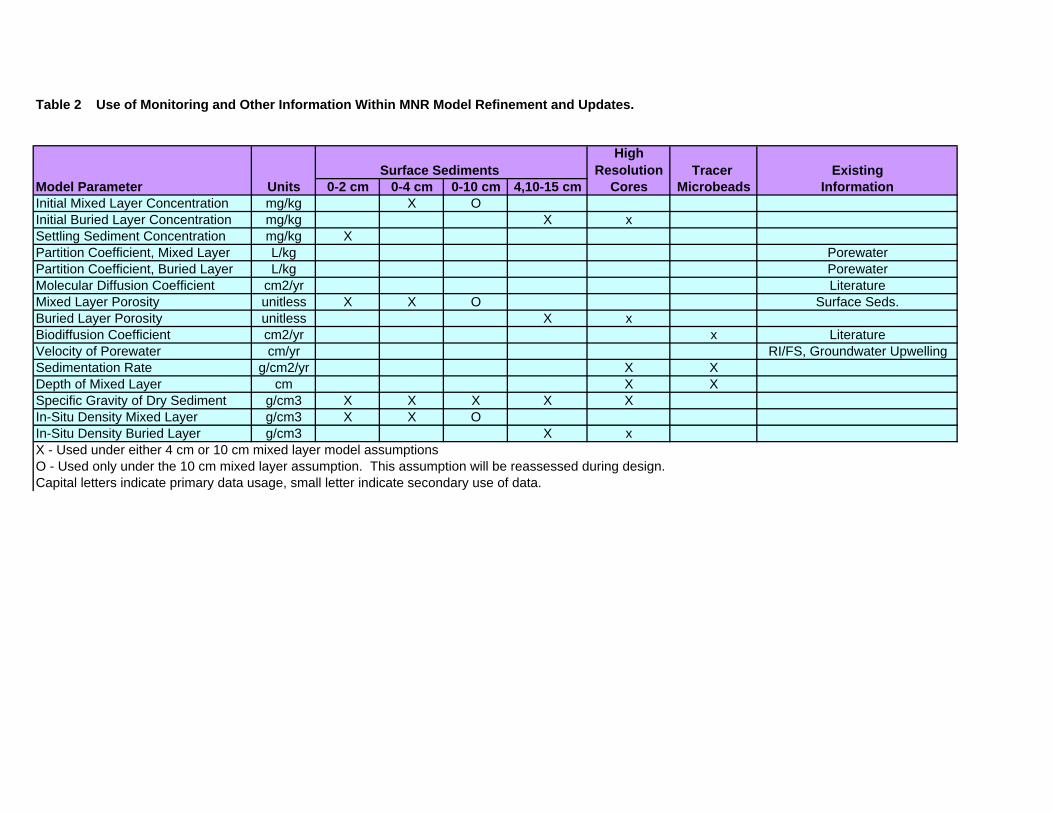
Table 2 Use of Monitoring and Other Information Within MNR Model Refinement and Updates.
Surface SedimentsHigh
Resolution Tracer ExistingModel Parameter Units 0-2 cm 0-4 cm 0-10 cm 4,10-15 cm Cores Microbeads InformationInitial Mixed Layer Concentration mg/kg X OInitial Buried Layer Concentration mg/kg X xSettling Sediment Concentration mg/kg XPartition Coefficient, Mixed Layer L/kg PorewaterPartition Coefficient, Buried Layer L/kg PorewaterMolecular Diffusion Coefficient cm2/yr LiteratureMixed Layer Porosity unitless X X O Surface Seds.Buried Layer Porosity unitless X xBiodiffusion Coefficient cm2/yr x LiteratureVelocity of Porewater cm/yr RI/FS, Groundwater UpwellingSedimentation Rate g/cm2/yr X XDepth of Mixed Layer cm X XSpecific Gravity of Dry Sediment g/cm3 X X X X XIn-Situ Density Mixed Layer g/cm3 X X OIn-Situ Density Buried Layer g/cm3 X xX - Used under either 4 cm or 10 cm mixed layer model assumptions
Capital letters indicate primary data usage, small letter indicate secondary use of data.O - Used only under the 10 cm mixed layer assumption. This assumption will be reassessed during design.
PHASE III PDI WORK PLANADDENDUM 6
REVISED
P:\Honeywell -SYR\443583 - SMU 8\09 Reports\Phase III PDI MNR Addendum\Phase III Add 6 MNR 01-08.doc Parsons
January 16, 2008
TABLE 3
SMU 8 2007 SEDIMENT SAMPLING AND ANALYSIS SUMMARY
Sampling Locations See Figures 1 and 2
Sample Collection Method Box corer (preferred) or Vibracore™ with approximately a 3.5-inch polycarbonate tube diameter
Number of Sample Locations 26
Sample Depth Intervals for Analyses (in centimeters below the mudline)
(Note: 15 centimeters is approx. 6 inches)
0 to 2 2 to 4 4 to 10 10 to 15
Field Observations Standard classification
Laboratory Analyses (a total of 104 matrix samples at 26 locations or four per location)
Mercury (Method USEPA SW7470A or 7471A)
Water content (Method ASTM 2216)
Specific gravity (Method ASTM D854/C127)
Laboratory Analyses (a total of eight matrix samples at two locations sampled during Phase III: OL-STA-80070 in the North Basin and OL-STA-80079 adjacent to SMU 3)
Target Compound List VOCs consistent with the PDI chemical parameters of interest, PAHs, and PCBs listed in Table 13 of the Record of Decision for Onondaga Lake and used to quantify mean probable effect concentration quotient. Methylmercury will also be analyzed. Laboratory methods will be used that are consistent with previous Onondaga Lake pre-design investigation work.
Laboratory Analyses (26 samples from the top 0.5 centimeter at each location)
Beryllium-7 radiodating analysis (with a reporting limit of 0.279 picocuries per gram)
Quality Assurance Samples (field duplicates, matrix spikes, and matrix spike duplicates
At least five sets for mercury analysis and one set for VOC, PAH and PCB analyses

PHASE III PDI WORK PLANADDENDUM 6
REVISED
P:\Honeywell -SYR\443583 - SMU 8\09 Reports\Phase III PDI MNR Addendum\Phase III Add 6 MNR 01-08.doc Parsons
January 16, 2008
FIGURES
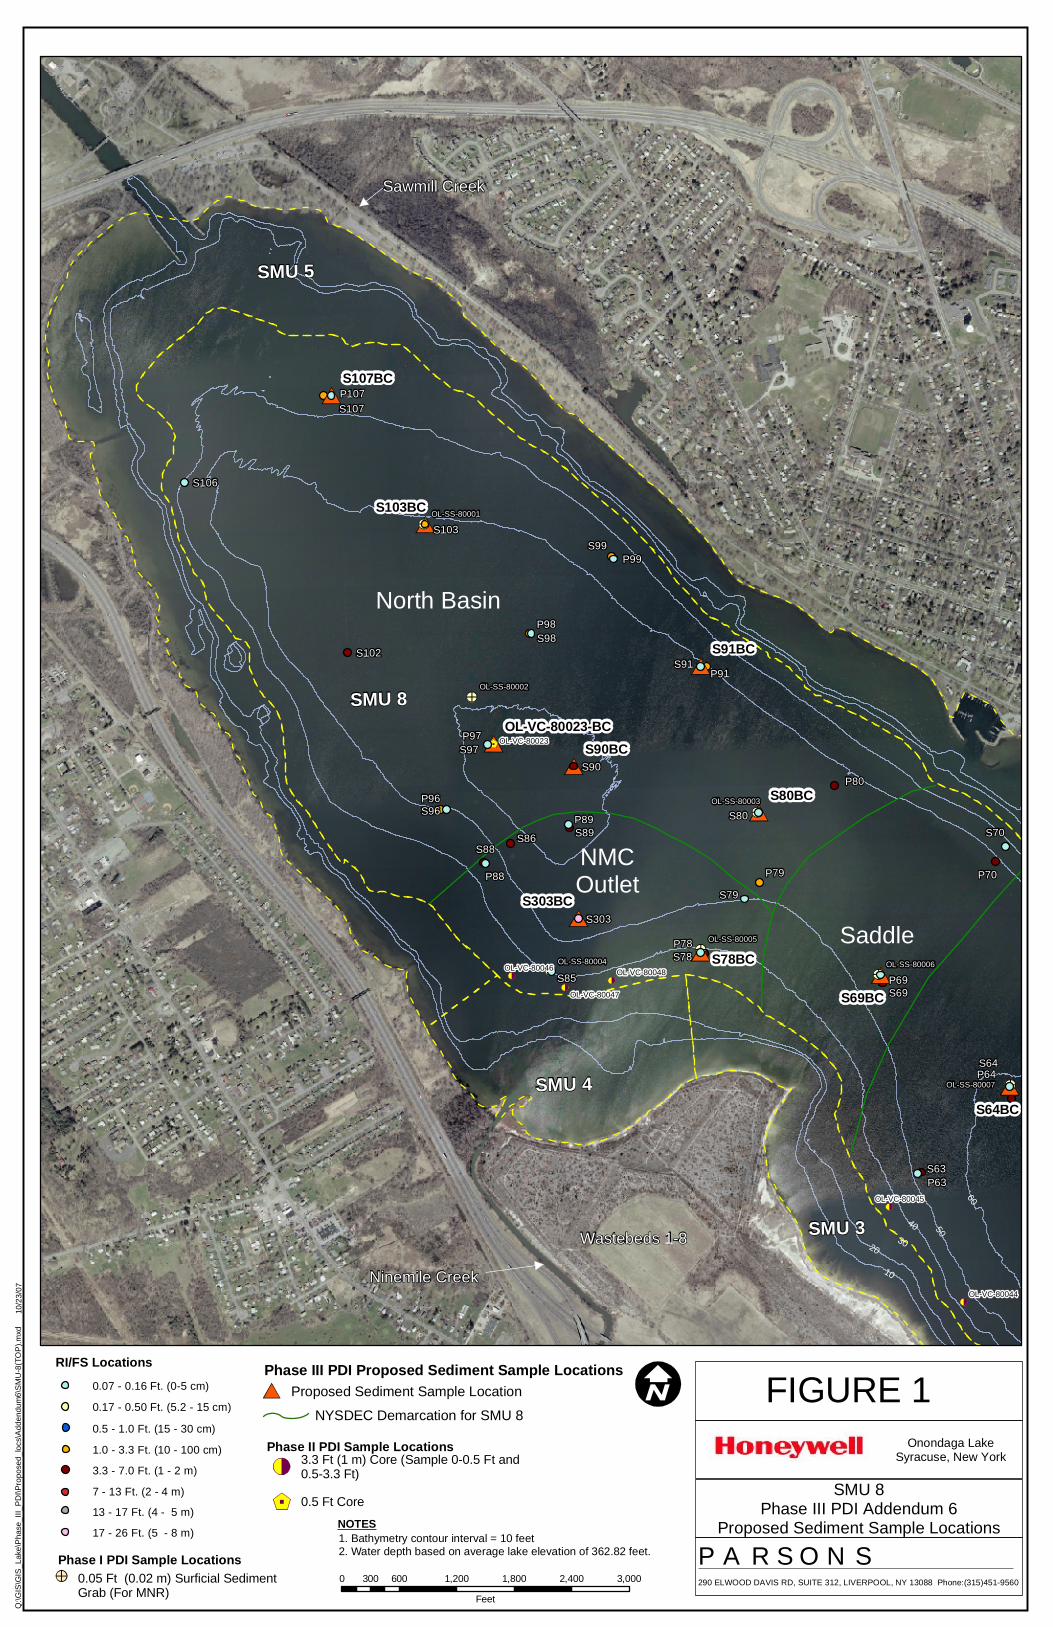
Wastebeds 1-8
SMU 8
SMU 5
SMU 4
SMU 3
Ninemile Creek
Sawmill Creek
10
2030
40 50
60
North Basin
NMCOutlet
Saddle
P99
P98
P97
P96
P89
P88
P80
P79
P78
P69
P63
P107
S64P64
P70
P91
S90
S91
S89S88
S85
S78
S69
S63
S80
S79
S99
S98
S97
S96
S70
S303
S102
S103
S107
S106
S86
OL-SS-80006
OL-SS-80005
OL-SS-80004
OL-SS-80003
OL-SS-80002
OL-SS-80001
OL-SS-80007
S90BC
S91BC
S78BC
S69BC
S64BC
S80BC
S303BC
S103BC
S107BC
OL-VC-80023-BC
OL-VC-80044
OL-VC-80045
OL-VC-80048
OL-VC-80047
OL-VC-80046
OL-VC-80023
0 600 1,200 1,800 2,400 3,000300
Feet
1. Bathymetry contour interval = 10 feet2. Water depth based on average lake elevation of 362.82 feet.
Onondaga LakeSyracuse, New York
290 ELWOOD DAVIS RD, SUITE 312, LIVERPOOL, NY 13088 Phone:(315)451-9560
PARSONS
SMU 8Phase III PDI Addendum 6
Proposed Sediment Sample Locations
FIGURE 1
NOTES
Phase I PDI Sample Locations0.05 Ft (0.02 m) Surficial Sediment Grab (For MNR)
Phase II PDI Sample Locations3.3 Ft (1 m) Core (Sample 0-0.5 Ft and0.5-3.3 Ft)
0.5 Ft Core
10/2
3/07
Phase III PDI Proposed Sediment Sample LocationsRI/FS Locations0.07 - 0.16 Ft. (0-5 cm)
0.17 - 0.50 Ft. (5.2 - 15 cm)
0.5 - 1.0 Ft. (15 - 30 cm)
1.0 - 3.3 Ft. (10 - 100 cm)
3.3 - 7.0 Ft. (1 - 2 m)
7 - 13 Ft. (2 - 4 m)
13 - 17 Ft. (4 - 5 m)
17 - 26 Ft. (5 - 8 m)
Q:\G
IS\G
IS_L
ake\
Pha
se_I
II_P
DI\P
ropo
sed_
locs
\Add
endu
m6\
SM
U-8
(TO
P).m
xd
Proposed Sediment Sample Location
NYSDEC Demarcation for SMU 8
SMU 8
SMU 3
SMU 2
Tributary 5A
SMU 5
10
2030
40
50
60
Saddle
South Basin
South Corner
10
20
30
40
50
60
P70
P69
P65
P64
P63
P59
P58
P57P52
P50
P49
P43
P42
P41
P32
P31
P30
P25P39
P38
S56
S24
S27S40
S51
S69
S65
S63
S33
S32
S31
S30
S60
S52
S50
S49
S44
S43
S42
S59
S58
S57
S25
S70
S355
S354
S64
S41
OL-VC-80033
OL-VC-80032
OL-VC-80043
OL-VC-80025OL-VC-80024
OL-VC-80037
OL-SS-80027
OL-VC-80039
OL-VC-80038
OL-VC-80045
OL-VC-80031
OL-VC-80026
OL-VC-80036
OL-VC-80028
OL-VC-80040
OL-VC-80041
OL-VC-80042
OL-VC-80044
OL-VC-80029OL-VC-80030
OL-VC-80034
OL-VC-80035
OL-VC-80050
OL-VC-80051
OL-VC-80049
OL-SS-80018
OL-SS-80017OL-SS-80016
OL-SS-80015
OL-SS-80014
OL-SS-80013
OL-SS-80012
OL-SS-80011
OL-SS-80010
OL-SS-80009
OL-SS-80008
OL-SS-80007
OL-SS-80006
OL-SS-80020
OL-SS-80019
S51BC
S69BC
S64BC
S33BC
S32BC
S31BC
S60BC
S52BC
S49BC
S44BC
S43BC
S42BC
S41BC
S58BC
OL-VC-80025-BC
S30BC
0 625 1,250 1,875 2,500 3,125312.5
Feet
Onondaga LakeSyracuse, New York
290 ELWOOD DAVIS RD, SUITE 312, LIVERPOOL, NY 13088 Phone:(315)451-9560
PARSONS
SMU 8Phase III PDI Addendum 6
Proposed Sediment Sample Locations
FIGURE 2
10/2
3/07
Q:\G
IS\G
IS_L
ake\
Pha
se_I
II_P
DI\P
ropo
sed_
locs
\Add
endu
m6\
SM
U-8
(BO
TTO
M)2
.mxd
1. Bathymetry contour interval = 10 feet2. Water depth based on average lake elevation of 362.82 feet.
NOTES
Phase II PDI Sample Locations
Phase I PDI Sample Locations0.05 Ft (0.02 m) Surficial Sediment Grab (For MNR)
3.3 Ft (1 m) Core (Sample 0-0.5 Ftand 0.5-3.3 Ft)
20 Ft (6 m) Core (Sample 0-0.5 Ft, 0.5-3.3 Ft and 3.3 Ft intervals to 20 Ft)
0.5 Ft Core
Phase III PDI Proposed Sediment Sample LocationsProposed Sediment Sample Location
NYSDEC Demarcation for SMU 8
RI/FS Locations0.07 - 0.16 Ft. (0-5 cm)
0.17 - 0.50 Ft. (5.2 - 15 cm)
0.5 - 1.0 Ft. (15 - 30 cm)
1.0 - 3.3 Ft. (10 - 100 cm)
3.3 - 7.0 Ft. (1 - 2 m)
7 - 13 Ft. (2 - 4 m)
13 - 17 Ft. (4 - 5 m)
17 - 26 Ft. (5 - 8 m)
REVISED
PARSONS P:\Honeywell -SYR\443583 - SMU 8\09 Reports\Phase III PDI MNR Addendum\Biox Corer and process procedures.doc
November 20, 2007 page A1 of 4
APPENDIX A
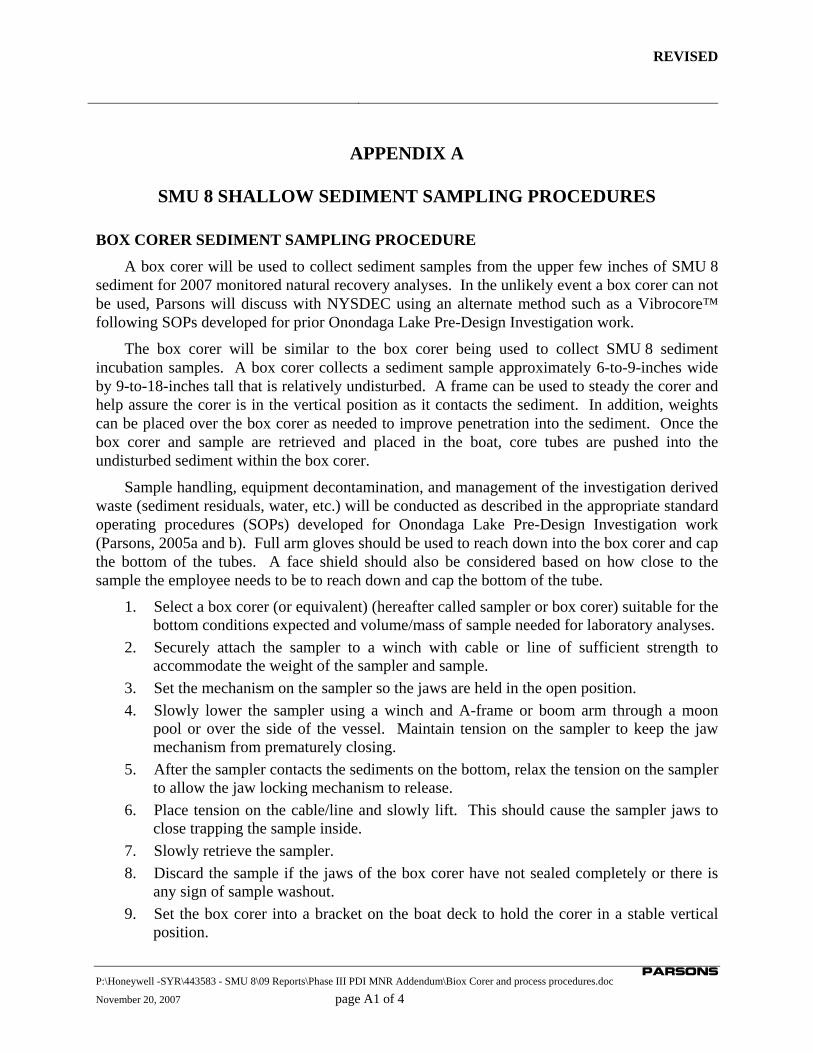
SMU 8 SHALLOW SEDIMENT SAMPLING PROCEDURES
BOX CORER SEDIMENT SAMPLING PROCEDURE
A box corer will be used to collect sediment samples from the upper few inches of SMU 8 sediment for 2007 monitored natural recovery analyses. In the unlikely event a box corer can not be used, Parsons will discuss with NYSDEC using an alternate method such as a Vibrocore™ following SOPs developed for prior Onondaga Lake Pre-Design Investigation work.
The box corer will be similar to the box corer being used to collect SMU 8 sediment incubation samples. A box corer collects a sediment sample approximately 6-to-9-inches wide by 9-to-18-inches tall that is relatively undisturbed. A frame can be used to steady the corer and help assure the corer is in the vertical position as it contacts the sediment. In addition, weights can be placed over the box corer as needed to improve penetration into the sediment. Once the box corer and sample are retrieved and placed in the boat, core tubes are pushed into the undisturbed sediment within the box corer.
Sample handling, equipment decontamination, and management of the investigation derived waste (sediment residuals, water, etc.) will be conducted as described in the appropriate standard operating procedures (SOPs) developed for Onondaga Lake Pre-Design Investigation work (Parsons, 2005a and b). Full arm gloves should be used to reach down into the box corer and cap the bottom of the tubes. A face shield should also be considered based on how close to the sample the employee needs to be to reach down and cap the bottom of the tube.
1. Select a box corer (or equivalent) (hereafter called sampler or box corer) suitable for the bottom conditions expected and volume/mass of sample needed for laboratory analyses.
2. Securely attach the sampler to a winch with cable or line of sufficient strength to accommodate the weight of the sampler and sample.
3. Set the mechanism on the sampler so the jaws are held in the open position. 4. Slowly lower the sampler using a winch and A-frame or boom arm through a moon
pool or over the side of the vessel. Maintain tension on the sampler to keep the jaw mechanism from prematurely closing.
5. After the sampler contacts the sediments on the bottom, relax the tension on the sampler to allow the jaw locking mechanism to release.
6. Place tension on the cable/line and slowly lift. This should cause the sampler jaws to close trapping the sample inside.
7. Slowly retrieve the sampler. 8. Discard the sample if the jaws of the box corer have not sealed completely or there is
any sign of sample washout. 9. Set the box corer into a bracket on the boat deck to hold the corer in a stable vertical
position.
REVISED
PARSONS P:\Honeywell -SYR\443583 - SMU 8\09 Reports\Phase III PDI MNR Addendum\Biox Corer and process procedures.doc
November 20, 2007 page A2 of 4
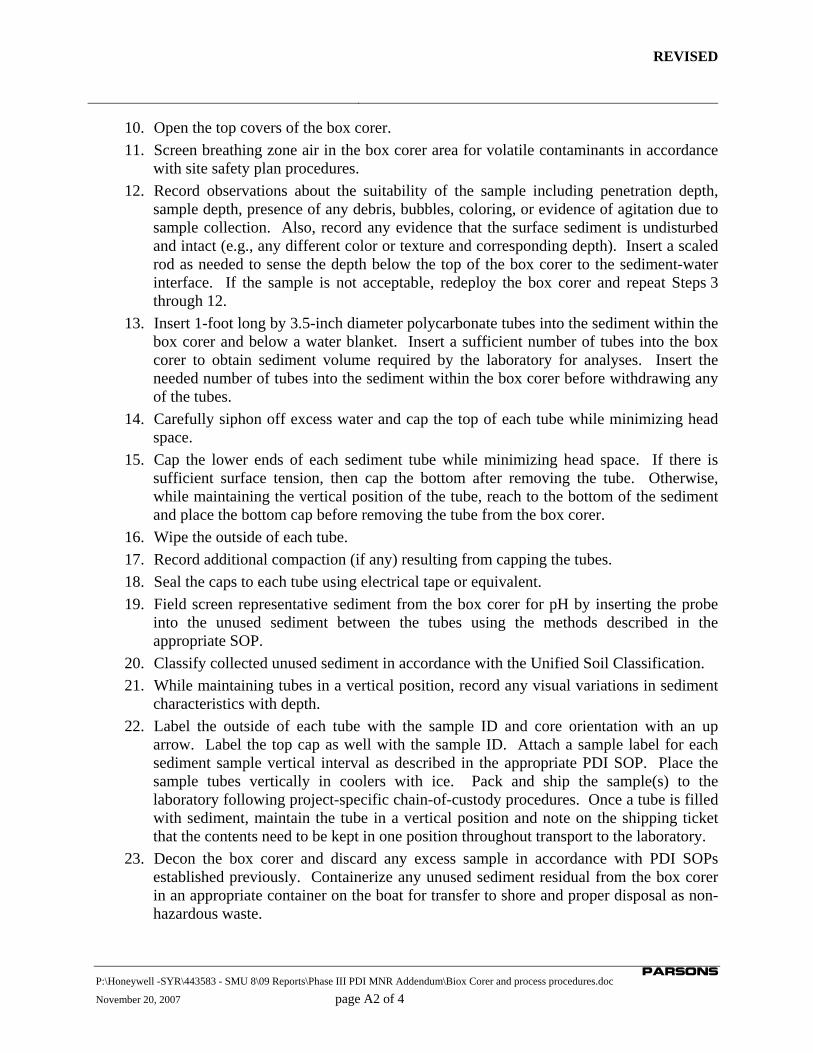
10. Open the top covers of the box corer. 11. Screen breathing zone air in the box corer area for volatile contaminants in accordance
with site safety plan procedures. 12. Record observations about the suitability of the sample including penetration depth,
sample depth, presence of any debris, bubbles, coloring, or evidence of agitation due to sample collection. Also, record any evidence that the surface sediment is undisturbed and intact (e.g., any different color or texture and corresponding depth). Insert a scaled rod as needed to sense the depth below the top of the box corer to the sediment-water interface. If the sample is not acceptable, redeploy the box corer and repeat Steps 3 through 12.
13. Insert 1-foot long by 3.5-inch diameter polycarbonate tubes into the sediment within the box corer and below a water blanket. Insert a sufficient number of tubes into the box corer to obtain sediment volume required by the laboratory for analyses. Insert the needed number of tubes into the sediment within the box corer before withdrawing any of the tubes.
14. Carefully siphon off excess water and cap the top of each tube while minimizing head space.
15. Cap the lower ends of each sediment tube while minimizing head space. If there is sufficient surface tension, then cap the bottom after removing the tube. Otherwise, while maintaining the vertical position of the tube, reach to the bottom of the sediment and place the bottom cap before removing the tube from the box corer.
16. Wipe the outside of each tube. 17. Record additional compaction (if any) resulting from capping the tubes. 18. Seal the caps to each tube using electrical tape or equivalent. 19. Field screen representative sediment from the box corer for pH by inserting the probe
into the unused sediment between the tubes using the methods described in the appropriate SOP.
20. Classify collected unused sediment in accordance with the Unified Soil Classification. 21. While maintaining tubes in a vertical position, record any visual variations in sediment
characteristics with depth. 22. Label the outside of each tube with the sample ID and core orientation with an up
arrow. Label the top cap as well with the sample ID. Attach a sample label for each sediment sample vertical interval as described in the appropriate PDI SOP. Place the sample tubes vertically in coolers with ice. Pack and ship the sample(s) to the laboratory following project-specific chain-of-custody procedures. Once a tube is filled with sediment, maintain the tube in a vertical position and note on the shipping ticket that the contents need to be kept in one position throughout transport to the laboratory.
23. Decon the box corer and discard any excess sample in accordance with PDI SOPs established previously. Containerize any unused sediment residual from the box corer in an appropriate container on the boat for transfer to shore and proper disposal as non-hazardous waste.
REVISED
PARSONS P:\Honeywell -SYR\443583 - SMU 8\09 Reports\Phase III PDI MNR Addendum\Biox Corer and process procedures.doc
November 20, 2007 page A3 of 4
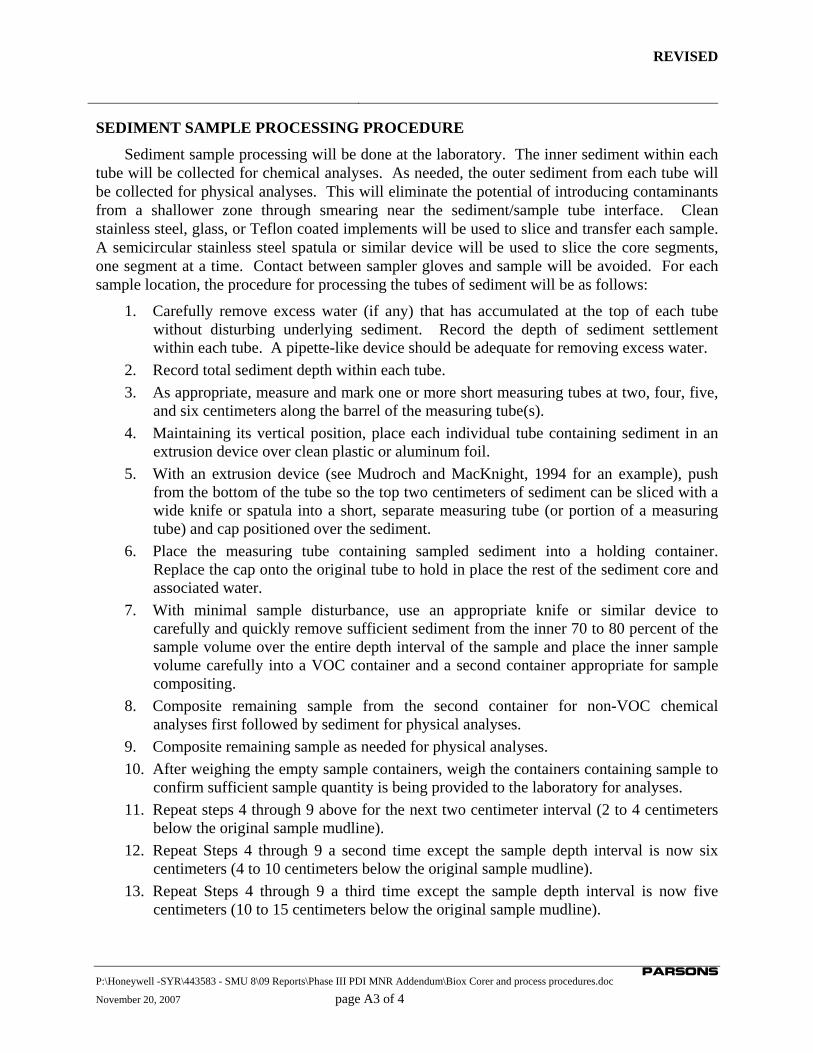
SEDIMENT SAMPLE PROCESSING PROCEDURE
Sediment sample processing will be done at the laboratory. The inner sediment within each tube will be collected for chemical analyses. As needed, the outer sediment from each tube will be collected for physical analyses. This will eliminate the potential of introducing contaminants from a shallower zone through smearing near the sediment/sample tube interface. Clean stainless steel, glass, or Teflon coated implements will be used to slice and transfer each sample. A semicircular stainless steel spatula or similar device will be used to slice the core segments, one segment at a time. Contact between sampler gloves and sample will be avoided. For each sample location, the procedure for processing the tubes of sediment will be as follows:
1. Carefully remove excess water (if any) that has accumulated at the top of each tube without disturbing underlying sediment. Record the depth of sediment settlement within each tube. A pipette-like device should be adequate for removing excess water.
2. Record total sediment depth within each tube. 3. As appropriate, measure and mark one or more short measuring tubes at two, four, five,
and six centimeters along the barrel of the measuring tube(s). 4. Maintaining its vertical position, place each individual tube containing sediment in an
extrusion device over clean plastic or aluminum foil. 5. With an extrusion device (see Mudroch and MacKnight, 1994 for an example), push
from the bottom of the tube so the top two centimeters of sediment can be sliced with a wide knife or spatula into a short, separate measuring tube (or portion of a measuring tube) and cap positioned over the sediment.
6. Place the measuring tube containing sampled sediment into a holding container. Replace the cap onto the original tube to hold in place the rest of the sediment core and associated water.
7. With minimal sample disturbance, use an appropriate knife or similar device to carefully and quickly remove sufficient sediment from the inner 70 to 80 percent of the sample volume over the entire depth interval of the sample and place the inner sample volume carefully into a VOC container and a second container appropriate for sample compositing.
8. Composite remaining sample from the second container for non-VOC chemical analyses first followed by sediment for physical analyses.
9. Composite remaining sample as needed for physical analyses. 10. After weighing the empty sample containers, weigh the containers containing sample to
confirm sufficient sample quantity is being provided to the laboratory for analyses. 11. Repeat steps 4 through 9 above for the next two centimeter interval (2 to 4 centimeters
below the original sample mudline). 12. Repeat Steps 4 through 9 a second time except the sample depth interval is now six
centimeters (4 to 10 centimeters below the original sample mudline). 13. Repeat Steps 4 through 9 a third time except the sample depth interval is now five
centimeters (10 to 15 centimeters below the original sample mudline).
REVISED
PARSONS P:\Honeywell -SYR\443583 - SMU 8\09 Reports\Phase III PDI MNR Addendum\Biox Corer and process procedures.doc
November 20, 2007 page A4 of 4
Once each container is full and ready for analysis, apply a label (if not pre-applied), and refrigerate as soon as practical.
This process will be continued until all sample intervals have been collected. Any unused sediment will be properly managed in accordance with the appropriate laboratory SOP.
ADDITIONAL REFERENCE
Mudroch, A. and S.D. MacKnight (editors), 1994. Handbook of Techniques for Aquatic Sediments Sampling. Lewis Publishers (CRC Press). Second edition.