Online Video & the Media Industryrecursos.anuncios.com/files/406/62.pdf · seems to suggest that...
13
Online Video & the Media Industry QUARTERLY RESEARCH REPORT, Q4 2010
Transcript of Online Video & the Media Industryrecursos.anuncios.com/files/406/62.pdf · seems to suggest that...

Online Video &the Media IndustryQUARTERLY RESEARCH REPORT, Q4 2010
2©2011 Brightcove, Inc. and TubeMogul, Inc. All Rights Reserved.
Table of ContentsOnline Video & the Media Industry 3
Background 3
Methodology 3
Key Findings 3
Platform Usage 4
Total Minutes Streamed 5
Video Uploads 6
Player Loads 7
Engagement and Discovery 8
Video Engagement 8
Discovery and Engagement 10
Geographic Distribution 12
Contacts 13

3©2011 Brightcove, Inc. and TubeMogul, Inc. All Rights Reserved.
BackgroundBrightcove is an on-demand software platform that media companies and marketers
use to publish and distribute video on the Web, mobile devices, and Internet-
connected TVs. Brightcove has over 2500 customers in 50 countries with video
viewed across more than 60,000 websites, including many of the most popular news
and entertainment destinations on the Web.
TubeMogul is an online video analytics and advertising platform that processes
billions of video streams every month from the Internet’s top publishers and
advertisers. More than 200,000 users rely on TubeMogul’s analytics, and hundreds of
marketing agencies and brand advertisers are among the company’s clients.
Brightcove and TubeMogul have teamed up to develop an online video index and
quarterly research report, which will help identify key industry trends and answer
questions about the state of the industry.
MethodologyThe data used for the analysis included in this report was taken from an anonymous,
cross-section sample of Brightcove customers representing media industry segments
and brands. While the sample aggregates a sizable data set, it is not intended to be
statistically representative of the online video industry as a whole, or of Brightcove’s
entire customer base. Instead, the data analysis is intended to provide a directional
snapshot of media trends and inform additional research initiatives focused on the
online video industry. Any findings, opinions, or conclusions expressed here are those
of the authors(s) and are based solely on the aggregated data sample.
This research report draws on a number of data sources:
• Platform data from an anonymous and random sample of Brightcove media
customers; and
• Consumer engagement reports based on TubeMogul’s online video analytics from
this aggregate data set.
Key FindingsThis report presents year in review data, as well as specific patterns from Q4 2010.
Platform Usage
• Broadcasters led in total minutes streamed in 2010. Broadcasters also regained their
top position in total minutes streamed, beating out newspapers, who peaked last
quarter.
• Newspapers saw huge growth (147% quarter over quarter) in number of titles
uploaded for the second quarter in a row, which suggest that news organizations
continue to embrace video to present multimedia news stories.

4©2011 Brightcove, Inc. and TubeMogul, Inc. All Rights Reserved.
• Newspapers also had the highest number of player loads across all categories for
the year, suggesting that newspapers have video players across more pages and
have more total page views than other media categories.
Engagement
• Engagement rates trended upward quarter over quarter across all media categories.
Audiences watched longer on average than in previous months, which is a good
indication of the increasing consumer adoption and comfort with watching online
video.
• Brands saw a massive 98% jump in engagement this quarter, reaching 2:03 minutes
on average compared to 1:03 minutes watched the prior quarter. This suggests that
brands are improving the quality of their content and connecting with receptive
audiences.
• Completion rates trended upward across the board, which is not surprising given
that minutes viewed also trended upwards.
• As a referral source, Facebook and Twitter accounted for the highest engagement
rates across all media categories. Brands saw highest video engagement when
referred by Yahoo!, which may point to the success of syndication efforts of such
content.
• Broadcast content viewers from the United States had the highest minutes watched
per view (3:53) with European viewers close behind (3:34).
Platform UsageThe following analysis is based on aggregated Brightcove platform data from an
anonymous sample of more than 200 media companies representing media industry
verticals, including broadcast networks, magazine publishers, newspaper publishers,
and pure-play Web media properties.
Total Minutes Streamed
Broadcasters lead in total minutes streamed in 2010 with 1.7 billion total minutes
streamed. This is unsurprising, given that the media vertical tends to have longer
form content and is most familiar (relative to other media categories) with video
production as a medium.
The newspaper category overtook broadcasters in minutes streamed in Q3, but the
broadcast category regained its top position in Q4. Video coverage of the World Cup,
fall elections, Pakistani floods, and trapped Chilean miners combined to overpower
the broadcast industry during summer reruns, but the broadcasters came roaring

5©2011 Brightcove, Inc. and TubeMogul, Inc. All Rights Reserved.
back with popular new shows for the fall season.
Video Uploads
Continuing a trend from Q3, Q4 saw a massive increase in titles uploaded for
newspapers, with quarter over quarter growth of 147%. With 1.2 million titles uploaded
in the quarter, newspapers uploaded more than four times as many titles as the
next highest category, which was online media. This dramatic increase for a second
consecutive quarter suggests that newspapers have fully embraced video production
and licensing to offer multimedia news coverage to audiences. We have heard
from many newspaper customers that they are having great success selling pre-roll
6©2011 Brightcove, Inc. and TubeMogul, Inc. All Rights Reserved.
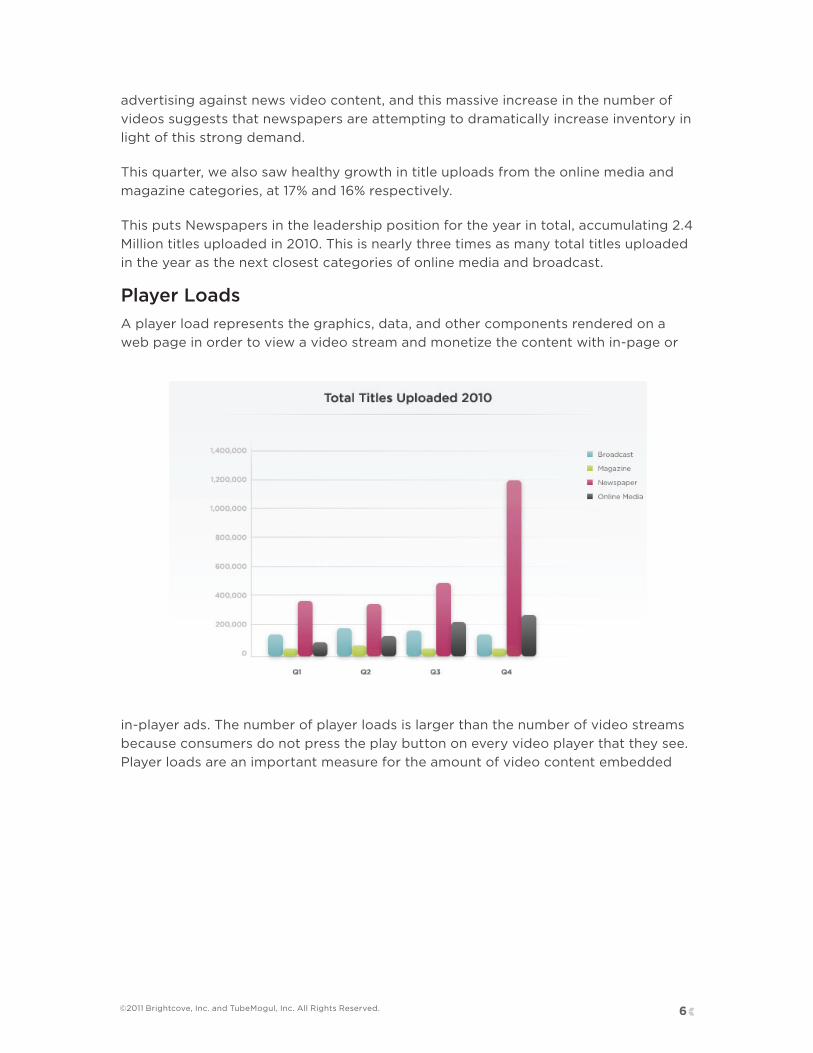
advertising against news video content, and this massive increase in the number of
videos suggests that newspapers are attempting to dramatically increase inventory in
light of this strong demand.
This quarter, we also saw healthy growth in title uploads from the online media and
magazine categories, at 17% and 16% respectively.
This puts Newspapers in the leadership position for the year in total, accumulating 2.4
Million titles uploaded in 2010. This is nearly three times as many total titles uploaded
in the year as the next closest categories of online media and broadcast.
Player Loads
A player load represents the graphics, data, and other components rendered on a
web page in order to view a video stream and monetize the content with in-page or
in-player ads. The number of player loads is larger than the number of video streams
because consumers do not press the play button on every video player that they see.
Player loads are an important measure for the amount of video content embedded

7©2011 Brightcove, Inc. and TubeMogul, Inc. All Rights Reserved.
across Web properties, and can be viewed as a leading indicator of future video views
as the total video player surface area increases.
Newspapers consistently led the categories in player loads over the last year. This is
largely because they tend to have a relatively large number of total page views and
increasingly embed video players in news articles, and therefore have a high number
of pages initiating a player load.
Engagement and DiscoveryThe following section analyzes viewer behavior for a cross-section of media
companies (broadcasters, magazines, newspapers, online media properties, and
brands).
8©2011 Brightcove, Inc. and TubeMogul, Inc. All Rights Reserved.
Video Engagement
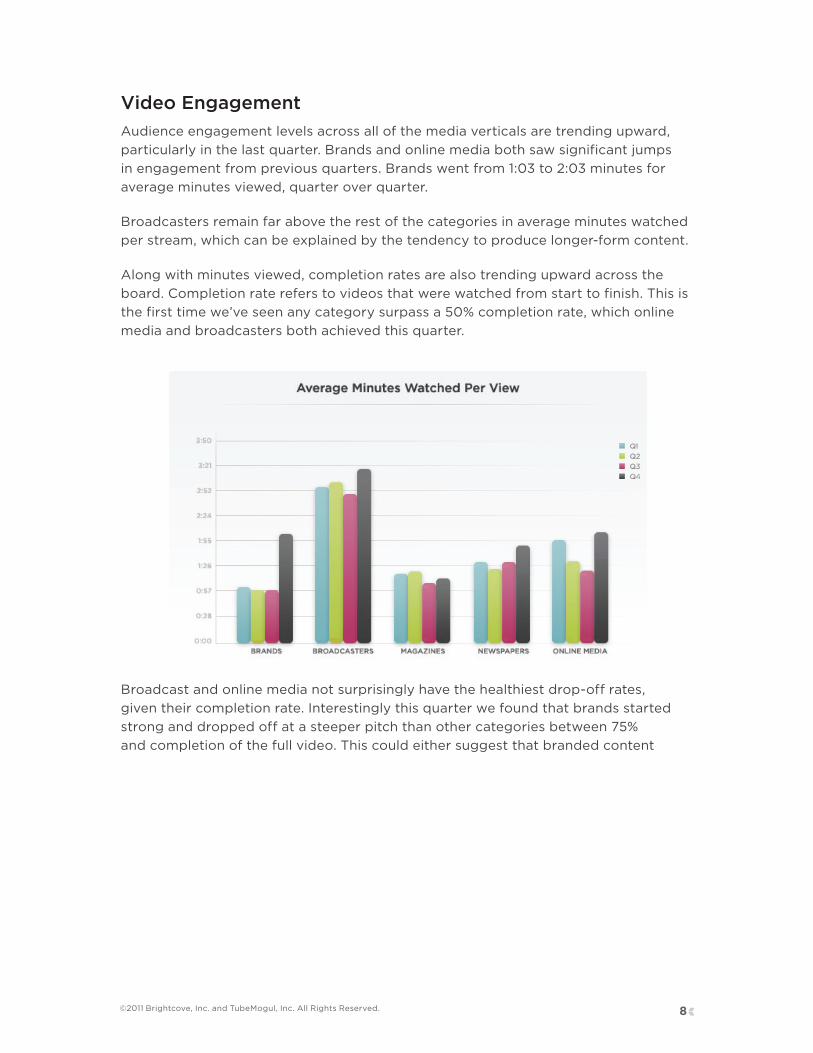
Audience engagement levels across all of the media verticals are trending upward,
particularly in the last quarter. Brands and online media both saw significant jumps
in engagement from previous quarters. Brands went from 1:03 to 2:03 minutes for
average minutes viewed, quarter over quarter.
Broadcasters remain far above the rest of the categories in average minutes watched
per stream, which can be explained by the tendency to produce longer-form content.
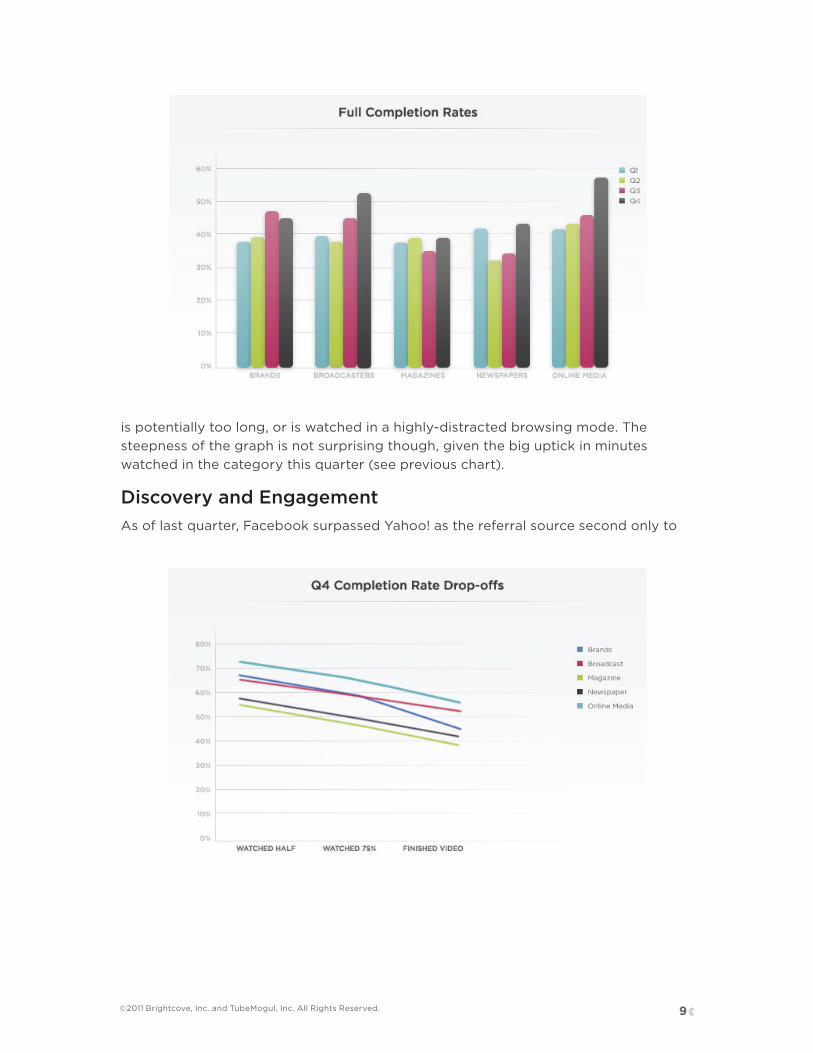
Along with minutes viewed, completion rates are also trending upward across the
board. Completion rate refers to videos that were watched from start to finish. This is
the first time we’ve seen any category surpass a 50% completion rate, which online
media and broadcasters both achieved this quarter.
Broadcast and online media not surprisingly have the healthiest drop-off rates,
given their completion rate. Interestingly this quarter we found that brands started
strong and dropped off at a steeper pitch than other categories between 75%
and completion of the full video. This could either suggest that branded content
9©2011 Brightcove, Inc. and TubeMogul, Inc. All Rights Reserved.
is potentially too long, or is watched in a highly-distracted browsing mode. The
steepness of the graph is not surprising though, given the big uptick in minutes
watched in the category this quarter (see previous chart).
Discovery and Engagement
As of last quarter, Facebook surpassed Yahoo! as the referral source second only to
10©2011 Brightcove, Inc. and TubeMogul, Inc. All Rights Reserved.
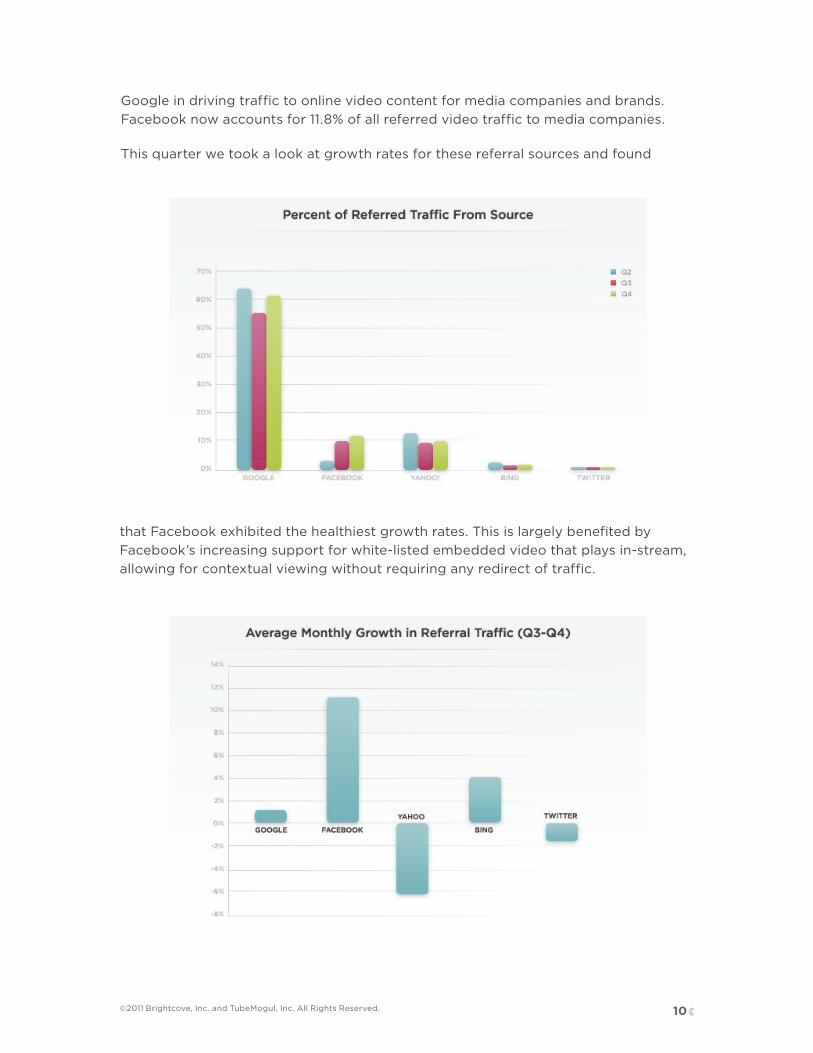
Google in driving traffic to online video content for media companies and brands.
Facebook now accounts for 11.8% of all referred video traffic to media companies.
This quarter we took a look at growth rates for these referral sources and found
that Facebook exhibited the healthiest growth rates. This is largely benefited by
Facebook’s increasing support for white-listed embedded video that plays in-stream,
allowing for contextual viewing without requiring any redirect of traffic.

11©2011 Brightcove, Inc. and TubeMogul, Inc. All Rights Reserved.
Overall, Facebook and Twitter elicited higher engagement rates on aggregate as
referring sites measured by minutes viewed. Interestingly, brands exhibited significantly
higher engagement rates across all referring sources than other content, which
seems to suggest that both video discovered with SEO and through social sharing
are resulting in increased engagement for brand viewers. Brands also saw highest
engagement rates through Yahoo!, reaching 2:30 minutes viewed. This could suggest
that syndicated content strategies might boost the engagement rates for that content.
12©2011 Brightcove, Inc. and TubeMogul, Inc. All Rights Reserved.
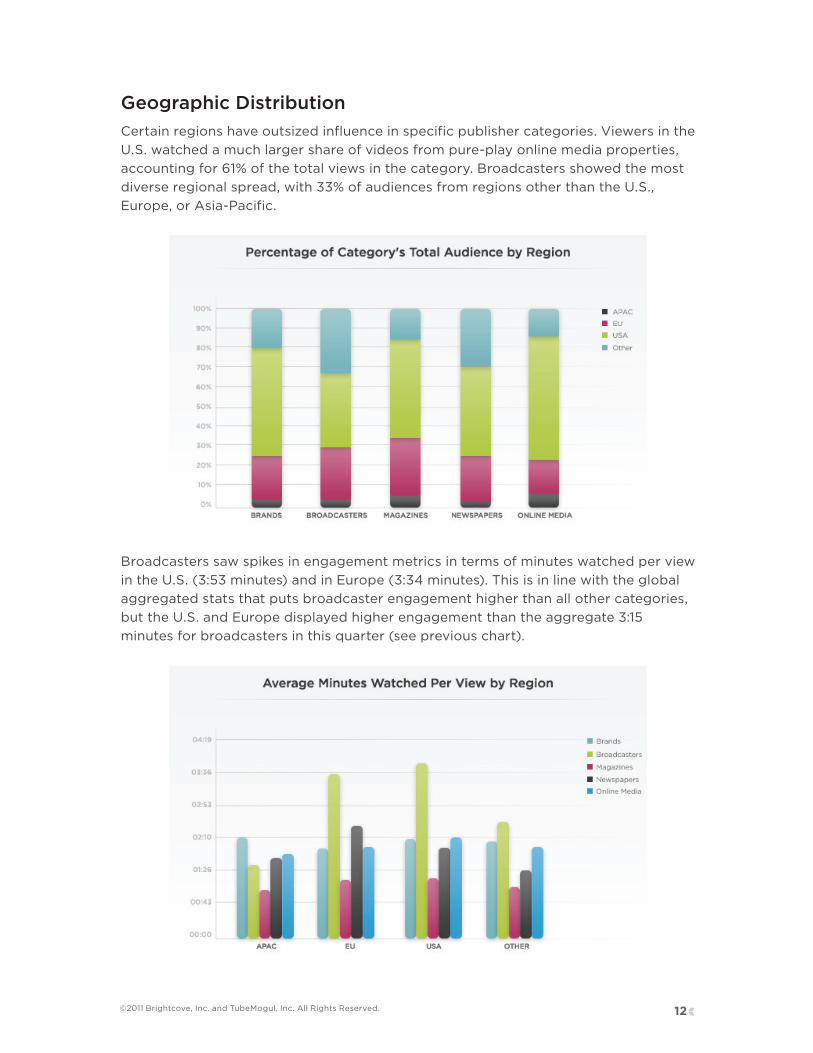
Geographic Distribution
Certain regions have outsized influence in specific publisher categories. Viewers in the
U.S. watched a much larger share of videos from pure-play online media properties,
accounting for 61% of the total views in the category. Broadcasters showed the most
diverse regional spread, with 33% of audiences from regions other than the U.S.,
Europe, or Asia-Pacific.
Broadcasters saw spikes in engagement metrics in terms of minutes watched per view
in the U.S. (3:53 minutes) and in Europe (3:34 minutes). This is in line with the global
aggregated stats that puts broadcaster engagement higher than all other categories,
but the U.S. and Europe displayed higher engagement than the aggregate 3:15
minutes for broadcasters in this quarter (see previous chart).

13©2011 Brightcove, Inc. and TubeMogul, Inc. All Rights Reserved.
Contacts
Sara Watson
Inbound Marketing Content Manager
Brightcove, Inc.
Phone: 617-245-6079
Email: [email protected]
David Burch
Communications Director
TubeMogul, Inc.
Phone: 510-653-0501
Email: [email protected]