Online NIR-Spectroscopy for theLive Monitoring of … · Jérôme Kaeslin, Emanuel Billeter ,...
29
| | 20.12.2016 1 Online NIR-Spectroscopy for the Live Monitoring of Hydrocarbon Index (HI) in Contaminated Soil Material Jérôme Kaeslin, Emanuel Billeter, Manuel Kober-Czerny
Transcript of Online NIR-Spectroscopy for theLive Monitoring of … · Jérôme Kaeslin, Emanuel Billeter ,...
|| 20.12.2016 1
Online NIR-Spectroscopy for the Live Monitoring ofHydrocarbon Index (HI) in Contaminated Soil Material
Jérôme Kaeslin, Emanuel Billeter, Manuel Kober-Czerny

||
§ It is a cumulative parameter§ no absolute method
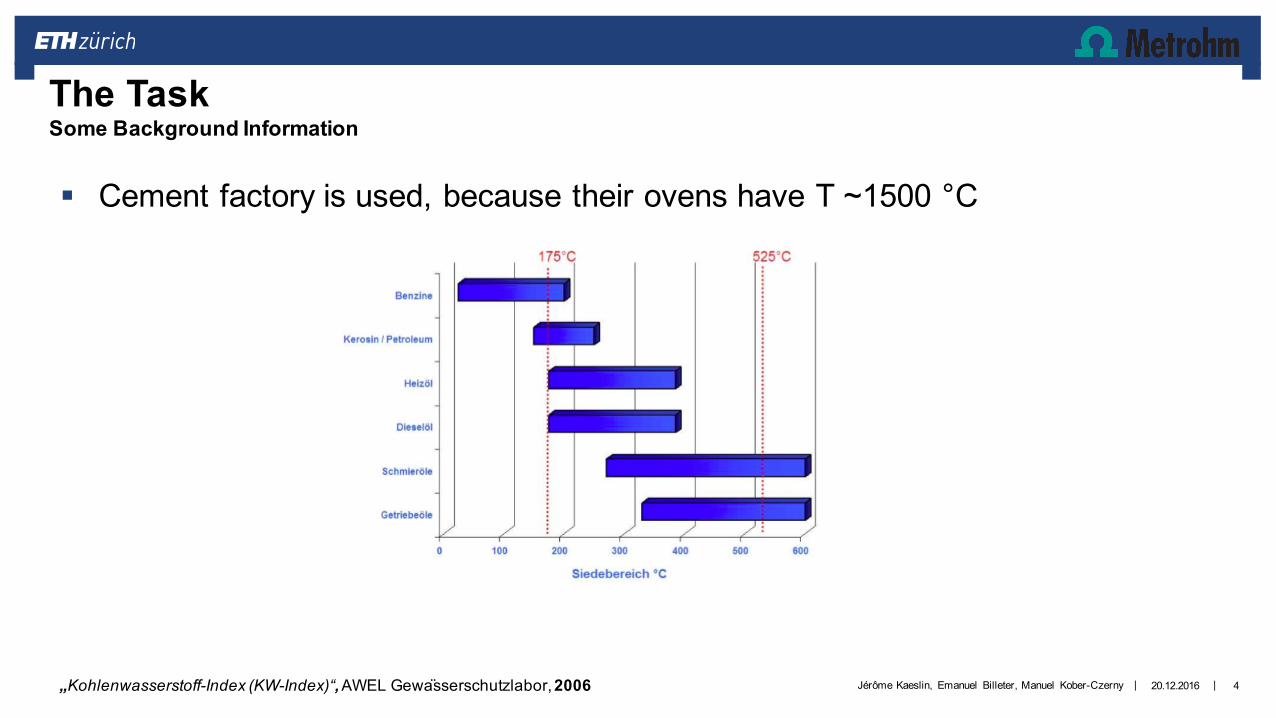
§ Includes all hydrocarbons between C10H22 and C40H82 that...§ boil between 175 and 525 °C§ do are not absorbed by magnesium silicate (non-polar)
2
The Hydrocarbon Index (HI)Definition
20.12.2016Jérôme Kaeslin, Emanuel Billeter, Manuel Kober-Czerny
||
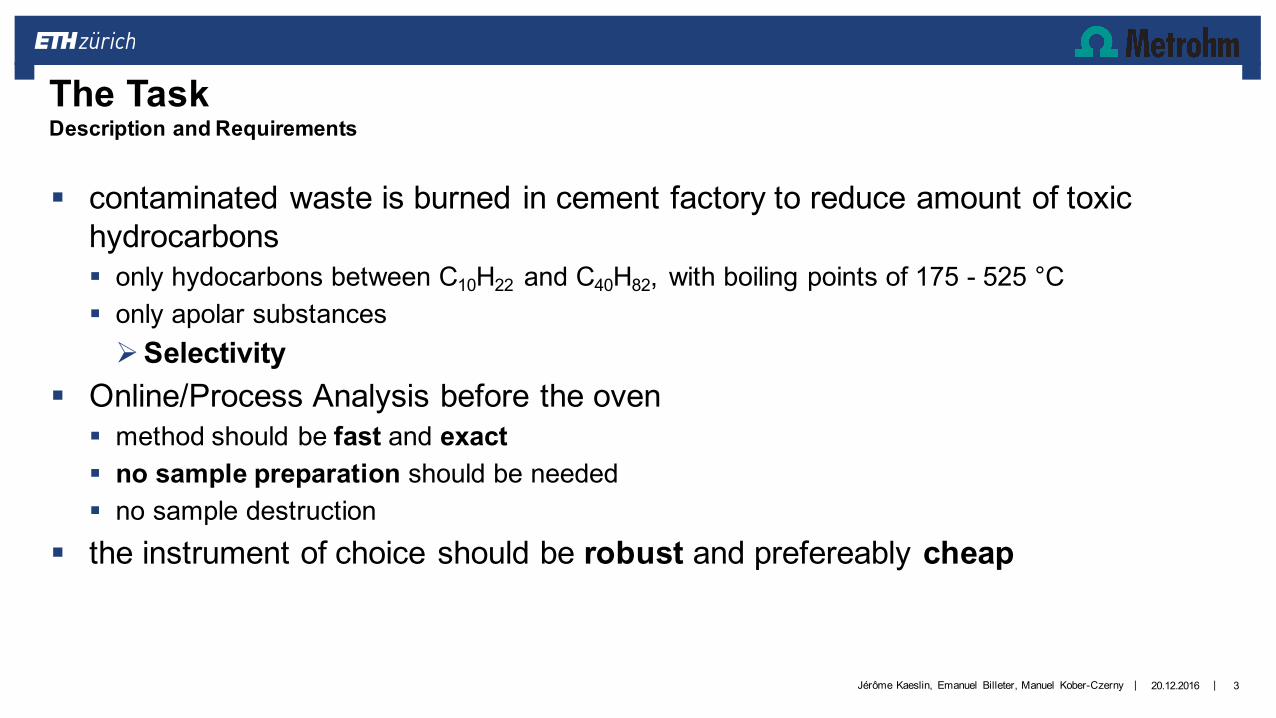
§ contaminated waste is burned in cement factory to reduce amount of toxichydrocarbons§ only hydocarbons between C10H22 and C40H82, with boiling points of 175 - 525 °C§ only apolar substancesØSelectivity
§ Online/Process Analysis before the oven§ method should be fast and exact§ no sample preparation should be needed§ no sample destruction
§ the instrument of choice should be robust and prefereably cheap
3
The TaskDescription and Requirements
20.12.2016Jérôme Kaeslin, Emanuel Billeter, Manuel Kober-Czerny
||
§ Cement factory is used, because their ovens have T ~1500 °C
4
The TaskSome Background Information
20.12.2016„Kohlenwasserstoff-Index (KW-Index)“, AWEL Gewasserschutzlabor, 2006 Jérôme Kaeslin, Emanuel Billeter, Manuel Kober-Czerny

|| 5
The Old MethodsFID/GC
20.12.2016
> Altlasten / Abfall> Umwelt-Vollzug2013
> Analysenmethoden im Abfall- und Altlastenbereich
Stand 2013
Jérôme Kaeslin, Emanuel Billeter, Manuel Kober-Czerny

||
§ extraction of grinded/powdered sample§ with hexane/acetone and water
§ filtration over Florisil (magnesium silicate)§ LOQ = 20 mg/kg (20 ppm)§ Area between n-Decan and n-Tetracontan used
used for HI-calculation§ Calibration beforehand with standards/spikes
6
The Old MethodsFID/GC
20.12.2016Jérôme Kaeslin, Emanuel Billeter, Manuel Kober-Czerny

|| 7
The Old MethodsFID/GC
20.12.2016
Requirement GCSelectivity for C10-C40 ✔
exclude polar substances ✔
online/process Analysis ❌
robust ❌
fast measurement ❌
Jérôme Kaeslin, Emanuel Billeter, Manuel Kober-Czerny

|| 8
Near Infrared SpectroscopyAn Overview
20.12.2016Jérôme Kaeslin, Emanuel Billeter, Manuel Kober-Czerny
§ range: 12800 – 4000 cm-1 (780 – 2500 nm)§ shows Overtone & Combination Bands -> lower intensities
§ CH, OH, NH functionalities
Burns, D.A.; Ciurczak, E.W., “Handbook ofNear-Infrared Analysis“, CRC Press,Third Edition. 2007, p. 7-19

|| 9
Near Infrared SpectroscopyAn Overview
20.12.2016Jérôme Kaeslin, Emanuel Billeter, Manuel Kober-Czerny
Band Range Wavelength (C-H)[nm]
Relative Intensity[%]
Fundamental Mid-IR 3380-3510 100
1st overtone Mid-IR or NIR 1690-1755 1
2nd overtone NIR 1127-1170 0.1
3rd overtone NIR 845-878 0.01
4th overtone NIR 690-770 0.005
Schwanninger, M.; Rodrigues, M.; Fackler, M.; J. Near Infrared Spectrosc. 2011, 19, p. 287–308Workman, J.; Weyer, L.; „Practical Guide and Spectral“, CRC Press, Second Edition, 2012, p. 8
§ Intensities much lower§ Changes in concentration harder to detect§ LOD = 0.1–0.5%

||
§ „fingerprint“§ signature of the physical state of order observable
§ no sample preparation needed§ penetration depth up to a few cm§ less scattering than in UV-Vis
10
Near Infrared SpectroscopyImportant Features
20.12.2016
Burns, D.A.; Ciurczak, E.W., “Handbook ofNear-Infrared Analysis“, CRC Press,Third Edition. 2007, p. 7-19
Jérôme Kaeslin, Emanuel Billeter, Manuel Kober-Czerny

|| 11
Near Infrared SpectroscopyThe Spectrum
20.12.2016Jérôme Kaeslin, Emanuel Billeter, Manuel Kober-Czerny
Vis NIR
1st C-Hcombination
2200-2450 nm
1st C-Hovertone
1650-1800 nm
2nd C-Hcomb.
1300-1420 nm
2nd C-Hover.
1100-1225 nm
3rdC-Hover.
850-950 nm
Monograph – NIR Spectroscopy; Metrohm

|| 12
Near Infrared SpectroscopyThe Spectrum
20.12.2016Jérôme Kaeslin, Emanuel Billeter, Manuel Kober-CzernyMonograph – NIR Spectroscopy; Metrohm

|| 13
Near Infrared SpectroscopyThe Spectrum
20.12.2016Jérôme Kaeslin, Emanuel Billeter, Manuel Kober-CzernyWorkman, J.; Weyer, L.; „Practical Guide and Spectral“, CRC Press, Second Edition, 2012, p. 208

|| 14
Near Infrared SpectroscopyThe Spectrum
20.12.2016Jérôme Kaeslin, Emanuel Billeter, Manuel Kober-Czerny
§ The spectrum is influenced by§ particle size§ porosity and surface§ refractive index§ packing density§ temperature§ water content

|| 15
Near Infrared SpectroscopyMeasurement Techniques
20.12.2016Jérôme Kaeslin, Emanuel Billeter, Manuel Kober-Czerny
Burns, D.A.; Ciurczak, E.W., “Handbook ofNear-Infrared Analysis“, CRC Press,Third Edition. 2007, p. 71Wetzel, D.L.; Analytical Chemistry, 1983, 55(12), p. 1166
NIR scheme

|| 16
Factors that Influence NIR SpectraWater
20.12.2016Jérôme Kaeslin, Emanuel Billeter, Manuel Kober-Czerny
NaOH in water (0-50 %)top: pure waterbottom: 50 %-solution
§ wavelength shift due to water (also H-bonds)§ peak shape varies with water content
§ broadness increases with water content§ baseline shift due to water content
§ absorption increases with water contentWorkman, J.; Weyer, L.; „Practical Guide and Spectral“, CRC Press, Second Edition, 2012, p. 56ffBurns, D.A.; Ciurczak, E.W., “Handbook ofNear-Infrared Analysis“, CRC Press,Third Edition. 2007, p. 334

|| 17
Factors that Influence NIR SpectraParticle Size
20.12.2016Jérôme Kaeslin, Emanuel Billeter, Manuel Kober-Czerny
cellulose samplesa: 24 µmb: 45.8 µmc: 93.4 µmd: 261 µme: 406 µm
Monograph – NIR Spectroscopy; Metrohm
§ baseline shifts with particle size§ larger particles absorb more radiation

|| 18
Interesting Example
20.12.2016Jérôme Kaeslin, Emanuel Billeter, Manuel Kober-Czerny
egg samples1: 20 min2: 40 min3: 60 min4: 120 min5: 240 min eggs measured directly
after certain times after laying
Norris, K.H.; J. Near Infrared Spectrosc., 1996, 4, p. 31-37

||
§ The calibration is the most important part for quantitative analysis§ take several hundred samples (inhomogeneous)
§ cover large concentration region§ grind and dry samples§ spike samples with oil of known concentration§ measure and assign bands of importance§ use data to get a calibration curve
§ cross-check HI with GC method
19
Feasability StudyExperimental Part
20.12.2016Jérôme Kaeslin, Emanuel Billeter, Manuel Kober-Czerny
Data evaluation and calibration works by pattern recognitioninstead of single peak observation.

|| 20
Statistical TechniquesPrinciple Component Analysis
20.12.2016Jérôme Kaeslin, Emanuel Billeter, Manuel Kober-Czerny
§ Linear data transformation§ Goals:
§ Information about relevance (variance)§ Independent from each other (orthogonal)
1. Centering & Scaling2. Matrix transformation 𝑋 = 𝑡$𝑝$& + 𝑡(𝑝(& +⋯
So that all tx are orthogonal and each t describes the maximum variance3. The Eigenvalue of px describes the fraction of the total variance4. Selection of relevant Eigenvalues & plotting in the corresponding
dimensions (tx)Norgaard, L.; Rasmus, B.; Engelsen, S.B.; Principal Component Analysis and Near Infrared Spectroscopy, paper from FOSS A/S Analytical.

|| 21
NIR of glucose/fructose/sucrose mixture
20.12.2016Jérôme Kaeslin, Emanuel Billeter, Manuel Kober-Czerny
Norgaard, L.; Rasmus, B.; Engelsen, S.B.; Principal Component Analysis and Near Infrared Spectroscopy, paper from FOSS A/S Analytical.

|| 2220.12.2016Jérôme Kaeslin, Emanuel Billeter, Manuel Kober-Czerny
Statistical TechniquesPrinciple Component Analysis
Norgaard, L.; Rasmus, B.; Engelsen, S.B.; Principal Component Analysis and Near Infrared Spectroscopy, paper from FOSS A/S Analytical.

|| 2320.12.2016Jérôme Kaeslin, Emanuel Billeter, Manuel Kober-Czerny
Statistical TechniquesPrinciple Component Analysis
Norgaard, L.; Rasmus, B.; Engelsen, S.B.; Principal Component Analysis and Near Infrared Spectroscopy, paper from FOSS A/S Analytical.

|| 2420.12.2016Jérôme Kaeslin, Emanuel Billeter, Manuel Kober-Czerny
Statistical TechniquesUnivariate Linear Regression

|| 2520.12.2016Jérôme Kaeslin, Emanuel Billeter, Manuel Kober-Czerny
Statistical TechniquesMultiple Linear Regression (MLR)
Burns, D.A.; Ciurczak, E.W., “Handbook ofNear-Infrared Analysis“, CRC Press,Third Edition.Boca Raton, 2008.

|| 2620.12.2016Jérôme Kaeslin, Emanuel Billeter, Manuel Kober-Czerny
Statistical TechniquesPartial Least Squares (PLS)
Burns, D.A.; Ciurczak, E.W., “Handbook ofNear-Infrared Analysis“, CRC Press, Third Edition.Boca Raton, 2008.Lindon, J.C.; „Encyclopedia ofSpectroscopy and Spectrometry“, Elsevier Academic Press, 2. Edition, 2010.Mark, H.; Workman, J.; „Chemometrics in spectroscopy“,Academic Press, London, 2007.

|| 2720.12.2016Jérôme Kaeslin, Emanuel Billeter, Manuel Kober-Czerny
Statistical TechniquesComparison MLR - PLS
MLR PLSProper choice of absorbances at different wavelengths is required. Not too many should be considered. In particular no collinear absorbances.
Visual results (loadings) might help for theinterpretation. However physical meaning of thenew coordinates are hard (if not impossible) tointerpret, since they are linear combinations ofthe initial coordinates.
Struggles with multicollinearity i.e. strong correlations between absorbances at different wavelengths.
Can deal with multicollinearity.
Model requires more observations than predictorvariables (absorbances).
Burns, D.A.; Ciurczak, E.W., “Handbook ofNear-Infrared Analysis“, CRC Press, Third Edition.Boca Raton, 2008.Lindon, J.C.; „Encyclopedia ofSpectroscopy and Spectrometry“, Elsevier Academic Press, 2. Edition, 2010.Mark, H.; Workman, J.; „Chemometrics in spectroscopy“,Academic Press, London, 2007.

|| 28
Alternative Methods
20.12.2016Jérôme Kaeslin, Emanuel Billeter, Manuel Kober-Czerny
Requirement NIR IR Raman GCSelectivity for C10-C40 ✔ ✔ ✔ ✔
exclude polar substances ✔ ✔ ✔ ✔
online/process Analysis ✔ (❌ ) ✔ ❌
robust ✔ ✔ ✔ ❌
fast measurement ✔ ✔ ✔ ❌
no sample preparation ✔ (❌ ) ✔ ❌
limitations/problems no structureelucidation
water interference broad fluorescentbaseline
time-consuming
saturation ofdetector

|| 2920.12.2016
Thank youfor your attention